Attached files
| file | filename |
|---|---|
| EX-99.1 - EX-99.1 - EARTHSTONE ENERGY INC | ex991-acqannouncepressrele.htm |
| EX-10.1 - EX-10.1 - EARTHSTONE ENERGY INC | ex1012ndamenddateddec172020.htm |
| EX-2.1 - EX-2.1 - EARTHSTONE ENERGY INC | ex21psadateddec172020.htm |
| 8-K - 8-K - EARTHSTONE ENERGY INC | este-20201217.htm |

1 Independence Resources Acquisition December 17, 2020 Exhibit 99.2

2 Disclaimer Forward-Looking Statements This presentation contains forward-looking statements within the meaning of Section 27A of the Securities Act of 1933, as amended (the “Securities Act”), and Section 21E of the Securities Exchange Act of 1934, as amended (the “Exchange Act”). Statements that are not strictly historical statements constitute forward-looking statements and may often, but not always, be identified by the use of such words such as “expects,” “believes,” “intends,” “anticipates,” “plans,” “estimates,” “guidance,” “target,” “potential,” “possible,” or “probable” or statements that certain actions, events or results “may,” “will,” “should,” or “could” be taken, occur or be achieved. The forward-looking statements include statements about the expected benefits of the proposed acquisition (the “Transaction”) of Independence Resources Management, LLC (“IRM”) to Earthstone Energy, Inc. (“Earthstone” or the “Company”) and its stockholders, the anticipated completion of the proposed Transaction or the timing thereof, the expected future reserves, production, financial position, business strategy, revenues, earnings, costs, capital expenditures and debt levels of the Company, and plans and objectives of management for future operations. Forward-looking statements are based on current expectations and assumptions and analyses made by Earthstone and its management in light of experience and perception of historical trends, current conditions and expected future developments, as well as other factors appropriate under the circumstances. However, whether actual results and developments will conform to expectations is subject to a number of material risks and uncertainties, including but not limited to: the ability to complete the proposed Transaction on anticipated terms and timetable; Earthstone’s ability to integrate its combined operations successfully after the Transaction and achieve anticipated benefits from it; the possibility that various closing conditions for the Transaction may not be satisfied or waived; risks relating to any unforeseen liabilities of Earthstone or IRM; declines in oil, natural gas liquids or natural gas prices; the level of success in exploration, development and production activities; adverse weather conditions that may negatively impact development or production activities; the timing of exploration and development expenditures; inaccuracies of reserve estimates or assumptions underlying them; revisions to reserve estimates as a result of changes in commodity prices; impacts to financial statements as a result of impairment write-downs; risks related to level of indebtedness and periodic redeterminations of the borrowing base under the Credit Facility; Earthstone’s ability to generate sufficient cash flows from operations to fund all or portions of its future capital expenditures budget; Earthstone’s ability to obtain external capital to finance exploration and development operations and acquisitions; the ability to successfully complete any potential asset dispositions and the risks related thereto; the impacts of hedging on results of operations; uninsured or underinsured losses resulting from oil and natural gas operations; Earthstone’s ability to replace oil and natural gas reserves; any loss of senior management or technical personnel; and the direct and indirect impact on most or all of the foregoing on the evolving COVID-19 pandemic. Earthstone’s annual report on Form 10-K for the year ended December 31, 2019, quarterly reports on Form 10-Q, recent current reports on Form 8-K, and other Securities and Exchange Commission (“SEC”) filings discuss some of the important risk factors identified that may affect Earthstone’s business, results of operations, and financial condition. Earthstone and IRM undertake no obligation to revise or update publicly any forward-looking statements except as required by law. Industry and Market Data This presentation has been prepared by Earthstone and includes market data and other statistical information from third-party sources, including independent industry publications, government publications or other published independent sources. Although Earthstone believes these third-party sources are reliable as of their respective dates, Earthstone has not independently verified the accuracy or completeness of this information. Some data are also based on Earthstone’s good faith estimates, which are derived from its review of internal sources as well as the third-party sources described above. This presentation also contains Earthstone’s internal estimates of its potential drilling locations, which may prove to be incorrect in a number of material ways. The actual number of locations that may be drilled may differ substantially from estimates.

3 $185.9 million acquisition of Independence Resources Management, LLC underwritten on PDP value but provides attractive drilling inventory additions Increases ESTE size and scale with ~50% increase in production and Adjusted EBITDAX Preserves conservative balance sheet with estimated pro forma 1.1x net leverage(1) at 9/30/20 Consistent with ESTE Permian Basin consolidation strategy and positions ESTE for further transactions Minimal incremental G&A results in targeted 25% reduction in go forward Cash G&A per Boe Accretive to all key financial metrics Independence Resources Acquisition Overview and Key Highlights (1) Net leverage reflects 9/30/20 net debt (total debt less cash) / LTM Adjusted EBITDAX at 9/30/20

4 Acquisition Details Consideration and Funding Earthstone has entered into an agreement to acquire Independence Resources Management, LLC and certain related entities (“IRM”) owned largely by Warburg Pincus, LLC and affiliates (“Warburg”) Cash and equity consideration of an estimated $185.9 million — Cash consideration of an estimated $135.2 million as of 11/30/2020, but expected to be lower on the closing date — 12.7 million Class A shares of ESTE (~$50.8 million based on ESTE closing share price of $3.99 on 12/16/2020) ESTE has received commitments for a $120 million increase in its borrowing base to $360 million in conjunction with the acquisition and will fund the cash portion of consideration from cash on hand and borrowings under the credit facility ESTE shareholders retain 83.7% of the common equity in the pro forma company Leadership and Governance Approval and Timing No changes to ESTE management team Warburg will receive the right to appoint one Director, increasing the size of ESTE’s Board of Directors upon closing from eight to nine Unanimously approved by ESTE and IRM boards Anticipated close in 1Q 2021

5 Strategic Acquisition Bolsters Existing Midland Basin Position IRM Asset Overview Combined Midland Basin Map ESTE Operated ESTE Non-Operated IRM IRM “Spanish Pearl” Core Acreage IRM Key Asset Statistics Daily Production for 3Q20 (Boepd)(1) 8,780 PDP Reserves(3) 16.3 MMBoe PDP PV 10 ($MM)(3) $173 Core Net Acres ~4,900 Total Net Acres ~43,400 % HBP / % Operated 100% / 99% Gross Locations(4) 70 (1) Estimated IRM 3Q20 three-stream sales volumes (2) Adjusted EBITDAX is a non-GAAP financial measure. See "Reconciliation of Non-GAAP Financial Measure - Adjusted EBITDAX" (3) ESTE estimates as of 12/1/20 based on NYMEX strip pricing as of 11/30/20 (4) ESTE estimate of Middle Spraberry, Lower Spraberry and Wolfcamp A locations assuming 880’ well spacing Complementary Midland Basin assets meaningfully increase ESTE size and scale 3Q20 production of 8,780 Boepd (66% oil)(1) $81.3MM of LTM Adjusted EBITDAX at 9/30/20(2) Purchase price supported by PDP reserves ~4,900 core net acres in Midland and Ector counties with 70 remaining locations with average IRR of 45% in the Middle Spraberry, Lower Spraberry and Wolfcamp A(3) — Additional upside in the Jo Mill, Wolfcamp B and Wolfcamp D

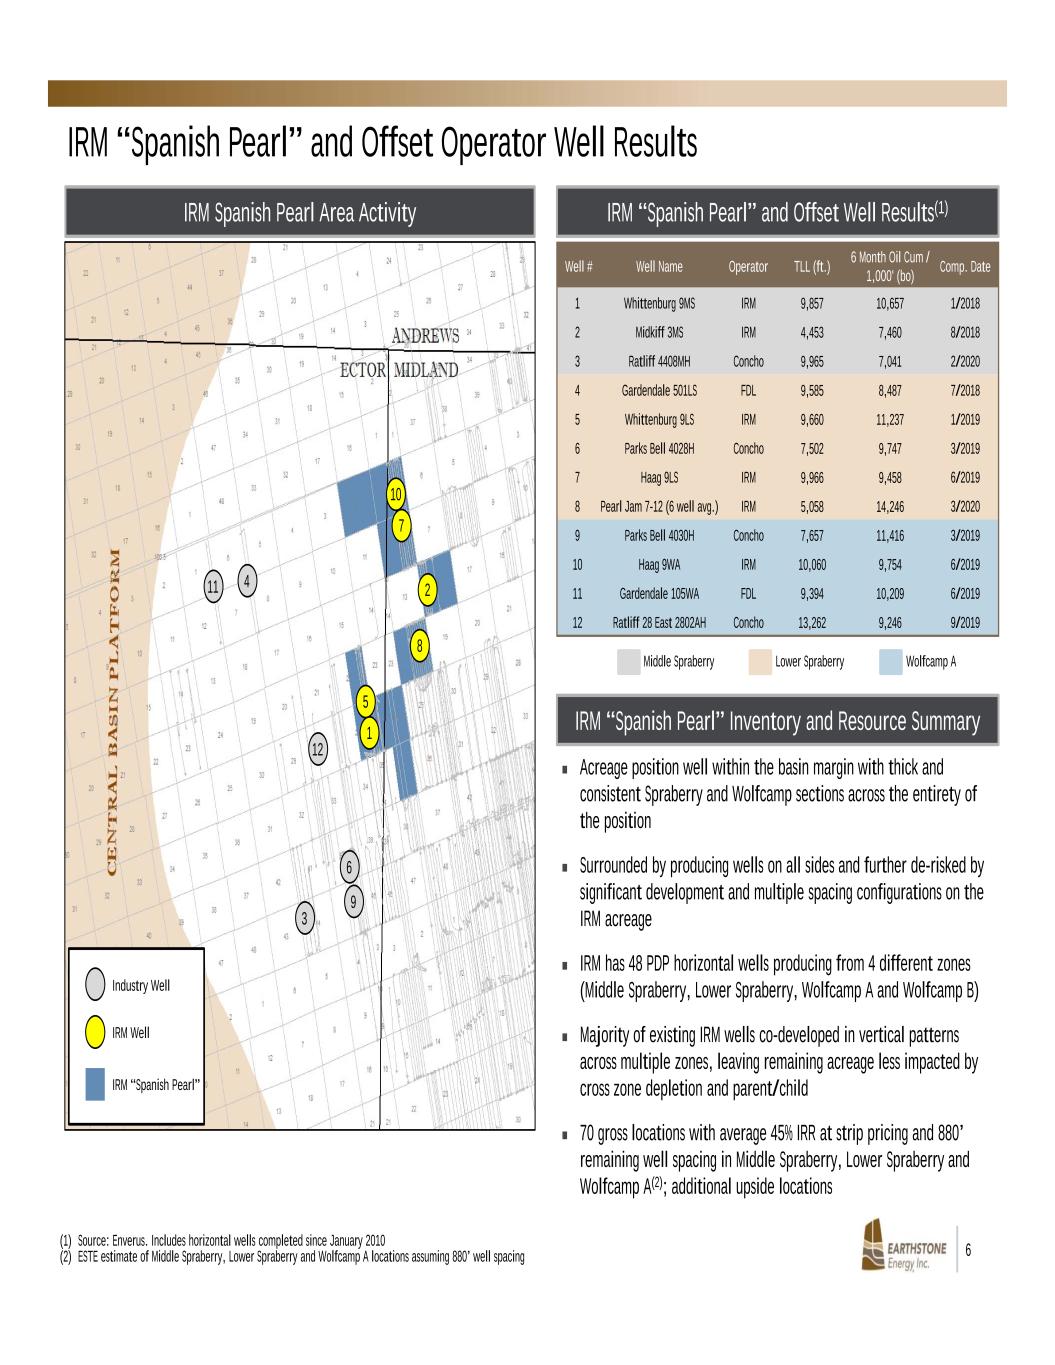
6 (1) Source: Enverus. Includes horizontal wells completed since January 2010 (2) ESTE estimate of Middle Spraberry, Lower Spraberry and Wolfcamp A locations assuming 880’ well spacing IRM “Spanish Pearl” and Offset Well Results(1)IRM Spanish Pearl Area Activity Middle Spraberry Lower Spraberry Wolfcamp A Well # Well Name Operator TLL (ft.) 6 Month Oil Cum / 1,000' (bo) Comp. Date 1 Whittenburg 9MS IRM 9,857 10,657 1/2018 2 Midkiff 3MS IRM 4,453 7,460 8/2018 3 Ratliff 4408MH Concho 9,965 7,041 2/2020 4 Gardendale 501LS FDL 9,585 8,487 7/2018 5 Whittenburg 9LS IRM 9,660 11,237 1/2019 6 Parks Bell 4028H Concho 7,502 9,747 3/2019 7 Haag 9LS IRM 9,966 9,458 6/2019 8 Pearl Jam 7-12 (6 well avg.) IRM 5,058 14,246 3/2020 9 Parks Bell 4030H Concho 7,657 11,416 3/2019 10 Haag 9WA IRM 10,060 9,754 6/2019 11 Gardendale 105WA FDL 9,394 10,209 6/2019 12 Ratliff 28 East 2802AH Concho 13,262 9,246 9/2019 Industry Well IRM Well IRM “Spanish Pearl” IRM “Spanish Pearl” Inventory and Resource Summary Acreage position well within the basin margin with thick and consistent Spraberry and Wolfcamp sections across the entirety of the position Surrounded by producing wells on all sides and further de-risked by significant development and multiple spacing configurations on the IRM acreage IRM has 48 PDP horizontal wells producing from 4 different zones (Middle Spraberry, Lower Spraberry, Wolfcamp A and Wolfcamp B) Majority of existing IRM wells co-developed in vertical patterns across multiple zones, leaving remaining acreage less impacted by cross zone depletion and parent/child 70 gross locations with average 45% IRR at strip pricing and 880’ remaining well spacing in Middle Spraberry, Lower Spraberry and Wolfcamp A(2); additional upside locations 1 4 2 3 5 7 8 6 9 10 11 12 IRM “Spanish Pearl” and Offset Operator Well Results

7 IRM Acquisition Meets Key Earthstone Criteria Earthstone Objectives Commentary IRM Acquisition Increase Scale at Favorable Valuations Increases ESTE size and scale by ~50% with minimal impact to leverage and shares outstanding Purchase price of $185.9 million underwritten on PDP value ✓ High Quality Basin & Acreage Position Complementary Midland Basin acreage position includes ~4,900 core net acres (100% HBP, 93% operated) in Midland and Ector counties High quality inventory addition with 70 gross locations with an average 45% IRR(1) ✓ Increase Free Cash Flow Capacity Substantially increases cash flow with minimal incremental G&A Added scale enhances pro forma development options within free cash flow ✓ Maintain Balance Sheet Strength Pro forma net leverage of 1.1x at 9/30/20 Pro forma liquidity of ~$90 million at 9/30/20 (cash + undrawn credit facility availability) and expected to exceed $100 million by closing ✓ Maintain Leading Cost Structure & Margins Maintains low cost, high margin operating metrics, while reducing go forward per unit Cash G&A costs by ~25% ✓ (1) ESTE estimate of Middle Spraberry, Lower Spraberry and Wolfcamp A locations assuming 880’ well spacing. IRRs based on NYMEX strip pricing as of 11/30/20

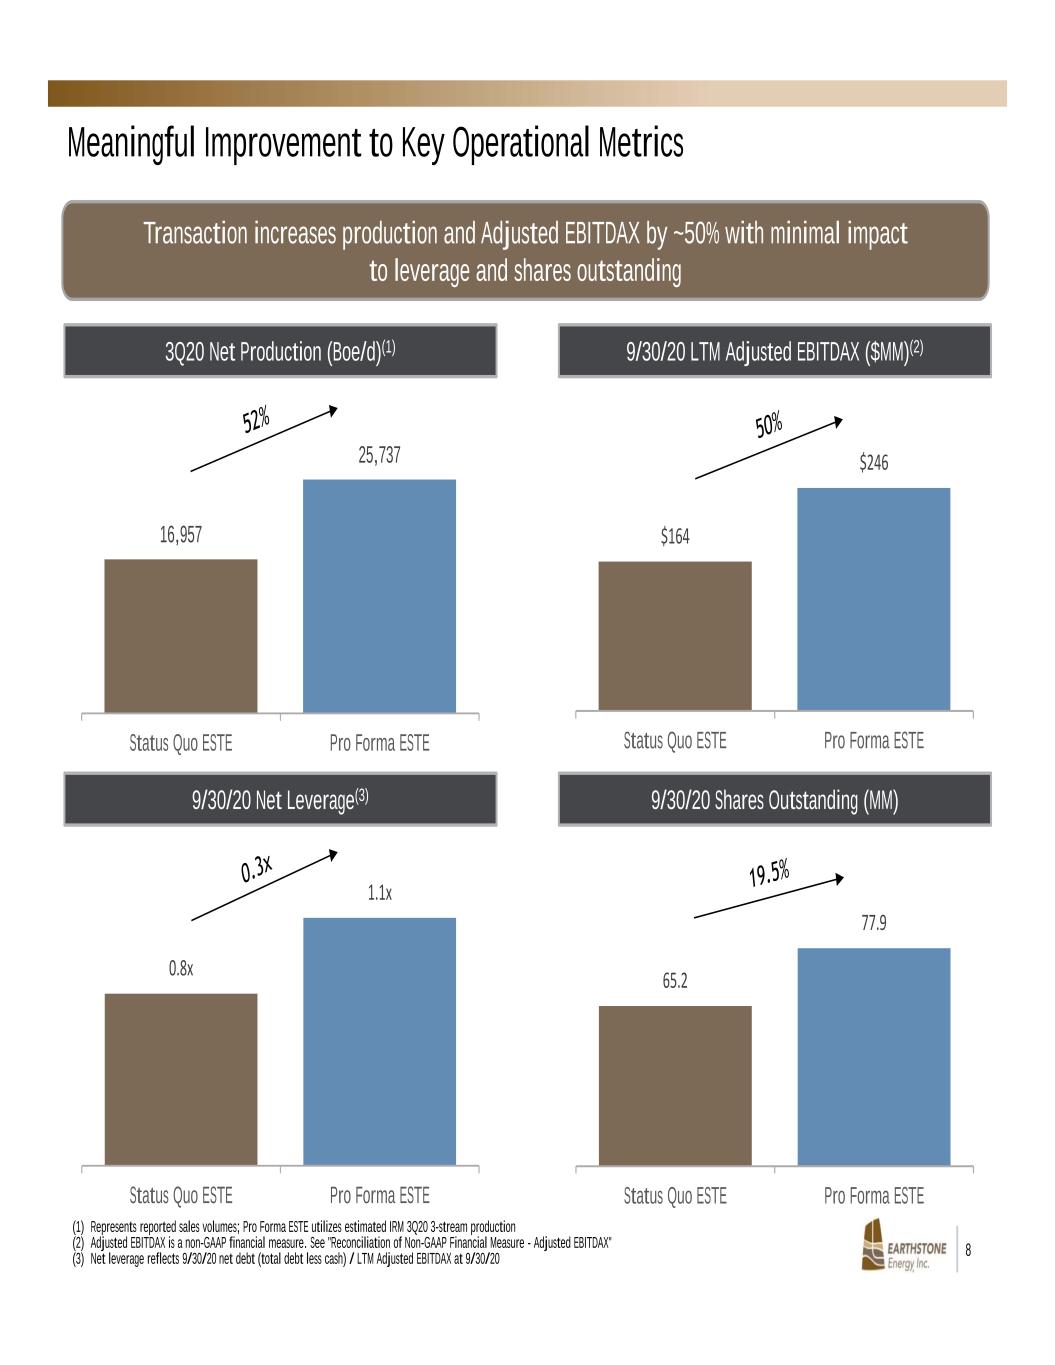
8 65.2 77.9 Status Quo ESTE Pro Forma ESTE $164 $246 Status Quo ESTE Pro Forma ESTE Meaningful Improvement to Key Operational Metrics 3Q20 Net Production (Boe/d)(1) 9/30/20 LTM Adjusted EBITDAX ($MM)(2) 9/30/20 Net Leverage(3) 16,957 25,737 Status Quo ESTE Pro Forma ESTE 0.8x 1.1x Status Quo ESTE Pro Forma ESTE (1) Represents reported sales volumes; Pro Forma ESTE utilizes estimated IRM 3Q20 3-stream production (2) Adjusted EBITDAX is a non-GAAP financial measure. See "Reconciliation of Non-GAAP Financial Measure - Adjusted EBITDAX" (3) Net leverage reflects 9/30/20 net debt (total debt less cash) / LTM Adjusted EBITDAX at 9/30/20 Transaction increases production and Adjusted EBITDAX by ~50% with minimal impact to leverage and shares outstanding 9/30/20 Shares Outstanding (MM)

9 Transaction Improves All Key Metrics Without Impacting Balance Sheet Metrics 2021 Net Production 2021 Adjusted EBITDAX 2021 Free Cash Flow ESTE expects to pick up an operated rig in 2021, depending on market conditions, and will provide FY 2021 guidance in early 2021 in the normal course of business IRM’s Spanish Pearl asset is expected to compete for capital with existing ESTE assets in a 1-rig program Note: Both status quo and pro forma scenarios assume a 1-rig program beginning in 2021 Status Quo ESTE – 1 Rig Pro Forma ESTE – 1 Rig

10 Acquisition Highlights Highly attractive, PDP-weighted valuation Meaningfully increases size and scale, creating a Midland Basin consolidation platform Mature, low cost, high margin production enhances ability to generate free cash flow Low risk acreage proximate to existing asset base provides confidence in asset quality Maintains conservative leverage and strong liquidity profile Accretive to all key financial metrics

11 Mark Lumpkin, Jr. EVP, Chief Financial Officer Scott Thelander Vice President of Finance Corporate Offices Houston 1400 Woodloch Forest Drive | Suite 300 | The Woodlands, TX 77380 | (281) 298-4246 Midland 600 N. Marienfeld | Suite 1000 | Midland, TX 79701 | (432) 686-1100 Website www.earthstoneenergy.com Contact Information

12 Reconciliation of Non-GAAP Financial Measure – Adjusted EBITDAX Earthstone uses Adjusted EBITDAX, a financial measure that is not presented in accordance with accounting principles generally accepted in the United States (“GAAP”). Adjusted EBITDAX is a supplemental non-GAAP financial measure that is used by Earthstone’s management team and external users of its financial statements, such as industry analysts, investors, lenders and rating agencies. Earthstone’s management team believes Adjusted EBITDAX is useful because it allows Earthstone to more effectively evaluate its operating performance and compare the results of its operations from period to period without regard to its financing methods or capital structure. Earthstone defines Adjusted EBITDAX as net (loss) income plus, when applicable, (gain) loss on sale of oil and gas properties, net; accretion of asset retirement obligations; impairment expense; depletion, depreciation and amortization; transaction costs; interest expense, net; rig termination expense; exploration expense; unrealized loss (gain) on derivative contracts; stock based compensation (non-cash); and income tax expense (benefit). Earthstone excludes the foregoing items from net income (loss) in arriving at Adjusted EBITDAX because these amounts can vary substantially from company to company within their industry depending upon accounting methods and book values of assets, capital structures and the method by which the assets were acquired. Adjusted EBITDAX should not be considered as an alternative to, or more meaningful than, net (loss) income as determined in accordance with GAAP or as an indicator of Earthstone’s operating performance or liquidity. Certain items excluded from Adjusted EBITDAX are significant components in understanding and assessing a company’s financial performance, such as a company’s cost of capital and tax structure, as well as the historic costs of depreciable assets, none of which are components of Adjusted EBITDAX. Earthstone’s computation of Adjusted EBITDAX may not be comparable to other similarly titled measures of other companies or to similar measures in Earthstone’s revolving credit facility. The following table provides a reconciliation of Net (loss) income to Adjusted EBITDAX for: (1) Included in Earthstone’s General and administrative expense in the Consolidated Statements of Operations 9/30/20 LTM Adjusted EBITDAX ($ in 000s) (1) ESTE IRM Pro Forma Net (loss) income ($16,693) ($66,645) ($83,338) Accretion of asset retirement obligations 191 1,254 1,445 Depreciation, depletion and amortization 103,058 46,852 149,910 Impairment expense 62,548 56,600 119,148 Interest expense, net 6,038 11,281 17,319 Transaction costs (45) 0 (45) Loss (gain) on sale of oil and gas properties (3,866) 0 (3,866) Rig termination expense 426 1,998 2,424 Exploration expense 951 27,226 28,177 Unrealized loss (gain) on derivative contracts 1,051 346 1,397 Stock based compensation (non-cash)(1) 9,633 2,961 12,594 Income tax expense (benefit) 1,049 (575) 474 Adjusted EBITDAX $164,341 $81,298 $245,639
