Attached files
| file | filename |
|---|---|
| 8-K - 8-K - Golub Capital BDC 3, Inc. | gbdc3ip8-kxfy2020q4.htm |

GOLUB CAPITAL BDC 3, INC. INVESTOR PRESENTATION QUARTER ENDED SEPTEMBER 30, 2020
Disclaimer 2 Some of the statements in this presentation constitute forward-looking statements, which relate to future events or our future performance or financial condition. The forward-looking statements contained in this presentation involve risks and uncertainties, including statements as to: our future operating results; our business prospects and the prospects of our portfolio companies including our and their ability to achieve our and their respective objectives as a result of the coronavirus ("COVID-19") pandemic ; the effect of investments that we expect to make and the competition for those investments; our contractual arrangements and relationships with third parties; actual and potential conflicts of interest with GC Advisors LLC ("GC Advisors"), our investment adviser, and other affiliates of Golub Capital LLC (collectively, "Golub Capital"); the dependence of our future success on the general economy and its effect on the industries in which we invest; the ability of our portfolio companies to achieve their objectives; the use of borrowed money to finance a portion of our investments and the effect of the COVID-19 pandemic on the availability of equity and debt capital and our use of borrowed funds to finance a portion of our investments; the adequacy of our financing sources and working capital; the timing of cash flows, if any, from the operations of our portfolio companies; general economic and political trends and other external factors, including the COVID-19 pandemic; changes in political, economic or industry conditions, the interest rate environment or conditions affecting the financial and capital markets that could result in changes to the value of our assets, including changes from the impact of the COVID-19 pandemic; the ability of GC Advisors to locate suitable investments for us and to monitor and administer our investments; the ability of GC Advisors or its affiliates to attract and retain highly talented professionals; the ability of GC Advisors to continue to effectively manage our business due to the disruptions caused by the COVID-19 pandemic; our ability to qualify and maintain our qualification as a regulated investment company and as a business development company; general price and volume fluctuations in the stock market; the impact on our business of the Dodd-Frank Wall Street Reform and Consumer Protection Act and the rules and regulations issued thereunder and any actions toward repeal thereof; and the effect of changes to tax legislation and our tax position. Such forward-looking statements may include statements preceded by, followed by or that otherwise include the words “may,” “might,” “will,” “intend,” “should,” “could,” “can,” “would,” “expect,” “believe,” “estimate,” “anticipate,” “predict,” “potential,” “plan” or similar words. We have based the forward-looking statements included in this presentation on information available to us on the date of this presentation. Actual results could differ materially from those anticipated in our forward-looking statements and future results could differ materially from historical performance. We undertake no obligation to revise or update any forward-looking statements, whether as a result of new information, future events or otherwise. You are advised to consult any additional disclosures that we may make directly to you or through reports that we have filed or in the future may file with the Securities and Exchange Commission (“SEC”), including annual reports on Form 10-K, quarterly reports on Form 10-Q and current reports on Form 8-K. This presentation contains statistics and other data that have been obtained from or compiled from information made available by third-party service providers. We have not independently verified such statistics or data. In evaluating prior performance information in this presentation, you should remember that past performance is not a guarantee, prediction, or projection of future results, and there can be no assurance that we will achieve similar results in the future.
Summary of Financial Results vs. Preliminary Estimates 01
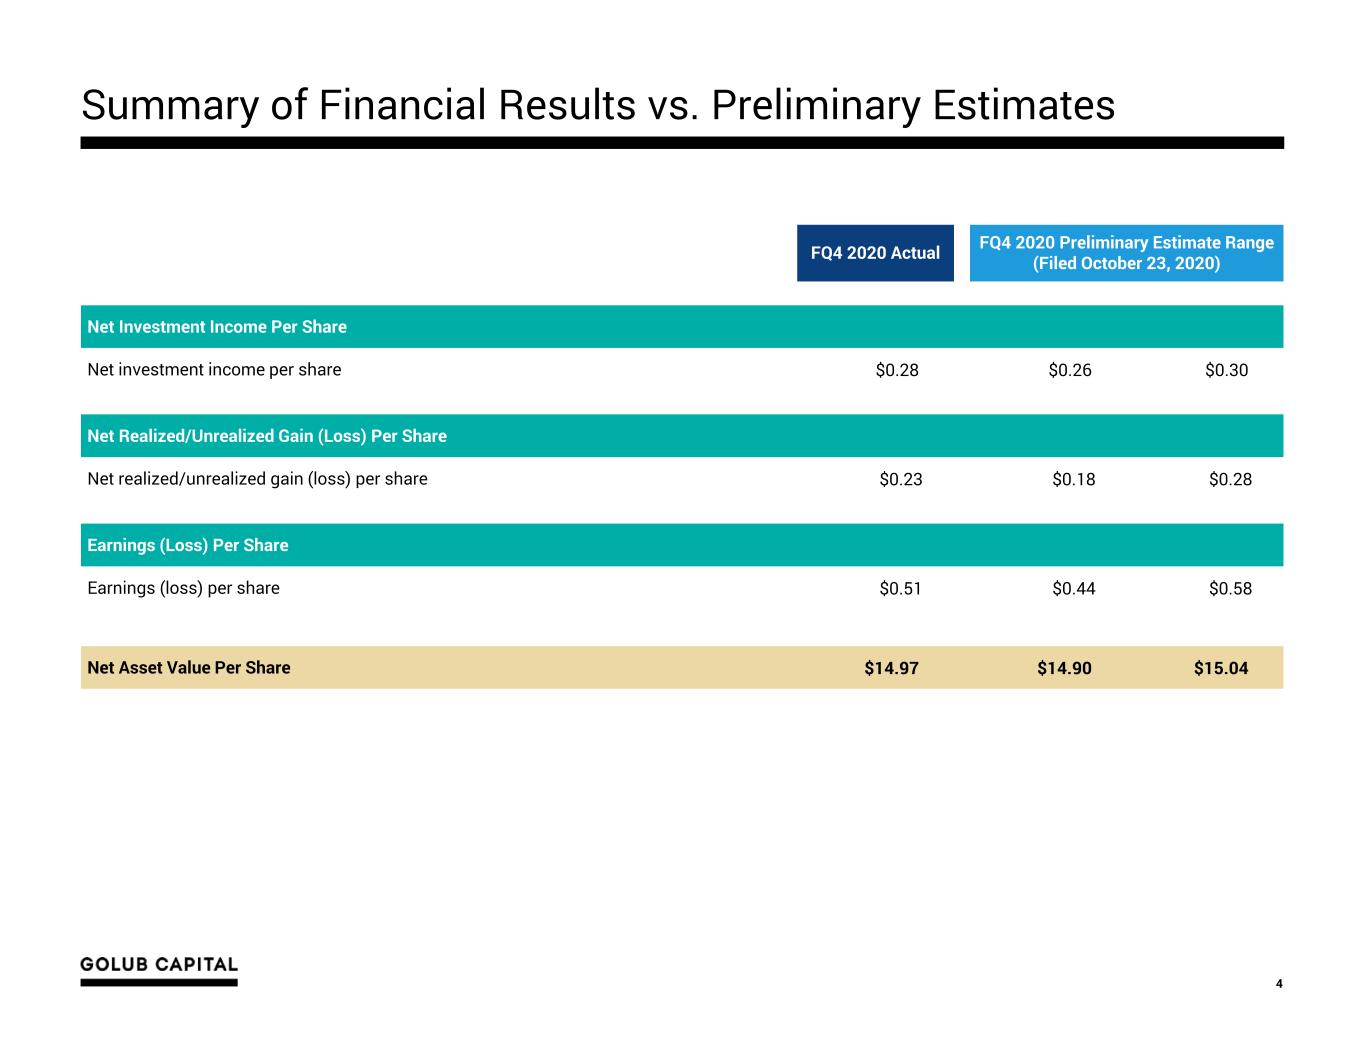
4 Summary of Financial Results vs. Preliminary Estimates FQ4 2020 Actual FQ4 2020 Preliminary Estimate Range (Filed October 23, 2020) Net Investment Income Per Share Net investment income per share $0.28 $0.26 $0.30 Net Realized/Unrealized Gain (Loss) Per Share Net realized/unrealized gain (loss) per share $0.23 $0.18 $0.28 Earnings (Loss) Per Share Earnings (loss) per share $0.51 $0.44 $0.58 Net Asset Value Per Share $14.97 $14.90 $15.04
GBDC 3 Performance Drivers 02
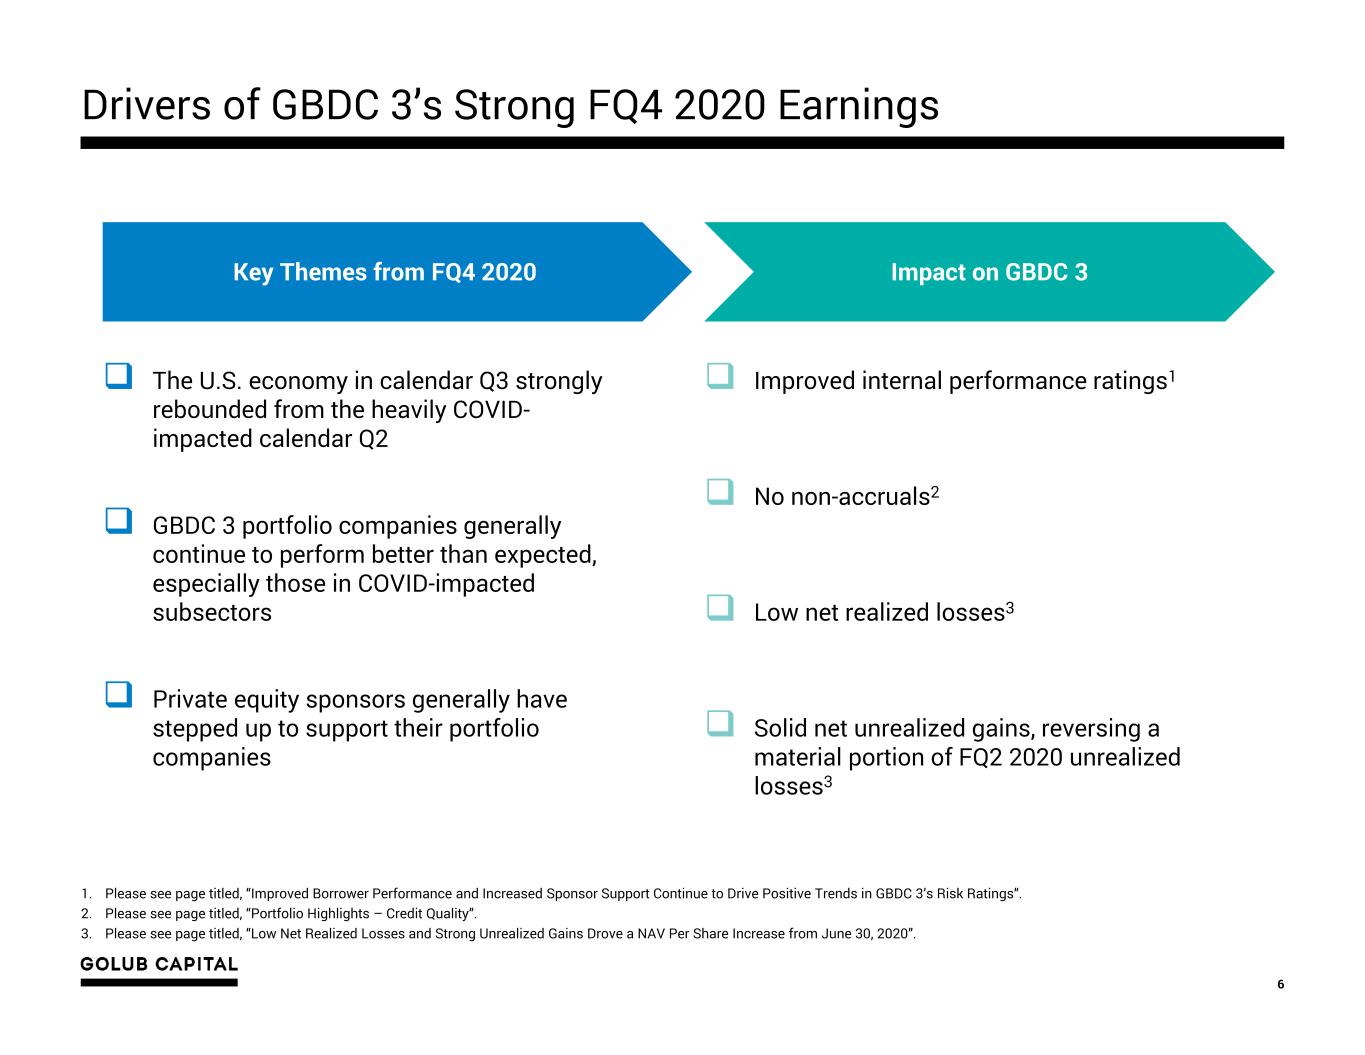
Drivers of GBDC 3’s Strong FQ4 2020 Earnings 6 Improved internal performance ratings1 No non-accruals2 Low net realized losses3 Solid net unrealized gains, reversing a material portion of FQ2 2020 unrealized losses3 Key Themes from FQ4 2020 Impact on GBDC 3 The U.S. economy in calendar Q3 strongly rebounded from the heavily COVID- impacted calendar Q2 GBDC 3 portfolio companies generally continue to perform better than expected, especially those in COVID-impacted subsectors Private equity sponsors generally have stepped up to support their portfolio companies 1. Please see page titled, “Improved Borrower Performance and Increased Sponsor Support Continue to Drive Positive Trends in GBDC 3’s Risk Ratings”. 2. Please see page titled, “Portfolio Highlights – Credit Quality”. 3. Please see page titled, “Low Net Realized Losses and Strong Unrealized Gains Drove a NAV Per Share Increase from June 30, 2020”.

Improved Borrower Performance and Increased Sponsor Support Continue to Drive Positive Trends in GBDC 3’s Risk Ratings 7 Internal Performance Rating Migration % of Portfolio at Fair Value 0.3%2.2% 21.0% 15.0% 12.2% 97.8% 79.0% 84.7% 87.8% December 31, 2019 March 31, 2020 June 30, 2020 September 30, 2020 Internal Performance Ratings 4-5 (Performing At or Above Expectations) Internal Performance Rating 3 (Performing Below Expectations) Internal Performance Ratings 1 and 2* (Performing Materially Below Expectations) -2.8% -6.0% * Represents an amount less than 0.1% as of December 31, 2019, March 31, 2020, and September 30, 2020. +18.8% − Steady upward portfolio migration into internal performance ratings 4-5 since the quarter ended March 31, 2020 as borrowers continued to perform better than initially expected − Investments with internal performance ratings 1-2 represent less than 0.1% of the portfolio at fair value
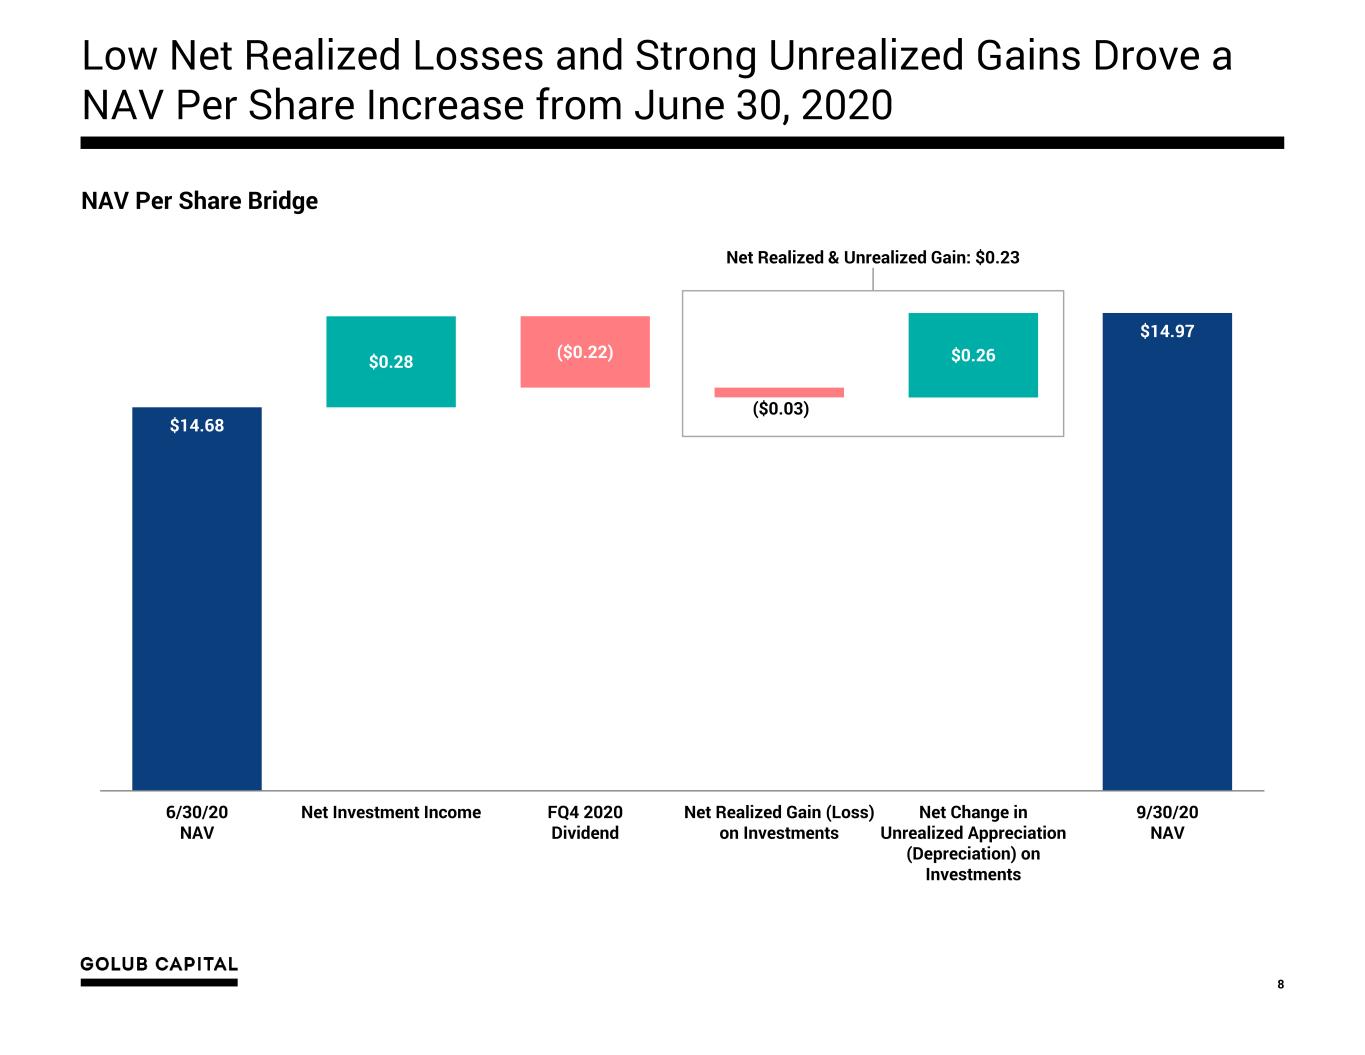
Low Net Realized Losses and Strong Unrealized Gains Drove a NAV Per Share Increase from June 30, 2020 8 NAV Per Share Bridge $14.68 $14.97 $0.28 $0.26 ($0.22) ($0.03) 6/30/20 NAV Net Investment Income FQ4 2020 Dividend Net Realized Gain (Loss) on Investments Net Change in Unrealized Appreciation (Depreciation) on Investments 9/30/20 NAV Net Realized & Unrealized Gain: $0.23
Navigating COVID-19: Strategic Response Update 03
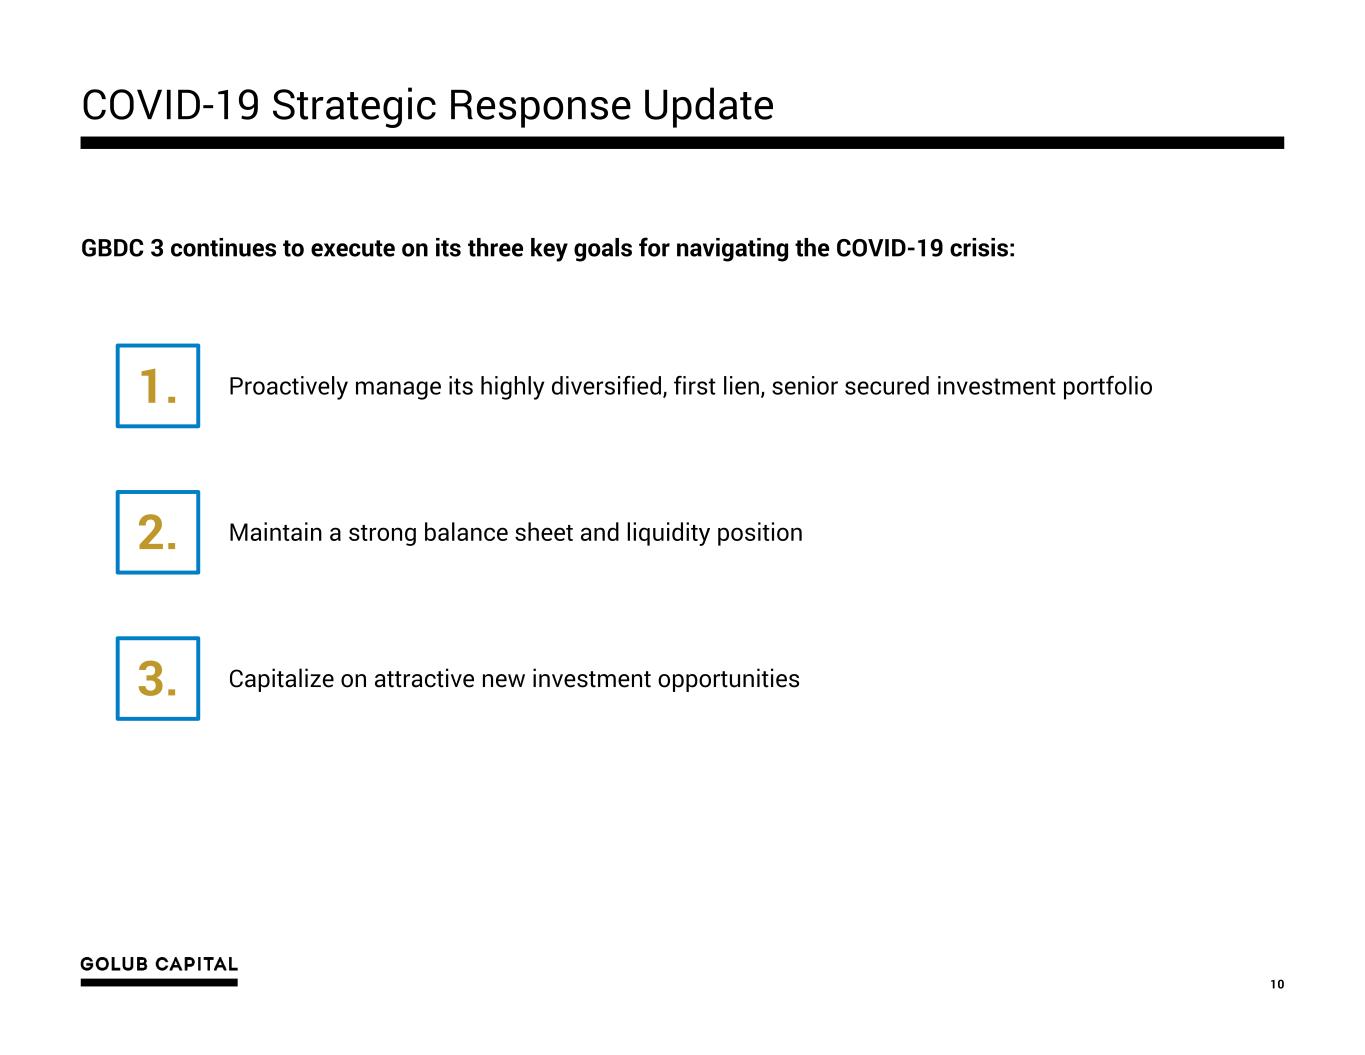
COVID-19 Strategic Response Update 10 1. Proactively manage its highly diversified, first lien, senior secured investment portfolio 2. 3. Capitalize on attractive new investment opportunities GBDC 3 continues to execute on its three key goals for navigating the COVID-19 crisis: Maintain a strong balance sheet and liquidity position
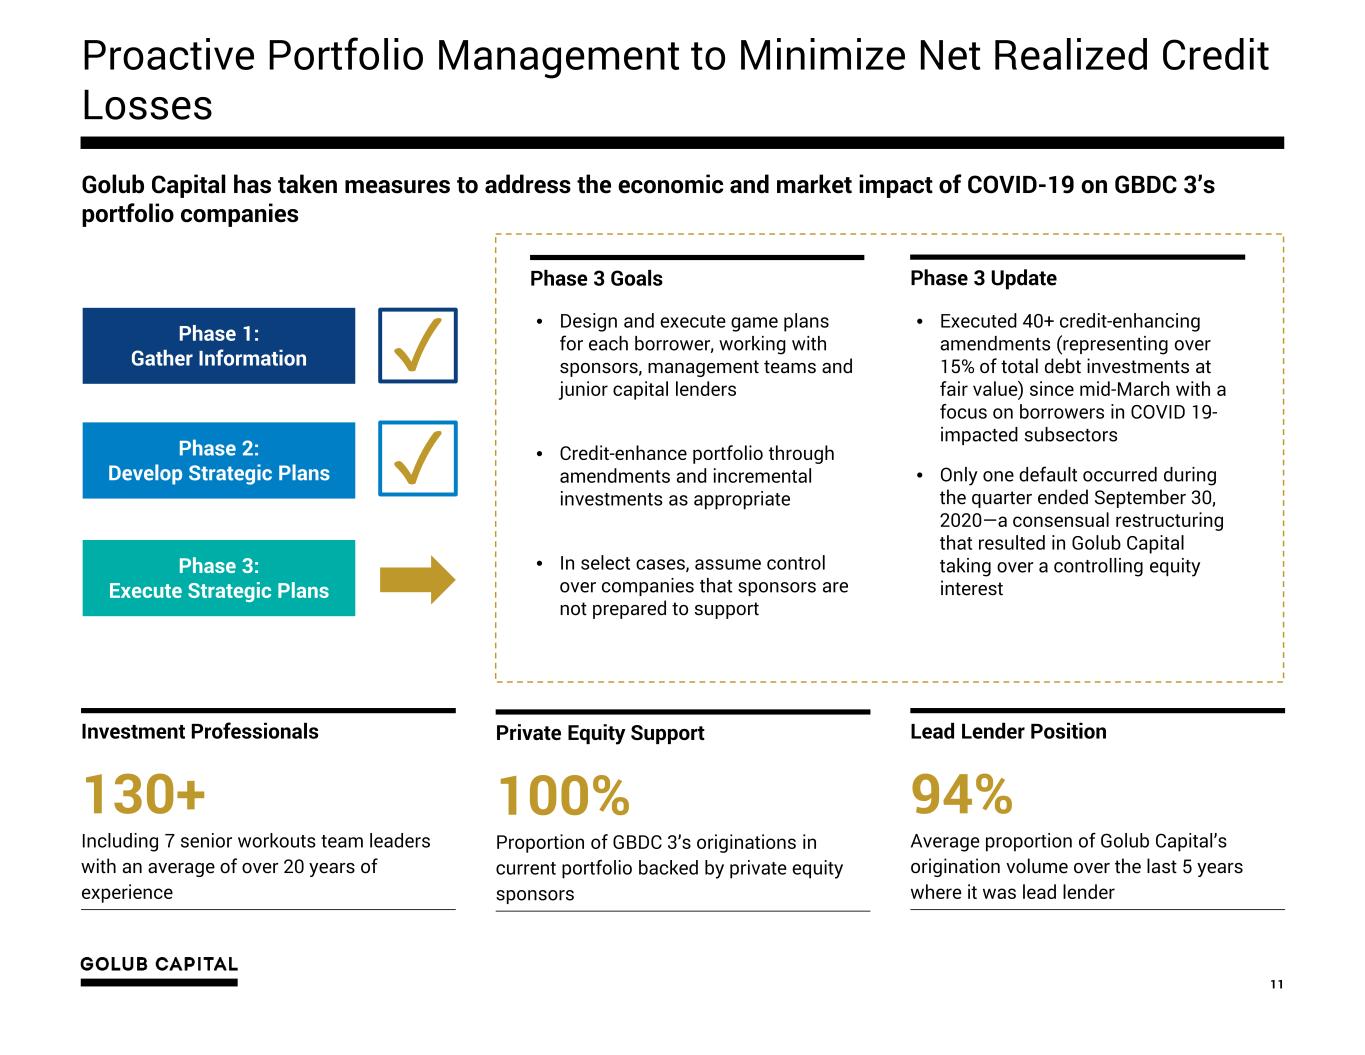
Proactive Portfolio Management to Minimize Net Realized Credit Losses 11 Golub Capital has taken measures to address the economic and market impact of COVID-19 on GBDC 3’s portfolio companies 130+ Including 7 senior workouts team leaders with an average of over 20 years of experience Investment Professionals Private Equity Support 100% Proportion of GBDC 3’s originations in current portfolio backed by private equity sponsors Lead Lender Position 94% Average proportion of Golub Capital’s origination volume over the last 5 years where it was lead lender Phase 1: Gather Information Phase 2: Develop Strategic Plans Phase 3: Execute Strategic Plans • Design and execute game plans for each borrower, working with sponsors, management teams and junior capital lenders • Credit-enhance portfolio through amendments and incremental investments as appropriate • In select cases, assume control over companies that sponsors are not prepared to support • Executed 40+ credit-enhancing amendments (representing over 15% of total debt investments at fair value) since mid-March with a focus on borrowers in COVID 19- impacted subsectors • Only one default occurred during the quarter ended September 30, 2020—a consensual restructuring that resulted in Golub Capital taking over a controlling equity interest ✓ ✓ Phase 3 Goals Phase 3 Update
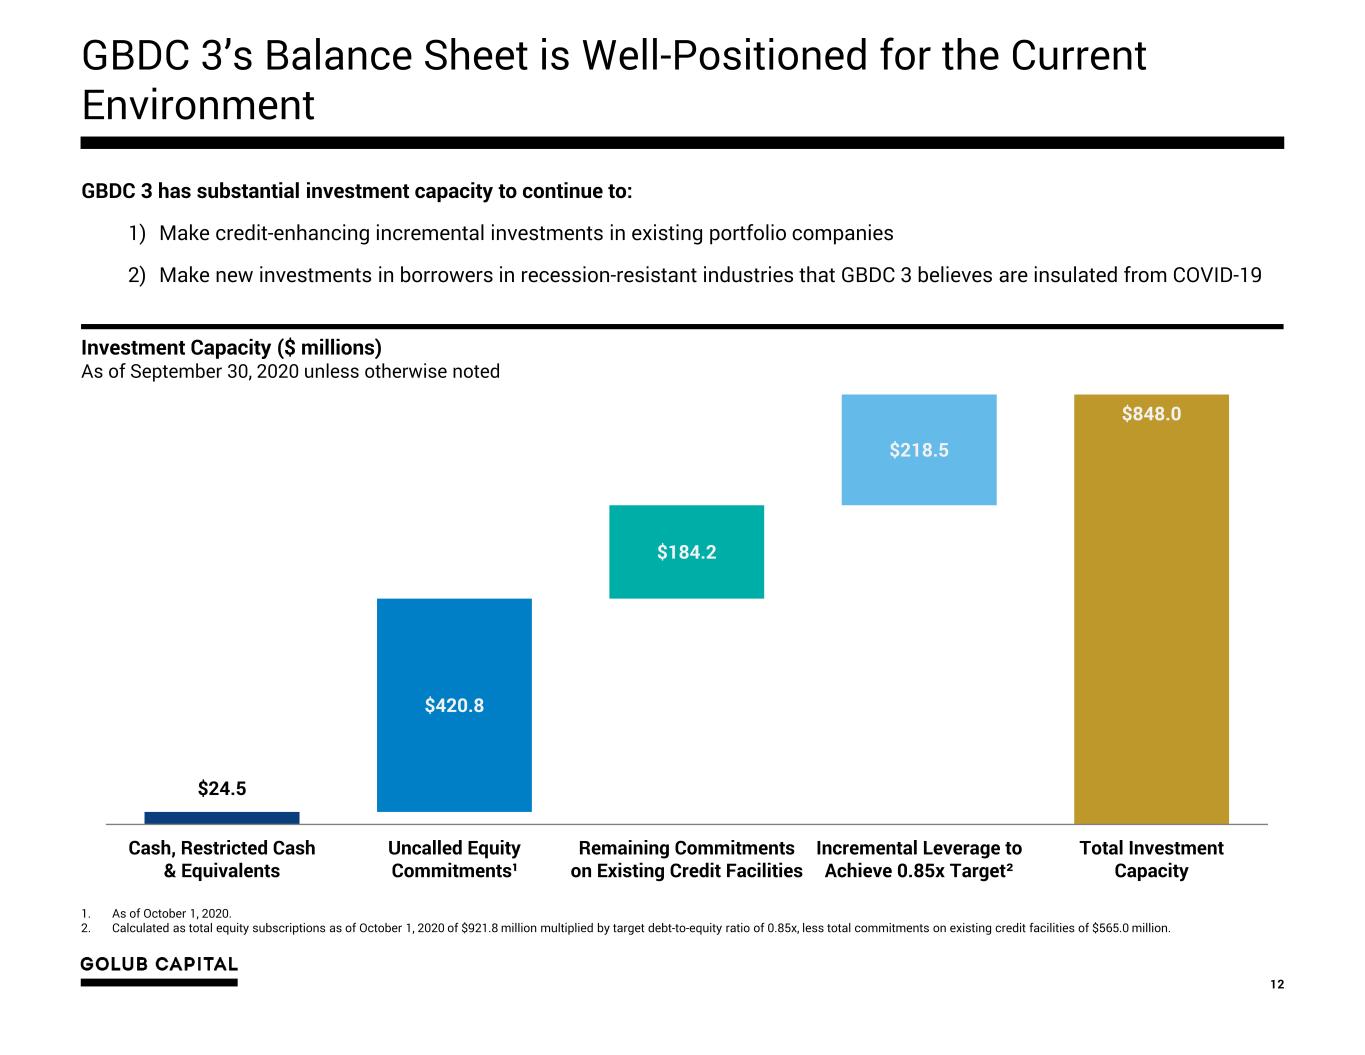
GBDC 3’s Balance Sheet is Well-Positioned for the Current Environment 12 $24.5 $848.0 $420.8 $184.2 $218.5 Cash, Restricted Cash & Equivalents Uncalled Equity Commitments¹ Remaining Commitments on Existing Credit Facilities Incremental Leverage to Achieve 0.85x Target² Total Investment Capacity GBDC 3 has substantial investment capacity to continue to: 1) Make credit-enhancing incremental investments in existing portfolio companies 2) Make new investments in borrowers in recession-resistant industries that GBDC 3 believes are insulated from COVID-19 1. As of October 1, 2020. 2. Calculated as total equity subscriptions as of October 1, 2020 of $921.8 million multiplied by target debt-to-equity ratio of 0.85x, less total commitments on existing credit facilities of $565.0 million. Investment Capacity ($ millions) As of September 30, 2020 unless otherwise noted
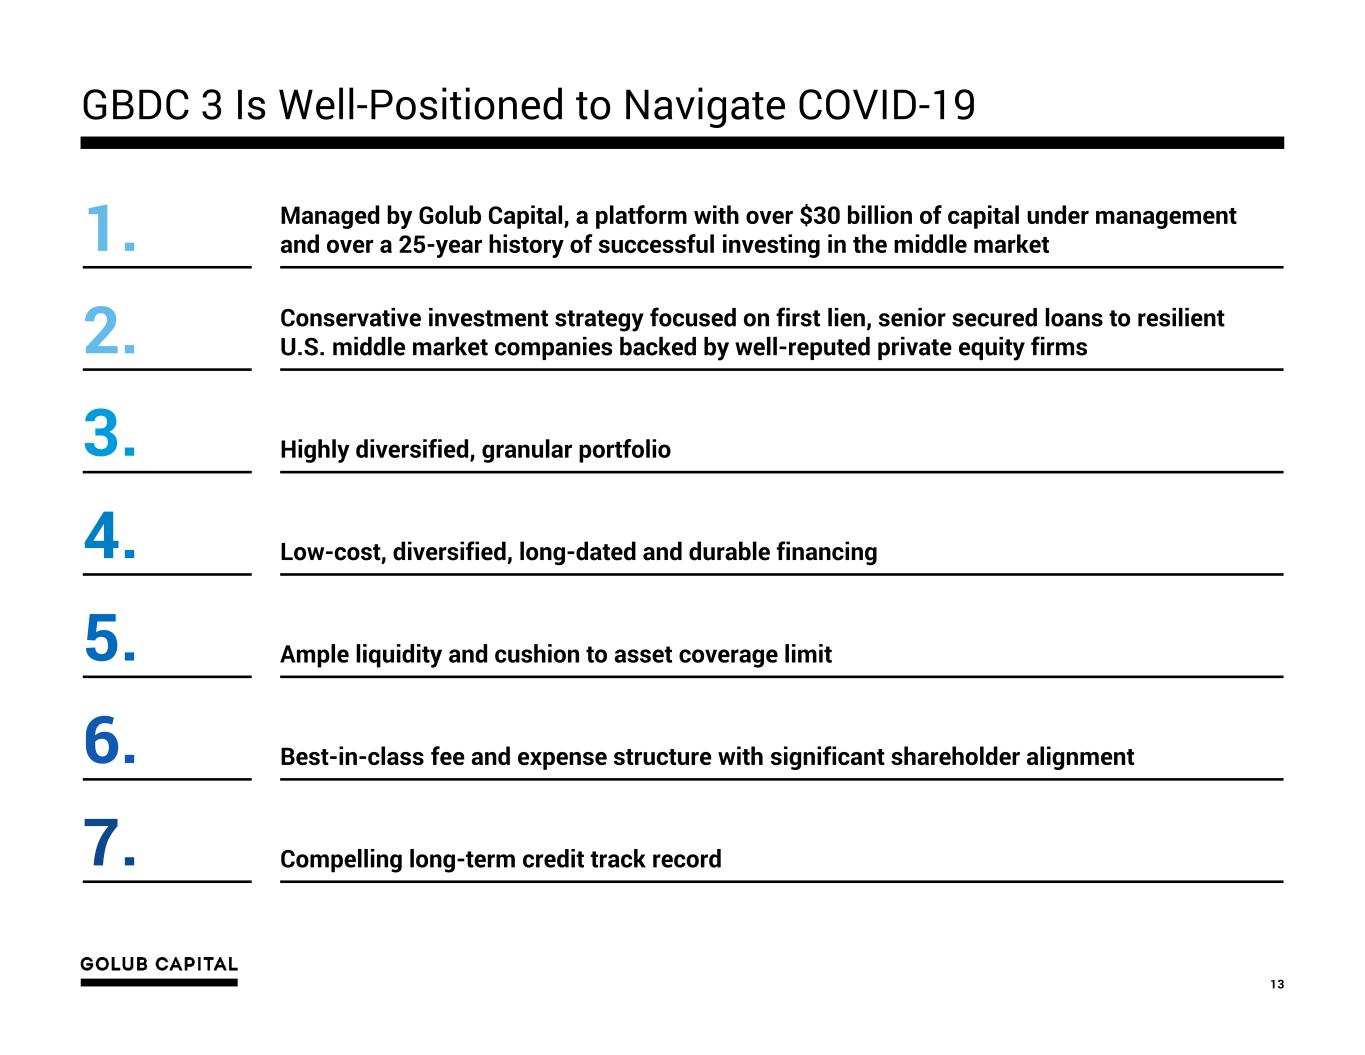
GBDC 3 Is Well-Positioned to Navigate COVID-19 13 1. Managed by Golub Capital, a platform with over $30 billion of capital under management and over a 25-year history of successful investing in the middle market 2. Conservative investment strategy focused on first lien, senior secured loans to resilient U.S. middle market companies backed by well-reputed private equity firms 3. Highly diversified, granular portfolio 4. Low-cost, diversified, long-dated and durable financing 5. Ample liquidity and cushion to asset coverage limit 6. Best-in-class fee and expense structure with significant shareholder alignment 7. Compelling long-term credit track record
Summary of Financial Results for the Quarter Ended September 30, 2020 04
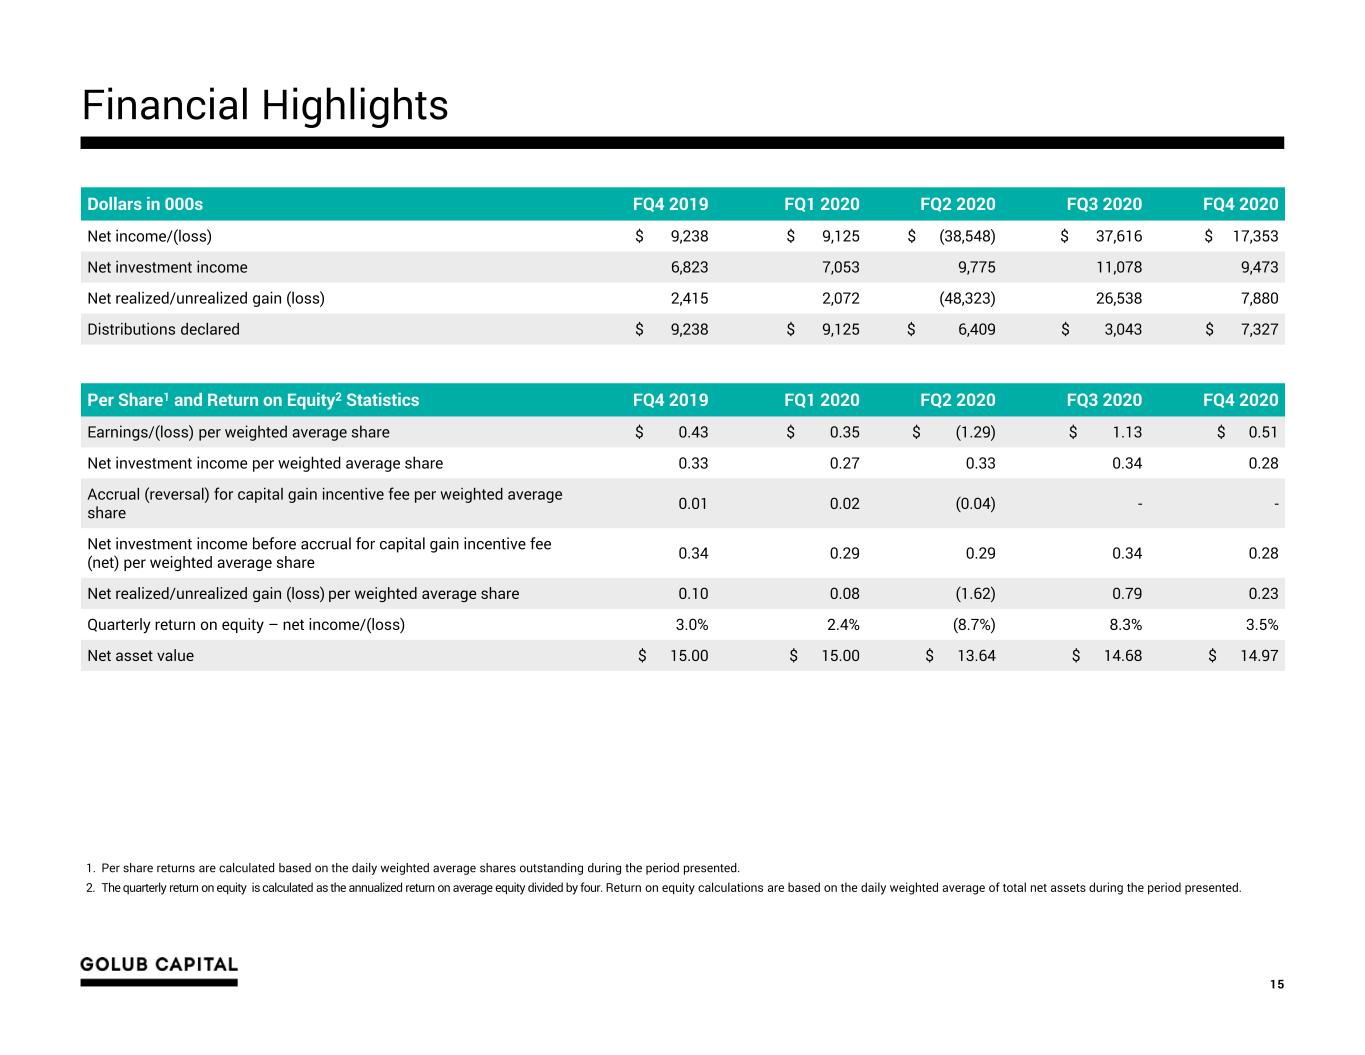
Dollars in 000s FQ4 2019 FQ1 2020 FQ2 2020 FQ3 2020 FQ4 2020 Net income/(loss) $ 9,238 $ 9,125 $ (38,548) $ 37,616 $ 17,353 Net investment income 6,823 7,053 9,775 11,078 9,473 Net realized/unrealized gain (loss) 2,415 2,072 (48,323) 26,538 7,880 Distributions declared $ 9,238 $ 9,125 $ 6,409 $ 3,043 $ 7,327 Per Share1 and Return on Equity2 Statistics FQ4 2019 FQ1 2020 FQ2 2020 FQ3 2020 FQ4 2020 Earnings/(loss) per weighted average share $ 0.43 $ 0.35 $ (1.29) $ 1.13 $ 0.51 Net investment income per weighted average share 0.33 0.27 0.33 0.34 0.28 Accrual (reversal) for capital gain incentive fee per weighted average share 0.01 0.02 (0.04) - - Net investment income before accrual for capital gain incentive fee (net) per weighted average share 0.34 0.29 0.29 0.34 0.28 Net realized/unrealized gain (loss) per weighted average share 0.10 0.08 (1.62) 0.79 0.23 Quarterly return on equity – net income/(loss) 3.0% 2.4% (8.7%) 8.3% 3.5% Net asset value $ 15.00 $ 15.00 $ 13.64 $ 14.68 $ 14.97 Financial Highlights 15 1. Per share returns are calculated based on the daily weighted average shares outstanding during the period presented. 2. The quarterly return on equity is calculated as the annualized return on average equity divided by four. Return on equity calculations are based on the daily weighted average of total net assets during the period presented.
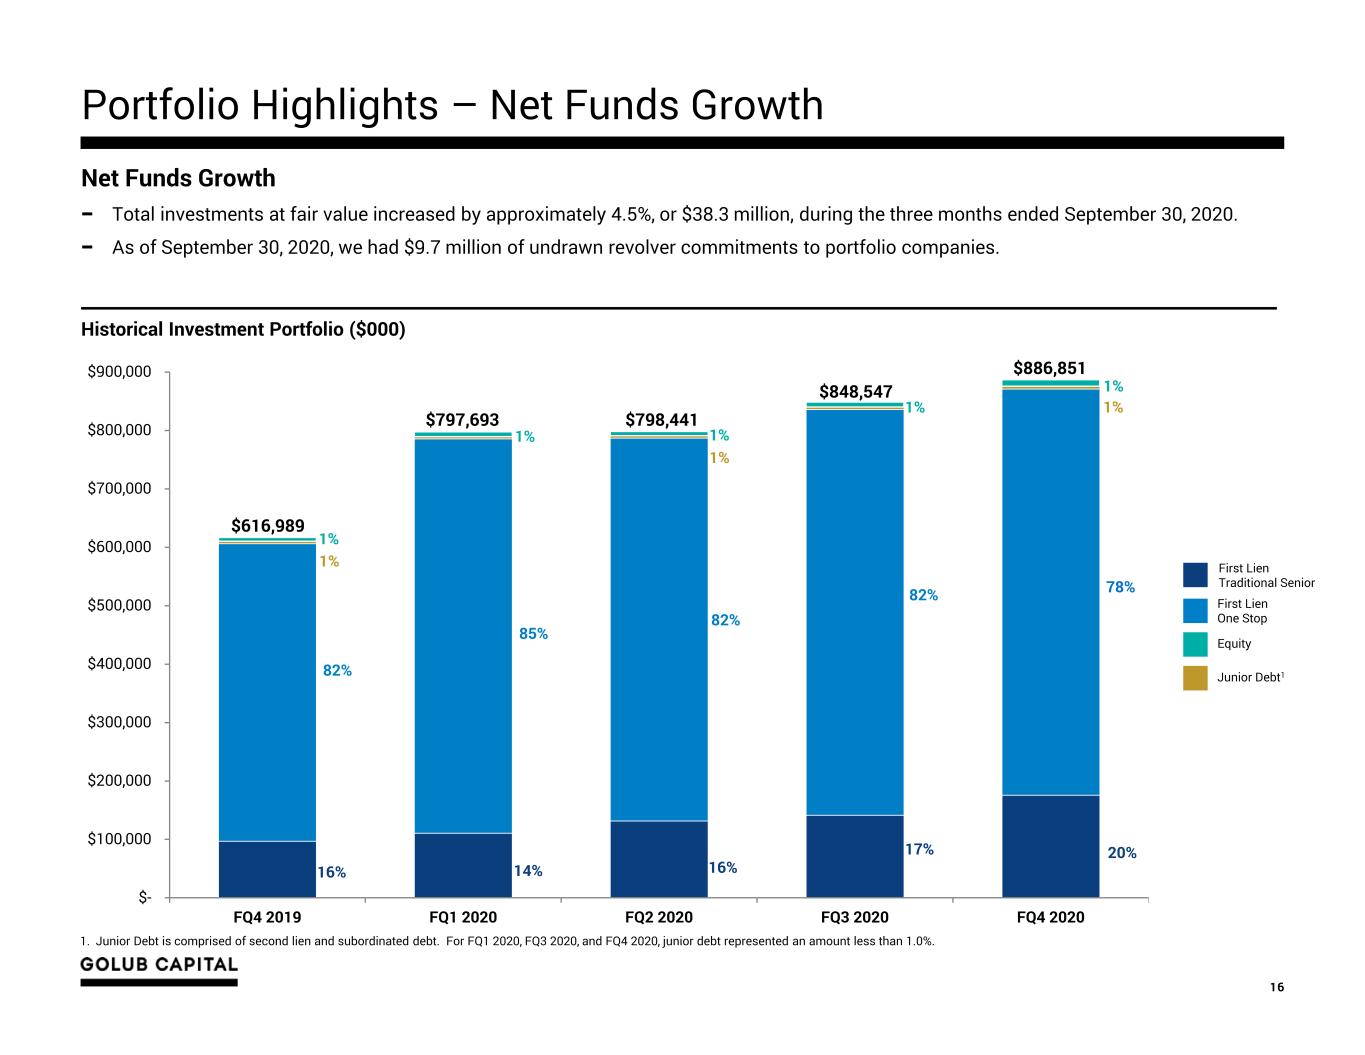
Portfolio Highlights – Net Funds Growth 16 $- $100,000 $200,000 $300,000 $400,000 $500,000 $600,000 $700,000 $800,000 $900,000 FQ4 2019 FQ1 2020 FQ2 2020 FQ3 2020 FQ4 2020 $616,989 1% 1% Historical Investment Portfolio ($000) 14% 82% 82% 16% 85% 16% $797,693 1. Junior Debt is comprised of second lien and subordinated debt. For FQ1 2020, FQ3 2020, and FQ4 2020, junior debt represented an amount less than 1.0%. 1%1% 1% 1% $798,441 1% 82% 17% Net Funds Growth − Total investments at fair value increased by approximately 4.5%, or $38.3 million, during the three months ended September 30, 2020. − As of September 30, 2020, we had $9.7 million of undrawn revolver commitments to portfolio companies. 78% 20% 1%$848,547 Equity Junior Debt1 First Lien One Stop First Lien Traditional Senior $886,851
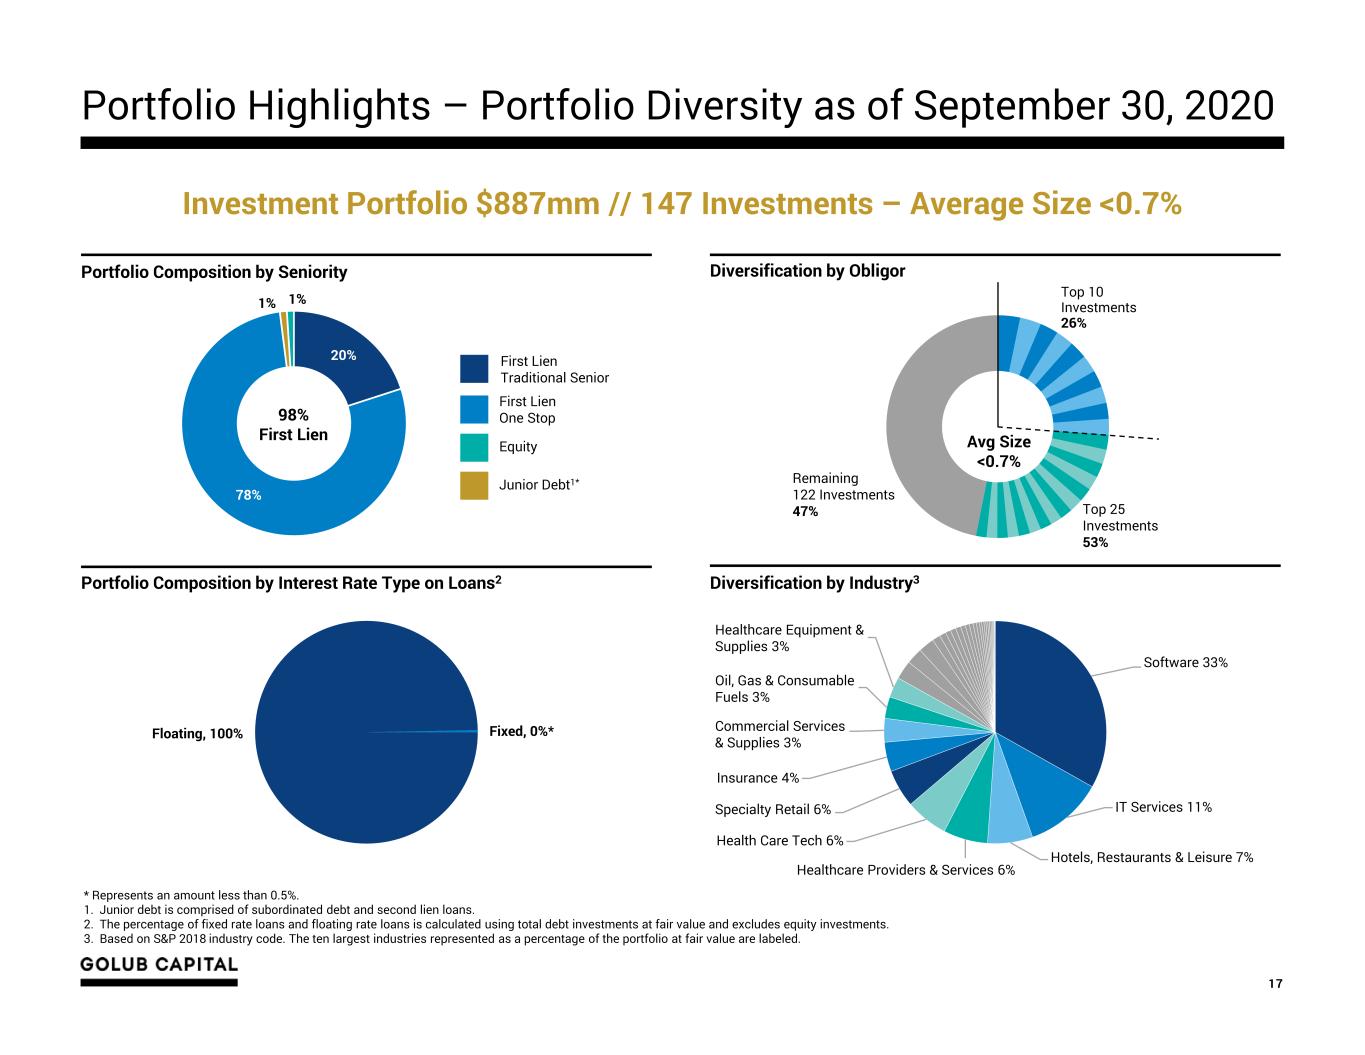
Portfolio Highlights – Portfolio Diversity as of September 30, 2020 17 * Represents an amount less than 0.5%. 1. Junior debt is comprised of subordinated debt and second lien loans. 2. The percentage of fixed rate loans and floating rate loans is calculated using total debt investments at fair value and excludes equity investments. 3. Based on S&P 2018 industry code. The ten largest industries represented as a percentage of the portfolio at fair value are labeled. Portfolio Composition by Seniority Diversification by Obligor 20% 78% 1% 1% Equity Junior Debt1* First Lien One Stop First Lien Traditional Senior 98% First Lien Top 25 Investments 53% Remaining 122 Investments 47% Top 10 Investments 26% Avg Size <0.7% Portfolio Composition by Interest Rate Type on Loans2 Floating, 100% Fixed, 0%* Diversification by Industry3 Investment Portfolio $887mm // 147 Investments – Average Size <0.7% Software 33% IT Services 11% Hotels, Restaurants & Leisure 7% Healthcare Providers & Services 6% Health Care Tech 6% Specialty Retail 6% Insurance 4% Commercial Services & Supplies 3% Oil, Gas & Consumable Fuels 3% Healthcare Equipment & Supplies 3%
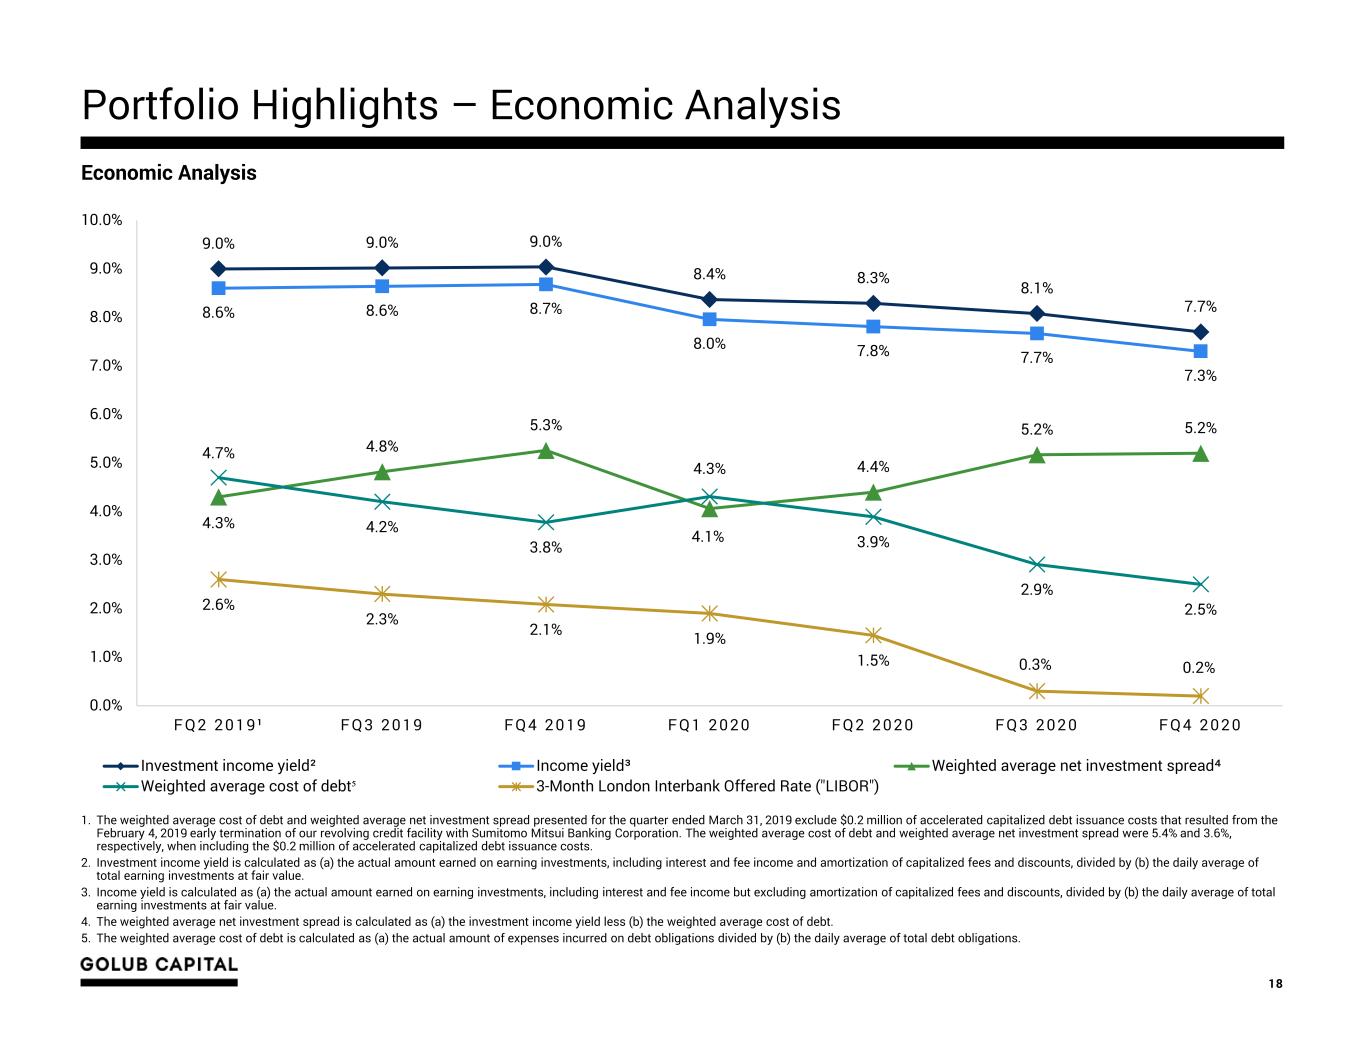
1. The weighted average cost of debt and weighted average net investment spread presented for the quarter ended March 31, 2019 exclude $0.2 million of accelerated capitalized debt issuance costs that resulted from the February 4, 2019 early termination of our revolving credit facility with Sumitomo Mitsui Banking Corporation. The weighted average cost of debt and weighted average net investment spread were 5.4% and 3.6%, respectively, when including the $0.2 million of accelerated capitalized debt issuance costs. 2. Investment income yield is calculated as (a) the actual amount earned on earning investments, including interest and fee income and amortization of capitalized fees and discounts, divided by (b) the daily average of total earning investments at fair value. 3. Income yield is calculated as (a) the actual amount earned on earning investments, including interest and fee income but excluding amortization of capitalized fees and discounts, divided by (b) the daily average of total earning investments at fair value. 4. The weighted average net investment spread is calculated as (a) the investment income yield less (b) the weighted average cost of debt. 5. The weighted average cost of debt is calculated as (a) the actual amount of expenses incurred on debt obligations divided by (b) the daily average of total debt obligations. 18 Economic Analysis Portfolio Highlights – Economic Analysis 9.0% 9.0% 9.0% 8.4% 8.3% 8.1% 7.7%8.6% 8.6% 8.7% 8.0% 7.8% 7.7% 7.3% 4.3% 4.8% 5.3% 4.1% 4.4% 5.2% 5.2% 4.7% 4.2% 3.8% 4.3% 3.9% 2.9% 2.5%2.6% 2.3% 2.1% 1.9% 1.5% 0.3% 0.2% 0.0% 1.0% 2.0% 3.0% 4.0% 5.0% 6.0% 7.0% 8.0% 9.0% 10.0% F Q 2 2 0 1 9 ¹ F Q 3 2 0 1 9 F Q 4 2 0 1 9 F Q 1 2 0 2 0 F Q 2 2 0 2 0 F Q 3 2 0 2 0 F Q 4 2 0 2 0 Investment income yield² Income yield³ Weighted average net investment spread⁴ Weighted average cost of debt⁵ 3-Month London Interbank Offered Rate ("LIBOR")
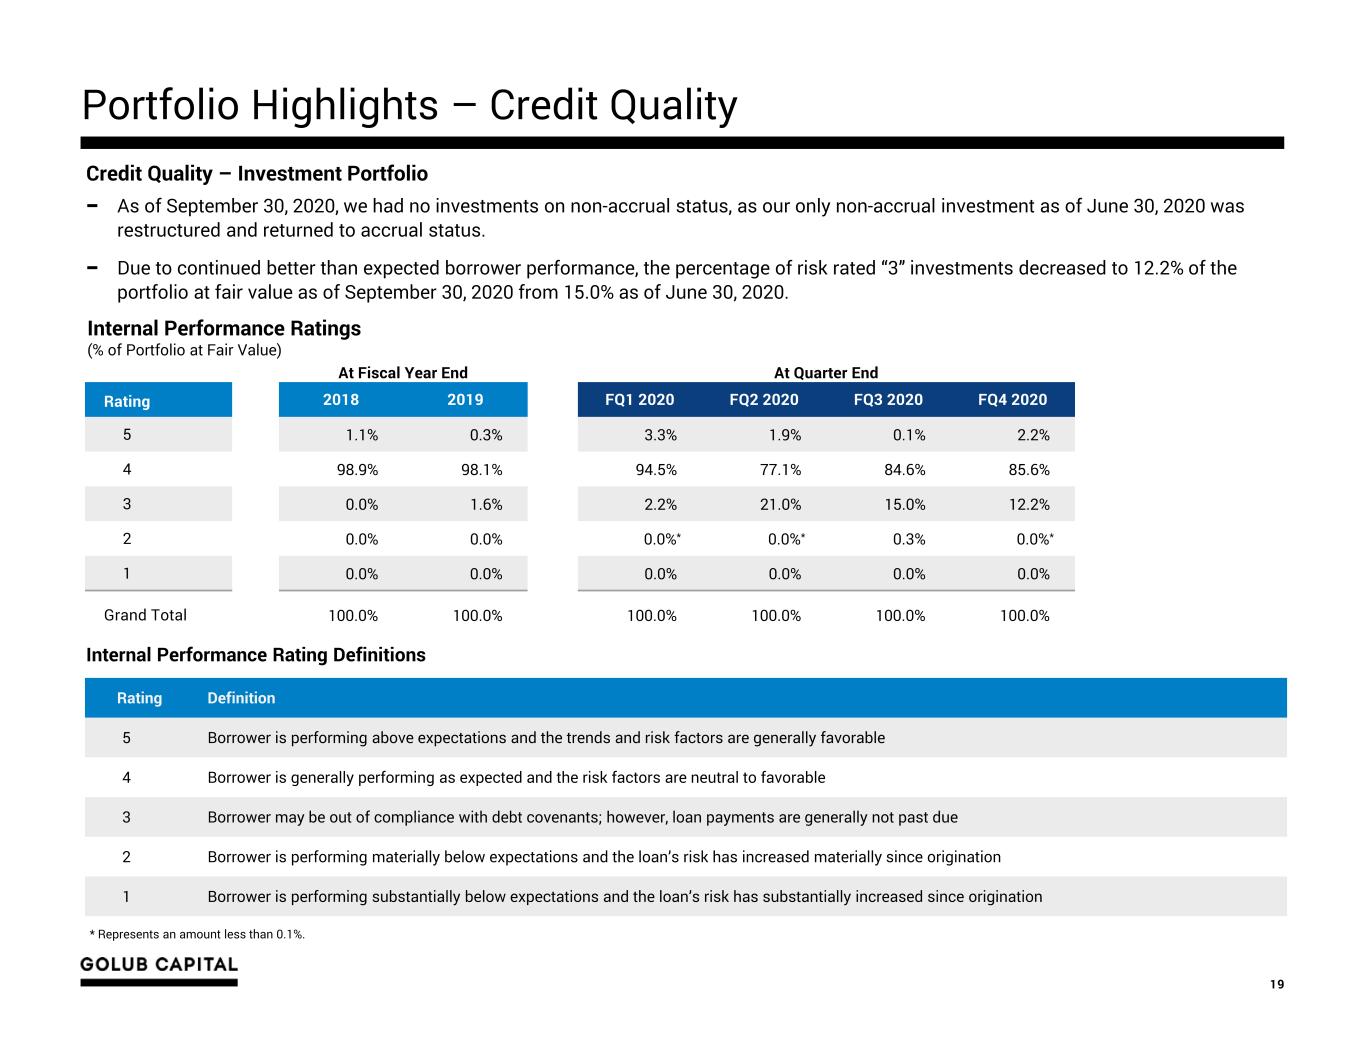
Portfolio Highlights – Credit Quality 19 Credit Quality – Investment Portfolio − As of September 30, 2020, we had no investments on non-accrual status, as our only non-accrual investment as of June 30, 2020 was restructured and returned to accrual status. − Due to continued better than expected borrower performance, the percentage of risk rated “3” investments decreased to 12.2% of the portfolio at fair value as of September 30, 2020 from 15.0% as of June 30, 2020. * Represents an amount less than 0.1%. Internal Performance Ratings (% of Portfolio at Fair Value) Rating Definition 5 Borrower is performing above expectations and the trends and risk factors are generally favorable 4 Borrower is generally performing as expected and the risk factors are neutral to favorable 3 Borrower may be out of compliance with debt covenants; however, loan payments are generally not past due 2 Borrower is performing materially below expectations and the loan’s risk has increased materially since origination 1 Borrower is performing substantially below expectations and the loan’s risk has substantially increased since origination Internal Performance Rating Definitions At Fiscal Year End At Quarter End Rating 2018 2019 FQ1 2020 FQ2 2020 FQ3 2020 FQ4 2020 5 1.1% 0.3% 3.3% 1.9% 0.1% 2.2% 4 98.9% 98.1% 94.5% 77.1% 84.6% 85.6% 3 0.0% 1.6% 2.2% 21.0% 15.0% 12.2% 2 0.0% 0.0% 0.0%* 0.0%* 0.3% 0.0%* 1 0.0% 0.0% 0.0% 0.0% 0.0% 0.0% Grand Total 100.0% 100.0% 100.0% 100.0% 100.0% 100.0%
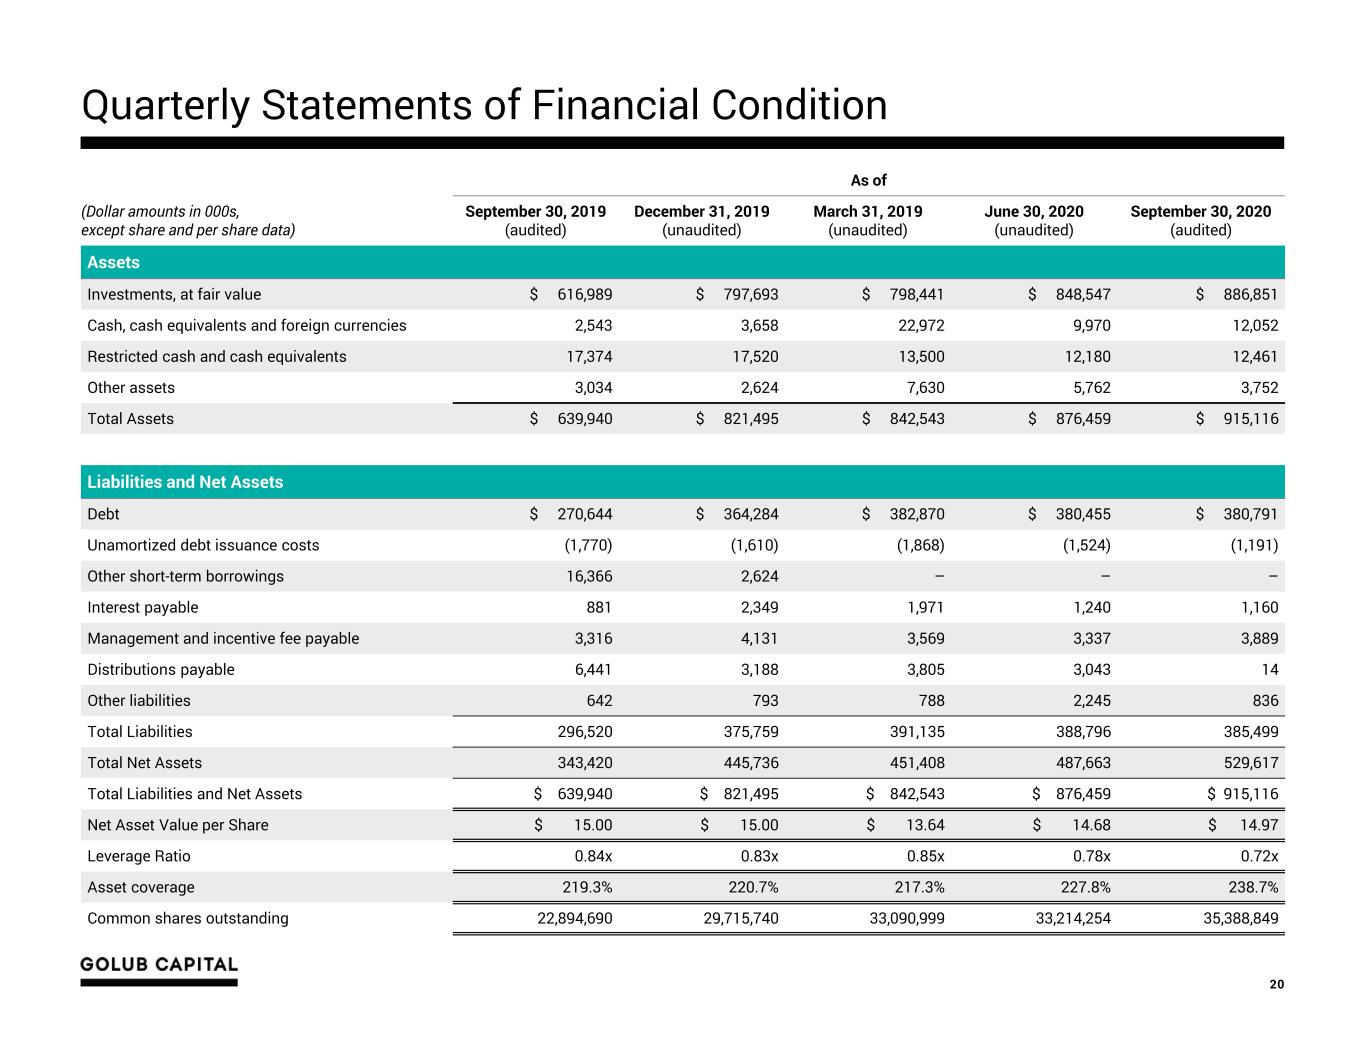
Quarterly Statements of Financial Condition 20 As of (Dollar amounts in 000s, except share and per share data) September 30, 2019 (audited) December 31, 2019 (unaudited) March 31, 2019 (unaudited) June 30, 2020 (unaudited) September 30, 2020 (audited) Assets Investments, at fair value $ 616,989 $ 797,693 $ 798,441 $ 848,547 $ 886,851 Cash, cash equivalents and foreign currencies 2,543 3,658 22,972 9,970 12,052 Restricted cash and cash equivalents 17,374 17,520 13,500 12,180 12,461 Other assets 3,034 2,624 7,630 5,762 3,752 Total Assets $ 639,940 $ 821,495 $ 842,543 $ 876,459 $ 915,116 Liabilities and Net Assets Debt $ 270,644 $ 364,284 $ 382,870 $ 380,455 $ 380,791 Unamortized debt issuance costs (1,770) (1,610) (1,868) (1,524) (1,191) Other short-term borrowings 16,366 2,624 – – – Interest payable 881 2,349 1,971 1,240 1,160 Management and incentive fee payable 3,316 4,131 3,569 3,337 3,889 Distributions payable 6,441 3,188 3,805 3,043 14 Other liabilities 642 793 788 2,245 836 Total Liabilities 296,520 375,759 391,135 388,796 385,499 Total Net Assets 343,420 445,736 451,408 487,663 529,617 Total Liabilities and Net Assets $ 639,940 $ 821,495 $ 842,543 $ 876,459 $ 915,116 Net Asset Value per Share $ 15.00 $ 15.00 $ 13.64 $ 14.68 $ 14.97 Leverage Ratio 0.84x 0.83x 0.85x 0.78x 0.72x Asset coverage 219.3% 220.7% 217.3% 227.8% 238.7% Common shares outstanding 22,894,690 29,715,740 33,090,999 33,214,254 35,388,849
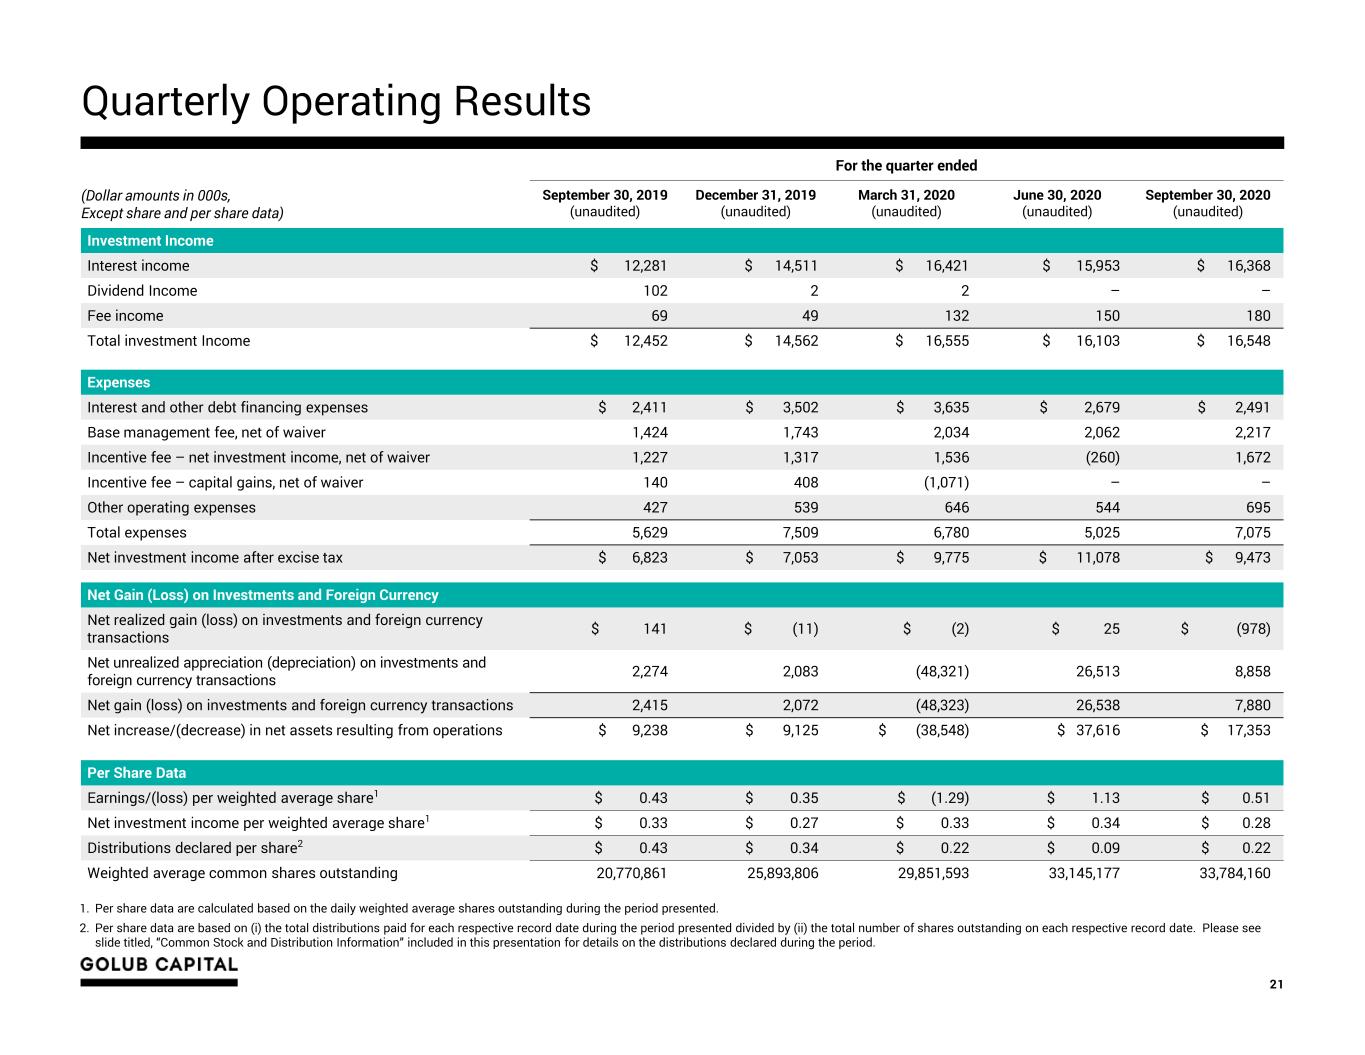
Quarterly Operating Results 21 1. Per share data are calculated based on the daily weighted average shares outstanding during the period presented. 2. Per share data are based on (i) the total distributions paid for each respective record date during the period presented divided by (ii) the total number of shares outstanding on each respective record date. Please see slide titled, “Common Stock and Distribution Information” included in this presentation for details on the distributions declared during the period. For the quarter ended (Dollar amounts in 000s, Except share and per share data) September 30, 2019 (unaudited) December 31, 2019 (unaudited) March 31, 2020 (unaudited) June 30, 2020 (unaudited) September 30, 2020 (unaudited) Investment Income Interest income $ 12,281 $ 14,511 $ 16,421 $ 15,953 $ 16,368 Dividend Income 102 2 2 – – Fee income 69 49 132 150 180 Total investment Income $ 12,452 $ 14,562 $ 16,555 $ 16,103 $ 16,548 Expenses Interest and other debt financing expenses $ 2,411 $ 3,502 $ 3,635 $ 2,679 $ 2,491 Base management fee, net of waiver 1,424 1,743 2,034 2,062 2,217 Incentive fee – net investment income, net of waiver 1,227 1,317 1,536 (260) 1,672 Incentive fee – capital gains, net of waiver 140 408 (1,071) – – Other operating expenses 427 539 646 544 695 Total expenses 5,629 7,509 6,780 5,025 7,075 Net investment income after excise tax $ 6,823 $ 7,053 $ 9,775 $ 11,078 $ 9,473 Net Gain (Loss) on Investments and Foreign Currency Net realized gain (loss) on investments and foreign currency transactions $ 141 $ (11) $ (2) $ 25 $ (978) Net unrealized appreciation (depreciation) on investments and foreign currency transactions 2,274 2,083 (48,321) 26,513 8,858 Net gain (loss) on investments and foreign currency transactions 2,415 2,072 (48,323) 26,538 7,880 Net increase/(decrease) in net assets resulting from operations $ 9,238 $ 9,125 $ (38,548) $ 37,616 $ 17,353 Per Share Data Earnings/(loss) per weighted average share1 $ 0.43 $ 0.35 $ (1.29) $ 1.13 $ 0.51 Net investment income per weighted average share1 $ 0.33 $ 0.27 $ 0.33 $ 0.34 $ 0.28 Distributions declared per share2 $ 0.43 $ 0.34 $ 0.22 $ 0.09 $ 0.22 Weighted average common shares outstanding 20,770,861 25,893,806 29,851,593 33,145,177 33,784,160
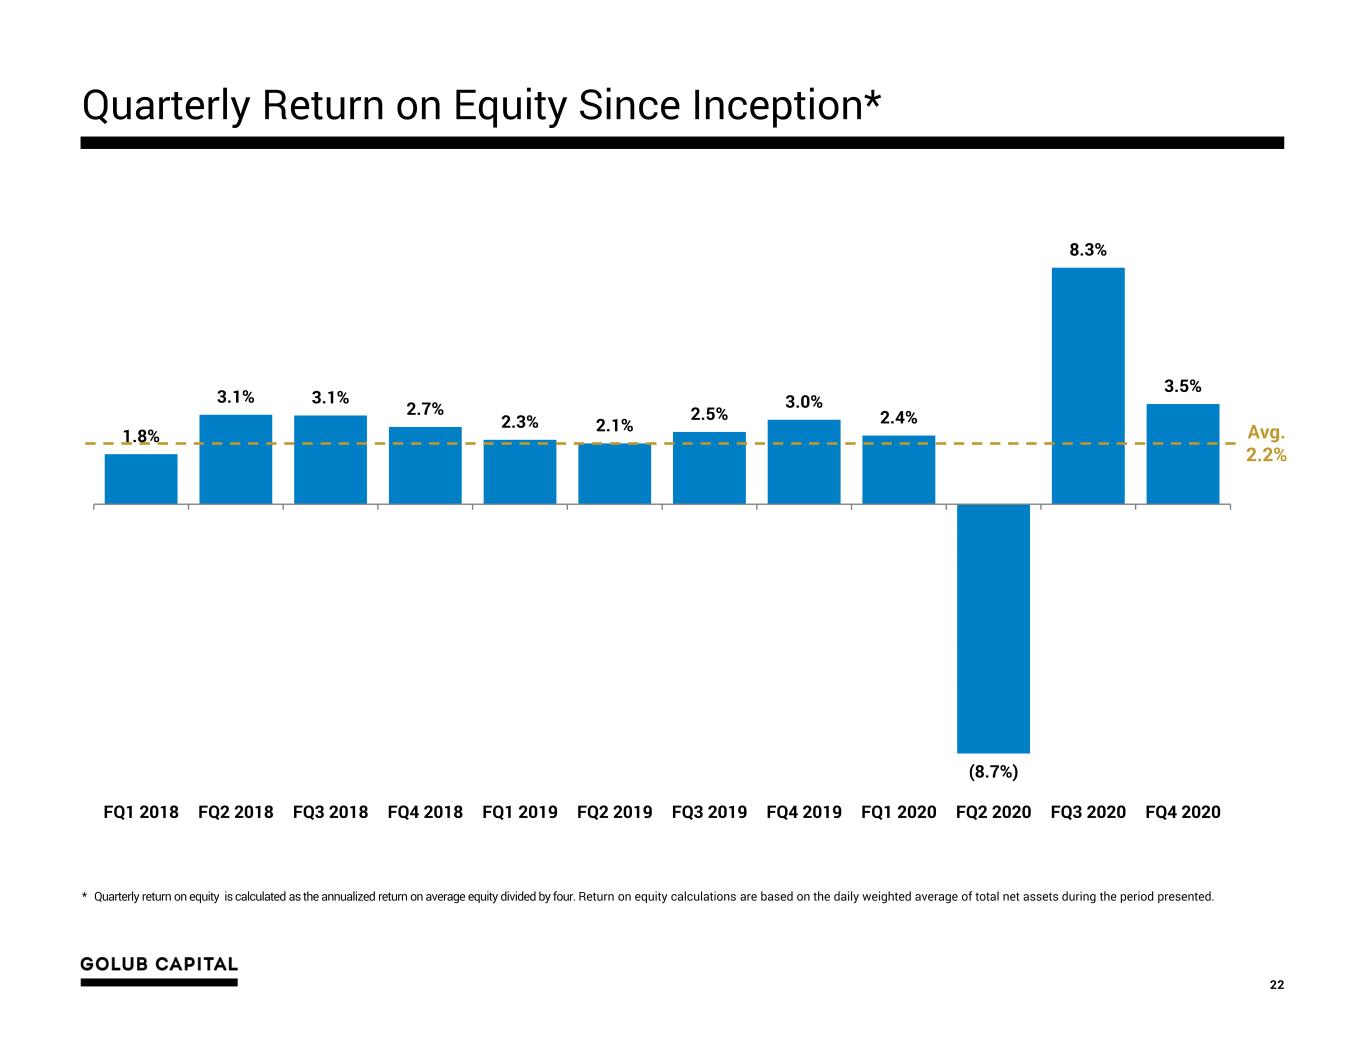
1.8% 3.1% 3.1% 2.7% 2.3% 2.1% 2.5% 3.0% 2.4% (8.7%) 8.3% 3.5% FQ1 2018 FQ2 2018 FQ3 2018 FQ4 2018 FQ1 2019 FQ2 2019 FQ3 2019 FQ4 2019 FQ1 2020 FQ2 2020 FQ3 2020 FQ4 2020 Quarterly Return on Equity Since Inception* * Quarterly return on equity is calculated as the annualized return on average equity divided by four. Return on equity calculations are based on the daily weighted average of total net assets during the period presented. 22 Avg. 2.2%
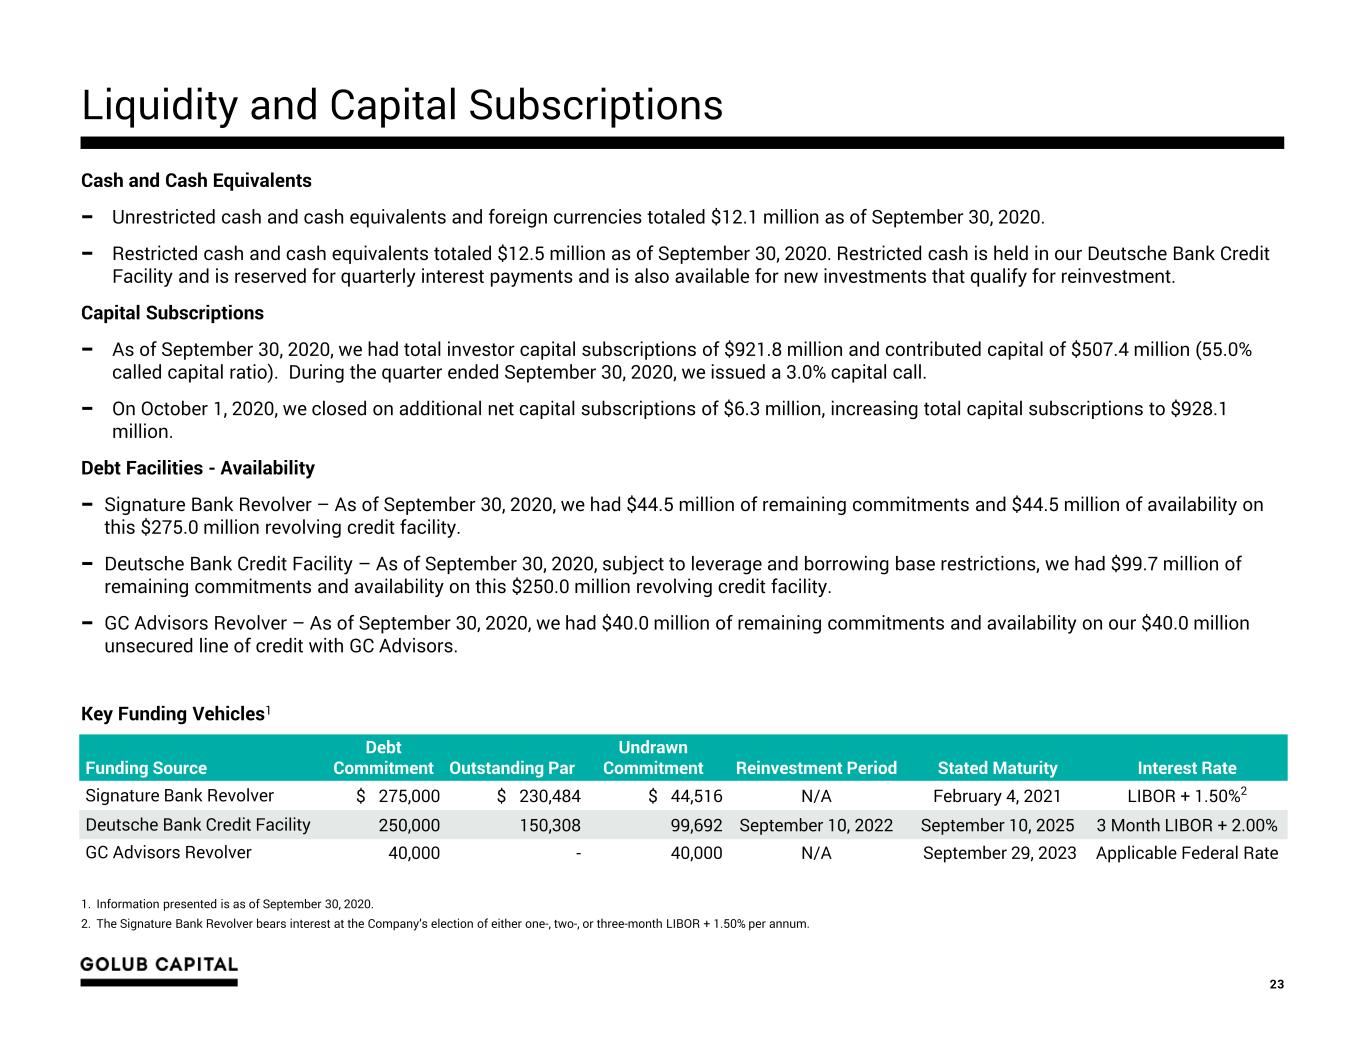
Liquidity and Capital Subscriptions 23 Cash and Cash Equivalents − Unrestricted cash and cash equivalents and foreign currencies totaled $12.1 million as of September 30, 2020. − Restricted cash and cash equivalents totaled $12.5 million as of September 30, 2020. Restricted cash is held in our Deutsche Bank Credit Facility and is reserved for quarterly interest payments and is also available for new investments that qualify for reinvestment. Capital Subscriptions − As of September 30, 2020, we had total investor capital subscriptions of $921.8 million and contributed capital of $507.4 million (55.0% called capital ratio). During the quarter ended September 30, 2020, we issued a 3.0% capital call. − On October 1, 2020, we closed on additional net capital subscriptions of $6.3 million, increasing total capital subscriptions to $928.1 million. Debt Facilities - Availability − Signature Bank Revolver – As of September 30, 2020, we had $44.5 million of remaining commitments and $44.5 million of availability on this $275.0 million revolving credit facility. − Deutsche Bank Credit Facility – As of September 30, 2020, subject to leverage and borrowing base restrictions, we had $99.7 million of remaining commitments and availability on this $250.0 million revolving credit facility. − GC Advisors Revolver – As of September 30, 2020, we had $40.0 million of remaining commitments and availability on our $40.0 million unsecured line of credit with GC Advisors. Key Funding Vehicles1 1. Information presented is as of September 30, 2020. 2. The Signature Bank Revolver bears interest at the Company’s election of either one-, two-, or three-month LIBOR + 1.50% per annum. Funding Source Debt Commitment Outstanding Par Undrawn Commitment Reinvestment Period Stated Maturity Interest Rate Signature Bank Revolver $ 275,000 $ 230,484 $ 44,516 N/A February 4, 2021 LIBOR + 1.50%2 Deutsche Bank Credit Facility 250,000 150,308 99,692 September 10, 2022 September 10, 2025 3 Month LIBOR + 2.00% GC Advisors Revolver 40,000 - 40,000 N/A September 29, 2023 Applicable Federal Rate
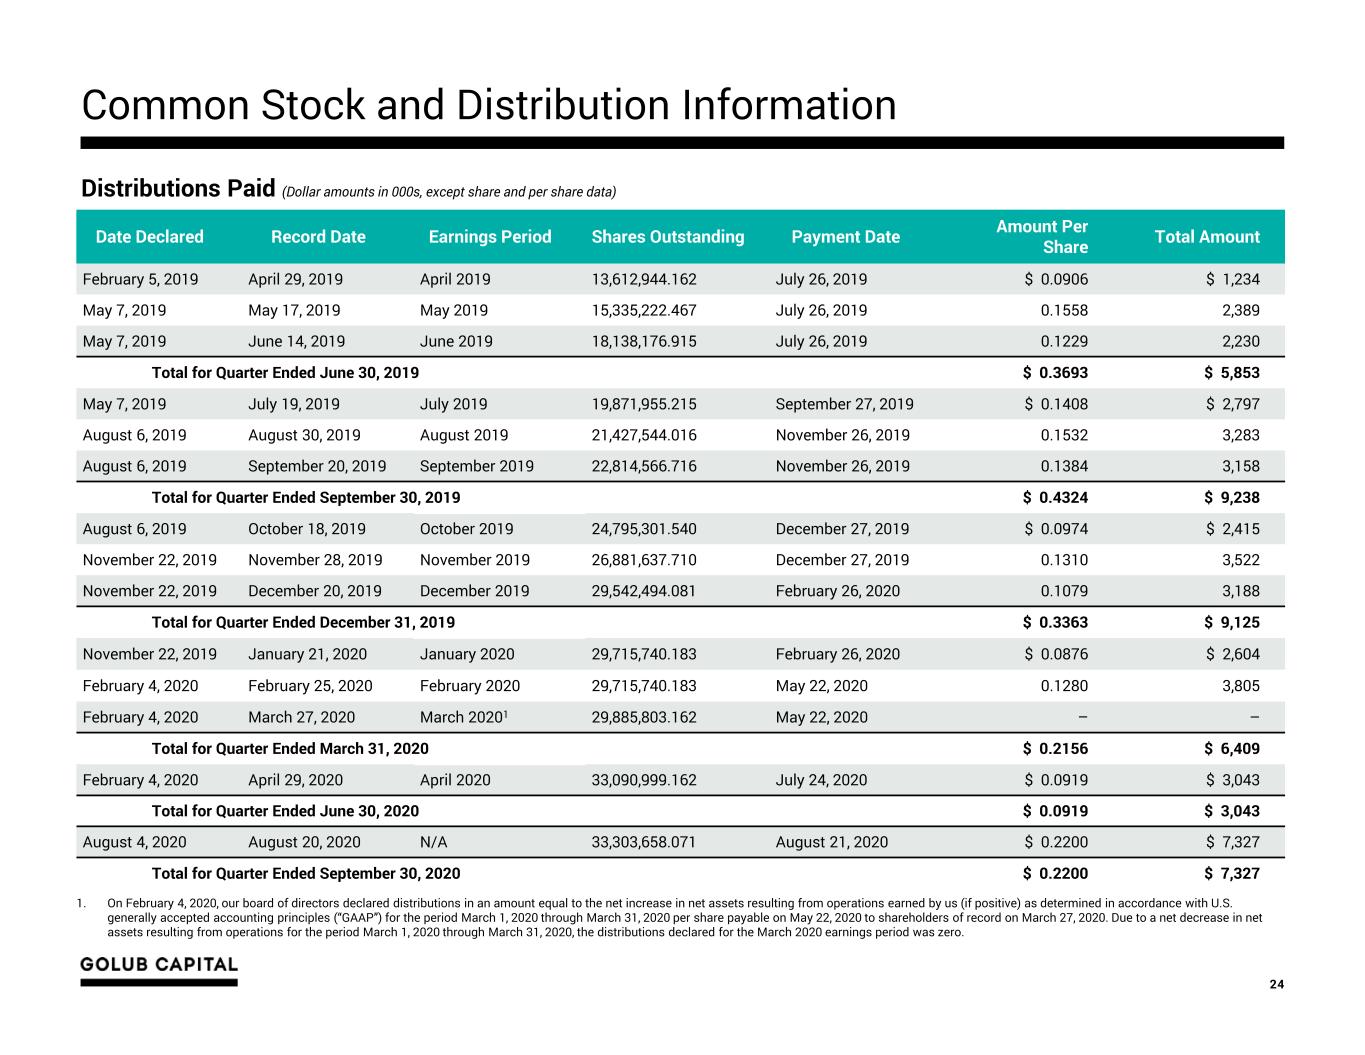
Common Stock and Distribution Information 24 Distributions Paid (Dollar amounts in 000s, except share and per share data) Distributions Declared Date Declared Record Date Earnings Period Shares Outstanding Payment Date Amount Per Share Total Amount February 5, 2019 April 29, 2019 April 2019 13,612,944.162 July 26, 2019 $ 0.0906 $ 1,234 May 7, 2019 May 17, 2019 May 2019 15,335,222.467 July 26, 2019 0.1558 2,389 May 7, 2019 June 14, 2019 June 2019 18,138,176.915 July 26, 2019 0.1229 2,230 Total for Quarter Ended June 30, 2019 $ 0.3693 $ 5,853 May 7, 2019 July 19, 2019 July 2019 19,871,955.215 September 27, 2019 $ 0.1408 $ 2,797 August 6, 2019 August 30, 2019 August 2019 21,427,544.016 November 26, 2019 0.1532 3,283 August 6, 2019 September 20, 2019 September 2019 22,814,566.716 November 26, 2019 0.1384 3,158 Total for Quarter Ended September 30, 2019 $ 0.4324 $ 9,238 August 6, 2019 October 18, 2019 October 2019 24,795,301.540 December 27, 2019 $ 0.0974 $ 2,415 November 22, 2019 November 28, 2019 November 2019 26,881,637.710 December 27, 2019 0.1310 3,522 November 22, 2019 December 20, 2019 December 2019 29,542,494.081 February 26, 2020 0.1079 3,188 Total for Quarter End d December 31, 2019 $ 0.3363 $ 9,125 November 22, 2019 January 21, 2020 January 2020 29,715,740.183 February 26, 2020 $ 0.0876 $ 2,604 February 4, 2020 February 25, 2020 February 2020 29,715,740.183 May 22, 2020 0.1280 3,805 February 4, 2020 March 27, 2020 March 20201 29,885,803.162 May 22, 2020 – – Total for Quarter Ended March 31, 2020 $ 0.2156 $ 6,409 February 4, 2020 April 29, 2020 April 2020 33,090,999.162 July 24, 2020 $ 0.0919 $ 3,043 Total for Quarter Ended June 30, 2020 $ 0.0919 $ 3,043 August 4, 2020 August 20, 2020 N/A 33,303,658.071 August 21, 2020 $ 0.2200 $ 7,327 Total for Quarter Ended September 30, 2020 $ 0.2200 $ 7,327 1. On February 4, 2020, our board of directors declared distributions in an amount equal to the net increase in net assets resulting from operations earned by us (if positive) as determined in accordance with U.S. generally accepted accounting principles (“GAAP”) for the period March 1, 2020 through March 31, 2020 per share payable on May 22, 2020 to shareholders of record on March 27, 2020. Due to a net decrease in net assets resulting from operations for the period March 1, 2020 through March 31, 2020, the distributions declared for the March 2020 earnings period was zero.
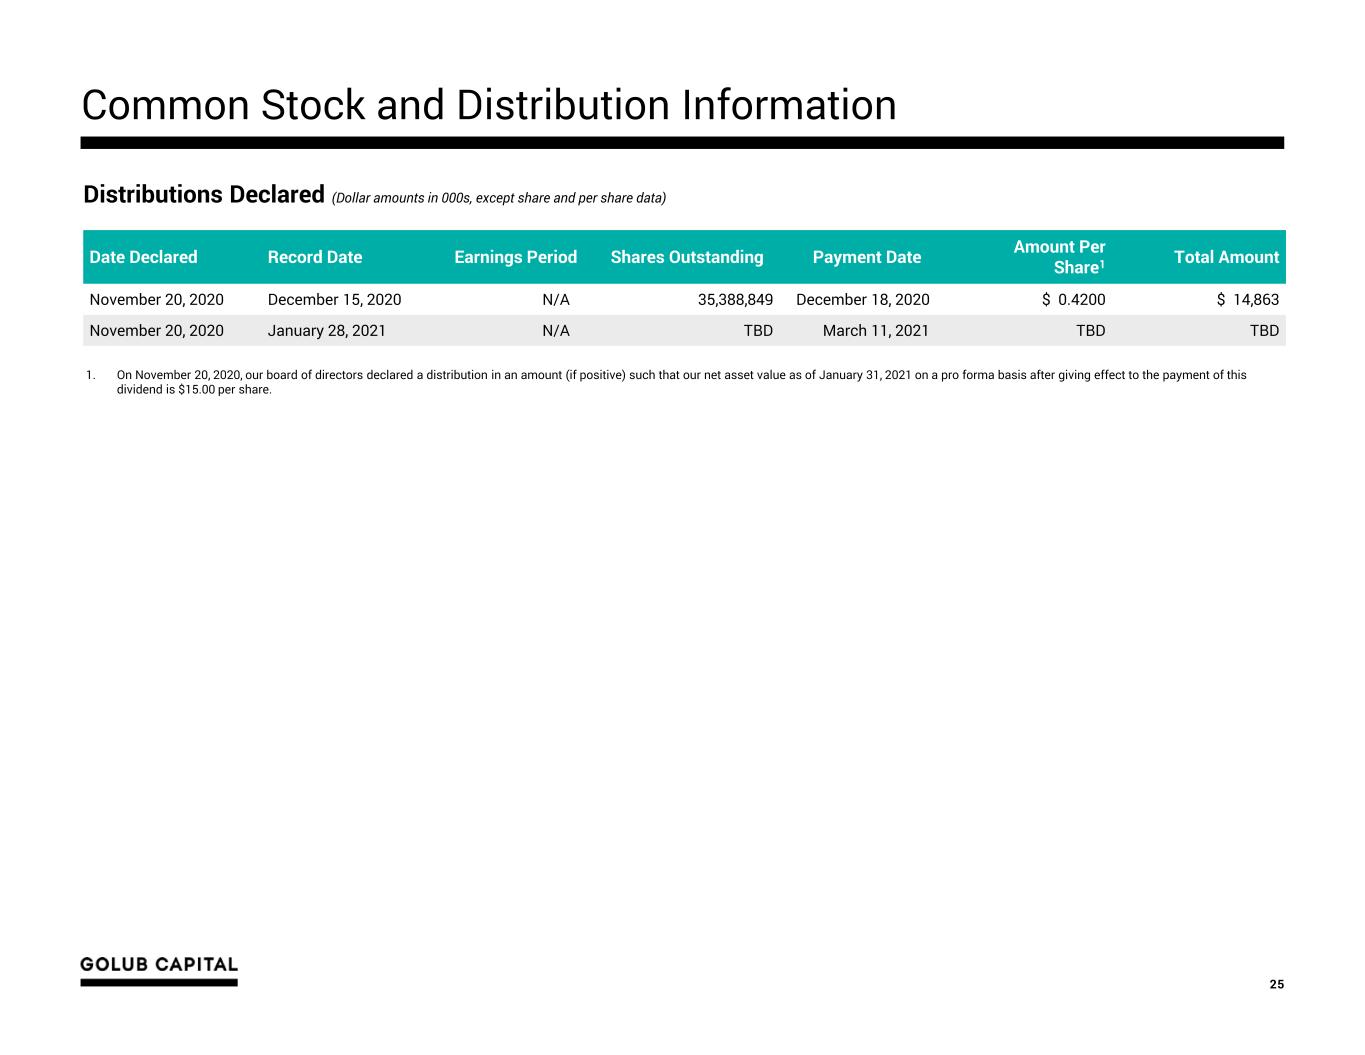
Common Stock and Distribution Information 25 Distributions Declared (Dollar amounts in 000s, except share and per share data) Date Declared Record Date Earnings Period Shares Outstanding Payment Date Amount Per Share1 Total Amount November 20, 2020 December 15, 2020 N/A 35,388,849 December 18, 2020 $ 0.4200 $ 14,863 November 20, 2020 January 28, 2021 N/A TBD March 11, 2021 TBD TBD 1. On November 20, 2020, our board of directors declared a distribution in an amount (if positive) such that our net asset value as of January 31, 2021 on a pro forma basis after giving effect to the payment of this dividend is $15.00 per share.
