Attached files
| file | filename |
|---|---|
| EX-32.2 - EX-32.2 - AZEK Co Inc. | d37420dex322.htm |
| EX-32.1 - EX-32.1 - AZEK Co Inc. | d37420dex321.htm |
| EX-31.2 - EX-31.2 - AZEK Co Inc. | d37420dex312.htm |
| EX-31.1 - EX-31.1 - AZEK Co Inc. | d37420dex311.htm |
| EX-23 - EX-23 - AZEK Co Inc. | d37420dex23.htm |
Table of Contents
UNITED STATES
SECURITIES AND EXCHANGE COMMISSION
Washington, D.C. 20549
FORM 10-K
| ☒ | ANNUAL REPORT PURSUANT TO SECTION 13 OR 15(d) OF THE SECURITIES EXCHANGE ACT OF 1934 |
For the fiscal year ended September 30, 2020
OR
| ☐ | TRANSITION REPORT PURSUANT TO SECTION 13 OR 15(d) OF THE SECURITIES EXCHANGE ACT OF 1934 |
For the transition period from to
Commission File Number 001-39322
The AZEK Company Inc.
(Exact name of Registrant as specified in its Charter)
| Delaware | 90-1017663 | |
| (State or other jurisdiction of incorporation or organization) |
(I.R.S. Employer Identification No.) | |
| 1330 W Fulton Street, Suite 350, Chicago, Illinois | 60607 | |
| (Address of principal executive offices) | (Zip Code) | |
Registrant’s telephone number, including area code: (877) 275-2935
Securities registered pursuant to Section 12(b) of the Act:
| Title of each class |
Trading Symbol |
Name of each exchange on which | ||
| Class A Common Stock, par value $0.001 per share | AZEK | The New York Stock Exchange |
Securities registered pursuant to Section 12(g) of the Act:
Indicate by check mark if the Registrant is a well-known seasoned issuer, as defined in Rule 405 of the Securities Act. YES ☐ NO ☒
Indicate by check mark if the Registrant is not required to file reports pursuant to Section 13 or 15(d) of the Act. YES ☐ NO ☒
Indicate by check mark whether the Registrant: (1) has filed all reports required to be filed by Section 13 or 15(d) of the Securities Exchange Act of 1934 during the preceding 12 months (or for such shorter period that the Registrant was required to file such reports), and (2) has been subject to such filing requirements for the past 90 days. YES ☒ NO ☐
Indicate by check mark whether the Registrant has submitted electronically every Interactive Data File required to be submitted pursuant to Rule 405 of Regulation S-T (§232.405 of this chapter) during the preceding 12 months (or for such shorter period that the Registrant was required to submit such files). YES ☒ NO ☐
Indicate by check mark whether the registrant is a large accelerated filer, an accelerated filer, a non-accelerated filer, smaller reporting company, or an emerging growth company. See the definitions of “large accelerated filer,” “accelerated filer,” “smaller reporting company,” and “emerging growth company” in Rule 12b-2 of the Exchange Act.
| Large accelerated filer | ☐ | Accelerated filer | ☐ | |||
| Non-accelerated filer | ☒ | Smaller reporting company | ☐ | |||
| Emerging growth company | ☒ | |||||
If an emerging growth company, indicate by check mark if the registrant has elected not to use the extended transition period for complying with any new or revised financial accounting standards provided pursuant to Section 13(a) of the Exchange Act. ☐
Indicate by check mark whether the registrant has filed a report on and attestation to its management’s assessment of the effectiveness of its internal control over financial reporting under Section 404(b) of the Sarbanes-Oxley Act (15 U.S.C. 7262(b)) by the registered public accounting firm that prepared or issued its audit report. ☐
Indicate by check mark whether the Registrant is a shell company (as defined in Rule 12b-2 of the Exchange Act). YES ☐ NO ☒
As of March 31, 2020, the last business day of the registrant’s most recently completed second fiscal quarter, there was no established public trading market for the registrant’s equity securities. The registrant’s Class A common stock began trading on the New York Stock Exchange on June 12, 2020.
As of November 30, 2020, the registrant had 154,637,240 shares of Class A Common Stock, $0.001 par value per share, and 100 shares of Class B Common Stock, $0.001 par value per share, outstanding.
Portions of the registrant’s definitive proxy statement for its 2021 Annual Meeting of Stockholders to be filed with the Securities and Exchange Commission within 120 days after the end of the fiscal year ended September 30, 2020 are incorporated by reference into Part III of this Annual Report on Form 10-K.
Table of Contents
| Page | ||||||
| Item 1. |
1 | |||||
| Item 1A. |
17 | |||||
| Item 1B. |
51 | |||||
| Item 2. |
51 | |||||
| Item 3. |
51 | |||||
| Item 4. |
52 | |||||
| Item 5. |
53 | |||||
| Item 6. |
55 | |||||
| Item 7. |
Management’s Discussion and Analysis of Financial Condition and Results of Operations |
61 | ||||
| Item 7A. |
87 | |||||
| Item 8. |
88 | |||||
| Item 9. |
Changes in and Disagreements With Accountants on Accounting and Financial Disclosure |
88 | ||||
| Item 9A. |
88 | |||||
| Item 9B. |
92 | |||||
| Item 10. |
93 | |||||
| Item 11. |
93 | |||||
| Item 12. |
Security Ownership of Certain Beneficial Owners and Management and Related Stockholder Matters |
93 | ||||
| Item 13. |
Certain Relationships and Related Transactions, and Director Independence |
93 | ||||
| Item 14. |
93 | |||||
| Item 15. |
94 | |||||
| Item 16 |
94 | |||||
i
Table of Contents
General
The AZEK Company Inc. (the Company, which may be referred to as AZEK, we or us) is an industry-leading designer and manufacturer of beautiful, low-maintenance residential and commercial building products and is committed to innovation, sustainability and research & development. Our predecessor was formed on August 15, 2013, and, in connection with our initial public offering, or our IPO, we became a Delaware corporation and changed our name to The AZEK Company Inc. on June 11, 2020. Our principal executive offices are located at 1330 W Fulton Street, Suite 350, Chicago, Illinois 60607, and our telephone number is 877-275-2935. AZEK operates highly automated manufacturing and recycling facilities in Ohio, Pennsylvania and Minnesota. Our website address is www.azekco.com.
Environmental and Social Responsibility; Corporate Governance
One of our core values is to “always do the right thing”. We make decisions according to what is right, not what is the cheapest, fastest or easiest, and we strive to always operate with integrity, transparency and with the customer in mind. In furtherance of that value, we are focused on sustainability across our operations and have adopted strategies to enable us to meet the growing demand for environmentally friendly products.
Under the direction of our chief executive officer and the board of directors, we are focused on achieving a high level of environmental and social responsibility and strong corporate governance. The Nominating and Corporate Governance Committee of our board of directors is responsible for overseeing our strategy on corporate social responsibility and sustainability, including environmental, social and governance, or ESG matters and related policies and communications. Additionally, we have established an internal ESG Steering Committee comprised of cross-functional leaders from across our organization that is focused on implementing ESG strategies and policies and reports directly to our chief executive officer.
Our corporate values serve as a belief system that guides how we work. These values influence our decisions, our interactions with colleagues and customers, and our standards for behavior. Our core value of “always do the right thing” is the foundation of our overarching commitment to ESG stewardship. In accordance with this commitment, we are a signatory to the United Nations Global Compact, a global initiative focused on advancing sustainable and responsible business practices related to human rights, labor, the environment and anti-corruption.
We operate our business in a manner that is centered on sustainability and promotes environmental stewardship across our value chain from product design to raw material sourcing and manufacturing to employee, customer and stakeholder communications and engagement. As part of the building materials industry, we believe that we can play a role in advancing the circular economy to create a more sustainable future by increasing the recycling of wood, plastic and water, monitoring our product lifecycle, reducing our carbon footprint and encouraging those in our supply chain to do the same. To demonstrate our commitment to sustainability, some of our actions include investing in a state-of-the-art recycling facility, increasing the amount of recycled content in our products, repurposing the scraps from our board-making process back into production, and deliberately sourcing and reusing hard-to-recycle materials that would traditionally end up in landfills.
We are also committed to social responsibility within our workforce and our community. We have evaluated and adopted certain human capital and human rights management policies to further our commitment to social responsibility. Our culture is driven by a shared passion for our values, mission and performance. It is an inclusive culture of innovative, growth-minded individuals committed to always doing the right thing, continuous improvement and solving problems for our customers and partners. We are focused on hiring and retaining diverse and highly talented employees and empowering them to create value. In our employee selection
1
Table of Contents
process and the operation of our business we adhere to equal employment opportunity policies and encourage the participation of our employees in training programs that will enhance their effectiveness in the performance of their duties. Our chief executive officer periodically leads employee meetings intended to encourage employees to understand why sustainability matters and regularly meets with small groups of employees to receive their feedback on the business. We also conduct employee engagement surveys annually. The results of these surveys allow us to identify areas of strength and opportunities for improvement to ensure continued satisfaction and retention of our employees. We provide attractive benefits that promote the health of our employees and their families and design compelling job opportunities, aligned with our values and mission, in an energizing work environment. We compensate our employees according to our fair remuneration policies and believe deeply in paying for performance. Therefore, employees generally receive a portion of their compensation in the form of share grants tied to performance. In conjunction with our 2020 initial public offering, we provided all employees an opportunity for ownership in our company by granting them shares of our Class A common stock.
Our Environmental, Health and Safety, or EHS Policy outlines our management programs and expectations throughout our operations and businesses. We manage operational hazards and risks to provide workplaces that are safe and healthy for our employees, visitors, contractors, customers, and the communities in which we operate. We train our employees, so they have the awareness, knowledge and skills to work in a safe and environmentally responsible manner. We continually are reviewing and improving our EHS performance through ongoing training, objectives and management systems.
As a company, we are committed to being responsible and respected citizens in the communities in which we live and work. We are dedicated to supporting organizations that help people live more productive, educated and enriched lives and encourage our employees to contribute their time to support various community and charitable activities in alignment with their values.
Our corporate governance policies set clear expectations and responsibilities for our leaders, employees and business partners to ensure we conduct our operations in a manner that is consistent with the highest standards of business ethics and accountability and is based on maintaining a close alignment of our interests with those of our stakeholders. Notable features of our corporate governance structure include the following:
| • | Eleven of our twelve directors have been determined to be independent for purposes of the New York Stock Exchange, or NYSE corporate governance listing standards and Rule 10A-3 under the Securities Exchange Act of 1934, as amended, or the Exchange Act. |
| • | Our non-executive chairperson of the board of directors convenes and chairs executive sessions of the independent directors to discuss certain matters without executive officers present. |
| • | Three of our directors qualify as an “audit committee financial expert” as defined by the Securities and Exchange Commission, or the SEC. |
| • | Two of our directors, including the chairperson of our Audit Committee, are women, and another three of our directors are considered of diverse ethnicity and race, constituting approximately 33% of our board of directors in furtherance of our board diversity policy. |
| • | Our Corporate Governance Guidelines provide for a target retirement age of 75 for our directors. |
| • | Our Insider Trading Policy prohibits the purchase or sale of our securities by any of our directors, officers, employees and consultants on the basis of material nonpublic information, and also prohibits our directors and officers from hedging our equity securities, holding such securities in a margin account or pledging such securities as collateral for a loan. |
| • | We have adopted a Clawback Policy whereby we are able to recoup performance- or incentive-based compensation in the event of an accounting restatement due to material noncompliance with any financial reporting requirements under the securities laws. |
| • | Our Nominating and Corporate Governance Committee oversees and directs our ESG strategies, activities, policies and communications. |
2
Table of Contents
In order to foster the highest standards of ethics and conduct in all business relationships, we have adopted a Code of Conduct and Ethics policy, or the Code of Conduct. This policy covers a wide range of business practices and procedures and applies to our officers, directors, employees, agents, representatives, and consultants. In addition and as a part of the Code of Conduct, we have implemented whistleblowing procedures that allow covered persons to report, on a confidential basis, concerns regarding, among other things, any questionable or unethical accounting, internal accounting controls or auditing matters with our Audit Committee as well as any potential Code of Conduct or ethics violations with our Nominating and Corporate Governance Committee or our Chief Legal Officer. We review all of these policies on a periodic basis with our employees.
Our business is managed by our executive officers, subject to the supervision and oversight of our board of directors. Our directors stay informed about our business by attending meetings of our board of directors and its committees and through supplemental reports and communications.
Business and Growth Strategies
We are an industry-leading designer and manufacturer of beautiful, low-maintenance and environmentally sustainable products focused on the highly attractive, large and fast-growing Outdoor Living market. Homeowners are continuing to invest in their outdoor spaces and are increasingly recognizing the significant advantages of long-lasting products, which are converting demand away from traditional materials, particularly wood. Our products transform those outdoor spaces by combining highly appealing aesthetics with significantly lower maintenance costs compared to traditional materials. Our innovative portfolio of Outdoor Living products, including decking, railing, exterior trim and accessories, inspires consumers to design outdoor spaces tailored to their unique lifestyle needs. We are well known in the industry, and we generally hold one of the top two market share positions by revenue in our product categories. In addition to our leading suite of Outdoor Living products, we sell a broad range of highly engineered products that are sold in commercial markets, including partitions, lockers and storage solutions. We are a leader in our product categories because of our significant scale, vertically-integrated manufacturing capabilities, extensive material science expertise and execution-focused management team.
Over our more than 30-year history, we have developed a reputation as a leading innovator in our markets by leveraging our differentiated manufacturing capabilities, material science and research and development, or R&D, expertise to capitalize on favorable secular growth trends that are accelerating material conversion from traditional materials such as wood, to sustainable, low-maintenance engineered materials, and to expand our markets. We believe our core competency of consistently launching new products into the market, combined with our recent investments in sales, marketing, R&D and manufacturing, will continue to solidify our incumbent position as a market leader and enable us to generate long-term demand for our products through economic cycles. Throughout our history, we have introduced numerous disruptive products and demonstrated our ability to drive material conversion and extend our portfolio, addressing consumer needs across a wide range of price segments. We have achieved a premium brand reputation through our unwavering commitment to our customers and developing innovative new products that combine the latest style and design trends with our differentiated material science expertise and proprietary production technologies. For example, we have launched products that take premium flooring trends, such as wire-brushed and hand-scraped finishes and multiple widths, into the decking market. Our competitive advantages enable us to create award-winning products and back them with some of the industry’s longest warranties, such as the 50-year fade & stain warranty that we offer on our TimberTech AZEK decking product line.
We have created an operating platform that is centered around sustainability, one of our core strategic pillars, which extends across our value chain from product design to raw material sourcing and manufacturing, and we increasingly utilize plastic waste, recycled wood and scrap in our products. We have also made significant recent investments in our recycling capabilities, including our recent acquisition of Return Polymers, which further enhance the sustainability of our manufacturing operations and reduce our costs. In fiscal year 2019, we opened a new polyethylene recycling facility that utilizes advanced technologies to transform a broad
3
Table of Contents
range of plastic waste into raw material used in our products. Today, our TimberTech PRO and EDGE decking lines offer high-quality products made from approximately 80% recycled material. Through our recycling programs, approximately 400 million pounds of waste and scrap were diverted from landfills in fiscal year 2020. Furthermore, approximately 98% of scrap generated is re-used, and the majority of our TimberTech, AZEK Exteriors and Versatex products are recyclable at the end of their useful lives.
We believe our multi-faceted growth and margin expansion strategy positions us to drive profitable above-market growth in the markets we serve. This strategy includes initiatives to:
| • | Accelerate market conversion by capitalizing on downstream investments across professional and retail channels; |
| • | Build the leading consumer brand in outdoor living; |
| • | Introduce innovative new products that expand our markets; |
| • | Expand margins through enhanced recycling capabilities and productivity initiatives; and |
| • | Execute strategic acquisitions that broaden our platform and enhance our manufacturing operations. |
Our Industry
Our products are widely used across several large, attractive markets, including residential and commercial end markets. We primarily serve the Outdoor Living market, which we define as the market for decking, railing, trim, wood and wood-look siding, porches, pavers, outdoor furniture, outdoor cabinetry and outdoor lighting designed to enhance the utility and improve the aesthetics of outdoor living spaces, with our highly-engineered decking, railing and exteriors products, which have benefitted from increased investment as homeowners choose to spend more leisure time outdoors and as the appeal of low- to no-maintenance building and home products gains momentum. We believe that consumers are increasingly environmentally-conscious in their purchasing behaviors and that our sustainable manufacturing practices and the high recycled content of our products address evolving consumer preferences.
Based on data provided by Principia Consulting, LLC, a third-party industry research and consulting firm, or Principia, the total U.S. market sales of residential decking, railing and exterior trim products were $7.6 billion in 2019 and grew at a 6.5% compound annual growth rate, or CAGR, from 2014 to 2019 on a linear foot basis. With respect to the individual components of the Outdoor Living market, the decking, railing and exterior trim markets were approximately $3.3 billion, $2.2 billion and $2.1 billion, respectively, in 2019. In terms of volume, the decking, railing and exterior trim markets were approximately 3.3 billion, 160.0 million and 2.0 billion linear feet, respectively, in 2019.
Composite decking (which includes wood composite and cellular PVC decking), railing and exterior trim products have continued to increase market share relative to other materials due to their superior and low-maintenance product qualities. Based on data provided by Principia, between 2014 and 2019, composite decking, composite and aluminum railing and PVC trim products collectively grew at a CAGR of 10.0% as compared to decking, railing and trim manufactured from wood, which grew at a CAGR of 5.8%, in each case measured in terms of linear feet. We believe the market for composite products will continue to increase at an above-market growth rate as it benefits from material conversion.
Based on data provided by Principia, there were approximately 58 million decks in the United States as of 2019, of which approximately 5.5 million were built in 2019, up from approximately 4.1 million in 2014, representing a CAGR of 5.8%. Based on the same industry data, wood represented approximately 65% of the total U.S. decking, railing and trim markets based on 2019 linear feet sold. With respect to the individual components of these markets, based on this data, composite decking represented approximately 20% of the decking market, composite and aluminum railing represented approximately 16% of the railing market and PVC trim products represented approximately 11% of the trim market, each in terms of linear feet.
4
Table of Contents
Our Brands and Products
We currently operate in two reportable segments: Residential and Commercial. We leverage a shared material technology and U.S.-based manufacturing platform to create an extensive range of long-lasting and low-maintenance products that convert demand away from traditional materials. Our Residential segment serves the high-growth Outdoor Living market by offering products that inspire consumers to design outdoor spaces tailored to their individual lifestyles. Our innovative portfolio of Outdoor Living products, including decking, railing, exterior trim and accessories, are sold under our TimberTech, AZEK Exteriors, VERSATEX and ULTRALOX brands. Our Commercial segment addresses demand for low-maintenance, highly engineered products in a variety of commercial and industrial markets, including the outdoor, graphic displays and signage, educational and recreational markets, as well as the food processing and chemical industries. Products sold by our Commercial segment include highly engineered polymer sheeting as well as partitions, lockers and storage solutions.
Residential Segment
In our Residential segment, we design and manufacture engineered Outdoor Living products, including decking, railing, trim and moulding and accessories that drive conversion away from wood and other traditional materials. These products are primarily capped wood composites and PVC that are aesthetically similar, yet functionally superior, to finished wood, as they require less maintenance, do not rot or warp, are resistant to water, insects, stains, moisture, mold, mildew, scuffs and scratching, and do not require painting or staining for protection. Many of our products are also designed to ease installation for contractors and builders and reduce lifetime maintenance costs for consumers, without sacrificing aesthetics. We believe these factors, combined with some of the industry’s longest warranties and a comprehensive range of on-trend color palettes and styles, drive contractor loyalty and offer a compelling choice for consumers looking to reinvent their outdoor living spaces and the exteriors of their homes.
In fiscal year 2020, our Residential segment generated net sales of $771.2 million, representing approximately 86% of our total net sales. Our Residential segment consists of Deck, Rail & Accessories which is approximately 62% of total consolidated net sales and Exteriors which is approximately 24% of total consolidated net sales. Demand for our Residential segment products is largely driven by repair and remodel activity, which we estimate accounted for approximately 80% of our Residential segment net sales in fiscal year 2020 with the remaining sales attributable to new construction activity.
Decking
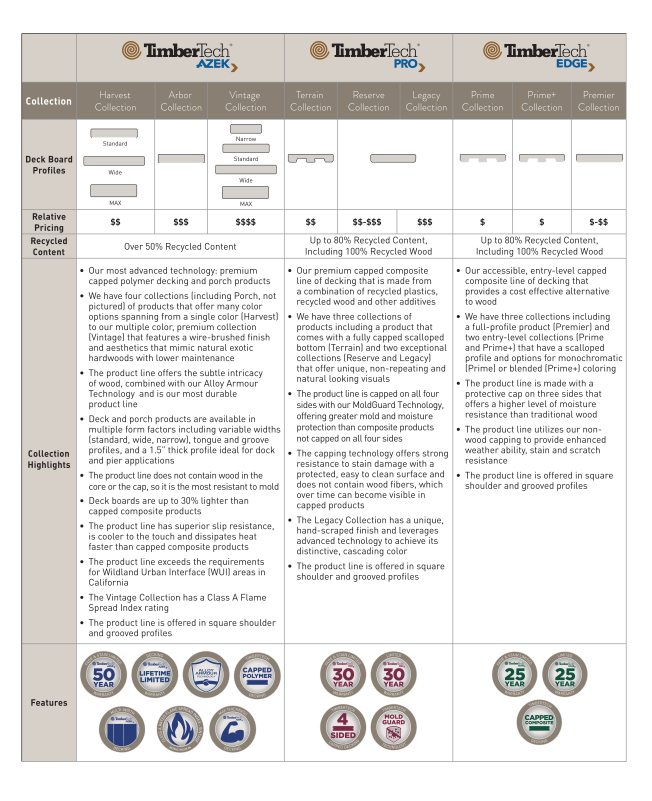
We are one of the only decking manufacturers to offer both capped wood composite and PVC decking products, and we believe we are the only manufacturer to offer narrow and wide-width PVC deck boards. Our decking products transform consumers’ outdoor areas into aesthetically appealing spaces, while reducing lifetime maintenance costs as compared to those made with traditional materials. These high-quality, innovative products are artfully crafted with a broad range of design options and distinguishing features, such as cascading or variegated tones to emulate the natural look and finish of wood. Our products are long lasting and often a more cost-effective alternative over time than products made of traditional materials such as wood, which can fade quickly, require frequent sanding, staining and maintenance and are prone to rot, splinter and crack. In addition, our decking products span a wide range of entry-level to premium price points and are covered by some of the industry’s longest warranties. We are also committed to sustainability and to manufacturing our products with recycled waste and scrap. The wood used in the core of our decking products is 100% recycled, and we do not use any virgin timber. We continue to expand our use of recycled materials in our decking products, such as in our TimberTech PRO and EDGE decking product lines, which offer products made from approximately 80% recycled material.
5
Table of Contents
Through our three primary decking product lines—TimberTech AZEK, TimberTech PRO and TimberTech EDGE—we offer a broad range of colors, textures and styles to provide consumers with a myriad of design options at a variety of price points.
6
Table of Contents
Our decking product lines are complemented by our porch collection as well as our broad range of decking accessories, including in-deck and riser lighting, risers for use on stairs, fascia, end coating, flashing and joist tape and our TimberTech Deck Cleaner. Our growing portfolio of porch board products leverages the same materials and production technologies as our industry-leading decking products and allows us to deliver similar design aesthetics and low-maintenance benefits across a variety of textures. Our composite pavers provide a lightweight and easy-to-install alternative to traditional pavers and are available in a variety of colors and styles for landscaping, resurfacing and rooftop patio applications. We offer a broad range of high-quality fasteners that enable an efficient installation, safe fastening and superior aesthetics, including traditional fasteners, which are color-matched to the decking product and are offered in both coated carbon steel and stainless steel; concealed fasteners, which are covered with a color-matching cap to blend into the associated decking product; and hidden fasteners, which are fastened out of sight under the decking boards.
Railing
Our railing solutions enable consumers to accent their outdoor living spaces with attractive, high-quality, low-maintenance composite and aluminum railing products, which we offer through our TimberTech and ULTRALOX brands. Our railing products reduce the need for ongoing maintenance by eliminating many of the major functional disadvantages of traditional materials, such as warping and rust, and thus are often a more cost effective alternative over time. For example, our TimberTech composite railing products are covered by a four sided cap, which eliminates the need for annual sanding, staining, sealing and painting, and our TimberTech aluminum railing products feature a powder coated surface, which produces a long-lasting, color-durable, moisture-resistant finish.
Our railing products are available in various materials and in a broad range of colors, finishes and styles, including traditional, modern and minimalist designs, and we offer a wide selection of infill options, such as composite and aluminum balusters, cable rails and glass channel kits. Our aluminum railing products are lighter weight and easier to install than other metal railing materials, and their sleek, minimalistic designs allow unobstructed views, especially when coupled with a glass or cable infill option. Our railing products are diverse and highly customizable, and, in addition to complementing our decking product lines, they also appeal to a broader, stand-alone market, such as for use on decks constructed from traditional materials and in commercial applications.
We believe we are particularly well positioned to serve the fast growing aluminum railing market following our 2017 acquisition of Ultralox Technology, LLC, or Ultralox, which significantly expanded our aluminum railing product capabilities. Using Ultralox’s proprietary Interlocking Machine, a dealer or contractor can create a customized aluminum, pre-panelized, interlocking railing system on site. This facilitates faster and easier assembly and installation without special tools, mechanical fasteners or welding for both residential and commercial applications and overcomes the design limitations of pre-fabricated railing products. Our TimberTech brand also sells a pre-panelized version of the Ultralox railing kit branded as Impression Rail Express.
To complement our railing products, we offer an array of functional and decorative accessories, including drink railings, mounting posts, under-rail lights and lighted island caps and gate kits. Our decking, railing and related accessory products are frequently used in combination in order to enable consumers to create their own highly customized outdoor living spaces.
Trim and Moulding
We are the leading designer and manufacturer of PVC trim and moulding products for the Outdoor Living market. We operate two large PVC trim manufacturing plants and offer a diverse portfolio of PVC trim and moulding products through our AZEK Exteriors and VERSATEX brands. Our trim and moulding products are aesthetically similar to wood and can be easily milled, routed or shaped for use in almost any application. Our
7
Table of Contents
products are moisture- and insect-resistant and are more durable and require less maintenance than traditional wood products. Contractors and homeowners can use our products in conventional applications, to express their creativity through unique home exteriors, and to complement our decking and railing products. For example, two-story decks are often paired with column wraps, canvas porch ceilings and other trim and moulding accents. Our trim and moulding products are also increasingly utilized within the home, including as wainscot trim or as shiplap, which originated to protect the exteriors of homes in harsh climates, but is now a popular way to create unique interior spaces. Our products are also used by mill shops and OEM fabricators, who rely on our products due to their consistent formulation, dimensional accuracy and precision and high machinability, to manufacture a wide range of other Outdoor Living products such as pergolas, arbors and flowerbeds.
In 2018, we acquired Versatex, which significantly expanded our existing trim product portfolio with a broad range of premium cellular PVC trim and moulding products. It also complements our established PVC trim and moulding capabilities with an organization dedicated to service, customer responsiveness and innovation. Particularly known for its customer-focused approach, Versatex has differentiated itself through its history of quickly addressing special requests from customers, developing cutting-edge products that focus on the needs of builders, architects, fabricators and consumers and rapidly bringing these innovative new products to market. Our full line of AZEK Exteriors and VERSATEX products includes trim and moulding, fabricated products, paintable trim and specialty solutions:
| Boards and Sheets |
Time-Saving Products |
Aesthetic Details |
Paintable Trim | |||
| • Boards—Manufactured with sealed edges and shipped with a protective film, our trim board is highly versatile and can be milled, routed, or heat formed to be used in many different applications.
• Sheet—Our sheets provide a clean backdrop over an expansive area and can be used for large scale fabrication such as pergolas and arbors.
• Skirt Boards—Designed to provide moisture resistance at ground contact and help direct water away from the structure. These products are easy to install with fiber cement, vinyl, or wood siding. |
• Column Wraps—Our column wraps are offered in multiple styles and can quickly and easily improve the aesthetics of a standard wood post with minimal labor.
• Corner Boards—Our one-piece corner boards are easy to install, feature smooth, outside edges and are aesthetically superior to two-piece corners, which can gather dirt along their edges.
• J-Channel and Stealth Products—Designed to complement siding and for easy installation around windows and corners. |
• Mouldings—Used to enable customizations, cover transitions or provide crisp, architectural style elements to home exteriors.
• Tongue & Groove Profiles—Easily add the classic style of beadboard, nickel gap, and shiplap in horizontal or vertical orientation to complement housing exteriors.
• Canvas—Designed to add contrast to porch ceilings and interior trim projects, these products deliver the look of rich hardwoods without knots or labor intensive staining requirements.
• TimberTech AZEK Cladding—Combines premium natural hardwood aesthetics and the durability of advanced polymer technology for use as a cladding rain screen for premium curb appeal.
• Shingle Siding—The most authentic looking shingle siding, with variable-width tabs and keyways, made with our moisture resistant advanced polymer in a panel format, making it easy for contractors to install. |
• PaintPro—Innovative cellular PVC trim that has the same high- performance and low-maintenance benefits of traditional AZEK trim, but can be painted any color. PaintPro trim offers quick drying times with no priming needed and superior paint adhesion. |
8
Table of Contents
In addition to the products described above, we offer custom milled solutions for builders and a number of accessories such as fastening systems, adhesives, sealants and bonding solutions.
Commercial Segment
Leveraging our shared U.S.-based manufacturing platform and material technology, we bring low-maintenance products with superior aesthetics to a variety of commercial and industrial markets. Our Residential and Commercial segments operate synergistically, primarily through our ability to utilize new materials, technologies and products developed by one segment across an array of manufacturing processes and products in our other segment. Our Commercial segment includes our Vycom and Scranton Products product lines. Vycom manufactures a comprehensive line of highly engineered polymer materials designed to offer sustainable, low-maintenance and long-lasting solutions for applications for a variety of commercial and industrial markets, including the markets for outdoor living, graphic displays and signage, recreation and playground equipment and the food processing, marine and chemical industries. Scranton Products manufactures sustainable, low-maintenance privacy and storage solutions primarily for schools, stadium arenas and recreational and commercial facilities. Within our Commercial segment, demand for our products is driven by commercial construction activity, material conversion and favorable secular trends such as an increased emphasis on privacy. In fiscal year 2020, our Commercial segment generated net sales of $128.1 million, which represented approximately 14% of our total net sales.
Vycom
Vycom manufactures a comprehensive line of highly engineered polymer materials designed to replace wood, metal and other traditional materials in a variety of applications. Vycom’s products are used in a broad range of commercial end markets, are durable, strong and lightweight and can be ordered in a wide range of sizes, thicknesses and colors. These products provide superior performance compared to traditional materials and are resistant to corrosive chemicals, scratches, flames, odors, moisture, bacteria, rotting, delaminating, chipping and swelling. Vycom’s products are also easier to fabricate, decorate, laminate, weld, machine or form than many traditional materials, which makes them attractive to original equipment manufacturers, or OEMs, that have specialized requirements for fabrication, physical properties or chemical resistance. Vycom’s highly engineered solutions are often developed in consultation with OEMs and, as a result, in certain cases are specified into OEM products and applications.
Scranton Products
Scranton Products provides low-maintenance bathroom partitions, shower and dressing stalls, lockers and other storage solutions. We market our partitions under the Aria, Eclipse and Hiny Hiders brands and our lockers under the TuffTec and Duralife brands. Our primary customers are schools, parks, recreational facilities, stadium arenas, industrial plants and retail and commercial facilities, and we continue to expand rapidly into the commercial repair and remodel market primarily through sales of our high-privacy bathroom partitions. Products sold by Scranton Products are designed to replace traditional materials such as metal, wood and baked enamel with more durable, long-lasting, low-maintenance and more aesthetically pleasing materials. These products are highly resistant to rust, dents, scratches and graffiti and are easily cleaned. We offer an extensive array of attractive colors, textures and finishes that replicate more traditional materials. As compared to metal and wood alternatives, our partitions and locker products sell at premium prices but deliver significantly reduced life-cycle costs through increased durability and lower maintenance expenses. In fiscal year 2020, approximately half of Scranton Products’ net sales were attributable to the education market. We expect to continue experiencing significant growth in Scranton Products’ sales in the commercial markets, which we believe is driven primarily by an increased focus on bathroom privacy considerations, design and aesthetics.
Product Research and Development
Over the past 30 years, we have built an R&D organization with significant expertise in material science and production process technologies. We leverage our R&D and U.S.-based manufacturing capabilities
9
Table of Contents
to deliver innovative new products to market that address evolving customer needs. We have made substantial investments in our R&D organization, which, as of September 30, 2020, consisted of over 30 team members, including approximately 20 engineers. We are committed to continuing to invest in our R&D capabilities to further strengthen our ability to regularly introduce new products that set us apart from our competition and accelerate future growth.
Our product managers and marketing team actively analyze proprietary consumer research and work with architects, contractors and consumers to identify and develop new products that incorporate consumer feedback, expand our portfolio and extend the range of style and design options we offer. Our R&D team then designs, prototypes and tests these new products prior to full scale production. Our rigorous R&D process incorporates in-house analytical capabilities and comprehensive product testing with more than 260 distinct tests, such as accelerated weathering.
We believe our focus on innovation allows us to bring on-trend products to market rapidly. For example, we were able to leverage our proprietary color pigmentation technology to adapt quickly to lighter color decking trends and introduce our whitewashed cedar products. Similarly, in response to popular flooring trends, our technological and material science expertise enables us to manufacture wide-width and multi-width decking products that we believe will help accelerate conversion from wood decking products. Our ability to innovate has also helped us introduce opening price point products such as TimberTech EDGE. In our Commercial segment, the introduction of our Aria partitions responds to demand for increased privacy and the introduction of our TimberLine products addresses the adjacent market demand for beautiful, low-maintenance engineered products with a wood-like look in outdoor furniture, cabinetry and other applications.
We currently have a broad portfolio of ongoing development projects across our core product categories as well as certain adjacent products and markets. We continue to leverage our acquisition of Ultralox to develop additional aluminum and steel railing products. In addition, we are constantly evaluating opportunities to use our technological and U.S.-based manufacturing capabilities to expand into new markets where we believe there is an opportunity to drive material conversion or otherwise broaden our market reach.
Distribution
Within our Residential segment, we sell our products through a network of more than 4,200 professional dealers and thousands of home improvement retail outlets, including both stocking and special order locations. These outlets are served by more than 35 distributors with over 150 branch locations enabling us to effectively serve contractors and customers throughout the United States and Canada. Within our Commercial segment, we sell our products through a widespread distribution network, as well as directly to OEMs. Our products are generally sold through both one-step and two-step distribution channels. Our distribution network has broad geographic coverage and benefits from the logistics capabilities of our distributors as well as the ability of our distributors and dealers to help generate demand for our products through direct sales, merchandising and marketing. In fiscal year 2020, approximately 99% of our gross sales came from the United States and Canada. Our distributors in locations outside of the United States and Canada are responsible for marketing and selling our products in other countries to which our products are exported. We are continually evaluating our distribution strategy to ensure that we can meet the demands of our consumers in the most effective ways.
Residential Segment
We distribute the majority of our Residential segment products through more than 35 distributors, who in turn sell our products to dealers. Our distributors also maintain an inventory of our products and support our dealers by managing shipping logistics. We have exclusive relationships with our distributors for decking and trim with respect to specified geographies, and, although some legacy distributors are permitted to carry only certain of our products, many of our distributors are required to carry a comprehensive selection of our TimberTech and AZEK products. Our top ten distributors for the year ended September 30, 2020, accounted for a majority of our total net sales during that period.
10
Table of Contents
Through our distributors, our products are sold to more than 4,200 professional dealers and lumber yards. Additionally, we have special order and stocking relationships with certain home improvement retailers with thousands of locations across the United States and Canada. We attempt to drive sales to our dealers and retailers through digital tools and extensive marketing directed at consumers who can help create pull-through demand for our products among influencers and decision makers such as architects, builders and contractors. Our dealers typically exhibit high brand loyalty and are incentivized to consolidate the manufacturers from which they purchase to maximize early buy discounts and annual volume rebates.
Contractors purchase our products through dealers and retailers. We believe contractors are typically loyal to brands and products they trust because they are a direct point of contact for consumers and are most likely to receive feedback and feel responsible for product performance. We consider the needs of and feedback from contractors in designing and manufacturing new products, and we invest in strengthening our relationships with these contractors as we believe they significantly influence decisions regarding material and brand selection for the types of products we produce. The graphic below illustrates the distribution channels for the Outdoor Living market in which we sell our Residential composite decking, composite and aluminum railing and PVC trim products.
We allocate significant sales force resources to support our dealers, and we believe our strong relationships with dealers and contractors are driven by the trust and reliability that we have generated through product innovation, superior quality and performance and the continuing support that we offer. Such support includes specialized training opportunities such as AZEK University and sales support initiatives such as digital lead generation, joint marketing funds, new sample kits, display kiosks, enhanced product literature, print, TV and radio advertising and social media initiatives. AZEK University provides training for contractors and customers installing and using TimberTech and AZEK Exteriors products. We have recently invested and upgraded our AZEK University programming to include virtual trainings and on-demand digital tools that have enabled us to reach a larger audience in an efficient manner. Additionally, our AZEK Pro Rewards program leverages our new website and digital capabilities to share curated digital leads with our contractors.
Parksite Inc., who distributes our Residential segment products, accounted for approximately 20.3% of our net sales for the year ended September 30, 2020.
Commercial Segment
Our Vycom products are primarily sold through approximately 130 engineered product distributors across the United States, Canada and Latin America, who in turn sell full sheet and/or fabricated products that have been converted into a wide variety of components or items for various industrial uses primarily to OEMs. We also sell certain Vycom products directly to OEMs.
Our Scranton Products bathroom partition and locker systems are sold through a network of approximately 900 dealers who sell to industrial and commercial customers across the United States and in Canada. We market the benefits of our bathroom partition and locker systems directly to architects and facilities managers, who frequently specify products by name and material in their designs.
Operations and Manufacturing
We are a vertically-integrated, U.S-based manufacturer, delivering superior quality products with a competitive cost position. Our competitive cost position, including our relatively low transportation costs resulting from us being a U.S.-based manufacturer, provides us with a competitive freight advantage relative to imported products. Our versatile, process-oriented manufacturing operations are built on a foundation of extensive material development and processing capabilities. Approximately 90% of our gross sales are attributable to products that are manufactured through an extrusion process that contains a blend of virgin polymers and recycled materials. Our proprietary production technologies, material blending proficiency and
11
Table of Contents
range of extrusion capabilities enable innovation and facilitate expansion into new markets. We have deep experience working with multiple technologies that enable us to provide some of the industry’s most attractive visuals through advanced streaking and multi-color technologies. Our manufacturing footprint includes eight facilities across five geographic locations totaling approximately 2 million square feet, and we have made significant investments in people, processes and systems to increase our manufacturing scale and productivity. We recently expanded our vertical manufacturing capabilities with the addition of our 100,000 square foot polyethylene recycling facility in late 2018 and our acquisition of PVC recycling operation Return Polymers in early 2020. In addition, we are implementing a multi-year, $180.0 million capital investment program to increase capacity and further support our future growth.
In 2017, we introduced our continuous improvement program known as the AZEK Integrated Management System to manage and monitor operations, and in 2018, we implemented Lean Six Sigma tools and techniques at all our manufacturing facilities to reduce material waste and improve manufacturing efficiency.
We have integrated manufacturing operations and differentiated technical expertise in utilizing recycled materials to develop sustainable, cutting-edge products. Sustainability is one of our core strategic pillars, and we are committed to introducing sustainable products that utilize recycled materials, reduce deforestation and are versatile and recyclable at the end of their useful lives. We are dedicated to expanding our recycling capability and investing in the use of reclaimed materials in our manufacturing processes.
Facilities Overview
We are headquartered in Chicago, Illinois and operate eight manufacturing and recycling facilities in the United States. In alignment with our sustainability values, our Chicago corporate office is located in a 2019 LEED-Certified building. Currently, we produce our AZEK, Scranton and Vycom products primarily at our manufacturing facilities in Scranton, Pennsylvania, our TimberTech products primarily at our manufacturing facilities in Scranton, Pennsylvania and Wilmington, Ohio, all of our VERSATEX trim products at our manufacturing facility in Aliquippa, Pennsylvania and all of our ULTRALOX railing products through our manufacturing facility in Eagan, Minnesota. In 2019, we opened our state-of-the-art polyethylene recycling facility in Wilmington, Ohio. The acquisition of Return Polymers in 2020 enhanced our PVC recycling capabilities and is located in Ashland, Ohio. We are implementing a multi-year $180.0 million capital investment program to support our future growth. As a part of that program and to address increased demand, we plan to add a new manufacturing facility.
Sales and Marketing
Residential Segment
Our Residential segment sales organization is organized under our AZEK, TimberTech, VERSATEX and ULTRALOX product lines and is composed of a general sales organization, which is primarily geographically based, and also includes specialty sales organizations who focus on exterior trim, railing, retail and key accounts. Our sales organization is primarily focused on generating downstream demand with contractors, architects and builders as well as maintaining relationships with and educating influencers. We believe we can continue to leverage our downstream investments to accelerate material conversion in our markets, strengthen our position in the pro channel and enhance our retail presence.
We maintain a national sales organization that works with builders and supports certain national or large regional dealers with multiple locations and/or buying groups to provide a single point of contact and more effectively serve these customers. Our national sales organization is focused on increased penetration into these accounts by working with corporate decision makers and with buyers at the local level. We have also enhanced our retail-focused sales team, who is focused on supporting individual retail locations, training pro desk associates within retail locations and facilitating deliveries for special orders placed at home improvement retailers.
12
Table of Contents
In 2019, we unified our decking and railing product portfolio under our leading TimberTech brand with a differentiated “Go Against the Grain” marketing campaign. TimberTech has strong market awareness, and unifying our decking and railing products under the TimberTech brand allows us to highlight product differentiation, while maintaining brand identity across multiple price points. In 2020, we debuted our new “Better Tech, Better Deck” marketing campaign which emphasized the technological superiority and design versatility of TimberTech’s product portfolio and is meant to inspire homeowners looking to build, renovate and remodel their outdoor living spaces. Following the repositioning of our AZEK decking product lines under the TimberTech brand, we are focused on leveraging the AZEK brand as our exteriors brand due to the significant brand recognition for AZEK trim and moulding products.
We maintain comprehensive marketing campaigns using various media in support of our brands, targeted towards our growing dealer base, as well as architects, builders, remodelers and consumers. We continue to invest in our marketing organization and alongside our channel partners to increase consumer awareness and preference for our products. Our focused digital strategy, enhanced media presence and differentiated marketing campaigns drive increased engagement with consumers as well as key influencers such as architects, builders and contractors. Our new digital platform facilitates the consumer journey from inspiration and design through installation. The experience educates consumers on the features and benefits of our products versus traditional materials, utilizes digital visualization tools to allow consumers to re-imagine their outdoor living spaces and directly connects them to a pre-qualified local contractor. We enjoy strong preference for our products among contractors, who typically purchase our products at dealers, and we are investing in order to increase our presence within retailers as the majority of consumers include visits to home improvement retailers in their research of decking products. These consumer engagement strategies are focused on creating additional pull-through demand and accelerating our growth. In addition, we have augmented our advertising efforts by developing instructive, educational and visually appealing product displays, marketing tools and sample kits to market our products. We have also invested in digital, print, TV and radio advertising and display kiosks which enhance our dealers’ and home improvement retailers’ ability to exhibit and promote our products.
We also provide frequent demonstrations, education, product training and other sales support and loyalty initiatives to help drive awareness of and demand for our products. In 2010, we established AZEK University to educate dealers, contractors, architects and builders on our product offering and value proposition through training that includes classroom tutorials, hands-on sessions and plant tours. In addition, through our AZEK Pro Rewards program, we seek to secure preferred brand status with contractors by providing contractors with marketing tools, leads and various other rewards in connection with increased purchases of our products. We believe these efforts increase our market position because many buying decisions involve input from both the contractor and consumer, with consumers frequently relying on contractor recommendations.
Commercial Segment
Our Vycom sales organization focuses on providing engineered polymer solutions for a wide variety of Industries, including the graphic displays and signage, semiconductor, marine, chemical and corrosion, recreation and playground and food processing markets. Our Vycom products are sold to plastics distributors in the United States, Canada and Latin America, who sell primarily to OEMs, and in certain cases are sold directly to OEMs. The Vycom sales force is made up of a combination of direct territory managers and manufacturing representatives focused on increasing market penetration by working with printers, fabricators, OEMs and end-users to generate demand for Vycom materials.
As of September 30, 2020, Scranton Products utilized direct sales and regional manufacturers’ sales representatives to provide coverage to a network of approximately 900 dealers who sell to institutional and commercial customers across the United States and in Canada. The Scranton Products’ sales force and agents service architects and facility managers to create pull-through demand in traditional institutional markets, such as schools, universities and stadium arenas, and in targeted new markets, such as retail stores, commercial and professional buildings, industrial facilities and food processing plants. Our Scranton Products sales force has
13
Table of Contents
leveraged a leading market position, enhanced promotional materials and specialized products to develop close relationships with architects and assist them in designing products and has enhanced awareness of the benefits of our products through targeted efforts to educate architects and designers.
Raw Materials and Suppliers
The primary raw materials used in our products are various petrochemical resins, including polyethylene, polypropylene and PVC resins, reclaimed polyethylene and PVC material, waste wood fiber and aluminum. We also utilize other additives, including modifiers, titanium dioxide, or TiO2, and pigments. Our contracts with key suppliers are typically short term in nature, with terms generally ranging from one to three years. We have not entered into hedges of our raw material costs at this time, but we may choose to enter into such hedges in the future, and our supply contracts with our major vendors do not contain obligations to sell raw materials to us at a fixed price. Prices for spot market purchases are negotiated on a continuous basis in line with current market prices. Other than short term supply contracts for resins with indexed based pricing and occasional strategic purchases of larger quantities of certain raw materials, we generally buy materials on an as-needed basis.
The cost of petrochemical resins used in our manufacturing processes has historically varied significantly and has been affected by changes in supply and demand and in the price of crude oil. Substantially all of our resins are purchased under supply contracts that average approximately one to two years, for which pricing is variable based on an industry benchmark price index. The resin supply contracts are negotiated annually and generally provide that we are obligated to purchase a minimum amount of resins from each supplier. In addition, the price of reclaimed polyethylene material, waste wood fiber, aluminum, other additives (including modifiers, TiO2 and pigments) and other raw materials fluctuates depending on, among other things, overall market supply and demand and general economic conditions. We seek to mitigate the effects of fluctuations in our raw material costs by broadening our supplier base, increasing our use of recycled material, increasing our use of scrap and reducing waste and exploring options for material substitution without sacrificing quality. For example, between fiscal year 2017 and fiscal year 2020, we have invested nearly $60.0 million to enhance our recycling capabilities and have increased our use of “regrind,” through the collection and reprocessing of scrap generated in our manufacturing processes.
Although we do not rely on any single supplier for the majority of our raw materials, we do obtain certain raw materials from single or a limited number of suppliers. In particular, we rely on a single supplier for certain critical capped compounds used in our decking and railing products. If one or more suppliers were unable to satisfy our requirements for particular raw materials, we believe alternative sources of supply would be available, although we could experience a disruption to our operations as alternative suppliers are identified and qualified and new supply arrangements are entered into.
Environmental Sustainability
We have created an operating platform that is centered around sustainability, one of our core strategic pillars, which extends across our value chain from product design, to raw material sourcing and U.S.-based manufacturing, and we increasingly utilize plastic waste, recycled wood and scrap in our products. We believe that our responsibility is not only to our customers, but also to the environment. This commitment is evident through our continued effort to introduce sustainable products, products with life spans that are significantly longer than the life spans of the traditional materials they replace (including exotic hardwoods cut from rainforests) with very little need for maintenance or cleaning chemicals, products that reduce deforestation and products that are versatile and recyclable at the end of their useful lives. We estimate that since 2015 more than one million trees have been saved because our customers chose our decking products over wood. The wood used in the core of our composite decking products is 100% recycled from sources that include, but are not limited to, facilities that manufacture wood mouldings, flooring, windows, doors and other products. Through our recycling programs, approximately 400 million pounds of scrap and waste were diverted from landfills in fiscal year 2020.
14
Table of Contents
In addition to the sustainability of our products, we have implemented energy-efficient manufacturing processes in our business operations. For example, our facilities in Wilmington, OH and Scranton, PA employ closed-loop water filtration systems that recycle approximately 96% of water used annually, and our polyethylene recycling facility utilizes energy-efficient systems for power, water, heating, cooling and lighting.
Our dedication to expanding our recycling capabilities and to increasing the use of reclaimed materials is also a critical part of our sustainability commitment. Approximately 54% of all of our extruded materials were manufactured from recycled materials in fiscal year 2020, an increase from approximately 44% in fiscal year 2019, and we believe there is an opportunity to increase this percentage in the future. Currently, AZEK pavers are made from approximately 95% recycled material, and we estimate that approximately every 500 square feet of AZEK pavers diverts up to 250 passenger vehicle tires and 7,500 plastic containers from landfills. Additionally, through Vycom, we sell effectively 100% post-consumer recycled polymer sheet products used in the manufacturing of outdoor furniture.
Competition
We compete with multiple companies, including divisions or subsidiaries of larger companies and foreign competitors. We compete on the basis of a number of considerations, including service, quality, performance, product characteristics, brand recognition and loyalty, marketing, product development, sales and distribution and price. We believe we compete favorably with respect to these factors.
Residential Segment
Our residential products compete primarily with products made from wood, aluminum and engineered wood that our products are designed to replace. We also compete with other manufacturers of engineered products designed to replace wood and other traditional materials, including Trex Company Inc., Fiberon, LLC, which was acquired by Fortune Brands Home & Security, Inc. in August 2018, Deckorators, a subsidiary of UFP Industries, Inc., Oldcastle Architectural, Inc., Royal Group, Inc., Kleer Lumber LLC and CertainTeed Corporation.
Commercial Segment
Our Vycom products compete in a highly fragmented market. Manufacturers generally focus on a few core materials sold to narrow sub-segments through a specialized distribution network. Competitors for other non-fabricated products include other national and regional manufacturers like Mitsubishi Chemical Advanced Materials (formerly Quadrant EPP), Rochling Engineering Plastics, 3A Composites USA Inc., Simona AG and Kommerling Plastics USA.
The bathroom partition and locker market is also highly fragmented and is addressed by manufacturers producing products in a variety of different materials and at varying price ranges. Scranton Products’ primary plastic bath and locker competitors are Global Partitions Corp. (d/b/a ASI Global Partitions), Hadrian Manufacturing Inc. and Bradley Corporation.
Seasonality
Although we generally experience demand for our products throughout the year, our sales have historically experienced some seasonality. We have typically experienced moderately higher levels of sales of our residential products in the second fiscal quarter of the year as a result of our “early buy” sales and extended payment terms typically available during the second fiscal quarter of the year. As a result of these extended payment terms, our accounts receivable have typically reached seasonal peaks at the end of the second fiscal quarter of the year, and our net cash provided by operating activities has typically been lower in the second fiscal quarter relative to other quarters. In addition, our sales are affected by the individual decisions of distributors and
15
Table of Contents
dealers on the levels of inventory they carry, their views on product demand, their financial condition and the manner in which they choose to manage inventory risk. Our sales are also generally impacted by the number of days in a quarter or a year that contractors and other professionals are able to install our products. This can vary dramatically based on, among other things, weather events such as rain, snow and extreme temperatures. We have generally experienced lower levels of sales of our residential products in the first fiscal quarter due to adverse weather conditions in certain markets, which typically reduces the construction and renovation activity during the winter season. In addition, we have experienced higher levels of sales of bathroom partition products and our locker products during the second half of our fiscal year, which includes the summer months during which schools are typically closed and are more likely to undergo remodel activities.
Intellectual Property
We rely on trademark and service mark protection to protect our brands, and we have registered or applied to register many of these trademarks and service marks. In particular, we believe the AZEK and AZEK Exteriors brands, the TimberTech brand and the VERSATEX brand are significant to the success of our business. We also rely on a combination of unpatented proprietary know-how and trade secrets, and to a lesser extent, patents to preserve our position in the market. As of September 30, 2020, we had approximately 320 trademark registrations and 134 issued patents and pending patent applications in the United States and other countries. As of September 30, 2020, we had approximately 101 issued U.S. patents and 3 U.S. patent applications pending. The majority of our issued U.S. patents expire between 2026 and 2037. We also had approximately 23 issued foreign patents and 7 foreign patent applications pending. As we develop technologies and processes that we believe are innovative, we intend to continually assess the patentability of new intellectual property. In addition, we employ various other methods, including confidentiality and nondisclosure agreements with third parties and employees who have access to trade secrets, to protect our trade secrets and know-how. Our intellectual property rights may be challenged by third parties and may not be effective in excluding competitors from using the same or similar technologies, brands or works.
Employees
Our culture is driven by a shared passion for our values, mission and performance. It is an inclusive culture of innovative, growth-minded individuals committed to always doing the right thing, continuous improvement and solving problems for our customers and partners, which ultimately drives our differentiation and competitiveness.
As of September 30, 2020, we had 1,663 full-time employees. Our workforce is not unionized, and we are not a party to any collective bargaining agreements. We believe we have satisfactory relations with our employees.
Legal Proceedings
From time to time, we may be involved in litigation relating to claims arising out of our operations and businesses that cover a wide range of matters, including, among others, contract and employment claims, personal injury claims, product liability claims and warranty claims. Currently, there are no claims or proceedings against us that we believe will have a material adverse effect on our business, financial condition, results of operations or cash flows. However, the results of any current or future litigation cannot be predicted with certainty and, regardless of the outcome, we may incur significant costs and experience a diversion of management resources as a result of litigation.
Environmental Laws and Regulations
Our operations and properties are subject to extensive and frequently changing federal, state and local environmental protection and health and safety laws, regulations and ordinances. These laws, regulations and
16
Table of Contents
ordinances, among other matters, govern activities and operations that may have adverse environmental effects, such as discharges to air, soil and water, and establish standards for the handling of hazardous and toxic substances and the handling and disposal of solid and hazardous wastes.
Some of the environmental laws applicable to us provide that a current or previous owner or operator of real property may be liable for the costs of removal or remediation of environmental contamination on, under, or in that property or other impacted properties. Accordingly, such liability could apply to us in connection with any of our current or former manufacturing plants or other properties. In addition, some of these laws provide that persons who arrange, or are deemed to have arranged, for the disposal or treatment of hazardous substances may also be liable for the costs of removal or remediation of environmental contamination at the disposal or treatment site, regardless of whether the affected site is owned or operated by such person. Environmental laws, in general, often impose liability whether or not the owner, operator or arranger knew of, or caused, the presence of such environmental contamination. Also, third parties may make claims against owners or operators of properties for personal injuries, for property damage and/or for clean-up associated with releases of hazardous or toxic substances pursuant to applicable environmental laws and common law tort theories, including strict liability. Failure to comply with environmental laws or regulations could result in severe fines and penalties.
We are also subject to permitting requirements under environmental, health and safety laws and regulations applicable in the jurisdictions in which we operate. Those requirements obligate us to obtain permits from one or more governmental agencies in order to conduct our operations. Such permits are typically issued by state agencies, but permits and approvals may also be required from federal or local governmental agencies. The requirements for such permits vary depending on the location where our regulated activities are conducted. As with all governmental permitting processes, there is a degree of uncertainty as to whether a permit will be granted, the time it will take for a permit to be issued and the conditions that may be imposed in connection with the granting of the permit.
We are not aware of any environmental liabilities that would be expected to have a material adverse effect on our business, financial condition or results of operations. We believe we comply in all material respects with environmental laws and regulations and possess the permits required to operate our manufacturing and other facilities. Our environmental compliance costs in the future will depend, in part, on the nature and extent of our manufacturing activities, regulatory developments and future requirements that cannot presently be predicted.
Health and Safety Matters
Our health and safety policies and practices include an employee training and competency development program to regularly train, verify and encourage compliance with health and safety procedures and regulations. We regularly monitor our total recordable incident rate, or TRIR, and as a result of our commitment to continuously improve our health and safety policies and practices, our TRIR has improved 45% from 4.02 in fiscal year 2016 to 2.22 in fiscal year 2020. We employ an environmental, health and safety director whose responsibilities include managing, auditing and executing unified, company-wide safety and compliance programs. The environmental, health and safety director reports directly to the Senior Vice President of Operations and also provides monthly updates to the Chief Executive Officer.
Investing in our Class A common stock involves a high degree of risk. You should carefully consider the following risks and uncertainties, together with all of the other information contained in this Annual Report on Form 10-K, or this Annual Report, including our Consolidated Financial Statements and related notes included elsewhere in this Annual Report, before making an investment decision. In addition to the risks relating to the COVID-19 pandemic that are specifically described in these Risk Factors, the effects of the COVID-19 pandemic may also have the effect of significantly heightening many of the other risks associated with our business and an investment in our Class A common stock, including the other risks described in this Annual
17
Table of Contents
Report. The occurrence of any of the following risks, or additional risks not presently known to us or that we currently believe to be immaterial, could materially and adversely affect our business, financial condition, results of operations and prospects. In such case, the trading price of our Class A common stock could decline, and you may lose all or part of your investment.
Summary Risk Factors
The risks described below include, but are not limited to, the following:
| • | the fact that the COVID-19 public health pandemic is adversely affecting, and is expected to continue to adversely affect, certain aspects of our business; |
| • | demand for our products is significantly influenced by general economic conditions and trends in consumer spending on outdoor living and home exteriors, and adverse trends in, among other things, the health of the economy, repair and remodel and new construction activity, industrial production and institutional funding constraints; |
| • | we compete against other manufacturers of (i) engineered and composite products; and (ii) products made from wood, metal and other traditional materials; |
| • | the seasonal nature of certain of our products and the impact that changes in weather conditions and product mix may have on our sales; |
| • | our ability to develop new and improved products and effectively manage the introduction of new products; |
| • | our ability to effectively manage changes in our manufacturing process resulting from cost savings and integration initiatives and the introduction of new products; |
| • | risks related to our ability to accurately predict demand for our products and risks related to our ability to maintain our relationships with key distributors or other customers; |
| • | risks related to shortages in supply, price increases or deviations in the quality of raw materials; |
| • | our ability to retain management; |
| • | risks related to acquisitions or joint ventures we may pursue; |
| • | our ability to maintain product quality and product performance at an acceptable cost, and potential exposures resulting from our product warranties; |
| • | our ability to ensure that our products comply with local building codes and ordinances; |
| • | risks arising from the material weaknesses we have identified in our internal control over financial reporting and any failure to remediate these material weaknesses; |
| • | our ability to maintain an effective system of internal controls and produce timely and accurate financial statements or comply with applicable regulations; |
| • | our ability to protect our intellectual property rights; |
| • | risk of disruption or failure of our information technology systems or failure to successfully implement new technology effectively; |
| • | cybersecurity risks and risks arising from new regulations governing information security and privacy; |
| • | the increased expenses associated with being a public company; |
| • | risks associated with our substantial indebtedness and debt service; |
| • | our reliance on dividends, distributions and other payments from our subsidiaries to meet our obligations; |
18
Table of Contents
| • | the continuing control after this offering of our company, including the right to designate individuals to be included in the slate of nominees for election to our board of directors, by our Sponsors, whose interests may conflict with our interests and those of other stockholders; |
| • | our status as a “controlled company” within the meaning of the New York Stock Exchange, or the NYSE, rules, and our exemption from certain corporate governance requirements; and |
| • | certain provisions in our certificate of incorporation and our bylaws that may delay or prevent a change of control. |
Risks Relating to Our Business and Industry
The COVID-19 public health pandemic is adversely affecting, and is expected to continue to adversely affect, certain aspects of our business.
Any outbreaks of contagious diseases, public health epidemics or pandemics and other adverse public health developments could have a material adverse effect on our business, financial condition and results of operations. The COVID-19 pandemic, and the reactions of governmental and other authorities to contain, mitigate or combat the pandemic, which have severely restricted the level of economic activity around the world, have impacted, and are expected to continue to impact, our operations, and the nature, extent and duration of the impact of the COVID-19 pandemic or any future disease or adverse health condition is highly uncertain and beyond our control. In response to the COVID-19 pandemic, the governments of many countries, states, cities and other geographic regions have taken and may again take preventative or protective actions, such as imposing restrictions on travel and business operations.
Although we have implemented measures to mitigate the impact of the COVID-19 pandemic on our business, financial condition and results of operations, including reducing our production and expenses in certain areas of our business, these measures may not fully mitigate the impact of the COVID-19 pandemic on our business, financial condition and results of operations. We cannot predict the degree to, or the period over, which we will be affected by the COVID-19 pandemic and resulting governmental and other measures.
We expect that the economic effects of the COVID-19 pandemic may continue to adversely affect demand for certain of our products in the foreseeable future. To address any actual or potential reduction in demand for our products, we have engaged and are continuing to engage directly with our distributors to share information on market demand and ensure supply and inventory levels are appropriate. We also reduced production with respect to certain products to align our output with reductions in demand during fiscal year 2020, and we expect we may have to continue with such reduced production into fiscal year 2021. Specifically, within our Commercial segment, the Vycom brand has a broad domestic customer base with a significant portion of the business exposed to retail and trade show end-markets, where volumes have drastically slowed and in some cases effectively shut down. Our Commercial segment tends to track more closely to the broader economy, and, like certain portions of the economy, has faced a difficult market environment in fiscal year 2020 and faces a difficult market environment in the near-term.
In addition, our supply chain is largely concentrated in the United States, and although it was not significantly affected by the COVID-19 pandemic in fiscal year 2020, we may experience disruptions or delays in our supply chain in connection with the pandemic in the future, which may result in the need to seek alternate suppliers. Alternate suppliers may be more expensive, may not be available or may encounter delays in shipments to us, which would affect our business, financial condition and results of operations. We cannot estimate the extent and duration of a possible disruption to our supply chain or the significance of the related financial impact. Should any such disruption continue for an extended period of time, the impact could have a material adverse effect on our business, financial condition and results of operations.
19
Table of Contents
We expect that the COVID-19 pandemic may adversely affect many aspects of our business, including, but not limited to, the following:
| • | We may experience reductions in demand for our products due to the economic uncertainty resulting from the COVID-19 pandemic, an increase in unemployment rates, and distributors’, dealers’ suppliers’, homeowners’ and other third parties’ diminished financial condition or financial distress. |
| • | Our distributors and dealers may be unable to meet their payment obligations to us in a timely manner. Further, other third parties, such as suppliers and other outside business partners, may experience significant disruptions in their ability to satisfy their obligations with respect to us, or they may be unable to do so altogether. |
| • | Measures that we have taken to address the COVID-19 pandemic, including, among other things, providing additional safety equipment, reducing our production, encouraging our employees who are able to work remotely to do so, enacting and enforcing employee physical distancing protocols in our factories and reducing the need for face-to-face interactions, are reducing the efficiency of our operations. |
| • | Additionally, we may be exposed to increased cybersecurity risks as a result of remote working requirements. |
| • | Illness, travel restrictions or other workforce disruptions could negatively affect our supply chain, our ability to timely and satisfactorily meet our customers’ demands or our other business processes. Even after the COVID-19 pandemic subsides, we could experience a longer-term impact on our operating expenses, including as a result of, among other things, the need for enhanced health and hygiene requirements in our manufacturing facilities and in our corporate offices or the periodic revival of physical or social distancing or other measures in one or more regions, including the states where our manufacturing facilities are located, in attempts to counteract or prevent future outbreaks. |
| • | We have reduced the number of employees in certain of our businesses in order to reduce our operating expenses. We may experience difficulties associated with hiring additional employees or replacing employees. Increased turnover rates of our employees could increase operating costs and create challenges for us in maintaining high levels of employee awareness of, and compliance with, our internal procedures and external regulatory compliance requirements, in addition to increasing our |
recruiting, training and supervisory costs.
| • | In addition to existing travel restrictions implemented in response to the COVID-19 pandemic, states and other jurisdictions may continue to close borders, impose prolonged quarantines and further restrict travel and business activity, which could materially impair our ability to support our operations and customers, to source supplies through our supply chain and to identify, pursue and capture new business opportunities, and which could continue to restrict the ability of our employees to access their workplaces. We also face the possibility of increased overhead or other expenses resulting from compliance with any future government orders or other measures enacted in response to the COVID-19 pandemic. |
| • | The impact of the COVID-19 pandemic and the actions we have taken in response to the COVID-19 pandemic could affect our need for and access to capital. |
| • | Our estimates of future market growth and the estimates of third parties may prove inaccurate. |
Our management of the impact of COVID-19 has required, and will continue to require, significant investment of time by our management and employees as well as other resources. The focus on managing and mitigating the impacts of COVID-19 on our business will likely cause us to divert or delay the application of our resources toward new initiatives, including the development of new products, which may adversely impact our financial condition and results of operations in future periods.
The timing for us resuming operations at or near the levels of operations experienced before the COVID-19 pandemic depends on numerous factors beyond our control, including, among other things: (1) the
20
Table of Contents
duration of, any revisions in, and the possible reimposition of governmental quarantine, shelter-in-place or similar social distancing orders or guidelines; (2) the occurrence and magnitude of future outbreaks, including localized outbreaks where our manufacturing facilities are located; (3) the availability of vaccines or other medical remedies and preventive measures; and (4) broader economic conditions, including unemployment levels and the reaction of consumers to potentially longer-term economic uncertainty, which may adversely impact our financial condition and results of operations in future periods.
Additionally, although we are reviewing and will review any available benefits under the federal and state relief and stimulus legislation and programs, whether presently enacted or enacted in the future, including, among other things, those under the Coronavirus Aid, Relief and Economic Security Act, or the CARES Act, at this time, we do not know whether we will be able to access any such benefits in a manner that is advantageous to us or at all.
Demand for our products is significantly influenced by general economic conditions and trends in consumer spending on outdoor living and home exteriors, and adverse trends in, among other things, the health of the economy, repair and remodel and new construction activity, industrial production, consumer confidence and discretionary spending and institutional funding constraints could have a material adverse effect on our business.
Demand for our products is significantly influenced by a number of economic factors affecting our customers, including distributors, dealers, contractors, architects, builders, homeowners and institutional and commercial consumers. Demand for our products depends on the level of residential and commercial improvement and renovation and new construction activity, and, in particular, the amount of spending on outdoor living spaces and home exteriors. Home and commercial renovation and improvement and new construction activity are affected by, among other things, interest rates, consumer confidence and spending habits, demographic trends, housing affordability levels, unemployment rates, institutional funding constraints, industrial production levels, tariffs and general economic conditions. In addition, it is difficult to predict what impact, if any, the recent U.S. presidential election and its outcome will have on such factors and on demand for our products.
For example, in our Residential segment, sales of our products depend primarily on the level of repair and remodel activity and, to a lesser extent, new construction activity. Accordingly, increases in interest rates or the reduced availability of financing can reduce the level of home improvement and new construction activity and the demand for our products. In addition, the residential repair and remodel market depends in part on home equity financing, and accordingly, the level of equity in homes will affect consumers’ ability to obtain a home equity line of credit and engage in renovations that would result in purchases of our products. Accordingly, a weakness in home prices may result in a decreased demand for our residential products.
Many of our residential products are impacted by consumer demand for, and spending on, outdoor living spaces and home exteriors. For example, sales of our decking and railing products depend on lifestyle and architectural trends and the extent to which consumers prioritize spending to enhance outdoor living spaces for their homes. While we believe consumer preferences have increased spending on outdoor living and home exteriors in recent years, the level of spending could decrease in the future. Decreased spending on outdoor living spaces and home exteriors generally or as a percentage of home improvement activity may decrease demand for our decking, railing and trim products.
Demand for our products in our Commercial segment is affected by the level of commercial and governmental construction and renovation activity. The levels of commercial and governmental construction and renovation activity are affected by the levels of interest rates, availability of financing for commercial and industrial projects, the general business environment and the availability of governmental funding. Sales of products by our Commercial segment include sales for use in institutions, such as universities and schools, and in federal, state and local government buildings, which depend on federal, state and local funding for construction
21
Table of Contents
and renovation projects. Sales to institutions that depend on public funding are affected by factors that may impose constraints on funding availability for construction and renovation projects, including increased operational costs, budget cuts by federal, state and local governments, including as a result of lower than anticipated tax revenues, increased limitations on federal spending or government shutdowns. Sales to commercial establishments depend on, among other things, general levels of industrial production and business growth and the performance of the various markets in which our commercial end customers operate.
Adverse trends in any of the foregoing factors could reduce our sales and have a material adverse effect on our business, financial condition and results of operations. Such factors could also alter the balance of our Residential and Commercial sales or the balance of our product sales within either such segment. In light of differing margins, changes in the relative amount and type of residential and commercial industrial activity or the mix of products sold may have an impact on our business and cause our revenues and profitability to fluctuate from period to period.
We operate in a competitive business environment. If we are unable to compete effectively, our sales would suffer and our business, financial condition and operating results would be adversely affected.
We operate in a competitive business environment, and we compete with multiple companies with respect to each of our products. While we have longstanding business relationships with many of our distributors, dealers and contractors, we generally do not have long-term contracts with these customers. Accordingly, any failure to compete effectively, including as a result of the various factors described below, could cause our customers to cease purchasing our products or rapidly decrease our sales.
Our residential products compete primarily with wood products that comprise the majority of decking, railing, trim and related market sales. We also compete with metal products and with engineered products sold by other companies. In our Commercial segment, we compete in several highly fragmented markets. Our Vycom products compete with products sold into narrow market segments with a wide range of end uses through specialized distribution networks that vary depending on the particular end use. Products made by Scranton Products compete with bathroom partitions, lockers and storage solutions sold at a wide range of prices and manufactured using a variety of materials.
Our business model relies on the continued conversion in demand from traditional wood products to our engineered products, and our business could suffer if this conversion does not continue in the future. A number of suppliers of wood and wood composite decking, railing and trim products have established relationships with contractors, builders and large home improvement retailers, and, to compete successfully, we must expand and strengthen our relationships with those parties. We must also compete successfully with products from other manufacturers that offer alternatives to wood and wood composite products, including by developing competitive new products and by responding successfully to new products introduced, and pricing and other competitive actions taken, by competitors. During our fourth quarter of fiscal year 2020, we communicated a 3-6% price increase across certain products within our Residential segment. This price increase will become effective during our first fiscal quarter of fiscal year 2021. See “—Shortages in supply, price increases or deviations in the quality of the raw materials used to manufacture our products could adversely affect our sales and operating results.”
Some of our competitors have financial, production, marketing and other resources that are significantly greater than ours. Consolidation by industry participants could further increase their resources and result in competitors with expanded market share, larger customer bases, greater diversified product offerings and greater technological and marketing expertise, which may allow them to compete more effectively against us. Moreover, our competitors may develop products that are superior to our products (on a price-to-value basis or otherwise) or may adapt more quickly to new technologies or evolving customer requirements. Technological advances by our competitors may lead to new manufacturing techniques and make it more difficult for us to compete.
22
Table of Contents
Our quarterly operating results may fluctuate as a result of seasonality, changes in weather conditions and changes in product mix.
We have typically experienced moderately higher levels of sales of our residential products in the second fiscal quarter of the year as a result of our “early buy” sales and extended payment terms typically available during the second fiscal quarter of the year. As a result of these extended payment terms, our accounts receivable have typically reached seasonal peaks at the end of the second fiscal quarter of the year, and our net cash provided by operating activities has typically been lower in the second fiscal quarter relative to other quarters. Our sales are also generally impacted by the number of days in a quarter or a year that contractors and other professionals are able to install our products. We have generally experienced lower levels of sales of residential products during the first fiscal quarter due to adverse weather conditions in certain markets, which typically reduces the construction and renovation activity during the winter season. Although our products can be installed year-round, unusually adverse weather conditions can negatively impact the timing of the sales of certain of our products, causing reduced sales and negatively impacting profitability when such conditions exist. Our residential products are generally purchased shortly before installation and used in outdoor environments. As a result, there is a correlation between the amount of products we sell and weather conditions during the time they are to be installed. Adverse weather conditions may interfere with ordinary construction, delay projects or lead to cessation of construction involving our products. Prolonged adverse weather conditions could significantly reduce our sales in one or more periods. These conditions may shift sales to subsequent reporting periods or decrease overall sales, given the limited outdoor construction season in many locations. In addition, we have experienced higher levels of sales of our engineered bathroom partition products and our locker products during the second half of our fiscal year, which includes the summer months during which schools are typically closed and therefore more likely to be undergoing remodel activities. These factors can cause our operating results to fluctuate on a quarterly basis.
Further, our quarterly operating results in future fiscal years may fluctuate or otherwise be significantly affected as a result of the COVID-19 pandemic. The effect of the pandemic may exceed the quarterly changes in our operating results that we have typically experienced from seasonality, weather conditions and product mix.
Our operating results may also fluctuate due to changes in the mix of products sold. We sell products at different prices, composed of different materials and involving varying levels of manufacturing complexity. Changes in the mix of products sold from period to period may affect our average selling price, cost of sales and gross margins.
If we fail to develop new and improved products successfully, or if we fail to effectively manage the introduction of new products, our business will suffer.
Our continued success depends on our ability to predict the products that will be demanded by our customers and consumers, such as homeowners or commercial or industrial purchasers, and to continue to innovate and introduce improved products in our existing product lines and products in new product categories. We may not be successful in anticipating these needs or preferences or in developing new and improved products. If we do not respond effectively to changing market trends, demands and preferences and to actions by competitors by introducing competitive new products, our business, financial condition and results of operations would suffer.
Even if we do introduce new products, consumers may not choose our new products over existing products. In addition, competitors could introduce new or improved products that would replace or reduce demand for our products or develop proprietary changes in manufacturing technologies that may render our products obsolete or too expensive to compete effectively. In addition, when we introduce new products, we must effectively anticipate and manage the effect of new product introductions on sales of our existing products. If new products displace sales of existing products more broadly or rapidly than anticipated, we may have excess inventory of existing products and be required to reduce prices on existing products, which could adversely affect
23
Table of Contents
our results of operations. As we continue to introduce new products at varying price points to broaden our product offerings to compete with products made with wood or other traditional materials across a wide range of prices, our overall gross margins may vary from period to period as a result of changes in product mix.
Moreover, we may introduce new products with initially lower gross margins with the expectation that the gross margins associated with those products may improve over time as we improve our manufacturing efficiency for those products, and our results of operations would be adversely affected if we are unable to realize the anticipated improvements.
In the past we have devoted, and in the future we expect to continue to devote, significant resources to developing new products. However, we cannot be sure that we will successfully complete the development and testing of new products and be able to release the products when anticipated or at all. From time to time, we may make investments in the development of products we ultimately determine not to release resulting in write-downs of inventory and related assets.
Our business would suffer if we do not effectively manage changes in our manufacturing processes resulting from the growth of our business, cost-savings and integration initiatives and the introduction of new technologies and products.
We continually review our manufacturing operations in an effort to achieve increased manufacturing efficiencies, to integrate new technologies and to address changes in our product lines and in market demand. Periodic manufacturing integrations, realignments and cost-savings programs and other changes have adversely affected, and could in the future adversely affect, our operating efficiency and results of operations during the periods in which such programs are being implemented. Such programs may include the addition of manufacturing lines and the consolidation, integration and upgrading of facilities, functions, systems and procedures, including the introduction of new manufacturing technologies and product innovations. These programs involve substantial planning, often require capital investments, and may result in charges for fixed asset impairments or obsolescence and substantial severance costs. Our ability to achieve cost savings or other benefits within the time frames we anticipate is subject to many estimates and assumptions, a number of which are subject to significant economic, competitive and other uncertainties. For example, we have made substantial investments to expand our recycling capabilities and to increase the use of reclaimed materials in our manufacturing processes. While we anticipate that enhancing these capabilities will ultimately decrease our costs, the introduction of these capabilities has required significant initial investment, and we cannot be certain we will realize the benefits of this initiative when anticipated or at all. If these investments and other changes are not effectively integrated into our manufacturing processes, we may suffer from production delays, lower efficiency and manufacturing yields, increased costs and reduced net sales.
We must also effectively address changes to our manufacturing operations resulting from growth of our business generally and introduction of new products. As we increase our manufacturing capacity to meet market demand or begin to manufacture new products at scale, we may face unanticipated manufacturing challenges as production volumes increase, new processes are implemented and new supplies of raw materials used in these products are secured. New products may initially be more costly and less efficient to produce than our existing products. In addition, we could experience delays in production as we increase our manufacturing capacity or begin to manufacture new products that may result in the products ordered by our customers being on back-order as initial production issues are addressed. As a result, increases in manufacturing capacity or the introduction of new products may initially be associated with lower efficiency and manufacturing yields and increased costs, including shipping costs to fill back-orders. If we experience production delays or inefficiencies, a deterioration in the quality of our products or other complications in managing changes to our manufacturing processes, including those that are designed to increase capacity, enhance efficiencies and reduce costs or that relate to new products or technologies, we may not achieve the benefits that we anticipate from these actions when expected, or at all, and our operations could experience disruptions, our manufacturing efficiency could suffer and our business, financial condition and results of operations could be materially and adversely affected.
24
Table of Contents
Our sales and results of operations may suffer if we do not maintain our relationships with, forecast the demand of and make timely deliveries to our key distributors or other customers.
Our operations depend upon our ability to maintain our strong relationships with our network of distributors and dealers. Our top ten distributors collectively accounted for a majority of our net sales for the year ended September 30, 2020. Our largest distributor, Parksite Inc., accounted for approximately 20.3% of our net sales for the year ended September 30, 2020. While we have long-standing business relationships with many of our key distributors and our distribution contracts generally provide for exclusive relationships with respect to certain products within certain geographies, these contracts typically permit the distributor to terminate for convenience on several months’ notice. The loss of, or a significant adverse change in, our relationships with one or more of our significant distributors could materially reduce our net sales.
Distributors and dealers that sell our products are sensitive to meeting the demands of their end customers on a timely basis. Dealers that sell our products typically place orders with our distributors that need to be filled in a short time frame, and these dealers typically do not have an exclusive relationship with us. Purchases by our distributors and dealers are affected by their individual decisions on the levels of inventory they carry, their views on product demand, their financial condition and the manner in which they choose to manage inventory risk. In addition, purchases by distributors and dealers are affected by a variety of other factors, including product pricing, increases in the number of competitive producers and the production capacity of other producers, new product introductions, changes in levels of home renovation and new construction activity, and weather-related fluctuations in demand. As a result, demand for our products can be difficult to predict. If we do not forecast and plan production effectively to manufacture sufficient products to meet demand or if we experience delays in our ability to manufacture products, dealers may seek alternative products, including those of our competitors. Failure to meet demand requirements on a timely basis may cause distributors or dealers to build up inventory as a precautionary measure, rapidly shift their product mix away from our products, harm our long-term relationships with distributors and dealers, harm our brand and reduce, or increase the variability of, our net sales.
We must continue to provide product offerings at price points that meet the needs of distributors and dealers and that they perceive to be competitive with the products on the market. If our key distributors or dealers are unwilling to continue to sell our products at existing or higher levels, or if they desire to sell competing products alongside our products, our ability to maintain or increase our sales could suffer. In addition, mergers or acquisitions involving our distributors or dealers and one of our competitors, or a distributor or dealer with a relationship with one of our competitors, could decrease or eliminate purchases of our product by that distributor or dealer. If a key distributor or dealer were to terminate its relationship with us or reduce purchases of our products, we may not be able to replace that relationship with a relationship with a new distributor or dealer in a timely manner or at all. In addition, any such new relationship may take time to develop and may not be as favorable to us as the relationship it is replacing. The loss of, or a reduction in orders from, any significant distributor or dealer, may have a material adverse effect on our business, financial condition or results of operations.
Shortages in supply, price increases or deviations in the quality of the raw materials used to manufacture our products could adversely affect our sales and operating results.
The primary raw materials used in our products are various petrochemical resins, including polyethylene, polypropylene and PVC resins, reclaimed polyethylene and PVC material, waste wood fiber and aluminum. We also utilize other additives including modifiers, TiO2, and pigments. Our contracts with key suppliers are typically short term in nature, with terms generally ranging from one to three years. While we do not rely on any single supplier for the majority of our raw materials, we do obtain certain raw materials from single or a limited number of suppliers. In particular, we rely on a single supplier for certain critical capped compounds used in our decking and railing products. We do not currently have arrangements in place for a redundant or second-source supply for those compounds. If one or more suppliers were unable to satisfy our
25
Table of Contents
requirements for particular raw materials, we believe alternative sources of supply would be available. However, we could experience a disruption to our operations as alternative suppliers are identified and qualified and new supply arrangements are entered into, and we cannot be sure we will be able to identify alternative sources of supply rapidly, without incurring significant costs or at all.
In the event of an industry-wide general shortage of our raw materials, a shortage affecting or discontinuation in providing any such raw materials by one or more of our suppliers or a supplier’s declaration of force majeure, we may not be able to arrange for alternative sources of such materials on a timely basis or on equally favorable terms. We have also recently significantly increased the use of reclaimed polyethylene and PVC material in our products. As we increase our use of such materials and introduce new materials into our manufacturing processes, we may be unable to obtain adequate quantities of such new raw materials in a timely manner. Any such shortage may materially adversely affect our production process as well as our competitive position as compared to companies that are able to source their raw materials more reliably or at lower cost.
In addition, significant increases in the cost of the raw materials used to manufacture our products could adversely affect our operating results. The cost of some of the raw materials we use in the manufacture of our products is subject to significant price volatility. For example, the cost of petrochemical resins used in our manufacturing processes has historically varied significantly and has been affected by changes in supply and demand and in the price of crude oil. We have not entered into hedges of our raw material costs, and our supply contracts with our major vendors do not contain obligations to sell raw materials to us at a fixed price.
Accordingly, we are exposed to the risk of increases in the market prices of raw materials used in the manufacture of our products. Our results of operations have been affected in the past by changes in the cost of resins, and we expect that our results of operations in the future will continue to be affected by changes in resin costs. In the event of an increase in the cost of resins or other raw materials, we may not be able to recover the increases through corresponding increases in the prices of our products. Even if we are able to increase prices over time, we may not be able to increase prices as rapidly as the increase in our costs. If we are unable to increase our prices or experience a delay in our ability to increase our prices or to recover such increases in our costs, our gross profit will suffer. In addition, increases in the price of our products to compensate for increased costs of raw materials may reduce demand for our products and adversely affect our competitive position as compared to products made of other materials, such as wood and metal, that are not affected by changes in the price of resins and some of the other raw materials that we use in the manufacture of our products.
We are dependent upon the ability of our suppliers to consistently provide raw materials that meet our specifications, quality standards and other applicable criteria. Our suppliers’ failure to provide raw materials that meet such criteria could adversely affect production schedules and our product quality, which in turn could materially adversely affect our business, financial condition and results of operations.
An interruption of our production capability at one or more of our manufacturing facilities from pandemics, accident, calamity or other causes, or events affecting the global economy, could adversely affect our business.
We manufacture our products at a limited number of manufacturing facilities, and we generally do not have redundant production capabilities that would enable us to shift production of a particular product rapidly to another facility in the event of a loss of one of or a portion of one of our manufacturing facilities. A catastrophic loss of the use of one or more of our manufacturing facilities due to pandemics, including the COVID-19 pandemic, accident, fire, explosion, labor issues, tornado, other weather conditions, natural disasters, condemnation, cancellation or non-renewals of leases, terrorist attacks or other acts of violence or war or otherwise could have a material adverse effect on our production capabilities. In addition, unexpected failures, including as a result of power outages or similar disruptions outside of our control, of our equipment and machinery could result in production delays or the loss of raw materials or products in the equipment or machinery at the time of such failures. Any of these events could result in substantial revenue loss and repair costs. An interruption in our production capabilities could also require us to make substantial capital expenditures
26
Table of Contents
to replace damaged or destroyed facilities or equipment. There are a limited number of manufacturers that make some of the equipment we use in our manufacturing facilities, and we could experience significant delay in replacing manufacturing equipment necessary to resume production. An interruption in our production capability, particularly if it is of significant duration, could result in a permanent loss of customers who decide to seek alternate products.
Our business operations could be adversely affected by the loss of the services from members of our senior management team and other key employees.
Our success depends in part on the continued contributions of our senior management and other key employees. Our senior leadership team members have extensive sales and marketing, engineering, product development, manufacturing and finance backgrounds in our industry. This experience also includes specialized knowledge and expertise relating to the manufacturing and production of composite Outdoor Living products and recycled materials, a combination which may be particularly hard to replace considering the limited number of companies that produce such products in general and particularly with the breadth of our product offerings. The loss of any member of our senior management team or other key employees in the future could significantly impede our ability to successfully implement our business strategy, financial plans, product development goals, marketing initiatives and other objectives. Should we lose the services of any member of our senior management team or key personnel, replacing such personnel could involve a prolonged search and divert management time and attention and we may not be able to locate and hire a qualified replacement. We do not carry key man insurance to mitigate the financial effect of losing the services of any member of our management team.
Acquisitions or joint ventures we may pursue in the future may be unsuccessful.
We may consider the acquisition of other manufacturers or product lines of other businesses that either complement or expand our existing business, or may enter into joint ventures. For example, we have acquired a number of companies in our recent history, including with respect to both manufacturing operations and recycling initiatives. While we believe those acquisitions were successful in improving our business, we cannot assure you that we will be able to consummate any other acquisitions or joint ventures or that any future acquisitions or joint ventures will be able to be consummated at acceptable prices and on acceptable terms. Any future acquisitions or joint ventures we pursue may involve a number of risks, including some or all of the following:
| • | difficulty in identifying acceptable acquisition candidates; |
| • | the inability to consummate acquisitions or joint ventures on favorable terms and to obtain adequate financing, which financing may not be available to us at times, in amounts or on terms acceptable to us, if at all; |
| • | the diversion of management’s attention from our core businesses; |
| • | the disruption of our ongoing business; |
| • | entry into markets in which we have limited or no experience; |
| • | the inability to integrate our acquisitions or enter into joint ventures without substantial costs, delays or other problems; |
| • | unexpected liabilities for which we may not be adequately indemnified; |
| • | inability to enforce indemnification and non-compete agreements; |
| • | failing to successfully incorporate acquired product lines or brands into our business; |
| • | the failure of the acquired business or joint venture to perform as well as anticipated; |
| • | the failure to realize expected synergies and cost savings; |
27
Table of Contents
| • | the loss of key employees or customers of the acquired business; |
| • | increasing demands on our operational systems and the potential inability to implement adequate internal controls covering an acquired business or joint venture; |
| • | any requirement that we make divestitures of operations or property in order to comply with applicable antitrust laws; |
| • | possible adverse effects on our reported operating results, particularly during the first several reporting periods after the acquisition is completed; and |
| • | impairment of goodwill relating to an acquired business, which could reduce reported income. |
Any of these risks could have a material adverse effect on our business, financial condition or results of operations.
In addition, acquisitions or joint ventures could result in significant increases in our outstanding indebtedness and debt service requirements or could involve the issuance of preferred stock or common stock that would be dilutive to existing stockholders. Incurring additional debt to fund an acquisition may result in higher debt service and a requirement to comply with financial and other covenants in addition to those contained in our Senior Secured Credit Facilities, including potential restrictions on future acquisitions and distributions. Funding an acquisition with our existing cash would reduce our liquidity. The terms of our existing and future debt agreements may limit the size and/or number of acquisitions we can pursue or our ability to enter into a joint venture.
Our business could be adversely affected if we fail to maintain product quality and product performance at an acceptable cost or if we incur significant losses, increased costs or harm to our reputation or brand as a result of product liability claims or product recalls.
In order to maintain and increase our net sales and sustain profitable operations we must produce high quality products at acceptable manufacturing costs and yields. If we are unable to maintain the quality and performance of our products at acceptable costs, our brand, the market acceptance of our products and our results of operations would suffer. As we regularly modify our product lines and introduce changes to our manufacturing processes or incorporate new raw materials, we may encounter unanticipated issues with product quality or production delays. For example, we have recently introduced products that incorporate larger proportions of reclaimed raw materials, primarily reclaimed polyethylene and PVC. While we engage in product testing in an effort to identify and address any product quality issues before we introduce products to market, unanticipated product quality or performance issues may be identified after a product has been introduced and sold.
In addition, we face the risk of exposure to product liability or other claims, including class action lawsuits, in the event our products are, or are alleged to be, defective or have resulted in harm to persons or to property. We may in the future incur significant liabilities if product liability lawsuits against us are successful. We may also have to recall and/or replace defective products, which would also result in adverse publicity and loss of sales, and would result in us incurring costs connected with the recall, which could be material. Any losses not covered by insurance could have a material adverse effect on our business, financial condition and results of operations. Real or perceived quality issues, including those arising in connection with product liability lawsuits, warranty claims or recalls, could also result in adverse publicity, which could harm our brand and reputation and cause our sales to decline rapidly. In addition, any such issues may be seized on by competitors in efforts to increase their market share.
We provide product warranties and, if our product warranty obligations were significantly in excess of our reserves, our business, financial condition and results of operations could be materially and adversely affected.
28
Table of Contents
We provide various warranties on our products, ranging from five years to lifetime warranties depending on the product and subject to various limitations. Management estimates warranty reserves, based in part upon historical warranty costs, as a proportion of sales by product line. Management also considers various relevant factors, including our stated warranty policies and procedures, as part of the evaluation of our warranty liability. Because warranty issues may surface later in the life cycle of a product, management continues to review these estimates on a regular basis and considers adjustments to these estimates based on actual experience compared to historical estimates. Estimating the required warranty reserves requires a high level of judgment, especially as many of our products are at a relatively early stage in their product life cycles, and we cannot be sure that our warranty reserves will be adequate for all warranty claims that arise. We have recently increased our use of reclaimed materials in the manufacturing of our products. While we performed extensive testing in connection with the utilization of such materials, the use of reclaimed materials represents a recent and significant change in our business and the use of such materials may result in unanticipated product quality or performance issues and an increase in warranty claims for certain of our products. We have also recently introduced a new warranty that provides coverage for labor costs incurred in the replacement of products under warranty under specified circumstances. Although we have significant experience regarding warranty claims on our products generally, we do not have historical experience relating to warranty claims under the terms of this new warranty coverage. Warranty obligations in excess of our reserves could have a material adverse effect on our business, financial condition and results of operations.
We depend on third parties for transportation services, and the lack of availability of and/or increases in the cost of transportation could have a material adverse effect on our business and results of operations.
Our business depends on the transportation of both finished goods to our distributors and other customers and the transportation of raw materials to us primarily through the use of flatbed trucks and rail transportation. We rely on third parties for transportation of these items. The availability of these transportation services is subject to various risks, including those associated with supply shortages, change in fuel prices, work stoppages, operating hazards and interstate transportation regulations. In particular, a significant portion of our finished goods are transported by flatbed trucks, which are occasionally in high demand (especially at the end of calendar quarters) and/or subject to price fluctuations based on market conditions and the price of fuel.
If the required supply of transportation services is unavailable when needed, we may be unable to sell our products when they are requested by our customers. In that event, we may be required to reduce the price of the affected products, seek alternative and, potentially more costly, transportation services or be unable to sell the affected products. Similarly, if any of these transportation providers were unavailable to deliver raw materials to us in a timely manner, we may be unable to manufacture our products in response to customer demand. In addition, a significant increase in transportation rates or fuel surcharges could adversely affect our profitability. Any of these events could have a material adverse effect on our business and results of operations.
Increases in labor costs, potential labor disputes and work stoppages or an inability to hire skilled manufacturing, sales and other personnel could adversely affect our business.
An increase in labor costs, work stoppages or disruptions at our facilities or those of our suppliers or transportation service providers, or other labor disruptions, could decrease our sales and increase our expenses. In addition, although our employees are not represented by a union, our labor force may become subject to labor union organizing efforts, which could cause us to incur additional labor costs and increase the related risks that we now face.
The competition for skilled manufacturing, sales and other personnel is often intense in the regions in which our manufacturing facilities are located, including in Wilmington, Ohio and Scranton, Pennsylvania. A significant increase in the salaries and wages paid by competing employers could result in a reduction of our labor force, increases in the salaries and wages that we must pay or both. If we are unable to hire skilled manufacturing, sales and other personnel, our ability to execute our business plan, and our results of operations, would suffer.
29
Table of Contents
If we are unable to collect accounts receivable from one or more of our significant distributors, dealers or other customers, our financial condition and operating results could suffer.
We extend credit to our distributors and, to a lesser extent, dealers and other customers, based on an evaluation of their financial condition, and we generally do not require collateral to secure these extensions of credit. The financial health of many of our customers is affected by changes in the economy and the cyclical nature of the building industry. The effects of the COVID-19 pandemic and the related economic downturn or protracted or severe economic declines and cyclical downturns from other causes in the building industry may cause our customers to be unable to satisfy their payment obligations, including their debts to us. While we maintain allowances for doubtful accounts, these allowances may not be adequate to provide for actual losses, and our financial condition and results of operation could be materially and adversely affected if our losses from doubtful accounts significantly exceed our estimates.
We may incur goodwill and other intangible or long-lived asset impairment charges that adversely affect our operating results.
We review our goodwill and other intangibles not subject to amortization for impairment annually, or when events or circumstances indicate that it is more likely than not that the fair value of a reporting unit could be lower than its carrying value. Changes in economic or operating conditions impacting our estimates and assumptions could result in the impairment of our goodwill or long-lived assets. No impairments were recorded for the years ended September 30, 2020, 2019 or 2018, however an impairment of $32.2 million was recorded for the year ended September 30, 2017, with respect to one of our reporting units as a result of lower than anticipated sales revenue and operating margins due to manufacturing inefficiencies and service issues. In the event that we determine our goodwill or long-lived assets are impaired, we may be required to record a significant charge to earnings in our financial statements that could have a material adverse effect on our results of operations.
We have identified material weaknesses in our internal control over financial reporting. If our remediation of these material weaknesses is not effective, or if we identify additional material weaknesses in the future or otherwise fail to maintain an effective system of internal controls in the future, we may not be able to accurately or timely report our financial condition or results of operations, investors may lose confidence in the accuracy and completeness of our financial reports and the trading price of our Class A common stock may decline.
As of September 30, 2020, we determined that we have the following material weaknesses in our internal control over financial reporting. A material weakness is a deficiency, or a combination of deficiencies, in internal control over financial reporting, such that there is a reasonable possibility that a material misstatement of a company’s annual or interim financial statements will not be prevented or detected on a timely basis.
We did not design or maintain an effective control environment commensurate with our financial reporting requirements. Specifically, we lacked a sufficient complement of resources with an appropriate level of accounting knowledge, training and experience to appropriately analyze, record and disclose accounting matters timely and accurately. This material weakness resulted in the revision of our consolidated financial statements as of September 30, 2018 and for the year then ended, and in immaterial audit adjustments to our consolidated financial statements as of September 30, 2020, 2019, 2018 and 2017 and for the years then ended. This material weakness also contributed to the following additional material weakness.
We did not design and maintain effective controls over certain information technology, or IT, general controls for information systems and applications that are relevant to the preparation of the financial statements. Specifically, we did not design and maintain user access controls to ensure appropriate segregation of duties and that adequately restrict user and privileged access to financial applications, programs and data to appropriate company personnel. This material weakness did not result in a misstatement to our financial statements.
30
Table of Contents
Each of the material weaknesses described above involve control deficiencies that could result in a misstatement of one or more account balances or disclosures that would result in a material misstatement to the annual or interim consolidated financial statements that would not be prevented or detected, and, accordingly, we determined that these control deficiencies constitute material weaknesses.
These material weaknesses will not be remediated until our remediation plan has been fully implemented and we have concluded that our controls are operating effectively for a sufficient period of time, which includes additional testing of operating effectiveness. We cannot be certain that the steps we are taking will be sufficient to remediate the control deficiencies that led to our material weaknesses in our internal control over financial reporting or prevent future material weaknesses or control deficiencies from occurring. In addition, we cannot be certain that we have identified all material weaknesses in our internal control over financial reporting, or that in the future we will not have additional material weaknesses in our internal control over financial reporting. For more information related to our material weaknesses and their remediation, see “Item 9A—Controls and Procedures.”
If we fail to effectively remediate the material weaknesses in our internal control over financial reporting, or if we identify additional material weaknesses in the future or otherwise fail to maintain an effective system of internal controls in the future, we may be unable to accurately or timely report our financial condition or results of operations. We also could become subject to sanctions or investigations by the securities exchange on which our Class A common stock is listed, the SEC or other regulatory authorities. In addition, if we are unable to assert that our internal control over financial reporting is effective, or if our independent registered public accounting firm is unable to express an opinion as to the effectiveness of our internal control over financial reporting, when required, investors may lose confidence in the accuracy and completeness of our financial reports, we may face restricted access to the capital markets, and the trading price of our Class A common stock may decline.
If we fail to maintain an effective system of internal controls, our ability to produce timely and accurate financial statements or comply with applicable regulations could be impaired.
As a public company, we are subject to the reporting requirements of the Exchange Act, the Sarbanes-Oxley Act of 2002, or the Sarbanes-Oxley Act, and the rules and regulations and the listing standards of the NYSE.
The Sarbanes-Oxley Act requires, among other things, that we maintain effective disclosure controls and procedures and internal control over financial reporting. We are continuing to develop and refine our disclosure controls and other procedures that are designed to ensure that information required to be disclosed by us in the reports that we will file with the SEC is recorded, processed, summarized and reported within the time periods specified in SEC rules and forms and that information required to be disclosed in reports under the Exchange Act is accumulated and communicated to our principal executive and financial officers. We are also continuing to improve our internal control over financial reporting. In order to maintain and improve the effectiveness of our disclosure controls and procedures and internal control over financial reporting, we have expended, and anticipate that we will continue to expend, significant resources, including accounting-related costs and significant management oversight.
In addition to the material weaknesses in our internal control over financial reporting that we have identified, we may discover additional weaknesses in our disclosure controls and internal control over financial reporting in the future. Any failure to develop or maintain effective controls or any difficulties encountered in their implementation or improvement could harm our operating results or cause us to fail to meet our reporting obligations and may result in a restatement of our financial statements for prior periods. Any failure to implement and maintain effective internal control over financial reporting also could adversely affect the results of periodic management evaluations and annual independent registered public accounting firm attestation reports regarding the effectiveness of our internal control over financial reporting that we will eventually be required to include in
31
Table of Contents
our periodic reports that will be filed with the SEC. Ineffective disclosure controls and procedures and internal control over financial reporting could also cause investors to lose confidence in our reported financial and other information, which could have a negative effect on the trading price of our Class A common stock. In addition, if we are unable to continue to meet these requirements, we may not be able to remain listed on the NYSE. We are not currently required to comply with the SEC rules that implement Section 404 of the Sarbanes-Oxley Act and are therefore not required to make a formal assessment of the effectiveness of our internal control over financial reporting for that purpose. As a public company, we will be required to provide an annual management report on the effectiveness of our internal control over financial reporting commencing with our second annual report on Form 10-K.
Our independent registered public accounting firm is not required to formally attest to the effectiveness of our internal control over financial reporting until after we are no longer an “emerging growth company” as defined in the Jumpstart Our Business Startups Act, or the JOBS Act. At such time, our independent registered public accounting firm may issue a report that is adverse in the event it is not satisfied with the level at which our internal control over financial reporting is documented, designed or operating. Any failure to maintain effective disclosure controls and internal control over financial reporting could have a material adverse effect on our business and operating results and could cause a decline in the price of our Class A common stock.
Subjective estimates and judgments used by management in the preparation of our financial statements, including estimates and judgments that may be required by new or changed accounting standards, may impact our financial condition and results of operations.
The preparation of financial statements requires management to make estimates and judgments that affect the reported amounts of assets, liabilities, revenue and expenses including the accounting for rebates, warranties and recovery of goodwill. Due to the inherent uncertainty in making estimates, results reported in future periods may be affected by changes in estimates reflected in our financial statements for earlier periods. For example, prior to our secondary offering in September 2020, we estimated that we would recognize approximately $129.0 million to $152.0 million in stock-based compensation expense following our IPO, with approximately $25.0 million to $30.0 million of such amount recognized during fiscal year 2020. However, because of the secondary offering and the related vesting of certain equity awards, we recognized approximately $120.5 million of such stock-based compensation expense in fiscal year 2020. Estimates and judgments are continually evaluated and are based on historical experience and other factors, including expectations of future events that are believed to be reasonable under the circumstances. From time to time, there may be changes in the financial accounting and reporting standards that govern the preparation of our financial statements. These changes can materially impact how we record and report our financial condition and results of operations. In some instances, we could be required to apply a new or revised standard retrospectively. If the estimates and judgments we use in preparing our financial statements are subsequently found to be incorrect or if we are required to restate prior financial statements, our financial condition or results of operations could be significantly affected.
The estimates and forecasts of market opportunity and market growth included in this annual report may prove to be inaccurate, and we cannot assure you our business will grow at similar rates, or at all.
Estimates and forecasts of market size and opportunity and of market growth are subject to significant uncertainty and are based on assumptions and estimates that may not prove to be accurate. The estimates and forecasts in this annual report of the size of the markets that we may be able to address and the growth in these markets are subject to many assumptions and may prove to be inaccurate. We expect that the COVID-19 pandemic may materially affect the growth of various of the markets discussed in this annual report, and we cannot predict the extent to which those estimates will be affected. Further, we may not be able to address fully the markets that we believe we can address, and we cannot be sure that these markets will grow at historical rates or the rates we expect for the future. Even if we are able to address the markets that we believe represent our market opportunity and even if these markets experience the growth we expect, we may not grow our business at
32
Table of Contents
similar rates, or at all. Our growth is subject to many factors, including our success in implementing our business strategy, which is subject to many risks and uncertainties. Accordingly, the estimates and forecasts of market size and opportunity and of market growth included in this annual report may not be indicative of our future growth.
We may be subject to significant compliance costs as well as liabilities under environmental, health and safety laws and regulations which could materially and adversely affect our business, financial condition and operations.
Our past and present operations, assets and products are subject to regulation by extensive environmental laws and regulations at the federal, state and local levels. These laws regulate, among other things, air emissions, the discharge or release of materials into the environment, the handling and disposal of wastes, remediation of contaminated sites, worker health and safety and the impact of products on human health and safety and the environment. Under some of these laws, liability for contaminated property may be imposed on current or former owners or operators of the property or on parties that generated or arranged for waste sent to the property for disposal. Liability under these laws may be joint and several and may be imposed without regard to fault or the legality of the activity giving rise to the contamination. Our facilities are located on sites that have been used for manufacturing activities for an extended period of time, which increases the possibility of contamination being present. Despite our compliance efforts, we may still face material liability, limitations on our operations or fines or penalties for violations of environmental, health and safety laws and regulations, including releases of regulated materials and contamination by us or previous occupants at our current or former properties or at offsite disposal locations we use.
We are also subject to permitting requirements under environmental, health and safety laws and regulations applicable in the jurisdictions in which we operate. Those requirements obligate us to obtain permits from one or more governmental agencies in order to conduct our operations. Such permits are typically issued by state agencies, but permits and approvals may also be required from federal or local governmental agencies. The requirements for such permits vary depending on the location where our regulated activities are conducted. As with all governmental permitting processes, there is a degree of uncertainty as to whether a permit will be granted, the time it will take for a permit to be issued and the conditions that may be imposed in connection with the granting of the permit. Any failure to obtain or delay in obtaining a permit required for our operations, or the imposition of onerous conditions in any such permits, could adversely affect our business, financial condition and operations.
Applicable environmental, health and safety laws and regulations, and any changes to them or in their enforcement, may require us to make material expenditures with respect to ongoing compliance with, or remediation under, these laws and regulations or require that we modify our products or processes in a manner that increases our costs and/or reduces our profitability. For example, additional pollution control equipment, process changes or other environmental control measures may be needed at our facilities to meet future requirements. In addition, discovery of currently unknown or unanticipated soil or groundwater contamination at our properties could result in significant liabilities and costs. Accordingly, we are unable to predict the future costs of compliance with, or liability under, environmental, health and safety laws and regulations.
Our business operations could suffer if we fail to adequately protect our intellectual property rights, and we may experience claims by third parties that we are violating their intellectual property rights.
We rely on trademark and service mark protection to protect our brands, and we have registered or applied to register many of these trademarks and service marks. In particular, we believe the AZEK and AZEK Exteriors brands, the TimberTech brand and the VERSATEX brand are significant to the success of our business. In the event that our trademarks or service marks are successfully challenged and we lose the rights to use those trademarks or service marks, or if we fail to prevent others from using them (or similar marks), we could be forced to rebrand our products, requiring us to devote resources to advertising and marketing new brands. In addition, we cannot be sure that any pending trademark or service mark applications will be granted or will not
33
Table of Contents
be challenged or opposed by third parties or that we will be able to enforce our trademark rights against counterfeiters.
We generally rely on a combination of unpatented proprietary know-how and trade secrets, and to a lesser extent, patents to preserve our position in the market. Because of the importance of our proprietary know-how and trade secrets, we employ various methods to protect our intellectual property, such as entering into confidentiality agreements with third parties, and controlling access to, and distribution of, our proprietary information. We may not be able to deter current and former employees, contractors and other parties from breaching confidentiality obligations and misappropriating proprietary information. It is difficult for us to monitor unauthorized uses of our products and technology. Accordingly, these protections may not be adequate to prevent competitors from copying, imitating or reverse engineering our products or from developing and marketing products that are substantially equivalent to or superior to our own.
In addition, we have applied for patent protection relating to certain existing and proposed products, processes and services or aspects thereof. We cannot be sure that any of our pending patent applications will be granted or that any patents issued as a result of our patent applications will be of sufficient scope or strength to provide us with any meaningful protection or commercial advantage.
If third parties take actions that affect our rights or the value of our intellectual property or proprietary rights, or if we are unable to protect our intellectual property from infringement or misappropriation, other companies may be able to offer competitive products at lower prices, and we may not be able to effectively compete against these companies. In addition, if any third party copies or imitates our products in a manner that affects customer or consumer perception of the quality of our products, or of engineered products generally, our reputation and sales could suffer whether or not these violate our intellectual property rights.
In addition, we face the risk of claims that we are infringing third parties’ intellectual property rights. Any such claim, even if it is without merit, could be expensive and time-consuming to defend and could divert the time and attention of our management. An intellectual property claim against us that is successful could cause us to cease making or selling products that incorporate the disputed intellectual property, require us to redesign our products, which may not be feasible or cost effective, and require us to enter into costly royalty or licensing arrangements, any of which could have a material adverse effect on our business, financial condition and results of operations. Moreover, certain material technology and know-how we use to manufacture our products is licensed to us rather than owned by us, and our license is subject to termination in the event of uncured material breach, among other reasons.
Any major disruption or failure of our information technology systems or our website, or our failure to successfully implement new technology effectively, could adversely affect our business and operations.
We rely on various information technology systems, owned by us and third parties, to manage our operations, maintain books and records, record transactions, provide information to management and prepare our financial statements. In addition, we have made a significant investment in our website which we believe is critical for lead generation and is the primary forum through which we interact with end consumers. A failure of our information technology systems or our website to operate as expected could disrupt our business and adversely affect our financial condition and results of operations. These systems and our website are vulnerable to damage from hardware failure; fire; power loss; data network and telecommunications failure; loss or corruption of data and impacts of terrorism; natural disasters or other disasters. We may not have sufficient redundant operations to cover a loss or failure in a timely manner. In addition, the operation of these systems and our website is dependent upon third party technologies, systems and services, and support by third party vendors, and we cannot be sure that these third party systems, services and support will continue to be available to us without interruption, particularly in light of the disruptions stemming from the COVID-19 pandemic. Any damage to our information technology systems or website could cause interruptions to our operations that materially adversely affect our ability to meet customers’ requirements, resulting in an adverse impact to our
34
Table of Contents
business, financial condition and results of operations. Periodically, these systems and our website need to be expanded, updated or upgraded as our business needs change. We may not be able to successfully implement changes in our information technology systems and to our website without experiencing difficulties, which could require significant financial and human resources.
We face cybersecurity risks and risks arising from new regulations governing information security and privacy and may incur increasing costs in an effort to mitigate those risks.
We utilize systems and websites that allow for the secure storage and transmission of proprietary or confidential information regarding our customers, employees and others, including personal information. We may be vulnerable to, and unable to anticipate or detect, data security breaches and data loss, including rapidly evolving and increasingly sophisticated and prevalent cybersecurity attacks. In addition, data security breaches can also occur as a result of a breach by us or our employees or by persons with whom we have commercial relationships that result in the unauthorized release of personal or confidential information. In addition to our own databases, we use third-party service providers to store, process and transmit confidential or sensitive information on our behalf. A data security breach could occur in the future either at their location or within their systems that could affect our personal or confidential information.
A data security breach may expose us to a risk of loss or misuse of this information, and could result in significant costs to us, which may include, among others, fines and penalties, costs related to remediation, potential costs and liabilities arising from governmental or third-party investigations, proceedings or litigation, diversion of management attention and harm to our reputation. We could also experience delays or interruptions in our ability to function in the normal course of business, including delays in the fulfillment of customer orders or disruptions in the manufacture and shipment of products. In addition, actual or anticipated attacks may cause us to incur costs, including costs to deploy additional personnel and protection technologies, train employees and engage third-party experts and consultants. Any compromise or breach of our security could result in a violation of applicable privacy and other laws, significant legal and financial exposure, and a loss of confidence in our security measures, which could have an adverse effect on our business, financial condition and reputation.
The regulatory environment surrounding information security and privacy is increasingly demanding, with frequent imposition of new and changing requirements, which could cause us to incur substantial costs. In the United States, various laws and regulations apply to the collection, processing, disclosure and security of certain types of data, including the Electronic Communications Privacy Act, the Computer Fraud and Abuse Act, the Health Insurance Portability and Accountability Act of 1996, the Gramm Leach Bliley Act and various state laws relating to privacy and data security, including the California Consumer Privacy Act, which took effect on January 1, 2020.
Any failure or perceived failure by us to comply with laws, regulations, policies or regulatory guidance relating to privacy or data security may result in governmental investigations and enforcement actions, litigation, fines and penalties or adverse publicity, and could cause our customers and consumers to lose trust in us, which could have an adverse effect on our reputation and business.
Changes to legislative and regulatory policies related to home ownership may have a material adverse effect on our business, financial condition and results of operations.
Our markets are affected by legislative and regulatory policies that promote or do not promote home ownership, such as U.S. tax rules allowing for deductions of mortgage interest or interest on home equity loans. For example, the Tax Cuts and Jobs Act, or the Tax Act, which was enacted into law on December 22, 2017, imposes limitations on the deductibility of interest on mortgages qualifying of the home mortgage interest deduction. Beginning in 2018, taxpayers may only deduct interest on $750,000 of qualified residence loans, including home equity loans that are used to substantially improve the taxpayer’s home that secures the loan, a reduction from the prior limit of $1.0 million. As many consumers finance renovation projects that use our
35
Table of Contents
products with home equity loans, limitations on the deductibility of interest on those loans could reduce demand for our products. In addition, recent U.S. federal and state legislative and regulatory policies enacted in response to the COVID-19 pandemic provide various measures of relief for homeowners, primarily in the form of mortgage payment forbearance for homeowners with federally-backed mortgages and temporary moratoria on foreclosures and evictions. It remains uncertain whether or to what extent such relief measures could protect homeowners, including as a result of their possible expiration and non-renewal, and what impact they will have on the U.S. real estate market and the U.S. and global economies generally, and our business, financial condition and results of operations may be materially and adversely affected as a result. Future changes to laws or policies relating to these or similar matters could reduce demand for our products and have a material adverse effect on our business, financial condition and results of operations.
Many of our products must comply with local building codes and ordinances and failure of our products to comply with such codes and ordinances may have an adverse effect on our business.
Many of our products must comply with local building codes and ordinances. These codes and ordinances are subject to future government review and interpretation. If our products fail to comply with such local building codes or ordinances, our ability to market and sell such products would be impaired. Also, should these codes and ordinances be amended or expanded, or should new laws and regulations be enacted, we could incur additional costs or become subject to requirements or restrictions that require us to modify our products or adversely affect our ability to market and sell our products. Furthermore, failure of our products to comply with such codes or ordinances could subject us to negative publicity or damage our reputation.
Comprehensive tax reform legislation could adversely affect our business, financial condition and results of operations.
The Tax Act, among other things, contains significant changes to corporate taxation, including reduction of the corporate tax rate from a top marginal rate of 35% to a flat rate of 21%, limitation of the tax deduction for business interest expense to 30% of “adjusted taxable income” (roughly defined as earnings before interest, taxes, depreciation and amortization in the case of taxable years beginning before January 1, 2022 and earnings before interest and taxes thereafter), limitation of the deduction for net operating losses to 80% of current year taxable income and elimination of net operating loss carrybacks, one time taxation of offshore earnings at reduced rates regardless of whether they are repatriated, current U.S. taxation on foreign earnings earned by certain foreign subsidiaries (subject to certain important exceptions), immediate deductions for certain new investments instead of deductions for depreciation expense over time, and modifying or repealing many business deductions and credits. On March 27, 2020, in response to the COVID-19 pandemic, the CARES Act was signed into law and modifies certain provisions under the Tax Act. The CARES Act, among other things, increased the limitation on the deductibility of business interest to 50% of “adjusted taxable income” for taxable years beginning after December 31, 2018 and before January 1, 2021 and allows taxpayers to elect to compute the limitation on business interest expense for 2020 by using its “adjusted taxable income” from 2019. The CARES Act also suspends the 80% limitation on the deduction of net operating losses for taxable years beginning before January 1, 2021 and enables taxpayers to carry back net operating losses generated in a taxable year beginning after December 31, 2017 and before January 1, 2021 to each of the five preceding taxable years. The CARES Act also contains provisions relating to refundable payroll tax credits, deferment of employer side social security payments, alternative minimum tax credit refunds and technical corrections to tax depreciation methods for qualified improvement property that may impact our business and financial results. The most significant impacts of the Tax Act on our financial results to date have included lowering of the U.S. federal corporate income tax rate and remeasurement of our net deferred tax liabilities. During the year ended September 30, 2018, we recorded a $22.5 million net income tax benefit for the remeasurement of certain deferred taxes, and our effective tax rate for the year was significantly reduced by the recognition of this remeasurement. We expect the limitation under the Tax Act on the tax deduction of interest expense will limit our annual deductions of interest expense as a result of our significant outstanding indebtedness until we reduce our outstanding indebtedness or our adjusted earnings increase by an amount sufficient to permit full
36
Table of Contents
deductibility of our interest expense. In the event we are subject to limitations on the deductibility of interest under the Tax Act, we will be permitted an indefinite carryforward, and disallowed interest expense will be deductible in later years, subject to the same 30% limitation (or 50% limitation under the CARES Act for taxable years beginning after December 31, 2018 and before January 1, 2021) and to ownership change limitations under Sections 382 of the Internal Revenue Code of 1986, as amended, or the Code, similar to net operating losses.
We continue to examine the impact that the Tax Act and the CARES Act may have on our business in the longer term. Accordingly, notwithstanding the reduction in the corporate income tax rate, the overall impact on us of the Tax Act and the CARES Act is uncertain.
Our insurance coverage may be inadequate to protect against the potential hazards incident to our business.
We maintain property, business interruption, product liability and casualty insurance coverage, but such insurance may not provide adequate coverage against potential claims, including losses resulting from interruptions in our production capability or product liability claims relating to the products we manufacture. Consistent with market conditions in the insurance industry, premiums and deductibles for some of our insurance policies have been increasing and may, in the future, increase substantially. In some instances, some types of insurance may become available only for reduced amounts of coverage, if at all. In addition, our insurers could deny coverage for claims. If we were to incur a significant liability for which we were not fully insured or that our insurers disputed, our business, financial condition or results of operations could be materially adversely affected.
We are in the early stages of implementing strategic initiatives related to the use of recycled materials. If we fail to implement these initiatives as expected, our business, financial condition and results of operations could be adversely affected.
Our future financial performance depends in part on our management’s ability to successfully implement our strategic initiatives related to developing our recycling capabilities and other cost savings measures, with an aim to reduce our material costs, improve net manufacturing productivity and enhance our business operations. We are still in the early stages of material substitution across our manufacturing network and realizing the benefits of our investments in recycling. To achieve such benefits, we must recycle materials on a cost-effective basis and efficiently convert these materials into high-quality finished goods. This strategy involves significant risks, including the risks that:
Our profitability may be materially diminished. The variability of our raw material sources can result in considerable reduction in our operating rates and yields, which may more than offset any savings we realize from the low purchase price of the materials. We may not produce a sustainable return on investment. Our plants must convert our raw materials at high rates and net yields to generate the profit margins and cash flows necessary to achieve sustainable returns.
Changes in trade policies, including the imposition of tariffs, could negatively impact our business, financial condition and results of operations.
The current U.S. administration has signaled support for, and in some instances has taken action with respect to, major changes to certain trade policies, such as the imposition of tariffs on imported products and the withdrawal from or renegotiation of certain trade agreements, including the North American Free Trade Agreement. For example, the United States has increased tariffs on certain imports from China, as well as on steel and aluminum products imported from various countries. We procure certain of the raw materials we use in the manufacturing of our products directly or indirectly from outside of the United States. The imposition of tariffs and other potential changes in U.S. trade policy could increase the cost or limit the availability of raw materials, which could hurt our competitive position and adversely impact our business, financial condition and results of operations.
37
Table of Contents
We operate in select non-U.S. markets and are subject to the U.S. Foreign Corrupt Practices Act, or the FCPA, as well anti-corruption laws and regulations in other countries, in addition to laws and regulations relating to export controls and economic sanctions. Violations of these laws and regulations could have a material adverse effect on our business, financial condition and results of operations.
We are subject to various U.S. and non-U.S. anti-corruption laws, including the FCPA, collectively, the Anti-Corruption Laws. These laws generally prohibit companies and their intermediaries from engaging in bribery or making other improper payments of cash (or anything else of value) to government officials and other persons in order to obtain or retain business. Our business operations also must be conducted in compliance with applicable export control and economic sanctions laws and regulations, collectively, the Trade Controls, including rules administered by the U.S. Department of the Treasury’s Office of Foreign Assets Control, the U.S. Department of State, the U.S. Department of Commerce, the United Nations Security Council, and other relevant authorities.
We strive to conduct our business activities in compliance with applicable Anti-Corruption Laws and Trade Controls, and we are not aware of issues of historical noncompliance. However, full compliance cannot be guaranteed. Further expansion outside the United States would likely increase our future legal exposure. Violations of Anti-Corruption Laws or Trade Controls, or even allegations of such violations, could result in civil or criminal penalties, as well as disrupt our business, operations, financial condition and results of operations. Further, changes to the applicable laws and regulations, and/or significant business growth, may result in the need for increased compliance-related resources and costs.
Risks Relating to Our Indebtedness
Our substantial indebtedness could materially adversely affect our financial condition.
We have a significant amount of indebtedness. As of September 30, 2020, our total indebtedness was $467.7 million under our first lien credit facility, or the Term Loan Agreement.
Our substantial indebtedness could have important consequences to the holders of our Class A common stock, including the following:
| • | making it more difficult for us to satisfy our obligations with respect to our other debt; |
| • | limiting our ability to obtain additional financing to fund future working capital, capital expenditures, acquisitions or other general corporate requirements; |
| • | requiring us to dedicate a substantial portion of our cash flows to debt service payments instead of other purposes, thereby reducing the amount of cash flows available for working capital, capital expenditures, acquisitions and other general corporate purposes; |
| • | increasing our vulnerability to general adverse economic and industry conditions; |
| • | exposing us to the risk of increased interest rates as certain of our borrowings, including borrowings under the Term Loan Agreement and our revolving credit agreement, or the Revolving Credit Facility, and, together, with the Term Loan Agreement, the Senior Secured Credit Facilities, are at variable rates of interest; |
| • | limiting our flexibility in planning for and reacting to changes in the industry in which we compete; |
| • | placing us at a disadvantage compared to other, less leveraged competitors; and |
| • | increasing our cost of borrowing. |
In addition, the credit agreements that govern the Senior Secured Credit Facilities contain restrictive covenants that limit our ability to engage in activities that may be in our long-term best interest. Our failure to
38
Table of Contents
comply with those covenants could result in an event of default which, if not cured or waived, could result in the acceleration of all our debt.
The Term Loan Agreement will mature on May 5, 2024, and the Revolving Credit Facility will mature on March 9, 2022. We may need to refinance all or a portion of our indebtedness on or before the maturity thereof. We may not be able to obtain such financing on commercially reasonable terms or at all. Failure to refinance our indebtedness could have a material adverse effect on us.
We may not be able to generate sufficient cash to service all of our indebtedness and may be forced to take other actions to satisfy our obligations under our indebtedness, which may not be successful.
Our ability to make scheduled payments on or refinance our debt obligations depends on our financial condition and operating performance, which are subject to prevailing economic and competitive conditions and to financial, business, legislative, regulatory and other factors, some of which are beyond our control. We cannot be sure that our business will generate sufficient cash flows from operating activities, or that future borrowings will be available, to permit us to pay the principal, premium, if any, and interest on our indebtedness.
If our cash flows and capital resources are insufficient to fund our debt service obligations, we could face substantial liquidity problems and could be forced to reduce or delay investments and capital expenditures or to dispose of material assets or operations, seek additional debt or equity capital or restructure or refinance our indebtedness. We may not be able to effect any such alternative measures, if necessary, on commercially reasonable terms or at all and, even if successful, those alternative actions may not allow us to meet our scheduled debt service obligations. The credit agreements that govern the Senior Secured Credit Facilities restrict our ability to dispose of assets and use the proceeds from those dispositions and may also restrict our ability to raise debt or equity capital to be used to repay other indebtedness when it becomes due. We may not be able to consummate those dispositions or to obtain proceeds in an amount sufficient to meet any debt service obligations then due.
Our inability to generate sufficient cash flows to satisfy our debt obligations, or to refinance our indebtedness on commercially reasonable terms or at all, would have a material adverse effect on our financial condition and results of operations.
If we cannot make scheduled payments on our debt, we will be in default, and the lenders under the Senior Secured Credit Facilities could terminate their commitments to loan money, the lenders could foreclose against the assets securing their borrowings and we could be forced into bankruptcy or liquidation. Any of these events could result in you losing all or a portion of your investment in the Class A common stock.
Despite our current level of indebtedness, we and our subsidiaries may still be able to incur substantially more debt. This could further exacerbate the risks to our financial condition described herein.
We and our subsidiaries may be able to incur significant additional indebtedness in the future. Although the credit agreements that govern the Senior Secured Credit Facilities contain restrictions on the incurrence of additional indebtedness, these restrictions are subject to a number of qualifications and exceptions, and the additional indebtedness incurred in compliance with these restrictions could be substantial. These restrictions also will not prevent us from incurring obligations that do not constitute indebtedness. As of September 30, 2020 and 2019, we had commitments available for borrowing under the Revolving Credit Facility of up to $150.0 million. We also have the option to increase the commitments under the Revolving Credit Facility by up to $100.0 million, subject to certain conditions.
Because our borrowing capacity under the Revolving Credit Facility depends, in part, on inventory, accounts receivable and other assets that fluctuate from time to time, the amount of commitments may not reflect actual borrowing capacity. In addition, the Term Loan Agreement provides for additional uncommitted
39
Table of Contents
incremental term loans of up to $150.0 million, with additional incremental term loans available if certain leverage ratios are maintained. All of those borrowings would be secured by first-priority liens on our property.
The terms of the credit agreements that govern the Senior Secured Credit Facilities may restrict our current and future operations, including our ability to respond to changes or to take certain actions.
The credit agreements that govern the Senior Secured Credit Facilities contain a number of restrictive covenants that impose significant operating and financial restrictions on us and may limit our ability to engage in acts that may be in our long-term best interest. See “Management’s Discussion and Analysis of Financial Condition and Results of Operations—Indebtedness.” The restrictive covenants under the Senior Secured Credit Facilities include restrictions on our ability to:
| • | incur additional indebtedness and guarantee indebtedness; |
| • | pay dividends or make other distributions or repurchase or redeem our capital stock; |
| • | prepay, redeem or repurchase junior debt; |
| • | issue certain preferred stock or similar equity securities; |
| • | make loans and investments; |
| • | sell assets or property, except in certain circumstances; |
| • | incur liens; |
| • | enter into transactions with affiliates; |
| • | modify or waive certain material agreements in a manner that is adverse in any material respect to the lenders; |
| • | enter into agreements restricting our subsidiaries’ ability to pay dividends; and |
| • | make fundamental changes in our business, corporate structure or capital structure, including, among other things, entering into mergers, acquisitions, consolidations and other business combinations or selling all or substantially all of our assets. |
As a result of these restrictions, we may be:
| • | limited in how we conduct our business; |
| • | unable to raise additional debt or equity financing to operate during general economic or business downturns; or |
| • | unable to compete effectively or to take advantage of new business opportunities. |
These restrictions may affect our ability to grow in accordance with our strategy. If we incur indebtedness provided or guaranteed by the U.S. Government, including pursuant to the CARES Act, we may be subject to additional restrictions on our operations, including limitations on employee headcount and compensation reductions and other cost reduction activities.
A breach of the covenants or restrictions under the credit agreements that govern the Senior Secured Credit Facilities could result in a default or an event of default. Such a default may allow the creditors to accelerate the related debt and may result in the acceleration of any other debt to which a cross-acceleration or cross-default provision applies. In addition, an event of default under the Senior Secured Credit Facilities would permit the lenders under the Revolving Credit Facility to terminate all commitments to extend further credit under such facility. Furthermore, if we were unable to repay the amounts due and payable under the Senior Secured Credit Facilities, those lenders under each facility could proceed against the collateral granted to them to secure that indebtedness. In the event our lenders were to accelerate the repayment of our indebtedness, we and
40
Table of Contents
our subsidiaries may not have sufficient assets to repay that indebtedness. In exacerbated or prolonged circumstances, one or more of these events could result in our bankruptcy or liquidation.
We rely on available borrowings under the Revolving Credit Facility for cash to operate our business, and the availability of credit under the Revolving Credit Facility may be subject to significant fluctuation.
In addition to cash we generate from our business, our principal existing source of cash is borrowings available under the Revolving Credit Facility. As of September 30, 2020 and 2019, we had commitments available to be borrowed under the Revolving Credit Facility of up to $150.0 million. We also have the option to increase the commitments under the Revolving Credit Facility by up to $100.0 million, subject to certain conditions. There are limitations on our ability to incur the full $150.0 million of existing commitments under the Revolving Credit Facility. Availability will be limited to the lesser of a borrowing base and $150.0 million. The borrowing base is calculated on a monthly (or more frequent under certain circumstances) valuation of our inventory, accounts receivable and certain cash balances. As a result, our access to credit under the Revolving Credit Facility is potentially subject to significant fluctuation, depending on the value of the borrowing base-eligible assets as of any measurement date. On June 5, 2020, we entered into an amendment to the Revolving Credit Facility, or the RCF Amendment, which established $8.5 million of commitments for FILO Loans under the Revolving Credit Facility. The FILO Loans are available to be drawn in a single disbursement on or prior to December 31, 2020. The availability of the FILO Loans will be subject to satisfaction of certain conditions at the time of borrowing, including the value of borrowing-base eligible assets at the time of borrowing. Under the terms of the Revolving Credit Facility as amended by the RCF Amendment, FILO Loans may be borrowed against increased percentages of borrowing-base eligible assets (as compared to the percentages of borrowing-base eligible assets applicable to all other loans under the Revolving Credit Facility). The RCF Amendment did not increase the total aggregate amount of commitments under the Revolving Credit Facility. Borrowing of FILO Loans under the Revolving Credit Facility will reduce the total aggregate commitments available for revolving loans for so long as the FILO Loans remain outstanding. If borrowed, the FILO Loans will mature on December 4, 2021. As of September 30, 2020, we have not drawn on the FILO loans. There is no assurance that we will be able to draw on the FILO Loans at any time. The inability to borrow under the Revolving Credit Facility may adversely affect our liquidity, financial position and results of operations.
Our variable rate indebtedness subjects us to interest rate risk, which could cause our debt service obligations to increase significantly.
Borrowings under the Senior Secured Credit Facilities are at variable rates of interest and expose us to interest rate risk. If interest rates were to increase, our debt service obligations on the variable rate indebtedness would increase even though the amount borrowed remained the same, and our net income and cash flows, including cash available for servicing our indebtedness, will correspondingly decrease. Based on amounts outstanding as of September 30, 2020 and 2019, each 100 basis point change in interest rates would result in a $4.7 million and $8.1 million change, respectively, in annual interest expense on our indebtedness under the Senior Secured Credit Facilities. We do not currently hedge the risk of changes in the interest rate under the Senior Secured Credit Facilities. In the future, we may enter into interest rate swaps that involve the exchange of floating for fixed rate interest payments or other instruments in order to reduce interest rate volatility. However, even if we do enter into interest rate swaps, we may not maintain interest rate swaps with respect to all of our variable rate indebtedness, and any swaps or other instruments we enter into may not fully mitigate our interest rate risk.
Uncertainty relating to the LIBOR calculation process and potential phasing out of LIBOR in the future may adversely affect our financing costs.
Currently, the Revolving Credit Facility and the Term Loan Agreement utilize the London Interbank Offered Rate, or LIBOR, or various alternative methods set forth in the Revolving Credit Facility and the Term Loan Agreement to calculate interest on any borrowings. National and international regulators and law
41
Table of Contents
enforcement agencies have conducted investigations into a number of rates or indices known as “reference rates.” Actions by such regulators and law enforcement agencies may result in changes to the manner in which certain reference rates are determined, their discontinuance or the establishment of alternative reference rates. In particular, on July 27, 2017, the Chief Executive of the United Kingdom Financial Conduct Authority, or the FCA, which regulates LIBOR, announced that the FCA will no longer persuade or compel banks to submit rates for the calculation of LIBOR after 2021. Such announcement indicates that the continuation of LIBOR on the current basis cannot and will not be guaranteed after 2021. As a result, it appears highly likely that LIBOR will be discontinued or modified by 2021.
At this time, it is not possible to predict the effect that these developments, any discontinuance, modification or other reforms to LIBOR or any other reference rate, or the establishment of alternative reference rates may have on LIBOR, other benchmarks or LIBOR-based debt instruments. Uncertainty as to the nature of such potential discontinuance, modification, alternative reference rates or other reforms could cause the interest rate calculated for the Revolving Credit Facility and the Term Loan Agreement to be materially different than expected, which could have a material adverse effect on our financing costs.
Risks Relating to Ownership of Our Class A Common Stock
The market price of our Class A common stock may be volatile or may decline steeply or suddenly regardless of our operating performance, and we may not be able to meet investor or analyst expectations. You may not be able to resell your shares at or above the price you paid and may lose all or part of your investment.
If you purchase shares of Class A common stock, you may not be able to resell those shares at or above the price you paid. The market price of our Class A common stock may fluctuate or decline significantly in response to numerous factors, many of which are beyond our control, including:
| • | the impacts of the COVID-19 pandemic on us and the national and global economies; |
| • | actual or anticipated fluctuations in our revenues or other operating results; |
| • | variations between our actual operating results and the expectations of securities analysts, investors and the financial community; |
| • | any forward-looking financial or operating information we may provide to the public or securities analysts, any changes in this information or our failure to meet expectations based on this information; |
| • | actions of securities analysts who initiate or maintain coverage of us, changes in financial estimates by any securities analysts who follow us or our failure to meet these estimates or the expectations of investors; |
| • | additional shares of Class A common stock being sold into the market by us or our stockholders, or the anticipation of such sales, including if certain of our stockholders sell shares into the market when the applicable “lock-up” periods end for such stockholders; |
| • | announcements by us or our competitors of significant products or features, innovations, acquisitions, strategic partnerships, joint ventures, capital commitments, divestitures or other dispositions; |
| • | loss of relationships with significant distributors, dealers or other customers; |
| • | changes in operating performance and stock market valuations of companies in our industry, including our competitors; |
| • | increases in interest rates or changes in tax laws that make it more costly for consumers to finance home renovation or purchases; |
| • | difficulties in integrating any new acquisitions we may make; |
42
Table of Contents
| • | loss of services from members of management or employees or difficulty in recruiting additional employees; |
| • | continued worsening of economic conditions in the United States and reduction in demand for our products, including any uncertainty as a result of the recent U.S. presidential election; |
| • | price and volume fluctuations in the overall stock market, including as a result of general economic trends; |
| • | lawsuits threatened or filed against us, or events that negatively impact our reputation; and |
| • | developments in new legislation and pending lawsuits or regulatory actions, including interim or final rulings by judicial or regulatory bodies. |
In addition, extreme price and volume fluctuations in the stock markets have affected and continue to affect the stock prices of many companies. Often, their stock prices have fluctuated in ways unrelated or disproportionate to their operating performance. In the past, stockholders have filed securities class action litigation against companies following periods of market volatility. Such securities litigation, if instituted against us, could subject us to substantial costs, divert resources and the attention of management from our business and seriously harm our business.
An active trading market for our Class A common stock may not be sustained.
Our Class A common stock is listed on the NYSE under the symbol “AZEK”. However, we cannot be certain that an active trading market for our Class A common stock will be sustained on that exchange or elsewhere. Furthermore, we cannot be certain that we will continue to satisfy the continued listing standards of the NYSE. If we fail to satisfy the continued listing standards, we could be de-listed, which would have a material adverse effect on the liquidity and price of our Class A common stock.
Future sales of our Class A common stock and other actions by our existing stockholders could cause our stock price to decline.
If our existing stockholders, including employees, who are currently restricted from selling shares of our Class A common stock into the public markets, sell or indicate an intention to sell, substantial amounts of our Class A common stock in the public market after such restrictions expire, the trading price of our Class A common stock could decline.
In connection with our IPO, we and substantially all of our pre-IPO stockholders entered into agreements with the IPO underwriters under which we and they have agreed, subject to certain exceptions, not to dispose of any shares of common stock, any options or warrants to purchase any shares of common stock or any securities convertible into or exchangeable for or that represent the right to receive shares of common stock during the period from the date of the prospectus relating to our IPO continuing through the date 180 days after the date of such prospectus. In addition, we, certain stockholders who sold shares pursuant to a registered secondary offering in September 2020 and our directors and officers entered into substantially identical lock-up agreements with the underwriters of that secondary offering, restricting our and their ability to dispose of any shares of common stock, any options or warrants to purchase any shares of common stock or any securities convertible into or exchangeable for or that represent the right to receive shares of common stock for 90 days from the date of the secondary offering prospectus, subject to certain exceptions.
In connection with the secondary offering, the IPO underwriters waived the lock-up agreements entered into at the IPO by our stockholders (excluding the Sponsors, as defined in our certificate of incorporation, and our officers and directors) with respect to an aggregate 1.0 million shares (representing 26.4% of the total number of shares and options to purchase shares of our Class A common stock held by such holders,
43
Table of Contents
in each case that are vested or will be vested at the time of the secondary offering and are subject to lock-up). This percentage is equal to the percentage of shares of our common stock held by each of our Sponsors that each of the Sponsors sold in the secondary offering, after giving effect to the underwriters’ option to purchase additional shares, which was exercised in connection with the closing of the secondary offering. The remainder of the shares held by such stockholders as of the IPO will remain subject to the IPO lock-up which will continue through and including December 8, 2020.
When the lock-up periods in these agreements expire, we and our stockholders subject to such lock-ups will be able to sell shares in the public market. In addition, Barclays Capital Inc. and BofA Securities, Inc., as representatives of the underwriters in the IPO and in the secondary offering, may, together in their sole discretion, release all or some portion of the shares subject to the lock-up agreements prior to the expiration of the lock-up periods. Sales of a substantial number of such shares, or the perception that such sales may occur, upon the expiration or early release of the securities subject to the lock-up agreements could cause the price of our Class A common stock to decline or make it more difficult for you to sell your Class A common stock at a time and price that you deem appropriate. In addition, the Sponsors have demand and “piggy-back” registration rights with respect to our common stock, which give them the right to require us to file registration statements for public resale of the shares of our common stock that they own or to include such shares in registration statements that we may file for us or other stockholders.
We currently do not intend to pay dividends on our Class A common stock, and our indebtedness could limit our ability to pay dividends on our Class A common stock.
We currently do not anticipate paying any cash dividends for the foreseeable future. In addition, the terms of our indebtedness limit our ability to pay dividends or make other distributions on, or to repurchase or redeem, shares of our capital stock. Consequently, your only opportunity to achieve a return on your investment in our company will be if the market price of our Class A common stock appreciates and you sell your shares at a profit. There is no guarantee that the price of our Class A common stock that will prevail in the market after this offering will ever exceed the price that you pay. We cannot be sure that we will pay dividends in the future or continue to pay dividends if we do commence paying dividends.
If securities or industry analysts either do not publish research about us or publish inaccurate or unfavorable research about us, our business or our market, if they adversely change their recommendations regarding our Class A common stock, or if our operating results do not meet their expectations or any financial guidance we may provide, the trading price or trading volume of our Class A common stock could decline.
The trading market for our Class A common stock is influenced in part by the research and reports that securities or industry analysts publish about us, our business, our market or our competitors. We do not have any control over these analysts. If one or more of the analysts initiate research with an unfavorable rating or downgrade our Class A common stock, provide a more favorable recommendation regarding our competitors or publish inaccurate or unfavorable research about our business, our Class A common stock price would likely decline. If one or more analysts who may cover us were to cease coverage of us or fail to regularly publish reports on us, we could lose visibility in the financial markets, which in turn could cause the trading price or trading volume of our Class A common stock to decline.
In addition, we have provided and expect to continue to provide various measures of financial guidance, possibly including guidance related to non-GAAP financial measures, and, if we do not meet any financial guidance that we may provide to the public, if we do not meet expectations of securities analysts or investors, or if our guidance is misunderstood by securities analysts or investors, the trading price of our Class A common stock could decline significantly. Our operating results may fluctuate significantly from period to period as a result of changes in a variety of factors affecting us or our industry, many of which are difficult to predict. As a result, we may experience challenges in forecasting our operating results for future periods.
44
Table of Contents
Future issuances of our Class A common stock, including upon conversion of our Class B common stock, could result in significant dilution to our stockholders, dilute the voting power of our Class A common stock and depress the market price of our Class A common stock.
Future issuances of our Class A common stock could result in dilution to existing holders of our Class A common stock. Such issuances, or the perception that such issuances may occur, could depress the market price of our Class A common stock. We may issue additional equity securities from time to time, including equity securities that could have rights senior to those of our Class A common stock. As a result, purchasers of shares of Class A common stock in this offering bear the risk that future issuances of equity securities may reduce the value of their shares and dilute their ownership interests. Also, to the extent outstanding stock-based awards are issued or become vested, there will be further dilution to the holders of our Class A common stock.
We have a dual-class capitalization structure, which may pose a particular risk of dilution to the holders of our Class A common stock. Each share of our Class B common stock, which is not entitled to vote for the election, removal and replacement of our directors, is convertible at any time at the option of the holder of the Class B common stock into one share of Class A common stock, which is entitled to vote for the election, removal and replacement of our directors. Accordingly, conversion of shares of our Class B common stock into shares of our Class A common stock would dilute holders of Class A common stock in terms of voting power in connection with the election, removal and replacement of our directors.
We are incurring and will continue to incur increased costs and will continue to devote substantial management time as a result of operating as a public company.
As a public company, we are subject to the reporting requirements of the Exchange Act, and are required to comply with the applicable requirements of the Sarbanes-Oxley Act and the Dodd-Frank Wall Street Reform and Consumer Protection Act, as well as rules and regulations subsequently implemented by the SEC and the NYSE, including the establishment and maintenance of effective disclosure and financial controls and changes in corporate governance practices. Operating as a public company and complying with these requirements has increased our legal and financial compliance and investor relations costs and is making some activities more time consuming and costly. In addition, we expect that our management and other personnel will need to continue to divert attention from operational and other business matters to devote substantial time to these public company requirements. In particular, we are incurring significant expenses and devoting substantial management effort toward ensuring compliance with the requirements of Section 404 of the Sarbanes-Oxley Act, which will increase when we are no longer an emerging growth company, as defined by the JOBS Act. We cannot predict or estimate the amount of additional costs we may incur as a result of becoming a public company or the timing of those costs.
Public company reporting and disclosure obligations and a broader shareholder base as a result of our status as a public company may expose us to a greater risk of claims by shareholders, and we may experience threatened or actual litigation from time to time. If claims asserted in such litigation are successful, our business and operating results could be adversely affected, and, even if claims do not result in litigation or are resolved in our favor, these claims, and the time and resources necessary to resolve them and the diversion of management resources, could adversely affect our business and operating results.
We are an “emerging growth company” and are availing ourselves of reduced disclosure requirements applicable to emerging growth companies, which could make our common stock less attractive to investors.
We are an emerging growth company, as defined in the JOBS Act, and we are taking advantage of and may continue to take advantage of, for as long as five years following the completion of our IPO, certain exemptions from various reporting requirements that are applicable to other public companies that are not emerging growth companies, including not being required to comply with the auditor attestation requirements of
45
Table of Contents
Section 404(b) of the Sarbanes-Oxley Act, reduced disclosure obligations regarding executive compensation in our periodic reports and proxy statements and exemptions from the requirements of holding a nonbinding advisory vote on executive compensation and stockholder approval of any golden parachute payments not previously approved. In addition, under the JOBS Act, emerging growth companies can delay the adoption of certain new or revised accounting standards until those standards would otherwise apply to private companies.
We have elected to avail ourselves of this exemption from new or revised accounting standards and, therefore, we are not and will continue not to be subject to the same new or revised accounting standards as other public companies that are not emerging growth companies or that have opted out of using such extended transition period, which may make comparison of our financial statements with those of other public companies more difficult. We cannot predict if investors will find our Class A common stock less attractive because we are relying on these exemptions. If some investors find our Class A common stock less attractive as a result, there may be a less active trading market for our Class A common stock and our stock price may be more volatile.
Risks Relating to Our Organizational Structure
Provisions in our certificate of incorporation and bylaws, could make a merger, tender offer or proxy contest difficult, thereby depressing the trading price of our Class A common stock.
Our certificate of incorporation and bylaws contain provisions that could depress the trading price of our Class A common stock by acting to discourage, delay or prevent a change of control of our company or changes in our management that our stockholders may deem advantageous. In particular, our certificate of incorporation and bylaws:
| • | establish a classified board of directors so that not all members are elected at one time, which could delay the ability of stockholders to change the membership of a majority of our board of directors; |
| • | permit our board of directors to establish the number of directors and fill any vacancies (including vacancies resulting from an expansion in the size of our board of directors), except in the case of the vacancy of a Sponsor-designated director (in which case the Sponsor that designated the director will be able to fill the vacancy); |
| • | establish limitations on the removal of directors; |
| • | authorize the issuance of “blank check” preferred stock that our board of directors could use to implement a stockholder rights plan; |
| • | provide that our board of directors is expressly authorized to make, alter or repeal our bylaws; |
| • | restrict the forum for certain litigation against us to Delaware; |
| • | provide that stockholders may not act by written consent following the time when the Sponsors collectively cease to beneficially own at least a majority of the shares of our outstanding common stock, which time we refer to as the Trigger Date, which would require stockholder action to be taken at an annual or special meeting of our stockholders; |
| • | prohibit stockholders from calling special meetings following the Trigger Date, which would delay the ability of our stockholders to force consideration of a proposal or to take action, including with respect to the removal of directors; and |
| • | establish advance notice requirements for nominations for election to our board of directors or for proposing matters that can be acted upon by stockholders at annual stockholder meetings, which may discourage or deter a potential acquirer from conducting a solicitation of proxies to elect the acquirer’s own slate of directors or otherwise attempting to obtain control of us. |
Section 203 of the Delaware General Corporation Law, or the DGCL, prohibits a publicly held Delaware corporation from engaging in a business combination with an interested stockholder, generally a
46
Table of Contents
person, individually or together with any other interested stockholder, who owns or within the last three years has owned 15% of our voting stock, unless the business combination is approved in a prescribed manner. We have elected to opt out of Section 203 of the DGCL. However, our certificate of incorporation contains a provision that is of similar effect, except that it exempts from its scope the Sponsors, any of their affiliates and certain of their respective direct or indirect transferees.
Any provision of our certificate of incorporation, our bylaws or Delaware law that has the effect of delaying or deterring a change in control could limit the opportunity for our stockholders to receive a premium for their shares of Class A common stock and could also affect the price that some investors are willing to pay for our Class A common stock.
Our certificate of incorporation provides that the Court of Chancery of the State of Delaware is the exclusive forum for a wide range of disputes between us and our stockholders, which could limit our stockholders’ ability to obtain a favorable judicial forum for disputes with us or our directors, officers or employees.
Our certificate of incorporation provides that the Court of Chancery of the State of Delaware (or, if no state court located within the State of Delaware has jurisdiction, the federal district court for the District of Delaware) is the exclusive forum for the following types of actions or proceedings under Delaware statutory or common law:
| • | any derivative action or proceeding brought on our behalf; |
| • | any action asserting a breach of fiduciary duty owed by any director or officer or other employee to us or our stockholders; |
| • | any action asserting a claim against us or any of our directors, officers or other employees arising pursuant to any provision of the DGCL, our certificate of incorporation or our bylaws (as they may be amended from time to time); |
| • | any action asserting a claim against us or any of our directors, officers or other employees governed by the internal-affairs doctrine; |
| • | any action or proceeding to interpret, apply, enforce or determine the validity of our certificate of incorporation or our bylaws (including any right, obligation or remedy under our certificate of incorporation or our bylaws); and |
| • | any action or proceeding as to which the DGCL confers jurisdiction to the Court of Chancery of the State of Delaware. |
This provision does not apply to suits brought to enforce a duty or liability created by the Exchange Act or any other claim for which the U.S. federal courts have exclusive jurisdiction. Any person or entity purchasing or otherwise acquiring any interest in shares of our capital stock will be deemed to have notice of, and consented to, the exclusive-forum provisions in our certificate of incorporation.
The exclusive-forum provisions also provide that, unless we consent in writing to the selection of an alternative forum, the federal district courts of the United States will be the exclusive forum for the resolution of any complaint asserting a cause of action arising under the Securities Act of 1933, as amended, or the Securities Act, subject to and contingent upon a final adjudication in the State of Delaware of the enforceability of such exclusive-forum provision. However, there is substantial uncertainty as to whether a court would enforce the exclusive-forum provisions relating to causes of action arising under the Securities Act. If a court were to find any of the exclusive-forum provisions in our certificate of incorporation to be inapplicable or unenforceable in an action, we may incur additional costs associated with resolving the dispute in other jurisdictions, which could seriously harm our business.
47
Table of Contents
These exclusive-forum provisions may limit a stockholder’s ability to bring a claim in a judicial forum that it finds favorable for disputes with us or our directors, officers or employees, which may discourage lawsuits against us and our directors, officers and employees, although our stockholders will not be deemed to have waived our compliance with federal securities laws and the rules and regulations thereunder.
Our certificate of incorporation contains a provision renouncing our interest and expectancy in certain corporate opportunities.
Under our certificate of incorporation, neither of the Sponsors nor any of their respective portfolio companies, funds or other affiliates, nor any of their officers, directors, employees, agents, stockholders, members or partners currently have or will have any duty to refrain from engaging, directly or indirectly, in the same business activities, similar business activities, or lines of business in which we operate. In addition, our certificate of incorporation provides that, to the fullest extent permitted by law, no officer or director of ours who is also an officer, director, employee, agent, stockholder, member, partner or affiliate of either of the Sponsors is or will be liable to us or our stockholders for breach of any fiduciary duty by reason of the fact that any such individual directs a corporate opportunity to a Sponsor, instead of to us, or does not communicate information regarding a corporate opportunity to us that the officer, director, employee, agent, stockholder, member, partner or affiliate has directed to such Sponsor. For example, a director of our company who also serves as an officer, director, employee, agent, stockholder, member, partner or affiliate of one of the Sponsors, or any of their respective portfolio companies, funds, or other affiliates may pursue certain acquisitions or other opportunities that may be complementary to our business and, as a result, such acquisition or other opportunities may not be available to us. These potential conflicts of interest could have a material adverse effect on our business, financial condition, results of operations or prospects if attractive corporate opportunities are allocated by either of the Sponsors to itself or themselves or their respective portfolio companies, funds or other affiliates instead of to us.
We are a holding company and rely on dividends, distributions, and other payments, advances and transfers of funds from our subsidiaries to meet our obligations.
We are a holding company that does not conduct any business operations of our own. As a result, we are largely dependent upon cash distributions and other transfers from our direct and indirect subsidiaries to meet our obligations. The agreements governing the indebtedness of our subsidiaries impose restrictions on our subsidiaries’ ability to pay dividends or other distributions to us. See “Management’s Discussion and Analysis of Financial Condition and Results of Operations—Liquidity and Capital Resources—Liquidity Outlook—Holding Company Status.” Each of our subsidiaries is a distinct legal entity, and under certain circumstances legal and contractual restrictions may limit our ability to obtain cash from them and we may be limited in our ability to cause any future joint ventures to distribute their earnings to us. The deterioration of the earnings from, or other available assets of, our subsidiaries for any reason could impair their ability to make distributions to us.
We continue to be controlled by the Sponsors, and the Sponsors’ interests may conflict with our interests and the interests of other stockholders.
The Sponsors beneficially own a majority of our common stock. Pursuant to the stockholders agreement, or the Stockholders Agreement, entered into by us and the Sponsors prior to the IPO, the Sponsors have the right to designate a number of individuals to be included in the slate of nominees for election to our board of directors equal to the greater of up to six directors and the number of directors comprising a majority of our board of directors for so long as the Sponsors collectively own 50% or more of the outstanding shares of our common stock. Subject to certain exceptions, for so long as the Sponsors collectively own less than 50% of the outstanding shares of our common stock, the Sponsors will have the right to designate that number of individuals to be included in the slate of nominees for election to our board of directors (rounded up to the nearest whole number or, if such rounding would cause the Sponsors to have the right to elect a majority of our board of directors, rounded to the nearest whole number) that is the same percentage of the total number of directors
48
Table of Contents
comprising our board as the collective percentage of common stock owned by the Sponsors. Because our board of directors is divided into three staggered classes, the Sponsors may be able to influence or control our affairs and policies even after they cease to own a majority of our outstanding Class A common stock during the period in which the Sponsors’ nominees finish their terms as members of our board, but in any event no longer than would be permitted under applicable law and the NYSE listing requirements. Therefore, for so long as the Sponsors continue to own 50% or more of our common stock, individuals affiliated with the Sponsors will have the power to elect a majority of our directors and will have effective control over the outcome of votes on all matters requiring approval by our board of directors or our stockholders regardless of whether other stockholders believe such matter is in our best interests.
In addition, the Stockholders Agreement provides that, for so long as the Sponsors collectively own at least 30% of the outstanding shares of our common stock, certain significant corporate actions require the prior written consent of each of the Sponsors, subject to certain exceptions. If either Sponsor owns less than 10% of the outstanding shares of our common stock, such action will not be subject to the approval of such Sponsor and the shares of common stock owned by such Sponsor will be excluded in calculating the 30% threshold.
These actions include:
| • | merging or consolidating with or into any other entity, or transferring all or substantially all of our assets, taken as a whole, to another entity, or undertaking any transaction that would constitute a “Change of Control” as defined in our debt agreements; |
| • | acquiring or disposing of assets, in a single transaction or a series of related transactions, or entering into joint ventures, in each case with a value in excess of $75.0 million; |
| • | incurring indebtedness in a single transaction or a series of related transactions in an aggregate principal amount in excess of $100.0 million; |
| • | issuing our or our subsidiaries’ equity other than pursuant to an equity compensation plan approved by our stockholders or a majority of the directors designated by the Sponsors; |
| • | terminating the employment of our chief executive officer or hiring or designating a new chief executive officer; |
| • | entering into any transactions, agreements, arrangements or payments with either of the Sponsors or any other person who owns greater than or equal to 10% of our common stock then outstanding that are material or involve aggregate payments or receipts in excess of $500,000; |
| • | amending, modifying or waiving any provision of our organizational documents in a manner that adversely affects the Sponsors; |
| • | commencing any liquidation, dissolution or voluntary bankruptcy, administration, recapitalization or reorganization; |
| • | increasing or decreasing the size of our board of directors; and |
| • | entering into of any agreement to do any of the foregoing. |
The interests of the Sponsors and their affiliates, including funds affiliated with the Sponsors, could conflict with or differ from our interests or the interests of our other stockholders. For example, the concentration of ownership held by the Sponsors could delay, defer or prevent a change in control of our company or impede a merger, takeover or other business combination which may otherwise be favorable for us. Additionally, the Sponsors and their affiliates are in the business of making investments in companies and may, from time to time, acquire and hold interests in or provide advice to businesses that compete directly or indirectly with us, or are suppliers or customers of ours. Any such investment may increase the potential for the conflicts of interest discussed in this risk factor. So long as the Sponsors continue to directly or indirectly own a significant amount
49
Table of Contents
of our equity, even if such amount is less than 50%, the Sponsors will continue to be able to substantially influence or effectively control our ability to enter into corporate transactions.
We are a “controlled company” within the meaning of the NYSE rules and, as a result, qualify for and are relying on exemptions from certain corporate governance requirements.
The Sponsors control a majority of the voting power of our outstanding voting stock, and as a result we are a controlled company within the meaning of the NYSE corporate governance standards. Under the NYSE rules, a company of which more than 50% of the voting power is held by another person or group of persons acting together is a controlled company and may elect not to comply with certain corporate governance requirements, including the requirements that:
| • | a majority of the board of directors consist of independent directors; |
| • | the nominating and corporate governance committee be composed entirely of independent directors with a written charter addressing the committee’s purpose and responsibilities; and |
| • | the compensation committee be composed entirely of independent directors with a written charter addressing the committee’s purpose and responsibilities. |
We are utilizing and intend to utilize these exemptions as long as we remain a controlled company. As a result, until we are no longer a controlled company, we may not have a majority of independent directors and our nominating and corporate governance committee and compensation committee may not consist entirely of independent directors. Accordingly, you may not have the same protections afforded to stockholders of companies that are subject to all of the corporate governance requirements of the NYSE.
Pursuant to Rule 10C-1 under the Exchange Act, the NYSE has adopted amendments to its listing standards that require, among other things, that:
| • | compensation committees be composed of fully independent directors, as determined pursuant to new independence requirements; |
| • | compensation committees be explicitly charged with hiring and overseeing compensation consultants, legal counsel, and other committee advisors; and |
| • | compensation committees be required to consider, when engaging compensation consultants, legal counsel, or other advisors, certain independence factors, including factors that examine the relationship between the consultant or advisor’s employer and us. |
As a controlled company, we are not and will continue not to be subject to these compensation committee independence requirements.
Item 1B. Unresolved Staff Comments.
None.
We own manufacturing properties throughout the United States. We also lease certain properties from third parties. We are headquartered in Chicago, Illinois and operate eight manufacturing and recycling facilities in the United States. In alignment with our sustainability values, our Chicago corporate office is located in a 2019 LEED-Certified building. Our Residential segment products are produced primarily at our manufacturing facilities in Scranton, Pennsylvania; Wilmington, Ohio; Aliquippa, Pennsylvania and Eagan, Minnesota. Our Commercial segment products are produced primarily at our manufacturing facilities in Scranton, Pennsylvania.
50
Table of Contents
The following table provides details of our properties as of September 30, 2020:
| Owned | Leased | |||||||
| Location |
Square Feet | Square Feet | ||||||
| Scranton, PA |
617,760 | 286,458 | ||||||
| Wilmington, OH |
500,000 | 100,000 | ||||||
| Jeffersonville, OH |
— | 202,567 | ||||||
| Aliquippa, PA |
134,153 | 48,000 | ||||||
| Ashland, OH |
— | 97,650 | ||||||
| Eagan, MN |
— | 134,203 | ||||||
| Chicago, IL |
— | 20,981 | ||||||
We are implementing a multi-year $180.0 million capital investment program to support our future growth. As a part of that program and to address increased demand, we plan to add a new manufacturing facility.
From time to time, we may be involved in litigation relating to claims arising out of our operations and businesses that cover a wide range of matters, including, among others, contract and employment claims, personal injury claims, product liability claims and warranty claims. Currently, there are no claims or proceedings against us that we believe will have a material adverse effect on our business, financial condition, results of operations or cash flows. However, the results of any current or future litigation cannot be predicted with certainty and, regardless of the outcome, we may incur significant costs and experience a diversion of management resources as a result of litigation.
Environmental Laws and Regulations
Our operations and properties are subject to extensive and frequently changing federal, state and local environmental protection and health and safety laws, regulations and ordinances. These laws, regulations and ordinances, among other matters, govern activities and operations that may have adverse environmental effects, such as discharges to air, soil and water, and establish standards for the handling of hazardous and toxic substances and the handling and disposal of solid and hazardous wastes.
Some of the environmental laws applicable to us provide that a current or previous owner or operator of real property may be liable for the costs of removal or remediation of environmental contamination on, under, or in that property or other impacted properties. Accordingly, such liability could apply to us in connection with any of our current or former manufacturing plants or other properties. In addition, some of these laws provide that persons who arrange, or are deemed to have arranged, for the disposal or treatment of hazardous substances may also be liable for the costs of removal or remediation of environmental contamination at the disposal or treatment site, regardless of whether the affected site is owned or operated by such person. Environmental laws, in general, often impose liability whether or not the owner, operator or arranger knew of, or caused, the presence of such environmental contamination. Also, third parties may make claims against owners or operators of properties for personal injuries, for property damage and/or for clean-up associated with releases of hazardous or toxic substances pursuant to applicable environmental laws and common law tort theories, including strict liability. Failure to comply with environmental laws or regulations could result in severe fines and penalties.
We are also subject to permitting requirements under environmental, health and safety laws and regulations applicable in the jurisdictions in which we operate. Those requirements obligate us to obtain permits from one or more governmental agencies in order to conduct our operations. Such permits are typically issued by state agencies, but permits and approvals may also be required from federal or local governmental agencies. The requirements for such permits vary depending on the location where our regulated activities are conducted. As
51
Table of Contents
with all governmental permitting processes, there is a degree of uncertainty as to whether a permit will be granted, the time it will take for a permit to be issued and the conditions that may be imposed in connection with the granting of the permit.
We are not aware of any environmental liabilities that would be expected to have a material adverse effect on our business, financial condition or results of operations. We believe we comply in all material respects with environmental laws and regulations and possess the permits required to operate our manufacturing and other facilities. Our environmental compliance costs in the future will depend, in part, on the nature and extent of our manufacturing activities, regulatory developments and future requirements that cannot presently be predicted.
Health and Safety Matters
Our health and safety policies and practices include an employee training and competency development program to regularly train, verify and encourage compliance with health and safety procedures and regulations. We regularly monitor our total recordable incident rate, or TRIR, and as a result of our commitment to continuously improve our health and safety policies and practices, our TRIR has improved 45% from 4.02 in fiscal year 2016 to 2.22 in fiscal year 2020. We employ an environmental, health and safety director whose responsibilities include managing, auditing and executing unified, company-wide safety and compliance programs. The environmental, health and safety director reports directly to the Senior Vice President of Operations and also provides monthly updates to the Chief Executive Officer.
Item 4. Mine Safety Disclosures.
Not applicable.
52
Table of Contents
Item 5. Market for Registrant’s Common Equity, Related Stockholder Matters and Issuer Purchases of Equity Securities.
Our Class A common stock has been listed on the New York Stock Exchange under the symbol “AZEK” since June 12, 2020. Prior to that date, there was no public market for our Class A common stock. No established public trading market exists for our Class B common stock.
Holders of Record
As of November 18, 2020, there were approximately 18,839 stockholders of record of our Class A common stock, although we believe there is a significantly larger number of beneficial owners whose shares are held in street name by brokers and other nominees, and one holder of record of our Class B common stock.
Dividends
We did not pay any dividends on our common stock during the years ended September 30, 2020 and 2019. We currently intend to retain earnings, if any, to finance the growth and development of our business, and we do not expect to pay any cash dividends on our common stock in the foreseeable future. Payment of future dividends, if any, will be at the discretion of our board of directors and will depend on, among other things, our financial condition, results of operations, capital expenditure requirements, contractual restrictions, provisions of applicable law and other factors that our board of directors deems relevant.
Securities Authorized for Issuance Under Equity Compensation Plans
The following table provides information about our Class A common stock that may be issued upon exercise of options and other rights under our equity incentive compensation plan as of September 30, 2020:
| Number of securities to be issued upon exercise of outstanding options and vesting of restricted stock units |
Weighted average exercise price of outstanding options |
Number of securities remaining available for future issuance under equity compensation plans (excluding securities reflected in the first column) |
||||||||||
| 2020 Omnibus Incentive Compensation Plan |
5,279,506 | $ | 23.00 | 5,040,776 | ||||||||
Performance Graph
The following graph compares the cumulative total return on our Class A common stock since it began trading on the New York Stock Exchange on June 12, 2020 with the cumulative total return of the Russell 3000 Index and the S&P Composite 1500 Building Products Index. The graph assumes, in each case, an initial investment of $100 on June 12, 2020, based on the market price at the end of each month through and including September 30, 2020, and that all dividends paid by companies included in these indices have been reinvested. We did not pay any dividends during the period reflected in the graph.
53
Table of Contents
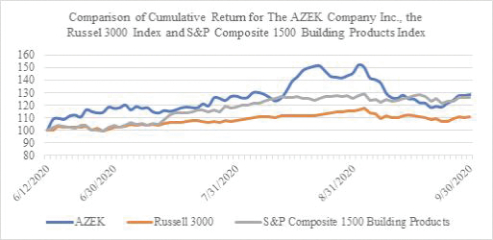
| June 12, 2020 | June 30, 2020 | July 31, 2020 | August 31, 2020 | September 30, 2020 | ||||||||||||||||
| The AZEK Company Inc. |
$ | 100.00 | $ | 117.35 | $ | 127.07 | $ | 145.41 | $ | 128.21 | ||||||||||
| Russel 3000 Index |
100.00 | 102.16 | 107.84 | 115.47 | 111.12 | |||||||||||||||
| S&P Composite 1500 Building Products Index |
100.00 | 103.85 | 118.83 | 125.76 | 125.90 | |||||||||||||||
The comparisons shown in the graph above are based on historical data, and are not indicative of, and are not intended to forecast, the potential future performance of our Class A common stock. The performance graph and other information furnished under this Part II Item 5 of this Annual Report shall not be deemed “soliciting material” or to be “filed” with the SEC or subject to Regulation 14A or 14C, or to the liabilities of Section 18 of the Exchange Act or otherwise subject to the liabilities under that Section, and shall not be deemed to be incorporated by reference into any filing of The AZEK Company Inc. under the Securities Act or the Exchange Act, whether made before or after the date hereof and irrespective of any general incorporation language in any such filing, unless we specifically incorporate it by reference into such filing.
Recent Sales of Unregistered Securities
Prior to the effectiveness of the registration statement relating to our IPO, we completed transactions pursuant to which a special purpose entity, CPG Holdco LLC, which was formed at the time of the acquisition of CPG Newco LLC by the Sponsors solely for the purpose of holding membership interests in CPG Newco LLC and that continued to hold such interests until immediately prior to our conversion into a corporation, merged with and into us, and we then converted from a Delaware limited liability company into a Delaware corporation. We refer to this series of transactions as the Corporate Conversion. In connection with the Corporate Conversion, our sole outstanding limited liability company unit was converted into 75,093,778 Class A units and 33,068,963 Class B units, which, simultaneously with our conversion into a corporation, was then converted into 75,093,778 shares of Class A common stock and 33,068,963 shares of Class B common stock on a one-for-one basis. AOT Building Products, L.P., as the sole owner of our equity interests following the merger with CPG Holdco LLC, received all of the Class A units and Class B units.
AOT Building Products, L.P. then liquidated and distributed the Class A units and Class B units to its equity-holders. Following such liquidation and distribution, the former equity-holders of AOT Building Products, L.P. owned all of our Class A units and Class B units, and, following the Corporate Conversion but prior to our IPO, owned all of the shares of our Class A common stock and Class B common stock.
The issuance of CPG Newco LLC units in the merger with CPG Holdco LLC was not registered under the Securities Act, and the units were issued to AOT Building Products, L.P., as the sole member of CPG Holdco
54
Table of Contents
LLC prior to the merger, in reliance upon the exemption from the registration requirements of the Securities Act set forth in Section 4(a)(2) of the Securities Act. The conversion of our units held by AOT Building Products, L.P.’s former equity-holders after the merger and the Corporate Conversion into shares of Class A common stock and Class B common stock was not registered under the Securities Act, and the shares were issued to AOT Building Products, L.P.’s former equity-holders in reliance upon the exemption from the registration requirements of the Securities Act set forth in Section 3(a)(9) and 4(a)(2) of the Securities Act.
Item 6. Selected Financial Data.
The selected consolidated statements of income data and selected consolidated statements of cash flow data for fiscal years 2020, 2019 and 2018 and the selected consolidated balance sheet data as of September 30, 2020 and 2019 have been derived from our Consolidated Financial Statements included elsewhere in this Annual Report. The selected consolidated statements of income data and selected consolidated statements of cash flow data for fiscal year 2017 have been derived from our Consolidated Financial Statements not included in this Annual Report. In the opinion of management, our Consolidated Financial Statements include all adjustments necessary for a fair presentation of the financial information set forth in those statements.
Our historical results are not necessarily indicative of future operating results. The selected financial data set forth below should be read together with “Management’s Discussion and Analysis of Financial Condition and Results of Operations” and our Consolidated Financial Statements and related Notes included elsewhere in this Annual Report.
| Years Ended September 30, | ||||||||||||||||
| (In thousands, except share and per share data) | 2020 | 2019 | 2018 | 2017 | ||||||||||||
| Consolidated Statements of Income Data: |
||||||||||||||||
| Net sales |
$ | 899,259 | $ | 794,203 | $ | 681,805 | $ | 632,631 | ||||||||
| Cost of sales |
603,209 | 541,006 | 479,769 | 463,643 | ||||||||||||
|
|
|
|
|
|
|
|
|
|||||||||
| Gross profit |
296,050 | 253,197 | 202,036 | 168,988 | ||||||||||||
| Selling, general and administrative expenses |
308,275 | 183,572 | 144,688 | 147,003 | ||||||||||||
| Impairment of goodwill |
— | — | — | 32,200 | ||||||||||||
| Impairment of property, plant and equipment |
— | — | — | 11,380 | ||||||||||||
| Other general expenses |
8,616 | 9,076 | 4,182 | — | ||||||||||||
| Loss on disposal of property, plant and equipment |
904 | 1,495 | 791 | 4,288 | ||||||||||||
|
|
|
|
|
|
|
|
|
|||||||||
| Operating income (loss) |
(21,745 | ) | 59,054 | 52,375 | 25,883 | |||||||||||
| Interest expense |
71,179 | 83,205 | 68,742 | 61,577 | ||||||||||||
| Loss on extinguishment of debt |
37,587 | — | — | — | ||||||||||||
|
|
|
|
|
|
|
|
|
|||||||||
| Income (loss) before income taxes |
(130,511 | ) | (24,151 | ) | (16,367 | ) | (87,460 | ) | ||||||||
| Income tax expense (benefit) |
(8,278 | ) | (3,955 | ) | (23,112 | ) | (20,049 | ) | ||||||||
|
|
|
|
|
|
|
|
|
|||||||||
| Net income (loss) |
$ | (122,233 | ) | $ | (20,196 | ) | $ | 6,745 | $ | (67,411 | ) | |||||
|
|
|
|
|
|
|
|
|
|||||||||
| Basic and diluted earnings (loss) per common share |
$ | (1.01 | ) | $ | (0.19 | ) | $ | 0.06 | $ | (0.62 | ) | |||||
|
|
|
|
|
|
|
|
|
|||||||||
| Basic and diluted weighted average common shares outstanding |
120,775,717 | 108,162,741 | 108,162,741 | 108,162,741 | ||||||||||||
|
|
|
|
|
|
|
|
|
|||||||||
| Consolidated Statements of Cash Flow Data: |
||||||||||||||||
| Net cash provided by (used in) operating activities |
$ | 98,361 | $ | 94,872 | $ | 67,302 | $ | 57,368 | ||||||||
| Net cash provided by (used in) investing activities |
(113,794 | ) | (62,935 | ) | (335,682 | ) | (22,511 | ) | ||||||||
| Net cash provided by (used in) financing activities |
124,498 | (8,273 | ) | 248,742 | (12,104 | ) | ||||||||||
| Purchases of property, plant and equipment |
(95,594 | ) | (63,006 | ) | (42,758 | ) | (22,511 | ) | ||||||||
55
Table of Contents
| As of September 30, | ||||||||||||||||
| (In thousands) | 2020 | 2019 | 2018 | 2017 | ||||||||||||
| Consolidated Balance Sheet Data: |
||||||||||||||||
| Cash and cash equivalents |
$ | 215,012 | $ | 105,947 | $ | 82,283 | $ | 101,921 | ||||||||
| Working capital |
300,655 | 150,593 | 138,870 | 148,719 | ||||||||||||
| Total assets |
1,931,856 | 1,788,263 | 1,779,180 | 1,522,758 | ||||||||||||
| Total current liabilities |
124,040 | 139,997 | 109,799 | 101,808 | ||||||||||||
| Total long-term debt — less current portion |
462,982 | 1,103,313 | 1,107,989 | 892,958 | ||||||||||||
| Total stockholders’ equity |
1,303,888 | 490,023 | 505,553 | 456,373 | ||||||||||||
Non-GAAP Financial Measures
To supplement our Consolidated Financial Statements prepared and presented in accordance with generally accepted accounting principles in the United States, or GAAP, we use certain non-GAAP performance financial measures, as described below, to provide investors with additional useful information about our financial performance, to enhance the overall understanding of our past performance and future prospects and to allow for greater transparency with respect to important metrics used by our management for financial and operational decision-making. We are presenting these non-GAAP financial measures to assist investors in seeing our financial performance from management’s view and because we believe they provide an additional tool for investors to use in comparing our core financial performance over multiple periods with other companies in our industry. Our GAAP financial results include significant expenses that are not indicative of our ongoing operations as detailed in the tables below.
However, non-GAAP financial measures have limitations in their usefulness to investors because they have no standardized meaning prescribed by GAAP and are not prepared under any comprehensive set of accounting rules or principles. In addition, non-GAAP financial measures may be calculated differently from, and therefore may not be directly comparable to, similarly titled measures used by other companies. As a result, non-GAAP financial measures should be viewed as supplementing, and not as an alternative or substitute for, our Consolidated Financial Statements prepared and presented in accordance with GAAP.
| Years Ended September 30, | ||||||||||||
| (In thousands) | 2020 | 2019 | 2018 | |||||||||
| Non-GAAP Financial Measures: |
||||||||||||
| Adjusted Gross Profit |
$ | 359,066 | $ | 314,858 | $ | 254,075 | ||||||
| Adjusted Gross Profit Margin |
39.9 | % | 39.6 | % | 37.3 | % | ||||||
| Adjusted Net Income |
$ | 72,632 | $ | 46,663 | $ | 44,645 | ||||||
| Adjusted Diluted EPS |
$ | 0.59 | $ | 0.43 | $ | 0.41 | ||||||
| Adjusted EBITDA |
$ | 213,513 | $ | 179,566 | $ | 150,065 | ||||||
| Adjusted EBITDA Margin |
23.7 | % | 22.6 | % | 22.0 | % | ||||||
Adjusted Gross Profit, Adjusted Gross Profit Margin, Adjusted Net Income, Adjusted Diluted EPS, Adjusted EBITDA, Adjusted EBITDA Margin and Net Leverage
We define Adjusted Gross Profit as gross profit before depreciation and amortization, business transformation costs and acquisition costs as described below. Adjusted Gross Profit Margin is equal to Adjusted Gross Profit divided by net sales. We define Adjusted Net Income as net income (loss) before amortization, stock-based compensation costs, business transformation costs, acquisition costs, initial public offering costs, capital structure transaction costs and certain other costs as described below. We define Adjusted Diluted EPS as Adjusted Net Income divided by weighted average common shares outstanding—diluted, to reflect the conversion or exercise, as applicable, of all outstanding shares of restricted stock awards, restricted stock units and options to purchase shares of our common stock. We define Adjusted EBITDA as net income (loss) before interest expense, net, income tax (benefit) expense and depreciation and amortization and by adding to or subtracting therefrom items of expense and income as described above. Adjusted EBITDA Margin is equal to
56
Table of Contents
Adjusted EBITDA divided by net sales. Net Leverage is equal to gross debt less cash and cash equivalents, divided by trailing twelve months Adjusted EBITDA. We believe Adjusted Gross Profit, Adjusted Gross Profit Margin, Adjusted Net Income, Adjusted Diluted EPS, Adjusted EBITDA, Adjusted EBITDA Margin and Net Leverage are useful to investors because they help identify underlying trends in our business that could otherwise be masked by certain expenses that can vary from company to company depending on, among other things, its financing, capital structure and the method by which its assets were acquired, and can also vary significantly from period to period. We also add back depreciation and amortization and stock-based compensation because we do not consider them indicative of our core operating performance. We believe their exclusion facilitates comparisons of our operating performance on a period-to-period basis. Therefore, we believe that showing gross profit and net income, as adjusted to remove the impact of these expenses, is helpful to investors in assessing our gross profit and net income performance in a way that is similar to the way management assesses our performance. Additionally, EBITDA and EBITDA margin are common measures of operating performance in our industry, and we believe they facilitate operating comparisons. Our management also uses Adjusted Gross Profit, Adjusted Gross Profit Margin, Adjusted EBITDA and Adjusted EBITDA Margin in conjunction with other GAAP financial measures for planning purposes, including as a measure of our core operating results and the effectiveness of our business strategy, and in evaluating our financial performance. Management considers Adjusted Gross Profit and Adjusted Net Income and Adjusted Diluted EPS as useful measures because our cost of sales includes the depreciation of property, plant and equipment used in the production of products and the amortization of various intangibles related to our manufacturing processes. Further, management considers Net Leverage as a useful measure to assess our borrowing capacity.
Adjusted Gross Profit, Adjusted Gross Profit Margin, Adjusted Net Income, Adjusted Diluted EPS, Adjusted EBITDA, Adjusted EBITDA Margin and Net Leverage have limitations as analytical tools, and you should not consider them in isolation or as a substitute for analysis of our results as reported under GAAP. Some of these limitations are:
| • | These measures do not reflect our cash expenditures, future requirements for capital expenditures or contractual commitments; |
| • | These measures do not reflect changes in, or cash requirements for, our working capital needs; |
| • | Adjusted EBITDA and Adjusted EBITDA Margin do not reflect the significant interest expense, or the cash requirements necessary to service interest or principal payments, on our debt; |
| • | Adjusted EBITDA and Adjusted EBITDA Margin do not reflect our income tax expense or the cash requirements to pay our taxes; |
| • | Adjusted Gross Profit, Adjusted Net Income, Adjusted Diluted EPS and Adjusted EBITDA exclude the expense of depreciation, in the case of Adjusted Gross Profit and Adjusted EBITDA, and amortization, in each case, of our assets, and, although these are non-cash expenses, the assets being depreciated or amortized may have to be replaced in the future; |
| • | Adjusted Net Income, Adjusted Diluted EPS and Adjusted EBITDA exclude the expense associated with our equity compensation plan, although equity compensation has been, and will continue to be, an important part of our compensation strategy; |
| • | Adjusted Gross Profit, Adjusted Net Income, Adjusted Diluted EPS and Adjusted EBITDA exclude certain business transformation costs, acquisition costs and other costs, each of which can affect our current and future cash requirements; and |
| • | Other companies in our industry may calculate Adjusted Gross Profit, Adjusted Gross Profit Margin, Adjusted Net Income, Adjusted Diluted EPS, Adjusted EBITDA, Adjusted EBITDA Margin and Net Leverage differently than we do, limiting their usefulness as comparative measures. |
Because of these limitations, none of these metrics should be considered indicative of discretionary cash available to us to invest in the growth of our business or as measures of cash that will be available to us to meet our obligations.
57
Table of Contents
The following table presents reconciliations of the most comparable financial measures calculated in accordance with GAAP to these non-GAAP financial measures for the periods indicated:
Adjusted Gross Profit and Adjusted Gross Profit Margin Reconciliation
| Years Ended September 30, | ||||||||||||
| (In thousands) | 2020 | 2019 | 2018 | |||||||||
| Gross profit |
$ | 296,050 | $ | 253,197 | $ | 202,036 | ||||||
| Depreciation and amortization (1) |
62,276 | 56,398 | 49,611 | |||||||||
| Business transformation costs (2) |
— | 5,263 | — | |||||||||
| Acquisition costs (3) |
665 | — | 2,428 | |||||||||
| Other costs (4) |
75 | — | — | |||||||||
|
|
|
|
|
|
|
|||||||
| Adjusted Gross Profit |
$ | 359,066 | $ | 314,858 | $ | 254,075 | ||||||
|
|
|
|
|
|
|
|||||||
| Years Ended September 30, | ||||||||||||
| 2020 | 2019 | 2018 | ||||||||||
| Gross margin |
32.9 | % | 31.9 | % | 29.6 | % | ||||||
| Depreciation and amortization |
6.9 | 7.1 | 7.3 | |||||||||
| Business transformation costs |
— | 0.6 | — | |||||||||
| Acquisition costs |
0.1 | — | 0.4 | |||||||||
| Other costs |
— | — | — | |||||||||
|
|
|
|
|
|
|
|||||||
| Adjusted Gross Profit Margin |
39.9 | % | 39.6 | % | 37.3 | % | ||||||
|
|
|
|
|
|
|
|||||||
| (1) | Depreciation and amortization for fiscal years 2020, 2019 and 2018 consists of $37.6 million, $28.9 million and $23.0 million, respectively, of depreciation and $24.7 million, $27.5 million and $26.6 million, respectively, of amortization of intangible assets, comprised of intangibles relating to our manufacturing processes. |
| (2) | Business transformation costs reflect startup costs of our new recycling facility of $5.3 million for fiscal year 2019. |
| (3) | Acquisition costs reflect inventory step-up adjustments related to recording the inventory of acquired businesses at fair value on the date of acquisition. |
| (4) | Other costs includes reduction in workforce costs of $0.1 million for fiscal year 2020. |
58
Table of Contents
Adjusted Net Income and Adjusted Diluted EPS Reconciliation
| Years Ended September 30, | ||||||||||||
| (In thousands) | 2020 | 2019 | 2018 | |||||||||
| Net income (loss) |
$ | (122,233 | ) | $ | (20,196 | ) | $ | 6,745 | ||||
| Amortization (1) |
55,144 | 60,226 | 51,372 | |||||||||
| Stock-based compensation costs |
120,517 | 3,682 | 3,099 | |||||||||
| Asset impairment costs (2) |
— | — | 920 | |||||||||
| Business transformation costs (3) |
594 | 16,560 | 5,822 | |||||||||
| Acquisition costs (4) |
1,596 | 4,110 | 7,361 | |||||||||
| Initial public offering and Secondary offering costs (5) |
8,616 | 9,076 | 789 | |||||||||
| Other costs (6) |
4,154 | (6,845 | ) | 1,667 | ||||||||
| Capital structure transaction costs (7) |
37,587 | — | 367 | |||||||||
| Tax impact of adjustments (8) |
(33,343 | ) | (19,950 | ) | (10,990 | ) | ||||||
| Tax Act remeasurement (9) |
— | — | (22,507 | ) | ||||||||
|
|
|
|
|
|
|
|||||||
| Adjusted Net Income |
$ | 72,632 | $ | 46,663 | $ | 44,645 | ||||||
|
|
|
|
|
|
|
|||||||
| Years Ended September 30, | ||||||||||||
| 2020 | 2019 | 2018 | ||||||||||
| Net income (loss) per common share — diluted |
$ | (1.00 | ) | $ | (0.19 | ) | $ | 0.06 | ||||
| Amortization |
0.45 | 0.56 | 0.47 | |||||||||
| Stock-based compensation costs |
0.99 | 0.04 | 0.03 | |||||||||
| Asset impairment costs |
— | — | 0.01 | |||||||||
| Business transformation costs |
— | 0.15 | 0.05 | |||||||||
| Acquisition costs |
0.01 | 0.04 | 0.07 | |||||||||
| Initial public offering and Secondary offering costs |
0.07 | 0.08 | 0.01 | |||||||||
| Other costs |
0.03 | (0.06 | ) | 0.02 | ||||||||
| Capital structure transaction costs |
0.31 | — | — | |||||||||
| Tax impact of adjustments |
(0.27 | ) | (0.19 | ) | (0.10 | ) | ||||||
| Tax Act remeasurement |
— | — | (0.21 | ) | ||||||||
|
|
|
|
|
|
|
|||||||
| Adjusted Diluted EPS (10) |
$ | 0.59 | $ | 0.43 | $ | 0.41 | ||||||
|
|
|
|
|
|
|
|||||||
| (1) | Effective as of September 30, 2020, we revised the definition of Adjusted Net Income to remove depreciation expense. The prior periods have been recast to reflect the change. |
| (2) | Asset impairment costs reflect tangible and intangible asset impairment costs of $0.9 million for fiscal year 2018. |
| (3) | Business transformation costs reflect consulting and other costs related to repositioning of our brands of $0.0 million, $4.3 million and $0.0 million for fiscal years 2020, 2019 and 2018, respectively, compensation costs related to the transformation of the senior management team of $0.6 million, $2.3 million and $0.2 million for fiscal years 2020, 2019 and 2018, respectively, costs related to the relocation of our corporate headquarters of $2.0 million for fiscal year 2019, start-up costs of our new recycling facility of $5.3 million for fiscal year 2019, and other integration-related costs of $2.7 million and $5.6 million for fiscal years 2019 and 2018, respectively. |
| (4) | Acquisition costs reflect costs directly related to completed acquisitions of $0.9 million, $4.1 million and $4.9 million for fiscal years 2020, 2019 and 2018, respectively and inventory step-up adjustments related to recording the inventory of acquired businesses at fair value on the date of acquisition of $0.7 million, $0.0 million and $2.4 million for fiscal years 2020, 2019 and 2018, respectively. |
| (5) | Initial public offering costs includes $1.4 million in fees related to the Secondary offering of our Class A common stock in fiscal year 2020. |
| (6) | Other costs reflect costs for legal expenses of $0.9 million, $0.9 million and $1.5 million for fiscal years 2020, 2019 and 2018, respectively, reduction in workforce costs of $0.4 million for fiscal year 2020, other miscellaneous adjustments of $0.2 million for fiscal year 2018, income from an insurance recovery of legal loss of $7.7 million for fiscal year 2019, and costs related to an incentive plan associated with the initial public offering of $2.9 million for fiscal year 2020. |
59
Table of Contents
| (7) | Capital structure transaction costs include loss on extinguishment of debt of $1.9 million for the 2021 Senior Notes and $35.7 million for the 2025 Senior Notes for fiscal year 2020, and debt related issuance costs of $0.4 million for fiscal year 2018. |
| (8) | Tax impact of adjustments is based on applying a combined U.S. federal and state statutory tax rate of 24.5%, 24.0% and 24.0% for fiscal years 2020, 2019 and 2018, respectively. |
| (9) | Tax Act remeasurement is a one-time tax benefit of $22.5 million as a result of the remeasurement of certain deferred taxes due to the enactment of the Tax Act. |
| (10) | Weighted average common shares outstanding used in computing diluted net income (loss) per common share is 122,128,515 shares for fiscal year 2020, and 108,162,741 shares for fiscal years 2019 and 2018. |
Adjusted EBITDA and Adjusted EBITDA Margin Reconciliation
| Years Ended September 30, | ||||||||||||
| (In thousands) | 2020 | 2019 | 2018 | |||||||||
| Net income (loss) |
$ | (122,233 | ) | $ | (20,196 | ) | $ | 6,745 | ||||
| Interest expense |
71,179 | 83,205 | 68,742 | |||||||||
| Depreciation and amortization |
99,781 | 93,929 | 77,665 | |||||||||
| Tax expense (benefit) |
(8,278 | ) | (3,955 | ) | (23,112 | ) | ||||||
| Stock-based compensation costs |
120,517 | 3,682 | 3,099 | |||||||||
| Asset impairment costs (1) |
— | — | 920 | |||||||||
| Business transformation costs (2) |
594 | 16,560 | 5,822 | |||||||||
| Acquisition costs (3) |
1,596 | 4,110 | 7,361 | |||||||||
| Initial public offering and Secondary offering costs (4) |
8,616 | 9,076 | 789 | |||||||||
| Other costs (5) |
4,154 | (6,845 | ) | 1,667 | ||||||||
| Capital structure transaction costs (6) |
37,587 | — | 367 | |||||||||
|
|
|
|
|
|
|
|||||||
| Total adjustments |
335,746 | 199,762 | 143,320 | |||||||||
|
|
|
|
|
|
|
|||||||
| Adjusted EBITDA |
$ | 213,513 | $ | 179,566 | $ | 150,065 | ||||||
|
|
|
|
|
|
|
|||||||
| Years Ended September 30, | ||||||||||||
| 2020 | 2019 | 2018 | ||||||||||
| Net margin |
(13.6 | )% | (2.5 | )% | 1.0 | % | ||||||
| Interest expense |
7.9 | 10.5 | 10.1 | |||||||||
| Depreciation and amortization |
11.1 | 11.8 | 11.4 | |||||||||
| Tax expense (benefit) |
(0.9 | ) | (0.5 | ) | (3.4 | ) | ||||||
| Stock-based compensation costs |
13.4 | 0.5 | 0.4 | |||||||||
| Asset impairment costs |
— | — | 0.1 | |||||||||
| Business transformation costs |
0.1 | 2.1 | 0.9 | |||||||||
| Acquisition costs |
0.2 | 0.5 | 1.1 | |||||||||
| Initial public offering and Secondary offering costs |
0.9 | 1.1 | 0.1 | |||||||||
| Other costs |
0.4 | (0.9 | ) | 0.2 | ||||||||
| Capital structure transaction costs |
4.2 | — | 0.1 | |||||||||
|
|
|
|
|
|
|
|||||||
| Total adjustments |
37.3 | % | 25.1 | % | 21.0 | % | ||||||
|
|
|
|
|
|
|
|||||||
| Adjusted EBITDA Margin |
23.7 | % | 22.6 | % | 22.0 | % | ||||||
|
|
|
|
|
|
|
|||||||
| (1) | Asset impairment costs reflect tangible and intangible asset impairment costs of $0.9 million for fiscal year 2018. |
| (2) | Business transformation costs reflect consulting and other costs related to repositioning of our brands of $0.0 million, $4.3 million and $0.0 million for fiscal years 2020, 2019 and 2018, respectively, compensation costs related to the transformation of the senior management team of $0.6 million, $2.3 million and $0.2 million for fiscal years 2020, 2019 and 2018, respectively, costs related to the relocation of our corporate headquarters of $2.0 million for fiscal year 2019, start-up costs of our new recycling facility of $5.3 million for fiscal year 2019, and other integration-related costs of $2.7 million and $5.6 million for the fiscal years 2019 and 2018, respectively. |
60
Table of Contents
| (3) | Acquisition costs reflect costs directly related to completed acquisitions of $0.9 million, $4.1 million and $4.9 million for fiscal years 2020, 2019 and 2018, respectively and inventory step-up adjustments related to recording the inventory of acquired businesses at fair value on the date of acquisition of $0.7 million, $0.0 million and $2.4 million for fiscal years 2020, 2019 and 2018, respectively. |
| (4) | Initial public offering costs includes $1.4 million in fees related to the Secondary offering of our Class A common stock completed in fiscal year 2020. |
| (5) | Other costs reflect costs for legal expenses of $0.9 million, $0.9 million and $1.5 million for fiscal years 2020, 2019 and 2018, respectively, reduction in workforce costs of $0.4 million for fiscal year 2020, other miscellaneous adjustments of $0.2 million for fiscal year 2018, income from an insurance recovery of legal loss of $7.7 million for fiscal year 2019, and costs related to an incentive plan associated with the initial public offering of $2.9 million for fiscal year 2020. |
| (6) | Capital structure transaction costs include loss on extinguishment of debt of $1.9 million for the 2021 Senior Notes and $35.7 million for the 2025 Senior Notes for fiscal year 2020, and debt related issuance costs of $0.4 million for fiscal year 2018. |
Net Leverage Reconciliation
| Year Ended September 30, |
||||
| (In thousands) | 2020 | |||
| Net income (loss) |
$ | (122,233 | ) | |
| Interest expense |
71,179 | |||
| Depreciation and amortization |
99,781 | |||
| Tax expense (benefit) |
(8,278 | ) | ||
| Stock-based compensation costs |
120,517 | |||
| Asset impairment costs |
— | |||
| Business transformation costs |
594 | |||
| Acquisition costs |
1,596 | |||
| Initial public offering and Secondary offering costs |
8,616 | |||
| Other costs |
4,154 | |||
| Capital structure transaction costs |
37,587 | |||
|
|
|
|||
| Total adjustments |
335,746 | |||
|
|
|
|||
| Adjusted EBITDA |
$ | 213,513 | ||
|
|
|
|||
| Long-term debt — less current portion |
$ | 462,982 | ||
| Unamortized deferred financing fees |
4,165 | |||
| Unamortized original issue discount |
507 | |||
|
|
|
|||
| Gross debt |
$ | 467,654 | ||
| Cash and cash equivalents |
(215,012 | ) | ||
|
|
|
|||
| Net debt |
$ | 252,642 | ||
| Net Leverage |
1.2x | |||
Item 7. Management’s Discussion and Analysis of Financial Condition and Results of Operations.
The following discussion and analysis of our financial condition and results of operations should be read in conjunction with other sections of this Annual Report, including “Item 1. Business,” “Item 6. Selected Financial Data” and our audited Consolidated Financial Statements and related Notes for the three years ended September 30, 2020, 2019 and 2018, included elsewhere in this Annual Report.
61
Table of Contents
Forward-Looking Statements
This Annual Report contains forward-looking statements. All statements other than statements of historical facts contained in this Annual Report, including statements regarding future operations are forward-looking statements. In some cases, forward looking statements may be identified by words such as “believe,” “may,” “will,” “estimate,” “continue,” “anticipate,” “intend,” “could,” “would,” “expect,” “objective,” “plan,” “potential,” “seek,” “grow,” “target,” “if,” or the negative of these terms and similar expressions intended to identify forward-looking statements. In particular, statements about potential new products and product innovation, statements regarding the potential impact of the COVID-19 pandemic, statements about the markets in which we operate, including growth of our various markets and growth in the use of engineered products, and our expectations, beliefs, plans, strategies, objectives, prospects, assumptions or future events or performance contained in the Annual Report are forward-looking statements. We have based these forward-looking statements primarily on our current expectations and projections about future events and trends that we believe may affect our financial condition, results of operations, business strategy, short-term and long-term business operations and objectives and financial needs. These forward-looking statements are subject to a number of risks, uncertainties and assumptions, including those described in the section titled “Risk Factors” set forth in Part I, Item 1A of this Annual Report and in our other SEC filings. Moreover, we operate in a very competitive and rapidly changing environment. New risks emerge from time to time. It is not possible for our management to predict all risks, nor can we assess the impact of all factors on our business or the extent to which any factor, or combination of factors, may cause actual results to differ materially from those contained in any forward-looking statements we may make. In light of these risks, uncertainties and assumptions, the future events and trends discussed in this Annual Report may not occur and actual results may differ materially and adversely from those anticipated or implied in the forward-looking statements. You should read this Annual Report with the understanding that our actual future results, levels of activity, performance and events and circumstances may be materially different from what we expect. In addition, statements that “we believe” and similar statements reflect our beliefs and opinions on the relevant subject. These statements are based on information available to us as of the date of this Annual Report. While we believe that such information provides a reasonable basis for these statements, such information may be limited or incomplete. Our statements should not be read to indicate that we have conducted an exhaustive inquiry into, or review of, all relevant information. These statements are inherently uncertain, and investors are cautioned not to unduly rely on these statements.
Overview
We are an industry-leading designer and manufacturer of beautiful, low-maintenance and environmentally sustainable products focused on the highly attractive, fast-growing Outdoor Living market. Homeowners are continuing to invest in their outdoor spaces and are increasingly recognizing the significant advantages of long-lasting products, which are converting demand away from traditional materials, particularly wood. Our products transform those outdoor spaces by combining highly appealing aesthetics with significantly lower maintenance costs compared to traditional materials. Our innovative portfolio of Outdoor Living products, including decking, railing, trim and accessories, inspires consumers to design outdoor spaces tailored to their unique lifestyle needs. We are well known in the industry, and, according to data provided by Principia, we generally hold one of the top two market share positions by revenue in our product categories. In addition to our leading suite of Outdoor Living products, we sell a broad range of highly engineered products that are sold in commercial markets, including partitions, lockers and storage solutions. One of our core values is to “always do the right thing”. We make decisions according to what is right, not what is the cheapest, fastest or easiest, and we strive to always operate with integrity, transparency and the customer in mind. In furtherance of that value, we are focused on sustainability across our operations and have adopted strategies to enable us to meet the growing demand for environmentally-friendly products. Our businesses leverage a shared technology and U.S.-based manufacturing platform to create products that convert demand from traditional materials to those that are long lasting and low-maintenance, fulfilling our brand commitment to deliver products that are “Beautifully Engineered to Last”.
62
Table of Contents
We report our results in two segments: Residential and Commercial. In our Residential segment, our primary consumer brands, TimberTech and AZEK, are recognized by contractors and consumers for their premium aesthetics, uncompromising quality and performance, and diversity of style and design options. In our Commercial segment, we manufacture engineered sheet products and high-quality bathroom partitions and lockers. Over our history we have developed a reputation as a leading innovator in our markets by leveraging our differentiated manufacturing capabilities, material science expertise and product management proficiency to consistently introduce new products into the market. This long-standing commitment has been critical to our ability to stay at the forefront of evolving industry trends and consumer demands, which in turn has allowed us to become a market leader across our core product categories.
Basis of Presentation
Our Consolidated Financial Statements in this Annual Report have been derived from our accounts and those of our wholly-owned subsidiaries. Our Consolidated Financial Statements are based on a fiscal year ending September 30.
In January 2020, we acquired Return Polymers, Inc. The assets acquired and liabilities assumed in connection with this acquisition were included in our consolidated balance sheet as of September 30, 2020 and in our consolidated statement of comprehensive income (loss) and statement of cash flow beginning from the effective date of the acquisition in January 2020. The results of operations of Return Polymers are included in our Residential segment.
Initial Public Offering
On June 16, 2020, we completed our IPO of our Class A common stock, in which it sold 38,237,500 shares, including 4,987,500 shares pursuant to the underwriters’ over-allotment option. The shares began trading on the New York Stock Exchange on June 12, 2020 under the symbol “AZEK”. The shares were sold at an IPO price of $23.00 per share for net proceeds to us of approximately $819.7 million, after deducting underwriting discounts and commissions of $50.6 million and offering expenses of approximately $9.2 million payable by us. In addition, we used the net proceeds to redeem $350.0 million in aggregate principal of our then-outstanding 2025 Senior Notes, $70.0 million of our then-outstanding principal amount under the Revolving Credit Facility and effected a $337.7 million prepayment of our then-outstanding principal amount under the Term Loan Agreement.
Secondary Offering
On September 15, 2020, we completed an offering of 28,750,000 shares of Class A common stock, including the exercise in full by the underwriters of their option to purchase up to 3,750,000 additional shares of Class A common stock, at a public offering price of $33.25 per share. All of the shares were sold by certain of our stockholders, or the Selling Stockholders. We did not receive any of the proceeds from the sale of the shares by the Selling Stockholders. The estimated offering expenses of approximately $1.4 million is payable by us and recorded in “Other general expenses” within the Consolidated Statements of Comprehensive Income (Loss). Immediately subsequent to the closing of the secondary offering, our sole stockholder of our Class B common stock converted 33,068,863 shares of its Class B common stock into shares of Class A common stock.
Key Factors Affecting Our Results of Operations
Our results of operations and financial condition are affected by the following factors, which reflect our operating philosophy and continued focus on driving material conversion to our low-maintenance, engineered products in each of our markets.
63
Table of Contents
Volume of Products Sold
Our net sales depend primarily on the volume of products we sell during any given period, and volume is affected by the following items:
| • | Economic conditions: Demand for our products is significantly affected by a number of economic factors impacting our customers and consumers. For example, demand for products sold by our Residential segment is driven primarily by home repair and remodeling activity and, to a lesser extent, new home construction activity. The residential repair and remodeling market depends in part on home equity financing, and accordingly, the level of equity in homes will affect consumers’ ability to obtain a home equity line of credit and engage in renovations that would result in purchases of our products. Demand for our products is also affected by the level of interest rates and the availability of credit, consumer confidence and spending, housing affordability, demographic trends, employment levels and other macroeconomic factors that may influence the extent to which consumers engage in repair and remodeling projects to enhance the outdoor living spaces of their homes. Sales by our Commercial segment in the institutional construction market are affected by amounts available for expenditures in school construction, military bases and other public institutions, which depend in part on the availability of government funding and budgetary priorities. Sales of our engineered polymer materials in our industrial OEM markets are also affected by macroeconomic factors, in particular gross domestic product levels and levels of industrial production. Changes in these economic conditions can impact the volume of our products sold during any given period. |
| • | Material conversion: We have continued to increase sales of our products through our focused efforts to drive material conversion and market penetration of our products. We believe that there is a long-term trend toward material conversion from traditional materials, such as wood, to the low-maintenance, engineered materials we produce. We believe that our products offer a compelling value proposition due to their enhanced durability and lower maintenance costs compared to products manufactured from traditional materials, and we anticipate that sales of our products will continue to benefit from material conversion. The success of our efforts to drive conversion during any given period will impact the volume of our products sold during that period. |
| • | Product innovation: We continue to develop and introduce innovative products to accelerate material conversion and expand our markets. We believe that new products will enhance our ability to compete with traditional materials at a variety of price points, and we expect to continue to devote significant resources to developing innovative new products. The volume of our products sold during a given period will depend in part on our successfully introducing new products that generate additional demand as well as the extent to which new products may impact our sales of existing products. |
| • | Marketing and distribution: Demand for our products is influenced by our efforts to expand and enhance awareness of our premium brands and the benefits of our products as well as to drive continued material conversion. Within our Residential segment, we sell our products through a national network of more than 4,200 dealers, more than 35 distributors and multiple home improvement retailers providing extensive geographic coverage enabling us to effectively serve contractors across the United States and Canada. Within our Commercial segment, we sell our products through a widespread distribution network as well as directly to OEMs. Our customer-focused sales organization generates pull-through demand for our products by driving increased downstream engagement with consumers and key influencers such as architects, builders and contractors and by focusing on strengthening our position with dealers and growing our presence in retail. Our volume of product sales in a given period will be impacted by our ability to raise awareness of our brands and products. |
64
Table of Contents
Pricing
In general, our pricing strategy is to price our products at a premium relative to competing materials based on the value proposition they provide, including lower maintenance and lifetime costs. Our pricing strategy differs as between our two operating segments as follows:
| • | Residential: Prices for our residential products are typically set annually, taking into account anticipated changes in input costs, market dynamics and new product introductions by us or our competitors. |
| • | Commercial: A number of our commercial product sales, such as those related to our partitions and lockers product lines, are customized by order, and, therefore, these products are typically priced based on the nature of the particular specifications ordered. For other commercial products, such as various Vycom product lines, we maintain standard pricing lists that we review and change periodically. |
Cost of Materials
Raw material costs, including costs of petrochemical resins, reclaimed polyethylene and PVC material, waste wood fiber and aluminum, represent a majority of our cost of sales. The cost of petrochemical resins used in our manufacturing processes has historically varied significantly and has been affected by changes in supply and demand and in the price of crude oil. In addition, the price of reclaimed polyethylene material, waste wood fiber, aluminum, other additives (including modifiers, TiO2 and pigments) and other raw materials fluctuates depending on, among other things, overall market supply and demand and general business conditions. We seek to mitigate the effects of increases in raw material costs by broadening our supplier base, increasing our use of recycled material and scrap, reducing waste and exploring options for material substitution without sacrificing quality. We have long-standing relationships as well as guaranteed supply contracts with some of our key suppliers but, other than certain contracts with prices determined based on the current index price, we have no fixed-price contracts with any of our major vendors. Under our guaranteed supply contracts, the prices are either established annually based on a discount to the then-current market prices or, for purchase orders, based on market rates in effect when the orders become effective. Prices for spot market purchases are negotiated on a continuous basis in line with the market at the time. We have not entered into hedges with respect to our raw material costs at this time, but we may choose to enter into such hedges in the future. For additional information, see “—Quantitative and Qualitative Disclosures about Market Risk—Raw Materials; Commodity Price Risk.”
Product Mix
We offer a wide variety of products across numerous product lines within our Residential and Commercial segments, and these products are sold at different prices, are composed of different materials and involve varying levels of manufacturing complexity. In any particular period, changes in the volume of particular products sold and the prices of those products relative to other products will impact our average selling price and our cost of sales. For example, the gross margins of our Residential segment significantly exceed the gross margins of our Commercial segment. In addition to the impacts attributable to product mix as between the Residential and Commercial segments, our results of operations are impacted by the relative margins associated with individual products within our Residential and Commercial segments, which vary among products. As we continue to introduce new products at varying price points to compete with products made with wood or other traditional materials across a wide range of prices, our overall gross margins may vary from period to period as a result of changes in product mix and different margins for our higher and lower price point offerings. We may choose to introduce new products with initially lower gross margins with the expectation that those margins will improve over time as we improve our manufacturing efficiency for those products. In addition, our product mix and our gross margins may be impacted by our marketing decisions in a particular period as well as the rebates and incentives that we may extend to our customers in a particular period. We also continue to seek to enhance our gross margins by improving manufacturing efficiency across our operations, including by investing in, and expanding, our recycling capabilities and implementing initiatives to more efficiently use scrap and to reduce
65
Table of Contents
waste. Our success in achieving margin improvements through these initiatives may vary due to changes in product mix as different products benefit to different degrees from these initiatives.
Seasonality
Although we generally have demand for our products throughout the year, our sales have historically experienced some seasonality. We have typically experienced moderately higher levels of sales of our residential products in the second fiscal quarter of the year as a result of our “early buy” sales and extended payment terms typically available during the second fiscal quarter of the year. As a result of these extended payment terms, our accounts receivable have typically reached seasonal peaks at the end of the second fiscal quarter of the year, and our net cash provided by operating activities has typically been lower in the second fiscal quarter relative to in other quarters. Our sales are also generally impacted by the number of days in a quarter or a year that contractors and other professionals are able to install our products. This can vary dramatically based on, among other things, weather events such as rain, snow and extreme temperatures. We have generally experienced lower levels of sales of our residential products in the first fiscal quarter due to adverse weather conditions in certain markets, which typically reduce the construction and renovation activity during the winter season. In addition, we have experienced higher levels of sales of our bathroom partition products and our locker products during the second half of our fiscal year, which includes the summer months when schools are typically closed and therefore are more likely to undergo remodel activities.
COVID-19
Since the onset of the COVID-19 pandemic, we have been focused on protecting our employees’ health and safety, meeting our customers’ needs as they navigate an uncertain financial and operating environment, working closely with our suppliers to protect our ongoing business operations and rapidly adjusting our short-, medium- and long-term operational plans to proactively and effectively respond to the current and potential future public health crises. While the COVID-19 pandemic presents very serious concerns for our business and operations, our employees and their families, our customers and our suppliers, we believe that we are adapting well to the wide ranging changes that the global economy is currently undergoing, and we remain confident that we will continue to maintain business continuity, produce and sell our products safely and in compliance with applicable laws and governmental orders and mandates, maintain our robust and flexible supply chains and be in a strong position to maintain financial flexibility even in the event of a potentially extended economic downturn. This discussion and analysis includes periods prior to the outbreak of the COVID-19 pandemic.
Although we have implemented measures to mitigate the impact of the COVID-19 pandemic on our business, financial condition and results of operations, we expect that these measures may not fully mitigate the impact of the COVID-19 pandemic on our business, financial condition and results of operations. We cannot predict the degree to, or the period over, which we will be affected by the pandemic and resulting governmental and other measures. We expect that the economic effects of the COVID-19 pandemic will likely continue to affect demand for our products in the foreseeable future. The global impact of the COVID-19 pandemic continues to rapidly evolve, and we will continue to monitor the situation closely. As the COVID-19 pandemic continues, it may also have the effect of heightening many of the risks described in “Risk Factors” in this Annual Report. See “Risk Factors” for a further discussion of the adverse impacts of the COVID-19 pandemic on our business.
Acquisitions
Throughout our history, we have made selected acquisitions, and we expect to continue to strategically pursue acquisitions to enhance our market position, supplement our product and technology portfolios and increase the diversity of our business.
66
Table of Contents
Acquisition of Return Polymers
In January 2020, we acquired Return Polymers, Inc. for a total purchase price of $18.5 million. Return Polymers is located in Ashland Ohio and is a provider of full-service recycled PVC material processing, sourcing, logistical support, and scrap management programs. We financed the acquisition with cash on hand. The acquisition was accounted for as a business combination.
Results of Operations
The following tables summarize certain financial information relating to our operating results that have been derived from our audited Consolidated Financial Statements for the years ended September 30, 2020, 2019 and 2018.
| Years Ended September 30, | 2020 – 2019 Variance | 2019 – 2018 Variance | ||||||||||||||||||||||||||
| (U.S. dollars in thousands) | 2020 | 2019 | 2018 | $ Variance | % Variance | $ Variance | % Variance | |||||||||||||||||||||
| Net sales |
$ | 899,259 | $ | 794,203 | $ | 681,805 | $ | 105,056 | 13.2 | % | $ | 112,398 | 16.5 | % | ||||||||||||||
| Cost of sales |
603,209 | 541,006 | 479,769 | 62,203 | 11.5 | 61,237 | 12.8 | |||||||||||||||||||||
|
|
|
|
|
|
|
|
|
|
|
|
|
|
|
|||||||||||||||
| Gross profit |
296,050 | 253,197 | 202,036 | 42,853 | 16.9 | 51,161 | 25.3 | |||||||||||||||||||||
| Selling, general and administrative expenses |
308,275 | 183,572 | 144,688 | 124,703 | 67.9 | 38,884 | 26.9 | |||||||||||||||||||||
| Other general expenses |
8,616 | 9,076 | 4,182 | (460 | ) | (5.1 | ) | 4,894 | N/M (1 | ) | ||||||||||||||||||
| Loss on disposal of property, plant and equipment |
904 | 1,495 | 791 | (591 | ) | (39.5 | ) | 704 | 89.0 | |||||||||||||||||||
|
|
|
|
|
|
|
|
|
|
|
|
|
|
|
|||||||||||||||
| Operating income (loss) |
(21,745 | ) | 59,054 | 52,375 | (80,799 | ) | (136.8 | ) | 6,679 | 12.8 | ||||||||||||||||||
| Interest expense, net |
71,179 | 83,205 | 68,742 | (12,026 | ) | (14.5 | ) | 14,463 | 21.0 | |||||||||||||||||||
| Loss on extinguishment of debt |
37,587 | — | — | 37,587 | N/M (1 | ) | — | — | ||||||||||||||||||||
| Income tax expense (benefit) |
(8,278 | ) | (3,955 | ) | (23,112 | ) | (4,323 | ) | 109.3 | (19,157 | ) | (82.9 | ) | |||||||||||||||
|
|
|
|
|
|
|
|
|
|
|
|
|
|
|
|||||||||||||||
| Net income (loss) |
$ | (122,233 | ) | $ | (20,196 | ) | $ | 6,745 | $ | (102,037 | ) | N/M (1 | )% | $ | (26,941 | ) | N/M (1 | )% | ||||||||||
|
|
|
|
|
|
|
|
|
|
|
|
|
|
|
|||||||||||||||
| (1) | “N/M” indicates the variance as a percentage is not meaningful. |
Year Ended September 30, 2020, Compared with Year Ended September 30, 2019
Net Sales
Net sales for the year ended September 30, 2020 increased by $105.1 million, or 13.2%, to $899.3 million from $794.2 million for the year ended September 30, 2019. The increase was primarily attributable to higher sales in our Residential segment. Net sales for the year ended September 30, 2020 increased for our Residential segment by 17.7% and decreased for our Commercial segment by 7.7%, in each case as compared to the prior year.
Cost of Sales
Cost of sales for the year ended September 30, 2020 increased by $62.2 million, or 11.5%, to $603.2 million from $541.0 million for the year ended September 30, 2019 primarily due to increased costs on higher sales volumes and the impact of COVID-19 related production costs partially offset by manufacturing productivity.
67
Table of Contents
Gross Profit
Gross profit for the year ended September 30, 2020 increased by $42.9 million, or 16.9%, to $296.1 million from $253.2 million for the year ended September 30, 2019. Gross margin increased to 32.9% for the year ended September 30, 2020 compared to 31.9% for the year ended September 30, 2019. The increase in gross profit was driven by higher Residential segment sales and manufacturing productivity, partially offset by the impact of COVID-19 related production costs.
Selling, General and Administrative Expenses
Selling, general and administrative expenses increased by $124.7 million, or 67.9%, to $308.3 million, or 34.3% of net sales, for the year ended September 30, 2020 from $183.6 million, or 23.1% of net sales, for the year ended September 30, 2019. The increase was primarily attributable to $120.5 million of stock-based compensation expense related to our initial public offering and the accelerated vesting of stock-based compensation expense resulting from the secondary offering, partially offset by lower marketing and selling expenses during the initial COVID-19 disruption.
Other General Expenses
Other general expenses which were $8.6 million during the year ended September 30, 2020 and $9.1 million during the year ended September 30, 2019, resulted from the completion of our initial public offering and secondary offering.
Interest Expense, net
Interest expense, net, decreased by $12.0 million, or 14.5%, to $71.2 million for the year ended September 30, 2020 from $83.2 million for the year ended September 30, 2019. Interest expense decreased primarily due to the reduced principal amount outstanding under our Term Loan Agreement, the redemption of our 2021 Senior Notes and lower average interest rates during the year ended September 30, 2020, when compared to the year ended September 30, 2019.
Loss on Extinguishment of Debt
Loss on extinguishment of debt was $37.6 million for the year ended September 30, 2020 as a result of the extinguishment of the 2025 Senior Notes and the 2021 Senior Notes.
Income Tax Expense (Benefit)
Income tax benefit increased by $4.3 million to $8.3 million for the year ended September 30, 2020 compared to $4.0 million for the year ended September 30, 2019. The increase in our income tax benefit was primarily driven by our pre-tax net loss, offset by the non-deductible stock-based compensation expense we recognized, as a result of our initial public offering and secondary offering.
Net Income (Loss)
Net loss increased by $102.0 million to a net loss of $122.2 million for the year ended September 30, 2020 compared to net loss of $20.2 million for the year ended September 30, 2019, primarily due to $120.5 million of increased selling, general and administrative expenses due to the recognition of additional stock-based compensation expense as a result of our initial public offering and secondary offering, as well as $37.6 million of expenses related to the extinguishment of debt.
68
Table of Contents
Year Ended September 30, 2019, Compared with Year Ended September 30, 2018
Net Sales
Net sales for the year ended September 30, 2019 increased by $112.4 million, or 16.5%, to $794.2 million from $681.8 million for the year ended September 30, 2018. The increase was primarily attributable to an increase in organic sales volume and $50.8 million from the Versatex and Ultralox acquisitions. Net sales for the year ended September 30, 2019 increased for our Residential segment by 20.9% and decreased for our Commercial segment by 0.8%, as compared to the prior year. Organic net sales, which excludes sales that are attributable to acquisitions, increased 8.3% for the year ended September 30, 2019 as compared to the year ended September 30, 2018.
Cost of Sales
Cost of sales for the year ended September 30, 2019 increased by $61.2 million, or 12.8%, to $541.0 million from $479.8 million for the year ended September 30, 2018, primarily due to $43.4 million of costs related to higher organic sales volumes, $35.7 million of costs related to higher acquisition sales volumes and $5.3 million of startup costs of our recycling facility. These increases were partially offset by net manufacturing productivity of $11.4 million in fiscal year 2019 and no revaluation of off-specification finished goods in fiscal year 2019, as compared to an $11.8 million revaluation in fiscal year 2018, of which $2.0 million related to our Residential segment and $9.8 million related to our Commercial segment.
Gross Profit
Gross profit for the year ended September 30, 2019 increased by $51.2 million, or 25.3%, to $253.2 million from $202.0 million for the year ended September 30, 2018. Gross margin increased to 31.9% for the year ended September 30, 2019 compared to 29.6% for the year ended September 30, 2018. The increase in gross margin was primarily driven by net manufacturing productivity improvements, as well as by the absence in fiscal year 2019 of revaluation of off-specification finished goods. The increase was partially offset by the startup costs of our recycling facility.
Selling, General and Administrative Expenses
Selling, general and administrative expenses increased by $38.9 million, or 26.9%, to $183.6 million, or 23.1% of net sales, for the year ended September 30, 2019 from $144.7 million, or 21.2% of net sales, for the year ended September 30, 2018. The increase was primarily attributable to $18.2 million resulting from our acquisitions of Versatex and Ultralox, $9.3 million in increased marketing spending related to our rebranding initiative, $9.2 million primarily related to increased headcount in our sales organization and professional fees of $3.4 million as we continue to invest in selling, marketing and R&D, partially offset by a $7.7 million insurance recovery received related to a previous litigation settlement.
Other General Expenses
Other general expenses increased by $4.9 million to $9.1 million during fiscal year 2019 from $4.2 million during fiscal year 2018. Fiscal year 2019 expenses related to costs associated with our initial public offering, while fiscal year 2018 expenses related to transaction costs in connection with the aforementioned fiscal year 2018 acquisitions.
Loss on Disposal of Property, Plant and Equipment
Loss on disposal of property, plant and equipment increased by $0.7 million to $1.5 million for the year ended September 30, 2019 from $0.8 million during the year ended September 30, 2018 due to disposal of fixed assets in the normal course of business.
69
Table of Contents
Interest Expense, net
Interest expense, net, increased by $14.5 million, or 21.0%, to $83.2 million for the year ended September 30, 2019 from $68.7 million for the year ended September 30, 2018. Interest expense increased primarily due to an increase of $225.0 million in borrowing under the Term Loan Agreement relating to the acquisition of Versatex in fiscal year 2018, as well as, higher rates on amounts borrowed under the Term Loan Agreement.
Income Tax Benefit
Income tax benefit decreased by $19.1 million to $4.0 million for the year ended September 30, 2019 compared to $23.1 million for the year ended September 30, 2018. The decrease was primarily driven by the impact of remeasuring our deferred tax assets and liabilities as a result of the Tax Act in 2018, which lowered our statutory federal tax rate to 21% in the year ended September 30, 2018 from 35% in the year ended September 30, 2017. As a result of remeasuring our deferred tax assets and liabilities, we recorded a net benefit of approximately $22.5 million in fiscal year 2018.
Net Income (Loss)
Net income decreased by $26.9 million to a net loss of $20.2 million for the year ended September 30, 2019 compared to net income of $6.7 million for the year ended September 30, 2018, primarily due to increased interest expense from the increase in our borrowing under the Senior Secured Credit Facilities and other general operating expenses as a result of our initial public offering.
Segment Results of Operations
We report our results in two segments: Residential and Commercial. The key segment measures used by our chief operating decision maker in deciding how to evaluate performance and allocate resources to each of the segments are Segment Adjusted EBITDA and Segment Adjusted EBITDA Margin. Depending on certain circumstances, Segment Adjusted EBITDA and Segment Adjusted EBITDA Margin may be calculated differently, from time to time, than our Adjusted EBITDA and Adjusted EBITDA Margin, which are further discussed under the heading “Selected Consolidated Financial Data—Non-GAAP Financial Measures.” Segment Adjusted EBITDA and Segment Adjusted EBITDA Margin represent measures of segment profit reported to our chief operating decision maker for the purpose of making decisions about allocating resources to a segment and assessing its performance and are determined as disclosed in our Consolidated Financial Statements included elsewhere in this Annual Report consistent with the requirements of the Financial Accounting Standards Board’s, or FASB, Accounting Standards Codification, or ASC, 280. We define Segment Adjusted EBITDA as a segment’s net income (loss) before income tax (benefit) expense and by adding to or subtracting therefrom interest expense, net, depreciation and amortization, stock-based compensation costs, asset impairment and inventory revaluation costs, business transformation costs, capital structure transaction costs, acquisition costs, initial public offering costs and certain other costs. Segment Adjusted EBITDA Margin is equal to a segment’s Segment Adjusted EBITDA divided by such segment’s net sales. Corporate expenses, which include selling, general and administrative costs related to our corporate offices, including payroll and other professional fees, are not included in computing Segment Adjusted EBITDA. Such corporate expenses decreased by $2.7 million to $39.6 million for the year ended September 30, 2020 from $42.3 million for the year ended September 30, 2019, and increased by $1.9 million to $42.3 million during the year ended September 30, 2019, from $40.4 million during the year ended September 30, 2018.
70
Table of Contents
Residential
The following table summarizes certain financial information relating to the Residential segment results that have been derived from our audited Consolidated Financial Statements for the years ended September 30, 2020, 2019 and 2018.
| Years Ended September 30, | 2020 – 2019 Variance | 2019 – 2018 Variance | ||||||||||||||||||||||||||
| (U.S. dollars in thousands) | 2020 | 2019 | 2018 | $ Variance |
% Variance |
$ Variance |
% Variance |
|||||||||||||||||||||
| Net sales |
$ | 771,167 | $ | 655,445 | $ | 541,942 | $ | 115,722 | 17.7 | % | $ | 113,503 | 20.9 | % | ||||||||||||||
| Segment Adjusted EBITDA |
238,060 | 188,742 | 168,438 | 49,318 | 26.1 | 20,304 | 12.1 | |||||||||||||||||||||
| Segment Adjusted EBITDA Margin |
30.9 | % | 28.8 | % | 31.1 | % | N/A | N/A | N/A | N/A | ||||||||||||||||||
Net Sales
Net sales of the Residential segment for the year ended September 30, 2020 increased by $115.7 million, or 17.7%, to $771.1 million from $655.4 million for the year ended September 30, 2019. The increase was primarily attributable to higher sales in both our Deck, Rail and Accessories and Exteriors businesses driven by continued market growth, success of new products across the portfolio as well as the benefit from investments in downstream selling capabilities, retail expansion and pricing.
Net sales of the Residential segment for the year ended September 30, 2019 increased by $113.5 million, or 20.9%, to $655.4 million from $541.9 million for the year ended September 30, 2018. The increase was primarily attributable to an increase in organic sales volume and $50.8 million from acquisitions. Organic net sales increased 10.9% for the year ended September 30, 2019 as compared to the year ended September 30, 2018.
Segment Adjusted EBITDA
Segment Adjusted EBITDA of the Residential segment for the year ended September 30, 2020 increased by $49.3 million, or 26.1% to $238.0 million from $188.7 million for the year ended September 30, 2019. The increase was mainly driven by higher sales, net manufacturing productivity improvements, as well as lower selling, general and administrative expenses, partially offset by COVID-19 related production costs.
Segment Adjusted EBITDA of the Residential segment for the year ended September 30, 2019 increased by $20.3 million, or 12.1%, to $188.7 million from $168.4 million for the year ended September 30, 2018. The increase was mainly driven by higher net sales, acquisitions and net manufacturing productivity improvements, partially offset by investments in selling and marketing and research and development costs.
Commercial
The following table summarizes certain financial information relating to the Commercial segment results that have been derived from our audited Consolidated Financial Statements for the years ended September 30, 2020, 2019 and 2018.
| Years Ended September 30, | 2020 – 2019 Variance | 2019 – 2018 Variance | ||||||||||||||||||||||||||
| (U.S. dollars in thousands) | 2020 | 2019 | 2018 | $ Variance |
% Variance |
$ Variance |
% Variance |
|||||||||||||||||||||
| Net sales |
$ | 128,092 | $ | 138,758 | $ | 139,863 | $ | (10,666 | ) | (7.7 | )% | $ | (1,105 | ) | (0.8 | )% | ||||||||||||
| Segment Adjusted EBITDA |
15,051 | 21,493 | 21,669 | (6,442 | ) | (30.0 | ) | (176 | ) | (0.8 | ) | |||||||||||||||||
| Segment Adjusted EBITDA Margin |
11.8 | % | 15.5 | % | 15.5 | % | N/A | N/A | N/A | N/A | ||||||||||||||||||
71
Table of Contents
Net Sales
Net sales of the Commercial segment decreased by $10.7 million, or 7.7%, to $128.1 million for the year ended September 30, 2020 from $138.8 million for the year ended September 30, 2019. The decrease was primarily driven by lower sales in our Vycom business, as the effects of COVID-19 impacted certain end market demands.
Net sales of the Commercial segment for the year ended September 30, 2019 decreased by $1.1 million, or 0.8%, to $138.8 million from $139.9 million for the year ended September 30, 2018. The slight decrease was driven by weakness in certain end-user markets, partially offset by growth in partitions and locker sales.
Segment Adjusted EBITDA
Segment Adjusted EBITDA of the Commercial segment was $15.1 million for the year ended September 30, 2020, compared to $21.5 million for the year ended September 30, 2019. The decrease was primarily driven by lower sales in the Vycom business, partially offset by lower manufacturing costs and reductions in selling, general and administrative expenses.
Segment Adjusted EBITDA of the Commercial segment was $21.5 million for the year ended September 30, 2019 compared to $21.7 million for the year ended September 30, 2018. A slight decrease in net sales was largely offset by improved net manufacturing productivity.
Liquidity and Capital Resources
Liquidity Outlook
Our primary cash needs are to fund working capital, capital expenditures, debt service and any acquisitions we may undertake. As of September 30, 2020, we had cash and cash equivalents of $215.0 million and total indebtedness of $467.7 million. CPG International LLC, our direct, wholly owned subsidiary, had approximately $129.4 million available under the borrowing base of our Revolving Credit Facility for future borrowings as of September 30, 2020. CPG International LLC also has the option to increase the commitments under the Revolving Credit Facility by up to $100.0 million, subject to certain conditions. In the fourth quarter of 2020, we also announced an acceleration and expansion of our capacity investment from $100.0 million to $180.0 million and believe we have the adequate liquidity to meet the higher level of capacity investment.
During the three months ended March 31, 2020, we borrowed $129.0 million under the Revolving Credit Facility, including, on March 16, 2020, $89.0 million to enhance our financial flexibility in light of uncertainties resulting from the COVID-19 pandemic.
On May 12, 2020, CPG International LLC issued $350.0 million aggregate principal amount of 2025 Senior Notes. On June 8, 2020, we used the proceeds of the 2025 Senior Notes offering to redeem $315.0 million of outstanding 2021 Senior Notes, representing all of the outstanding 2021 Senior Notes, plus $4.6 million in accrued and unpaid interest to the redemption date, and, on May 14, 2020, to repay $15.0 million of the outstanding principal amount under the Revolving Credit Facility.
On June 5, 2020, we entered into the Revolving Credit Facility Amendment (“RCF Amendment”), which established $8.5 million of commitments for FILO Loans under the Revolving Credit Facility. The FILO Loans are available to be drawn in a single disbursement on or prior to December 31, 2020. The availability of the FILO Loans will be subject to satisfaction of certain conditions at the time of borrowing, including the value of borrowing-base eligible assets at the time of borrowing. Under the terms of the Revolving Credit Facility as amended by the RCF Amendment, FILO Loans may be borrowed against increased percentages of borrowing-
72
Table of Contents
base eligible assets (as compared to the percentages of borrowing-base eligible assets applicable to all other loans under the Revolving Credit Facility). The RCF Amendment did not increase the total aggregate amount of commitments under the Revolving Credit Facility. Borrowing of FILO Loans under the Revolving Credit Facility will reduce the total aggregate commitments available for revolving loans for so long as the FILO Loans remain outstanding. If borrowed, the FILO Loans will mature on December 4, 2021. As of September 30, 2020, we have not drawn on the FILO loans. There is no assurance that we will be able to draw on the FILO Loans at any time.
On June 16, 2020, we satisfied and discharged our obligations with respect to the $350.0 million in aggregate principal amount of outstanding 2025 Senior Notes with the net proceeds from the IPO at a redemption price of 107.125% of the outstanding principal amount, plus $3.9 million in accrued and unpaid interest to the redemption date. On June 18, 2020, we also used a portion of the net proceeds received by us from the IPO to repay $70.0 million of the then-outstanding principal amount under the Revolving Credit Facility and, on June 16, 2020, to prepay approximately $337.7 million of the outstanding principal amount under our Term Loan Agreement, plus $4.3 million in accrued and unpaid interest thereon.
Additionally, in July 2020, using net proceeds received from the IPO, we repaid $44.0 million of our outstanding principal amount under the Revolving Credit Facility.
We believe we will have adequate liquidity over the next 12 months to operate our business and to meet our cash requirements as a result of cash flows from operating activities, available cash balances and availability under our Revolving Credit Facility after consideration of our debt service and other cash requirements. In the longer term, our liquidity will depend on many factors, including our results of operations, our future growth, the timing and extent of our expenditures to develop new products and improve our manufacturing capabilities, the expansion of our sales and marketing activities and the extent to which we make acquisitions. Changes in our operating plans, material changes in anticipated sales, increased expenses, acquisitions or other events may cause us to seek additional equity and/or debt financing in future periods.
Holding Company Status
We are a holding company and do not conduct any business operations of our own. As a result, we are largely dependent upon cash dividends and distributions and other transfers from our subsidiaries to meet our obligations. The agreements governing the indebtedness of our subsidiaries impose restrictions on our subsidiaries’ ability to pay dividends or make other distributions to us.
CPG International LLC is party to the Senior Secured Credit Facilities. The obligations under the Senior Secured Credit Facilities are secured by specified assets. The obligations under the Senior Secured Credit Facilities are guaranteed by The AZEK Company Inc. and the wholly owned domestic subsidiaries of CPG International LLC other than certain immaterial subsidiaries and other excluded subsidiaries.
The Senior Secured Credit Facilities contain covenants restricting payments of dividends by CPG International LLC unless certain conditions, as provided in the Senior Secured Credit Facilities, are met. The covenants under our Senior Secured Credit Facilities provide for certain exceptions for specific types of payments. However, other than restricted payments under the specified exceptions, the covenants under our Term Loan Agreement generally prohibit the payment of dividends unless the fixed charge coverage ratio of CPG International LLC, on a pro forma basis, for the four quarters preceding the declaration or payment of such dividend would be at least 2.00 to 1.00 and such restricted payments do not exceed an amount based on the sum of $40.0 million plus 50% of consolidated net income for the period commencing October 1, 2013 to the end of the most recent fiscal quarter for which internal consolidated financial statements of CPG International LLC are available at the time of such restricted payment, plus certain customary addbacks. Based on the general restrictions in our Term Loan Agreement as of September 30, 2019, CPG International LLC would not have been permitted to declare or pay dividends, except for the specific purposes specified in the Senior Secured Credit Facilities, and, accordingly, $490.0 million of the assets of CPG International LLC were restricted pursuant to the terms of the Senior Secured Credit Facilities.
73
Table of Contents
Since our and our subsidiaries’ net assets exceed 25% of our consolidated net assets, in accordance with Rule 12-04, Schedule 1 of Regulation S-X, refer to our Consolidated Financial Statements included elsewhere in this Annual Report for condensed parent company financial statements of The AZEK Company Inc.
Cash Sources
We have historically relied on cash flows from operations generated by CPG International LLC, borrowings under the credit facilities, issuances of notes and other forms of debt financing and capital contributions to fund our cash needs.
On September 30, 2013, our subsidiary, CPG International LLC (as successor-in-interest to CPG Merger Sub LLC, a limited liability company formed to effect the acquisition of CPG International LLC), Deutsche Bank AG New York Branch, as administrative agent and collateral agent, or the Revolver Administrative Agent, and the lenders party thereto entered into the Revolving Credit Facility. On March 9, 2017, the Revolving Credit Facility was amended and restated to provide for maximum aggregate borrowings of up to $150.0 million, subject to an asset-based borrowing base. The borrowing base is limited to a specified percentage of eligible accounts receivable and inventory, less reserves that may be established by the Revolver Administrative Agent in the exercise of its reasonable credit judgment. On June 5, 2020, we entered into the RCF Amendment, which established $8.5 million of commitments for FILO Loans under the Revolving Credit Facility. Under the terms of the Revolving Credit Facility as amended by the RCF Amendment, FILO Loans may be borrowed against increased percentages of borrowing-base eligible assets (as compared to the percentages of borrowing-base eligible assets applicable to all other loans under the Revolving Credit Facility). The RCF Amendment did not increase the total aggregate amount of commitments under the Revolving Credit Facility. FILO Loans may be borrowed in a single disbursement on or prior to December 31, 2020. Borrowing of FILO Loans under the Revolving Credit Facility will reduce the total aggregate commitments available for revolving loans for so long as the FILO Loans remain outstanding. If borrowed, the FILO Loans will mature on December 4, 2021. As of September 30, 2020, we have not drawn on the FILO loans. There is no assurance that we will be able to draw on the FILO Loans at any time. As of September 30, 2020 and 2019, CPG International LLC had no outstanding borrowings under the Revolving Credit Facility and had $6.8 million and $3.0 million, respectively, of outstanding letters of credit held against the Revolving Credit Facility. As of September 30, 2020 and 2019, CPG International LLC had approximately $129.4 million and $113.7 million, respectively, available under the borrowing base for future borrowings in addition to cash and cash equivalents on hand of $215.0 million and $105.9 million, respectively. Because our borrowing capacity under the Revolving Credit Facility depends, in part, on inventory, accounts receivable and other assets that fluctuate from time to time, the amount available under the borrowing base may not reflect actual borrowing capacity under the Revolving Credit Facility.
Cash Uses
Our principal cash requirements have included working capital, capital expenditures, payments of principal and interest on our debt, and, if market conditions warrant, making selected acquisitions. We may elect to use cash from operations, debt proceeds, equity or a combination thereof to finance future acquisition opportunities.
74
Table of Contents
Cash Flows
| Years Ended September 30, | 2020 – 2019 Variance | 2019 – 2018 Variance | ||||||||||||||||||||||||||
| (U.S. dollars in thousands) | 2020 | 2019 | 2018 | $ Variance | % Variance |
$ Variance | % Variance |
|||||||||||||||||||||
| Net cash provided by (used in) operating activities |
$ | 98,361 | $ | 94,872 | $ | 67,302 | $ | 3,489 | 3.7% | $ | 27,570 | 41.0% | ||||||||||||||||
| Net cash provided by (used in) investing activities |
(113,794 | ) | (62,935 | ) | (335,682 | ) | (50,859 | ) | (80.8 | ) | 272,747 | 81.3 | ||||||||||||||||
| Net cash provided by (used in) financing activities |
124,498 | (8,273 | ) | 248,742 | 132,771 | 1,604.9 | (257,015 | ) | (103.3 | ) | ||||||||||||||||||
|
|
|
|
|
|
|
|
|
|
|
|
|
|
|
|||||||||||||||
| Net increase (decrease) in cash |
$ | 109,065 | $ | 23,664 | $ | (19,638 | ) | $ | 85,401 | N/M (1)% | $ | 43,302 | N/M (1)% | |||||||||||||||
|
|
|
|
|
|
|
|
|
|
|
|
|
|
|
|||||||||||||||
| (1) | “N/M” indicates the variance as a percentage is not meaningful. |
Year Ended September 30, 2020, Compared with Year Ended September 30, 2019
Cash Provided by (Used in) Operating Activities
Net cash provided by operating activities was $98.4 million and $94.9 million for the years ended September 30, 2020 and 2019, respectively. During the first half of our fiscal year, we operate programs to prepare for increased purchases during the building season, and as a result, we typically experience an increase in cash used in operating activities relative to the second half of our fiscal year. During the year ended September 30, 2020, our operating cash flow increased as a result of the increased demand for our Residential products, partially offset by higher accounts receivable and inventory balances.
Cash Provided by (Used in) Investing Activities
Net cash used in investing activities was $113.8 million and $62.9 million for the years ended September 30, 2020 and 2019, respectively, primarily representing purchases of property, plant and equipment in the normal course of business and the acquisition of Return Polymers for $18.5 million.
Cash Provided by (Used in) Financing Activities
Net cash provided by (used in) financing activities was $124.5 million and $(8.3) million for the years ended September 30, 2020 and 2019, respectively. Net cash provided by financing activities for the year ended September 30, 2020 consisted of proceeds from our IPO, net of related costs, our issuance of the 2025 Senior Notes and the Revolving Credit Facility, offset by our redemption of the 2025 Senior Notes and the 2021 Senior Notes, debt payments and redemptions of capital contributions, as compared to the year ended September 30, 2019, which consisted of proceeds from our Revolving Credit Facility, offset by payments for debt and contingent consideration related to the acquisition of Ultralox.
Year Ended September 30, 2019, Compared with Year Ended September 30, 2018
Cash Provided by (Used in) Operating Activities
Net cash provided by operating activities was $94.9 million and $67.3 million for the years ended September 30, 2019 and 2018, respectively. Cash provided by operating activities for fiscal year 2019 increased by approximately $27.6 million over fiscal year 2018 as the decrease in net income in fiscal year 2019 compared to fiscal year 2018 was more than offset by increased deferred tax expense and depreciation and amortization in fiscal year 2019 compared to fiscal year 2018 and a net increase in working capital in fiscal year 2019 primarily related to the timing of payments.
75
Table of Contents
Cash Provided by (Used in) Investing Activities
Net cash used in investing activities was $62.9 million and $335.7 million for the years ended September 30, 2019 and 2018, respectively. In fiscal year 2019, cash used in investing activities related to $63.0 million for purchases of property, plant and equipment. In fiscal year 2018, cash used in investing activities primarily related to $293.0 million used to complete acquisitions as well as $42.8 million for purchases of property, plant and equipment. A majority of the $42.8 million of property, plant and equipment purchased in fiscal year 2018 related to the purchase of manufacturing equipment in connection with the establishment of a recycling plant that was opened in fiscal year 2019.
Cash Provided by (Used in) Financing Activities
Net cash provided by (used in) financing activities was $(8.3) million and $248.7 million for the years ended September 30, 2019 and 2018, respectively. Net cash used in financing activities in fiscal year 2019 consisted primarily of payments of $8.3 million on long-term debt. In fiscal year 2018, we received $224.4 million of proceeds from incremental borrowings under the Term Loan Agreement as well as $40.0 million of aggregate proceeds from capital contributions by the Sponsors and certain of the other limited partners of our former indirect parent entity, or the Partnership, made in connection with acquisitions.
Indebtedness
Revolving Credit Facility
The Revolving Credit Facility provides for maximum aggregate borrowings of up to $150.0 million, subject to an asset-based borrowing base. Outstanding revolving loans under the Revolving Credit Facility will bear interest at a rate which equals, at our option, either (i) for alternative base rate, or ABR, borrowings, the highest of (a) the Federal Funds Rate plus 50 basis points, (b) the prime rate and (c) the LIBOR, as of such date for a deposit in U.S. dollars with a maturity of one month plus 100 basis points, plus, in each case, a spread of 50 to 100 basis points based on average historical availability, or (ii) for Eurocurrency borrowings, adjusted LIBOR plus a spread of 150 to 200 basis points, based on average historical availability. On June 5, 2020, we entered into the RCF Amendment, which established $8.5 million of commitments for FILO Loans. The commitments for the FILO Loans do not increase the total aggregate amount of commitments under the Revolving Credit Facility, as the total aggregate amount of revolving commitments under the Revolving Credit Facility will be reduced by the amount of any FILO loans outstanding. The FILO Loans are available to be drawn in a single disbursement on or prior to December 31, 2020. Outstanding FILO Loans under the Revolving Credit Facility will bear interest at a rate which equals, at our option, either (i) for alternative base rate, or ABR, borrowings, the highest of (a) the Federal Funds Rate plus 50 basis points, (b) the prime rate and (c) the LIBOR, as of such date for a deposit in U.S. dollars with a maturity of one month plus 100 basis points, plus, in each case, a spread of 250 basis points based on average historical availability, or (ii) for Eurocurrency borrowings, adjusted LIBOR plus a spread of 350 basis points.
A “commitment fee” accrues on any unused portion of the revolving commitments under the Revolving Credit Facility during the preceding three calendar month period. If the average daily used percentage is greater than 50%, the commitment fee equals 25 basis points, and if the average daily used percentage is less than or equal to 50%, the commitment fee equals 37.5 basis points. The Revolving Credit Facility matures on March 9, 2022.
The obligations under the Revolving Credit Facility are secured by a first priority security interest in certain assets, including substantially all of the accounts receivable, inventory, deposit accounts, securities accounts and cash assets of The AZEK Company Inc., CPG International LLC and the subsidiaries of CPG International LLC that are guarantors under the Revolving Credit Facility, and the proceeds thereof (subject to certain exceptions), or the Revolver Priority Collateral, plus a second priority security interest in all of the Term
76
Table of Contents
Loan Priority Collateral (as defined below). The obligations under the Revolving Credit Facility are guaranteed by The AZEK Company Inc. and the wholly owned domestic subsidiaries of CPG International LLC other than certain immaterial subsidiaries and other excluded subsidiaries.
Revolving loans under the Revolving Credit Facility may be voluntarily prepaid in whole, or in part, in each case without premium or penalty. Other than in the case of a mandatory prepayment, FILO Loans under the Revolving Credit Facility may not be repaid prior to maturity unless all revolving loans have been repaid. CPG International LLC is also required to make mandatory prepayments (i) when aggregate borrowings exceed commitments or the applicable borrowing base and (ii) during “cash dominion,” which occurs if (a) the availability under the Revolving Credit Facility is less than the greater of (i) $12.5 million and (ii) 10% of the
lesser of (x) $150.0 million and (y) the borrowing base, for five consecutive business days or (b) certain events of default have occurred and are continuing.
The Revolving Credit Facility contains affirmative covenants that are customary for financings of this type, including allowing the Revolver Administrative Agent to perform periodic field exams and appraisals to evaluate the borrowing base. The Revolving Credit Facility contains various negative covenants, including limitations on, subject to certain exceptions, the incurrence of indebtedness, the incurrence of liens, dispositions, investments, acquisitions, restricted payments, transactions with affiliates, as well as other negative covenants customary for financings of this type. The Revolving Credit Facility also includes a financial maintenance covenant, applicable only when the excess availability is less than the greater of (i) 10% of the lesser of the aggregate commitments under the Revolving Credit Facility and the borrowing base, and (ii) $12.5 million. In such circumstances, we would be required to maintain a minimum fixed charge coverage ratio (as defined in the Revolving Credit Facility) for the trailing four quarters equal to at least 1.0 to 1.0; subject to our ability to make an equity cure (no more than twice in any four quarter period and up to five times over the life of the facility). As of September 30, 2020 and 2019, CPG International LLC was in compliance with the financial and nonfinancial covenants imposed by the Revolving Credit Facility. The Revolving Credit Facility also includes customary events of default, including the occurrence of a change of control.
We also have the option to increase the commitments under the Revolving Credit Facility by up to $100.0 million, subject to certain conditions.
Term Loan Agreement
The Term Loan Agreement is a first lien term loan. As of September 30, 2020, and 2019, CPG International LLC had $467.7 million and $809.6 million, respectively, outstanding under the Term Loan Agreement. The Term Loan Agreement will mature on May 5, 2024.
The interest rate applicable to the outstanding principal under the Term Loan Agreement equals, at our option, either, (i) in the case of ABR borrowings, the highest of (a) the Federal Funds Rate as of such day plus 50 basis points, (b) the prime rate and (c) the LIBOR as of such day for a deposit in U.S. dollars with a maturity of one month plus 100 basis points, provided that in no event will the alternative base rate be less than 200 basis points, plus, in each case, the applicable margin of 275 basis points per annum; or (ii) in the case of Eurocurrency borrowings, the greater of (a) the LIBOR in effect for such interest period divided by one, minus the statutory reserves applicable to such Eurocurrency borrowing, if any, and (b) 100 basis points, plus the applicable margin of 375 basis points per annum.
The obligations under the Term Loan Agreement are secured by a first priority security interest in the membership interests of CPG International LLC owned by The AZEK Company Inc., the equity interests of CPG International LLC’s domestic subsidiaries and all remaining assets not constituting Revolver Priority Collateral (subject to certain exceptions) of The AZEK Company Inc., CPG International LLC and the subsidiaries of CPG International LLC that are guarantors under the Term Loan Agreement, or the Term Loan Priority Collateral, and
77
Table of Contents
a second priority security interest in the Revolver Priority Collateral. The obligations under the Term Loan Agreement are guaranteed by The AZEK Company Inc. and the wholly owned domestic subsidiaries of CPG International LLC other than certain immaterial subsidiaries and other excluded subsidiaries.
The Term Loan Agreement may be voluntarily prepaid in whole, or in part, in each case without premium or penalty (other than the Prepayment Premium, as defined in the Term Loan Agreement, if applicable), subject to certain customary conditions. CPG International LLC is also required to make mandatory prepayments in an amount equal to (i) 100% of the net cash proceeds from casualty events or the disposition of property or assets, subject to customary reinvestment rights, (ii) 100% of the net cash proceeds from the incurrence or issuance of indebtedness (other than permitted indebtedness) by CPG International LLC or any restricted subsidiary and (iii) 50% of excess cash flow, with such percentage subject to reduction (to 25% and to 0%) upon achievement of specified leverage ratios and which prepayment may be declined by the lenders under the Term Loan Agreement. At September 30, 2020, no excess cash flow payment was required based on the current leverage ratio. At September 30, 2019, the estimated prepayment from excess cash flow was $6.4 million. The lenders under the Term Loan Agreement have the option to decline any prepayments based on excess cash flows. At the lenders’ option the excess cash flow payment made in January 2020 was $2.2 million with the remaining prepayment declined by the lenders. Additionally, CPG International LLC is required to pay the outstanding principal amount of the Term Loan Agreement in quarterly installments of 0.25253% of the aggregate principal amount under the Term Loan Agreement outstanding, and such quarterly payments may be reduced as a result of prepayments. Based on the prepayment of $337.7 million made with net proceeds we received from our IPO, CPG International LLC has prepaid all of the quarterly principal payments otherwise due through the maturity of the Term Loan Agreement.
The Term Loan Agreement contains affirmative covenants, negative covenants and events of default, which are broadly consistent with those in the Revolving Credit Facility (with certain differences consistent with the differences between a revolving loan and term loan) and that are customary for facilities of this type. The Term Loan Agreement does not have any financial maintenance covenants. As of September 30, 2020 and 2019, CPG International LLC was in compliance with the covenants imposed by the Term Loan Agreement. The Term Loan Agreement also includes customary events of default, including the occurrence of a change of control.
We have the right to arrange for incremental term loans under the Term Loan Agreement of up to an aggregate principal amount of $150.0 million, plus the amounts incurred under Incremental Amendment No. 1 thereto, plus any amounts previously voluntarily prepaid, with additional incremental term loans available if certain leverage ratios are achieved.
2025 Senior Notes
On May 12, 2020, CPG International LLC issued $350.0 million aggregate principal amount of 9.500% Senior Notes due May 15, 2025, or the 2025 Senior Notes, in any unregistered offering. On June 16, 2020, CPG International LLC satisfied and discharged its obligations with respect to the 2025 Senior Notes with a portion of net proceeds from the IPO. The 2025 Senior Notes were redeemed in full at a redemption price equal to 107.125% of the principal amount of the 2025 Senior Notes plus accrued and unpaid interest to the redemption date.
2021 Senior Notes
On September 30, 2013, CPG International LLC issued $315.0 million aggregate principal amount of 8.000% Senior Notes due October 1, 2021, or the 2021 Senior Notes, in any unregistered offering. On May 12, 2020, in conjunction with the issuance of the 2025 Senior Notes, CPG International LLC satisfied and discharged its obligations with respect to the 2021 Senior Notes, which were redeemed in full on June 8, 2020 at a redemption price equal to par plus accrued and unpaid interest to the redemption date.
78
Table of Contents
Restrictions on Dividends
The Senior Secured Credit Facilities each restrict payments of dividends unless certain conditions, as provided in the Revolving Credit Facility or the Term Loan Agreement, as applicable, are met.
Off-Balance Sheet Arrangements
In addition to our debt guarantees, we have contractual commitments for purchases of certain minimum quantities of raw materials at index-based prices, and non-cancelable capital and operating leases, outstanding letters of credit and fixed asset purchase commitments. We have no other material non-cancelable guarantees or commitments, and no material special purpose entities or other off-balance sheet debt obligations.
Contractual Obligations
The following table summarizes our contractual cash obligations as of September 30, 2020. This table does not include information on our recurring purchases of materials for use in production, as our raw materials purchase contracts do not require fixed or minimum quantities.
| Payments Due by Period | ||||||||||||||||||||
| (In thousands) | Total | Less than 1 year |
1 – 3 years | 3 – 5 years | More than 5 years |
|||||||||||||||
| Long-term indebtedness, excluding interest (1) |
$ | 467,654 | $ | — | $ | — | $ | 467,654 | $ | — | ||||||||||
| Interest on long-term indebtedness (2) |
82,507 | 22,214 | 44,427 | 15,866 | — | |||||||||||||||
| Capital lease obligations |
7,799 | 1,635 | 2,640 | 1,333 | 2,191 | |||||||||||||||
| Finance lease obligations |
7,864 | 776 | 1,593 | 1,672 | 3,823 | |||||||||||||||
| Raw material purchase commitments (3) |
3,100 | 3,100 | — | — | — | |||||||||||||||
| Operating lease obligations |
14,496 | 2,646 | 4,910 | 3,543 | 3,397 | |||||||||||||||
| Fixed asset purchase commitments (4) |
1,503 | 1,503 | — | — | — | |||||||||||||||
|
|
|
|
|
|
|
|
|
|
|
|||||||||||
| Total contractual obligations |
$ | 584,923 | $ | 31,874 | $ | 53,570 | $ | 490,068 | $ | 9,411 | ||||||||||
|
|
|
|
|
|
|
|
|
|
|
|||||||||||
| (1) | As of September 30, 2020, long-term indebtedness, excluding interest, consisted of $467.7 million under the Term Loan Agreement. |
| (2) | Interest on long-term indebtedness includes interest on our outstanding borrowings of $467.7 million under the Term Loan Agreement equal to, at our option, either, (i) in the case of ABR borrowings, the highest of (a) the Federal Funds Rate as of such day plus 50 basis points, (b) the prime rate and (c) the LIBOR as of such day for a deposit in U.S. dollars with a maturity of one month plus 100 basis points, provided that in no event will the alternative base rate be less than 200 basis points, plus, in each case, the applicable margin of 275 basis points per annum; or (b) in the case of the Eurocurrency borrowings, the greater of (a) the LIBOR in effect for such interest period divided by one, minus the statutory reserves applicable to such Eurocurrency borrowing, if any, and (b) 100 basis points, plus the applicable margin of 375 basis points per annum. For purposes of this table, we have assumed an interest rate of 4.75% on the Term Loan Agreement for all future periods, which is the rate as of September 30, 2020. |
| (3) | Substantially all of our resins are purchased under supply contracts that average approximately one year, for which pricing is variable based on an industry benchmark price index. The resin supply contracts are negotiated annually and generally provide that we are obligated to purchase a minimum amount of resins from each supplier. As of September 30, 2020, we had purchase commitments under material supply contracts of $3.1 million for the year ending December 31, 2020. |
| (4) | Primarily related to purchases of equipment for manufacturing purposes. |
The following is a summary of the outstanding letter of credit arrangements as of September 30, 2020 (in thousands):
| Total | 2021 | 2022-2023 | 2024-2025 | Thereafter | ||||||||||||||||
| Letters of credit |
$ | 6,783 | $ | — | $ | 6,783 | $ | — | $ | — | ||||||||||
79
Table of Contents
Critical Accounting Policies, Estimates and Assumptions
A discussion of our significant accounting policies and significant accounting estimates and judgments is presented in the Summary of Significant Accounting Policies in the Notes to our Consolidated Financial Statements included elsewhere in this Annual Report. Throughout the preparation of the financial statements, we employ significant judgments in the application of accounting principles and methods. These judgments are primarily related to the assumptions used to arrive at various estimates. These significant accounting estimates and judgments include:
Revenue Recognition
Our Residential segment generates revenue from the sale of our innovative, low-maintenance, sustainable Outdoor Living products, including decking, railing, trim, moulding, pavers products and accessories. Our Commercial segment generates revenue from the sale of sustainable low-maintenance privacy and storage solution products and highly engineered plastic sheet products.
We recognize revenues when control of the promised goods is transferred to our customers in an amount that reflects the consideration we expect to be entitled to in exchange for those goods, at a point in time, when shipping occurs. Each product we transfer to the customer is considered one performance obligation. We have elected to account for shipping and handling costs as activities to fulfill the promise to transfer the goods. As a result of this accounting policy election, we do not consider shipping and handling activities as promised services to our customers.
Customer contracts are typically fixed price and short-term in nature. The transaction price is based on the product specifications and is determined at the time of order. We do not engage in contracts greater than one year, and therefore do not have any incremental costs capitalized as of September 30, 2020 or September 30, 2019.
We may offer various sales incentive programs throughout the year. We estimate the amount of sales incentive to allocate to each performance obligation, or product shipped, using the most-likely-amount method of estimation, based on sales to the direct customer or sell-through customer. The estimate is updated each reporting period and any changes are allocated to the performance obligations on the same basis as at inception. Changes in estimate allocated to a previously satisfied performance obligation are recognized as part of net revenue in the period in which the change occurs under the cumulative catch-up method. In addition to sales incentive programs, we may offer a payment discount, if payments are received within 30 days. We estimate the payment discount that we determine will be taken by the customer based on prior history and using the most-likely-amount method of estimation. We believe the most-likely-amount method best predicts the amount of consideration to which we will be entitled. The payment discounts are also reflected as part of net revenue. The total amount of incentives was $63.1 million, $50.8 million and $42.4 million for the years ended September 30, 2020, 2019 and 2018, respectively.
Customer program costs and incentives, such as rebates are a common practice in our business. We incur customer program costs to promote sales of products and to maintain competitive pricing. Customer program costs and incentives include annual programs related to volume growth as well as certain product-specific incentives. The program costs are accounted for at the time the revenue is recognized in net sales. Management’s estimates are based on historical and projected experience for each type of program or customer and in consideration of product specific incentives. Management periodically reviews accruals for these rebates and allowances, and adjusts accruals when circumstances indicate (typically as a result of a change in volume expectations).
Goodwill
We evaluate the recoverability of goodwill at the reporting unit level annually, or more frequently if an event occurs or circumstances change in the interim that would more likely than not reduce the fair value of the
80
Table of Contents
asset below the carrying amount. During fiscal year 2019, we changed the annual impairment assessment date on which impairment is tested to August 1 from September 30 to align more consistently with the annual budgeting process. This change did not accelerate, delay, avoid or cause an impairment charge, nor did this change result in adjustments to any previously issued financial statements. Goodwill is considered to be impaired when the net book value of the reporting unit exceeds its estimated fair value. We may first assess qualitative factors to determine if it is more likely than not that the fair value of the reporting unit is less than its carrying amount or may elect to bypass the qualitative assessment and proceed to a quantitative assessment to determine if goodwill is impaired. In quantitative impairment tests, we first compare the fair value of the reporting unit to the carrying value. If the carrying value of a reporting unit exceeds its fair value, the goodwill of that reporting unit is impaired and an impairment loss is recognized for the excess up to the amount of goodwill allocated to the reporting unit.
We measure fair value of the reporting units to which goodwill is allocated using an income based approach, a generally accepted valuation methodology, using relevant data available through and as of the impairment testing date. Under the income approach, fair value is determined using a discounted cash flow method, projecting future cash flows of each reporting unit, as well as a terminal value, and discounting such cash flows at a rate of return that reflects the relative risk of the cash flows. The key estimates and factors used in this approach include, but are not limited to, revenue growth rates and profit margins based on internal forecasts, a weighted average cost of capital used to discount future cash flows, and a review with comparable market multiples for the industry segment as well as our historical operating trends. Any impairment is increased to encompass the income tax effects of any tax deductible goodwill on the carrying amount of the reporting unit, so that the after-tax impairment loss is equivalent to the amount by which the carrying value of the reporting unit exceeds its fair value.
No impairments were recorded during the year ended September 30, 2020 as the estimated fair value substantially exceeded the carrying value for all reporting units.
In determining the fair value of our reporting units, we use the income test, as described above, which includes, among key estimates, anticipated revenue growth rates and profit margins, based on internal forecasts, as well as performance for the industry segment, all of which are subject to uncertainty. We also compare the consolidated valuation from the income test to the market capitalization as calculated by the current share capitalization and share price. Future adverse developments relating to such matters as the growth in the market for our reporting units, competition, general economic conditions, the market appeal of products or anticipated profit margins could reduce the fair value of the reporting units and could result in an impairment of the reporting unit.
Product Warranties
We provide product assurance warranties against certain defects to our customers based on standard terms and conditions for periods beginning as of the sale date and lasting from five years to a lifetime, depending on the product and subject to various limitations. We provide for the estimated cost of warranties by product line at the time revenue is recognized based on management’s judgment, considering such factors as cost per claim, historical experience, anticipated rates of claims, and other available information, including our stated warranty policies and procedures. Management reviews and adjusts these estimates, if necessary, based on the differences between actual experience and historical estimates. Because warranty issues may surface later in the product life cycle, management continues to review these estimates on a regular basis and considers adjustments to these estimates based on actual experience compared to historical estimates. Estimating the required warranty reserves requires a high level of judgment, especially as many of our products are at a relatively early stage in their product life cycles. The warranty obligation is reflected in other current and other non-current liabilities in the consolidated balance sheets.
81
Table of Contents
Equity Based Compensation
Prior to our IPO
To assist us in attracting, retaining, incentivizing and motivating employees, certain employees were granted limited partnership interests in the Partnership that generally were intended to constitute “profits interests,” or the Profits Interests. The Profits Interests were subject to specified hurdle amounts, which functioned like option exercise prices because the Profits Interests did not participate in distributions by the Partnership until distributions to equity holders had exceeded the relevant hurdle amounts. In general, awards of Profits Interests were 50% time vested and 50% performance vested.
Prior to completion of our IPO, interests in the Partnership, including the Profits Interests, were not listed on any established exchange. In determining the fair value of the Profits Interests, we took into account the methodologies and approaches described in the American Institute of Certified Public Accountants Accounting and Valuation Guide, Valuation of Privately-Held Company Equity Securities Issued as Compensation. The sole material asset of the Partnership was indirect ownership of our company. Accordingly, the fair value of the Profits Interests was derived by reference to the value of our company, which we estimated using a combination of the income approach and the market approach. Under the income approach, we estimated the fair value of our company based on the present value of our future estimated cash flows and the estimated residual value of our company beyond the forecast period. These future values were discounted to their present values at a discount rate deemed appropriate to reflect the risks inherent in achieving these estimated cash flows. Significant estimates and judgments involved in the income approach include our estimated future cash flows, the perpetuity growth rate assumed in estimating the residual value of our cash flows and the discount rate used to discount our cash flows to present value. For the market approach, we utilized the comparable company method by analyzing a group of companies that were considered to be comparable to us in terms of product offerings, revenue, margins and/or growth. We then used these companies to develop relevant market multiples, which were applied to our corresponding financial metrics to estimate our equity value. Significant estimates and judgments used in the comparable company method included the selection of comparable companies and the selection of appropriate market multiples. Application of these approaches involves the use of estimates, judgment and assumptions that are highly subjective. Following our IPO, it is not necessary to apply these valuation approaches as shares of our common stock are traded in the public market.
In order to determine the value of the Profits Interests, the estimated equity value of the Partnership was allocated among the various interests in the Partnership, including the Profits Interests, using the option pricing method, or OPM, which treated the various interests in the Partnership as call options with exercise prices determined based on their respective rights to participate in distributions by the Partnership. The values attributable to these implicit call options were determined using the Black-Scholes option pricing model. The Black-Scholes option pricing model requires the use of highly subjective assumptions, including volatility and the expected term of the call options. As equity interests in the Partnership were not publicly traded, expected volatility was derived based on the volatilities of a peer group of publicly-traded companies that were deemed to be similar to us. The expected term of the options was based on the anticipated time to liquidity. Other assumptions include the risk-free rate of interest and dividend yield. The risk-free rate of interest was based on yields for U.S. Treasury securities with remaining maturities corresponding to the estimated term of the options. Dividends were assumed to be zero, consistent with historical experience. After the equity value was determined and allocated to the various classes of interests in the Partnership, including the Profits Interests, a discount for lack of marketability, or DLOM, was applied to derive the fair value of the Profits Interests. A DLOM is meant to account for the lack of marketability of a security that is not publicly traded.
The cost of time vested Profits Interests was recognized as an expense generally on a straight-line basis over the employee’s requisite service period, which generally coincided with the vesting of the award. For performance vested Profits Interests, expense was recognized if and when the achievement of the applicable performance criteria became probable. Performance vested Profits Interests only vested upon receipt by the Sponsors of specified proceeds (in the form of cash and marketable securities) or, in the event of a Change of
82
Table of Contents
Control (as defined in the Amended and Restated Agreement of Limited Partnership of the Partnership, dated as of September 30, 2013, or the Partnership Agreement), upon the Sponsors achieving a specified rate of return. Through September 30, 2019 and immediately prior to the IPO, no compensation expense has been recognized with respect to the performance vested Profits Interests because the achievement of the performance criteria had not become probable.
Subsequent to our IPO
We determine the expense for all employee stock-based compensation awards by estimating their fair value and recognizing such value as an expense, on a straight-line, ratable or cliff basis, depending on the award, in our consolidated financial statements over the requisite service period in which employees earn the awards. We estimate the fair value of performance-based awards granted to employees using the Monte Carlo pricing model and for service-based awards granted to employees using the Black Scholes pricing model. The fair value of performance-based awards that are expected to vest is recognized as compensation expense on a straight-line basis over the requisite service period. The fair value of service-based awards that are expected to vest is recognized as compensation expense on either (1) straight-line basis, (2) a ratable vesting basis or (3) a cliff vesting basis. We account for forfeitures as they occur.
To determine the fair value of a stock-based award using the Monte Carlo and Black Scholes models, we make assumptions regarding the risk-free interest rate, expected future volatility, expected dividend yield and performance period. The risk-free rate is based on the U.S. treasury yield curve in effect at the time of grant. We estimate the expected volatility of the share price by reviewing the estimated volatility levels of our Class A common stock in conjunction with the historical volatility levels of public companies that operate in similar industries or are similar in terms of stage of development or size and then projecting this information toward its future expected volatility. We exercise judgment in selecting these companies, as well as in evaluating the available historical and implied volatility for these companies. Dividend yield is determined based on our future plans to pay dividends. We calculate the performance period based on the specific market condition to be achieved and derived from estimates of future performance. We calculate the expected term in years for each stock option using a simplified method based on the average of each option’s vesting term and original contractual term. The simplified method is used due to the lack of sufficient historical data available to provide a reasonable basis upon which to estimate the expected term of each stock option.
Stock-Based Compensation Expense
We recognized $120.5 million, $3.3 million and $2.5 million in stock-based compensation expense during the years ended September 30, 2020, 2019 and 2018, respectively. The stock-based compensation expense recognized in fiscal year 2020 is primarily a result of the vesting of performance-based equity awards due to the Sponsors receiving sufficient proceeds from our secondary offering completed in September 2020.
Income Taxes
In determining our current income tax provision, we assessed temporary differences resulting from differing treatments of items for tax and accounting purposes. These differences resulted in deferred tax assets and liabilities which are recorded in our consolidated balance sheets. When we maintain deferred tax assets, we must assess the likelihood that these assets will be recovered through adjustments to future taxable income. To the extent we believe, based on available evidence, it is more likely than not that all or some portion of the asset will not be realized, we establish a valuation allowance. We record an allowance reducing the asset to a value we believe is more likely than not to be realized based on our expectation of future taxable income. We believe the accounting estimate related to the valuation allowance is a critical accounting estimate because it is highly susceptible to change from period to period as it requires management to make assumptions about our future income over the lives of the deferred tax assets, and the impact of increasing or decreasing the valuation allowance is potentially material to our results of operations.
83
Table of Contents
Forecasting future income requires us to use a significant amount of judgment. In estimating future income, we use our internal operating budgets and long-range planning projections. We developed our budgets and long-range projections based on recent results, trends, economic and industry forecasts influencing our segments’ performance, our backlog, planned timing of new product launches, and customer sales projections. Significant changes in the expected realization of net deferred tax assets would require that we adjust the valuation allowance, resulting in a change to net income.
We record liabilities for uncertain income tax positions based on a two-step process. The first step is recognition, where we evaluate whether an individual tax position has a likelihood of greater than 50% of being sustained upon examination based on the technical merits of the position, including resolution of any related appeals or litigation processes. For tax positions that are currently estimated to have a less than 50% likelihood of being sustained, no tax benefit is recorded. For tax positions that have met the recognition threshold in the first step, we perform the second step of measuring the benefit (expense) to be recorded. The actual benefits (expense) ultimately realized may differ from our estimates. In future periods, changes in facts, circumstances, and new information may require us to change the recognition and measurement estimates with regard to individual tax positions. Changes in recognition and measurement estimates are recorded in the consolidated statement of income and consolidated balance sheet in the period in which such changes occur. As of September 30, 2020 and 2019, we had liabilities for unrecognized tax benefits pertaining to uncertain tax positions totaling $1.0 million and $1.0 million, respectively.
Recently Adopted Accounting Pronouncements
We qualify as an emerging growth company, and as such, have elected not to opt out of the extended transition period for complying with new or revised accounting pronouncements. During the extended transition period, we are not subject to new or revised accounting standards applicable to public companies. The accounting pronouncements pending adoption below reflect effective dates for us as an emerging growth company with the extended transition period.
On October 1, 2017, we adopted ASU No. 2015-11, Inventory—Simplifying the Measurement of Inventory. The update requires that inventory be measured at the lower of cost and net realizable value. Net realizable value is the estimated selling prices in the ordinary course of business, less reasonably predictable costs of completion, disposal, and transportation. The adoption of this amendment did not have a material impact on our Consolidated Financial Statements.
On October 1, 2017, we adopted ASU No. 2016-15, Statement of Cash Flows (Topic 230): Classification of Certain Cash Receipts and Cash Payments. The update clarifies the classification of certain cash receipts and payments in the statement of cash flows. Application of the new guidance required reclassification of certain cash flows within operating activities to investing and financing activities on our consolidated statement of cash flows. The adoption of this standard did not have a material impact on our Consolidated Financial Statements.
On October 1, 2018, we early adopted ASU No. 2014-09, Revenue from Contracts with Customers, which outlines a single comprehensive model for entities to use in accounting for revenue arising from contracts with customers. The update will supersede most current revenue recognition guidance. Under the new standard, entities are required to identify the contract with a customer; identify the separate performance obligations in the contract; determine the transaction price; allocate the transaction price to the separate performance obligations in the contract; and recognize the appropriate amount of revenue when (or as) the entity satisfies each performance obligation. The adoption of this standard did not have a material impact on our Consolidated Financial Statements.
On October 1, 2019, we adopted ASU No. 2016-16, Income Taxes (Topic 740): Intra-Entity Transfer of Assets Other Than Inventory. The standard amends several aspects of the tax accounting and recognition
84
Table of Contents
timing for intra-company transfers. We adopted the standard using a modified retrospective approach, with an adjustment to the beginning retained earnings of approximately $1.3 million, due to the cumulative impact of adopting the standard. The adoption of this standard did not have a material impact on our Consolidated Financial Statements.
Recently Issued Accounting Pronouncements
In February 2016, the Financial Accounting Standards Board (“FASB”) issued ASU No. 2016-02, Leases (Topic 842), and issued subsequent amendments to the initial guidance in September 2017 within ASU No. 2017-13, in January 2018 within ASU No. 2018-01, in July 2018 within ASU Nos. 2018-10 and 2018-11, in December 2018 within ASU No. 2018-20, in March 2019 within ASU No. 2019-01, in November 2019 within ASU No. 2019-10 and in June 2020 within ASU No. 2020-05. This standard requires lessees to present right-of-use assets and lease liabilities on the balance sheet. For public entities, the updated standard is effective for fiscal years beginning after December 15, 2018. This standard is effective for us as an EGC for fiscal years beginning after December 15, 2021 and interim periods within fiscal years beginning after December 15, 2022, with early adoption permitted. Assuming we remain an EGC, we intend to adopt the updated standard during our fiscal year beginning October 1, 2022 and for interim periods within that fiscal year. This standard provides the option to adopt through a cumulative-effect adjustment to the opening balance of retained earnings in the period of adoption, instead of applying the new guidance retrospectively for each prior reporting period presented. We are currently evaluating the impact these ASU’s adoption will have on our Consolidated Financial Statements.
In June 2016, the FASB issued ASU No. 2016-13, Financial Instruments—Credit Losses (Topic 326), and issued subsequent amendments to the initial guidance in May 2019 within ASU No. 2019-05 and in November 2019 within ASU Nos. 2019-10 and 2019-11. This standard sets forth an expected credit loss model which requires the measurement of expected credit losses for financial instruments based on historical experience, current conditions and reasonable and supportable forecasts. This replaces the existing incurred loss model and is applicable to the measurement of credit losses on financial assets measured at amortized cost, and certain off-balance sheet credit exposures. For public entities, the updated standard is effective for fiscal years beginning after December 15, 2019, including interim periods within those fiscal years. This standard is effective for us as an EGC for fiscal years beginning after December 15, 2022 including interim periods within those fiscal years. Early adoption is permitted, and the standard is adopted using a modified retrospective transition method through a cumulative-effect adjustment to retained earnings as of the beginning of the first reporting period in which the guidance is effective. We are currently evaluating the impact the adoption of this standard will have on our Consolidated Financial Statements.
In August 2018, the FASB issued ASU No. 2018-13, Disclosure Framework—Changes to the Disclosure Requirements for Fair Value Measurement, which amends Topic 820, Fair Value Measurement. This standard modifies the disclosure requirements for fair value measurements by removing, modifying, or adding certain disclosures. For all entities, this standard is effective for annual reporting periods beginning after December 15, 2019, and interim periods within those fiscal years. We intend to adopt the updated standard during our fiscal year beginning October 1, 2020 and for interim periods within fiscal years beginning in that fiscal year. The removed and modified disclosures will be adopted on a retrospective basis and the new disclosures will be adopted on a prospective basis. We are currently evaluating the impact the adoption of this standard will have on our Consolidated Financial Statements.
In August 2018, the FASB issued ASU No. 2018-15, Intangibles—Goodwill and Other—Internal-Use Software (Subtopic 350-40): Customer’s Accounting for Implementation Costs Incurred in a Cloud Computing Arrangement That is a Service Contract. This standard aligns the requirements for capitalizing implementation costs incurred in a hosting arrangement that is a service contract with the requirements for capitalizing implementation costs incurred to develop or obtain internal-use software. For public entities, the updated standard is effective for fiscal years beginning after December 15, 2019, including interim periods within that fiscal year. The amendments in this ASU are effective for us, as an EGC, for annual periods beginning after
85
Table of Contents
December 15, 2020 and interim periods within annual periods beginning after December 15, 2021. The standard can be adopted either retrospectively or prospectively to all implementation costs incurred after the date of adoption. Early adoption is permitted. Assuming we remain an EGC, we intend to adopt the updated standard during our fiscal year beginning October 1, 2021 and for interim periods within fiscal year beginning October 1, 2022. We are currently evaluating the impact the adoption of this standard will have on our Consolidated Financial Statements.
In December 2019, the FASB issued ASU No. 2019-12, Income Taxes (Topic 740)—Simplifying the Accounting for Income Taxes. This standard simplifies the accounting for income taxes by removing certain exceptions to general principles in Topic 740 and clarifying and amending existing guidance. For public entities, the amendments in this ASU are effective for fiscal years, and interim periods within those fiscal years, beginning after December 15, 2020. For all other entities, the amendments are effective for fiscal years beginning after December 15, 2021, and interim periods within fiscal years beginning after December 15, 2022. Early adoption of the amendments is permitted, including adoption in any interim period for (1) public business entities for periods for which financial statements have not yet been issued and (2) all other entities for periods for which financial statements have not yet been made available for issuance. An entity that elects to early adopt the amendments in an interim period should reflect any adjustments as of the beginning of the annual period that includes that interim period. Additionally, an entity that elects early adoption must adopt all the amendments in the same period. The amendments are applied on a prospective or retrospective basis, depending upon the amendment adopted within this ASU. The amendments in this ASU are effective for us, as an EGC, for annual periods beginning after December 15, 2021 and interim periods within annual periods beginning after December 15, 2022. We are currently evaluating the impact this adoption will have on our Consolidated Financial Statements.
In March 2020, the FASB issued ASU No. 2020-04, Reference Rate Reform (Topic 848), Facilitation of the Effects of Reference Rate Reform on Financial Reporting. This standard provides optional expedients and exceptions for applying generally accepted accounting principles to contract modifications and hedging relationships, subject to meeting certain criteria, that reference LIBOR or another reference rate expected to be discontinued. The ASU is effective for all entities as of March 12, 2020, and will apply through December 31, 2022. We are currently evaluating the impact this adoption will have on our Consolidated Financial Statements.
JOBS Act Accounting Election
We are an “emerging growth company” within the meaning of the JOBS Act. Under the JOBS Act, emerging growth companies can delay adopting new or revised accounting standards until such time as those standards apply to private companies. We have elected to avail ourselves of this exemption from new or revised accounting standards, and, therefore, we will not be subject to the same new or revised accounting standards as other public companies that are not emerging growth companies or that have opted out of using such extended transition period, which may make comparison of our financial statements with those of other public companies more difficult. We may take advantage of these reporting exemptions until we no longer qualify as an emerging growth company, or, with respect to adoption of certain new or revised accounting standards, until we irrevocably elect to opt out of using the extended transition period.
We will remain an emerging growth company until the earliest of (i) the last day of the fiscal year in which we have total annual gross revenues of $1.07 billion or more; (ii) the last day of our fiscal year following the fifth anniversary of the date of the completion of our IPO; (iii) the date on which we have issued more than $1.0 billion in nonconvertible debt during the previous three years; and (iv) the date on which we are deemed to be a large accelerated filer under the rules of the SEC.
86
Table of Contents
Item 7A. Quantitative and Qualitative Disclosures About Market Risk.
Interest Rate Risk
We are subject to interest rate risk in connection with our long-term debt. Our principal interest rate risk relates to the Senior Secured Credit Facilities. To meet our seasonal working capital needs, we borrow periodically on our variable rate revolving line of credit under the Revolving Credit Facility. As of September 30, 2020 and 2019, we had $467.7 million and $809.6 million, respectively, outstanding under the Term Loan Agreement and no outstanding amounts under the Revolving Credit Facility. The Term Loan Agreement and Revolving Credit Facility bear interest at variable rates. An increase or decrease of 100 basis points in the floating rates on the amounts outstanding under the Senior Secured Credit Facilities as of September 30, 2020, 2019 and 2018, would have increased or decreased, respectively, annual cash interest by approximately $4.7 million, $8.1 million and $8.2 million, respectively.
In the future, in order to manage our interest rate risk, we may refinance our existing debt or enter into interest rate swaps or otherwise hedge the risk of changes in the interest rate under the Senior Secured Credit Facilities. However, we do not intend or expect to enter into derivative or interest rate swap transactions for speculative purposes.
Credit Risk
As of September 30, 2020 and 2019, our cash and cash equivalents were maintained at major financial institutions in the United States, and our current deposits are likely in excess of insured limits. We believe these institutions have sufficient assets and liquidity to conduct their operations in the ordinary course of business with little or no credit risk to us.
Our accounts receivable primarily relate to revenue from the sale of products primarily to established distributors inside of the United States. To mitigate credit risk, ongoing credit evaluations of customers’ financial condition are performed. As of September 30, 2020, three customers each represented more than 10% of gross trade receivables: Customer A was 13.1%, Customer B was 12.6% and Customer C was 11.9%. As of September 30, 2019, no customer represented more than 10% of our gross trade accounts receivable.
Foreign Currency Risk
Substantially all of our business is currently conducted in U.S. dollars. We do not believe that an immediate 10% increase or decrease in the relative value of the U.S. dollar as compared to other currencies would have a material effect on our operating results.
Inflation
Our cost of sales is subject to inflationary pressures and price fluctuations of the raw materials we use. Historically, we have generally been able over time to recover the effects of inflation and price fluctuations through sales price increases and production efficiencies associated with technological enhancements and volume growth; however, we cannot reasonably estimate our ability to successfully recover any price increases in the future.
Raw Materials
We rely upon the supply of certain raw materials in our production processes; however, we do not typically enter into fixed price contracts with our suppliers and currently have no fixed price contracts with our major vendors. The primary raw materials we use in the manufacture of our products are various petrochemical resins, including polyethylene, polypropylene and PVC resins, reclaimed polyethylene and PVC material, waste wood fiber and aluminum. In addition, we utilize a variety of other additives including modifiers, TiO2 and pigments. The exposures associated with these costs are primarily managed through terms of the sales and by maintaining relationships with multiple vendors. Prices for spot market purchases are negotiated on a continuous
87
Table of Contents
basis in line with the market at the time. We have not entered into hedges with respect to our raw material costs at this time, but we may choose to enter into such hedges in the future. Other than short term supply contracts for resins with indexed based pricing and occasional strategic purchases of larger quantities of certain raw materials, we generally buy materials on an as-needed basis.
The cost of some of the raw materials we use in the manufacture of our products is subject to significant price volatility. For example, the cost of petrochemical resins used in our manufacturing processes has historically varied significantly and has been affected by changes in supply and demand and in the price of crude oil. Substantially all of our resins are purchased under supply contracts that average approximately one to two years, for which pricing is variable based on an industry benchmark price index. The resin supply contracts are negotiated annually and generally provide that we are obligated to purchase a minimum amount of resins from each supplier. In addition, the price of reclaimed polyethylene material, waste wood fiber, aluminum, other additives (including modifiers, TiO2 and pigments) and other raw materials fluctuates depending on, among other things, overall market supply and demand and general business conditions.
Item 8. Financial Statements and Supplementary Data.
The financial statements required by this Item are located beginning on page F-1 of this report.
Item 9. Changes in and Disagreements with Accountants on Accounting and Financial Disclosure.
None.
Item 9A. Controls and Procedures.
This Item 9A includes information concerning the controls and controls evaluation referred to in the certifications of our Chief Executive Officer and Chief Financial Officer required by Rule 13a – 14 of the Exchange Act included in this Annual Report as Exhibits 31.1 and 31.2.
Management’s Report on Internal Control Over Financial Reporting
This Annual Report does not include a report of management’s assessment regarding internal control over financial reporting or an attestation report of our independent registered public accounting firm due to a transition period established by rules of the SEC for newly public companies.
Evaluation of Disclosure Controls and Procedures
Disclosure controls and procedures (as defined in Rules 13a-15(e) and 15d-15(e) of the Exchange Act) are designed to ensure that information required to be disclosed by us in reports filed or submitted under the Exchange Act is recorded, processed, summarized and reported within the time periods specified in SEC rules and forms and that such information is accumulated and communicated to management including its principal executive officer and principal financial officer to allow timely decisions regarding required disclosures.
In connection with the preparation of this Annual Report, our management, under the supervision and with the participation of our principal executive officer and our principal financial officer, evaluated the effectiveness of our disclosure controls and procedures as of September 30, 2020. Our principal executive officer and our principal financial officer concluded that, as of September 30, 2020, our disclosure controls and procedures were not effective because of the material weaknesses in internal control over financial reporting described below.
Executive Summary – Material Weaknesses in Internal Control over Financial Reporting
As of September 30, 2020, two material weaknesses existed in our internal control over financial reporting. Those material weaknesses were the following: (i) we did not design or maintain an effective control environment commensurate with our financial reporting requirements and (ii) we did not design and maintain
88
Table of Contents
effective controls over certain information technology, or IT, general controls for information systems and applications that are relevant to the preparation of the financial statements, specifically relating to user access controls. We are currently in the process of implementing measures and taking steps to address the underlying causes of these material weaknesses. Our efforts to date have included the following:
| • | Hiring finance and accounting personnel with prior work experience in finance and accounting departments of public companies and with technical accounting, financial controls and SEC reporting experience, including the hiring of our Chief Financial Officer in January 2019 and our Chief Accounting Officer in April 2019, and reorganizing our finance department. |
| • | Designing and implementing certain IT general controls that address risks associated with user access and security, focused training for control owners to help sustain effective control operations, and include comprehensive remediation efforts relating to segregation of duties to strengthen user access controls and security. |
These material weaknesses will not be remediated until our remediation plan has been fully implemented and we have concluded that our controls are operating effectively for a sufficient period of time, which includes additional testing of operating effectiveness.
Additional material weaknesses were previously disclosed in our Registration Statement on Form S-1 as filed with the SEC on February 7, 2020, and the following elements have been remediated: (i) we did not design and maintain adequate formal accounting policies, procedures and controls, or maintain documentary evidence of existing control activities and (ii) we did not design and maintain effective controls over certain IT general controls for information systems and applications that are relevant to the preparation of the financial statements, specifically relating to certain program change management controls, computer operations controls and testing and approval controls for program development.
Please see below for more information on our material weaknesses existing as of September 30, 2020 and our remediation plan, as well as the previous material weaknesses that had been remediated as of September 30, 2020.
Material Weaknesses in Internal Control over Financial Reporting
A material weakness is a deficiency, or a combination of deficiencies, in internal control over financial reporting, such that there is a reasonable possibility that a material misstatement of our annual or interim financial statements will not be prevented or detected on a timely basis.
We previously identified and disclosed in our Registration Statement on Form S-1 as filed with the SEC on February 7, 2020 that, as of September 30, 2019, certain material weaknesses existed in our internal control over financial reporting. The following material weaknesses in our internal control over financial reporting exist as of September 30, 2020:
We did not design or maintain an effective control environment commensurate with our financial reporting requirements. Specifically, we lacked a sufficient complement of resources with an appropriate level of accounting knowledge, training and experience to appropriately analyze, record and disclose accounting matters timely and accurately. This material weakness resulted in the revision of our consolidated financial statements as of September 30, 2018 and for the year then ended, and in immaterial audit adjustments to our consolidated financial statements as of September 30, 2020, 2019, 2018 and 2017 and for the years then ended. This material weakness also contributed to the following additional material weakness.
We did not design and maintain effective controls over certain IT general controls for information systems and applications that are relevant to the preparation of the financial statements. Specifically, we did not design and maintain user access controls to ensure appropriate segregation of duties and that adequately restrict user and privileged access to financial applications, programs and data to appropriate company personnel. This material weakness did not result in a misstatement to our financial statements.
89
Table of Contents
Each of the material weaknesses described above involve control deficiencies that could result in a misstatement of one or more account balances or disclosures that would result in a material misstatement to the annual or interim consolidated financial statements that would not be prevented or detected, and, accordingly, we determined that these control deficiencies constitute material weaknesses.
Remediation of Previously Identified Material Weaknesses
Additional material weaknesses were previously disclosed in our Registration Statement on Form S-1 as filed with the SEC on February 7, 2020, and the following elements have been remediated as of September 30, 2020:
| • | We did not design and maintain adequate formal accounting policies, procedures and controls, or maintain documentary evidence of existing control activities. Specifically, we did not design and maintain adequate formal accounting policies, procedures and controls to achieve complete, accurate and timely financial accounting, reporting and disclosures, including adequate controls over the preparation and review of account reconciliations and journal entries. Additionally, we did not maintain adequate documentary evidence of existing control activities, and we did not design and maintain controls over the appropriate classification and presentation of accounts and disclosures in the financial statements. |
| • | We did not design and maintain effective controls over certain information technology, or IT, general controls for information systems and applications that are relevant to the preparation of the financial statements. Specifically, we did not design and maintain: |
| o | Program change management controls to ensure that IT program and data changes affecting financial IT applications and underlying accounting records are identified, tested, authorized and implemented appropriately; |
| o | Computer operations controls to ensure that critical batch jobs are monitored, and data backups are authorized and monitored; and |
| o | Testing and approval controls for program development to ensure that new software development is aligned with business and IT requirements. |
Management, with the oversight of the Audit Committee of the Board of Directors, has taken the following actions to remediate these material weaknesses in our internal control over financial reporting:
| • | We designed and implemented formal accounting policies and procedures, training on standards of documentary evidence, as well as additional controls to ensure the reliability of critical spreadsheets and system-generated reports. Specifically, we have designed and implemented the following as part of our remediation efforts: |
| o | We formalized and issued accounting policies and position papers covering critical accounting areas. |
| o | We risk ranked business process controls for remediation to address higher priority areas first. |
| o | We strengthened controls related to review of account reconciliations, journal entries and balance sheet and income statement fluctuation analysis. |
| o | We enhanced controls related to the consolidation of financial information of all of our operating companies. |
| o | We provided training to strengthen process documentation and evidence of control operation, as well as precision of review controls. |
90
Table of Contents
| • | We designed and implemented certain IT general controls that address risks associated with application change management, IT operations and program development. Specifically, we have designed and implemented the following as part of our remediation efforts: |
| o | We enhanced and implemented processes for managing changes to our financial applications (including controls that require all changes to be formally submitted, approved, tested and migrated to production by authorized users) as well as over program development. |
| o | We enhanced and implemented processes over our computer operations that restrict access to and continually monitor production batch jobs that support our financial reporting applications. |
| o | We enhanced and implemented processes over testing and approval controls for program development to ensure new software development is aligned with business and IT requirements. |
Management’s Plan to Remediate the Material Weaknesses
As it relates to the material weaknesses that exist as of September 30, 2020, we are currently in the process of implementing measures and taking steps to address the underlying causes of the material weaknesses. Our efforts to date have included the following:
| • | We hired finance and accounting personnel with prior work experience in finance and accounting departments of public companies and with technical accounting, financial controls and SEC reporting experience, including the hiring of our Chief Financial Officer in January 2019 and our Chief Accounting Officer in April 2019. We have also reorganized our finance department to place finance personnel in line with our operating functions and to improve internal control over business processes and IT operations. |
| • | Although we have not remediated the material weakness related to the design and maintenance of effective controls to ensure appropriate segregation of duties and that adequately restrict user and privileged access to financial applications, programs and data to appropriate company personnel, we have designed and are currently implementing certain IT general controls that address risks associated with user access and security; focused training for control owners to help sustain effective control operations; and are implementing comprehensive remediation efforts relating to segregation of duties to strengthen user access controls and security. Specifically, we have designed and implemented the following as part of our ongoing remediation: |
| o | We have risk ranked segregation of duties conflicts within our core financial system, remediated the highest priority conflicts and, where necessary, identified and validated mitigating controls. |
| o | We enhanced and implemented user administration processes that manage how we grant, modify, and remove user access to our financial applications. We completed a comprehensive review of privileged user access across our financial applications to confirm that access rights are restricted to authorized users based on business need. |
To complete our remediation plan related to appropriate segregation of duties and adequate restricted user and privileged access, we will perform testing to confirm that such controls are operating effectively.
While we believe these efforts will improve our internal controls and address the underlying causes of the material weaknesses, such material weaknesses will not be remediated until our remediation plan has been fully implemented and we have concluded that our controls are operating effectively for a sufficient period of time. We cannot be certain that the steps we are taking will be sufficient to remediate the control deficiencies that led to our material weaknesses in our internal control over financial reporting or prevent future material weaknesses or control deficiencies from occurring. In addition, we cannot be certain that we have identified all material weaknesses in our internal control over financial reporting, or that in the future we will not have additional material weaknesses in our internal control over financial reporting.
91
Table of Contents
Changes in Internal Control over Financial Reporting
There were no changes in our internal control over financial reporting during the three months ended September 30, 2020 that have materially affected, or are reasonably likely to materially affect, our internal control over financial reporting.
Limitations on Effectiveness of Controls and Procedures
Our management does not expect that our disclosure controls and procedures or our internal control over financial reporting will prevent all errors and all fraud. A control system, no matter how well designed and operated, can provide only reasonable, not absolute, assurance that the objectives of the control system are met. Further, the design of a control system must reflect the fact that there are resource constraints, and the benefits of controls must be considered relative to their costs. Because of the inherent limitations in all control systems, no evaluation of controls can provide absolute assurance that all control issues and instances of fraud, if any, within our company have been detected.
None.
92
Table of Contents
Item 10. Directors, Executive Officers and Corporate Governance.
The information required by this item will be included in our definitive Proxy Statement under the captions “Information About Our Directors, Officers and 5% Stockholders” and “Corporate Governance”, which will be filed with the SEC, pursuant to Regulation 14A, not later than 120 days after the end of the 2020 fiscal year, and is herein incorporated by reference.
Code of Ethics
We have adopted a Code of Ethics for Senior Officers applicable to our Chief Executive Officer and senior financial officers. In addition, we have adopted a Code of Conduct and Ethics for all officers, directors and employees. Our Code of Ethics for Senior Officers and Code of Conduct and Ethics is posted on our website at azekco.com on the Governance Documents page of the Investor Relations section of the website. We intend to disclose future amendments to certain provisions of our Code of Ethics for Senior Officers, or waivers of such provisions applicable to any principal executive officer, principal financial officer, principal accounting officer or other persons performing similar functions on our website.
Item 11. Executive Compensation.
The information required by this item will be included in our definitive Proxy Statement under the caption “Executive Compensation”, which will be filed with the SEC, pursuant to Regulation 14A not later than 120 days after the end of the 2020 fiscal year, and is herein incorporated by reference.
Item 12. Security Ownership of Certain Beneficial Owners and Management and Related Stockholder Matters.
The information required by this item will be included in our definitive Proxy Statement under the captions “Security Ownership of Certain Beneficial Owners and Management” and “Securities Authorized for Issuance under our Equity Compensation Plans”, which will be filed with the SEC, pursuant to Regulation 14A, not later than 120 days after the end of the 2020 fiscal year, and is herein incorporated by reference.
Item 13. Certain Relationships and Related Transactions, and Director Independence.
The information required by this item will be included in our definitive Proxy Statement under the captions “Related-Party Transactions” and “Corporate Governance”, which will be filed with the SEC, pursuant to Regulation 14A, not later than 120 days after the end of the 2020 fiscal year, and is herein incorporated by reference.
Item 14. Principal Accounting Fees and Services.
The information required by this item will be included in our definitive Proxy Statement under the caption “Ratification of Selection of Independent Required Public Accounting Firm”, which will be filed with the SEC, pursuant to Regulation 14A, not later than 120 days after the end of the 2020 fiscal year, and is herein incorporated by reference.
93
Table of Contents
Item 15. Exhibits, Financial Statement Schedules.
| (a) | List the following documents filed as a part of the report: |
| (1) | Financial statements: The financial statements and notes thereto annexed to this report beginning on page F-1. |
| (2) | Financial statement schedules: All schedules are omitted because they are either not applicable or the required information is disclosed in our audited consolidated financial statements or the accompanying notes. |
| (3) | Exhibits: The list of Exhibits filed as part of this Annual Report on Form 10-K is set forth on the Exhibit Index immediately preceding such Exhibits and is incorporated herein by this reference. |
None.
94
Table of Contents
Exhibit Index
95
Table of Contents
| 101.INS XBRL Instance Document* | ||
| 101.SCH XBRL Taxonomy Extension Schema Document* | ||
| 101.CAL XBRL Taxonomy Extension Calculation Linkbase Document* | ||
| 101.DEF XBRL Taxonomy Extension Definition Linkbase Document* | ||
| 101.LAB XBRL Taxonomy Extension Label Linkbase Document* | ||
| 101.PRE XBRL Taxonomy Extension Presentation Linkbase Document* | ||
| * | Filed herewith. |
96
Table of Contents
SIGNATURES
Pursuant to the requirements of Section 13 or 15(d) of the Securities Exchange Act of 1934, as amended, the Registrant has duly caused this Report to be signed on its behalf by the undersigned, thereunto duly authorized.
| The AZEK Company Inc. | ||||||
| Date: December 4, 2020 | By: | /s/ Jesse Singh | ||||
| Jesse Singh | ||||||
| Chief Executive Officer, President and Director | ||||||
| (Principal Executive Officer) | ||||||
Pursuant to the requirements of the Securities Exchange Act of 1934, as amended, this Report has been signed below by the following persons on behalf of the Registrant in the capacities and on the dates indicated.
| Signature |
Title |
Date | ||
| /s/ Jesse Singh |
Chief Executive Officer, President and Director | December 4, 2020 | ||
| Jesse Singh | (Principal Executive Officer) | |||
| /s/ Ralph Nicoletti |
Senior Vice President and Chief Financial Officer | December 4, 2020 | ||
| Ralph Nicoletti | (Principal Financial Officer) | |||
| /s/ Gregory Jorgensen |
Vice President and Chief Accounting Officer | December 4, 2020 | ||
| Gregory Jorgensen | (Principal Accounting Officer) | |||
| /s/ Gary Hendrickson |
Chairman of the Board of Directors | December 4, 2020 | ||
| Gary Hendrickson | ||||
| /s/ Sallie B. Bailey |
Director | December 4, 2020 | ||
| Sallie B. Bailey | ||||
| /s/ Fumbi Chima |
Director | December 4, 2020 | ||
| Fumbi Chima | ||||
| /s/ James B. Hirshorn |
Director | December 4, 2020 | ||
| James B. Hirshorn | ||||
| /s/ Brian Klos |
Director | December 4, 2020 | ||
| Brian Klos | ||||
| /s/ Howard Heckes |
Director | December 4, 2020 | ||
| Howard Heckes | ||||
| /s/ Ashfaq Oadri |
Director | December 4, 2020 | ||
| Ashfaq Qadri | ||||
| /s/ Bennett Rosenthal |
Director | December 4, 2020 | ||
| Bennett Rosenthal | ||||
| /s/ Brian Spaly |
Director | December 4, 2020 | ||
| Brian Spaly | ||||
| /s/ Blake Sumler |
Director | December 4, 2020 | ||
| Blake Sumler | ||||
| /s/ Romeo Leemrijse |
Director | December 4, 2020 | ||
| Romeo Leemrijse | ||||
97
Table of Contents
INDEX TO CONSOLIDATED FINANCIAL STATEMENTS
| F-2 | ||||
| Consolidated Balance Sheets as of September 30, 2020 and 2019 |
F-3 | |||
| F-4 | ||||
| F-5 | ||||
| Consolidated Statements of Cash Flows for the Years Ended September 30, 2020, 2019 and 2018 |
F-6 | |||
| F-7 | ||||
F-1
Table of Contents
Report of Independent Registered Public Accounting Firm
To the Board of Directors and Stockholders of The Azek Company Inc.
Opinion on the Financial Statements
We have audited the accompanying consolidated balance sheets of The Azek Company Inc. and its subsidiaries (the “Company”) as of September 30, 2020 and 2019, and the related consolidated statements of comprehensive income (loss), of stockholders’ equity and of cash flows for each of the three years in the period ended September 30, 2020, including the related notes (collectively referred to as the “consolidated financial statements”). In our opinion, the consolidated financial statements present fairly, in all material respects, the financial position of the Company as of September 30, 2020 and 2019, and the results of its operations and its cash flows for each of the three years in the period ended September 30, 2020 in conformity with accounting principles generally accepted in the United States of America.
Basis for Opinion
These consolidated financial statements are the responsibility of the Company’s management. Our responsibility is to express an opinion on the Company’s consolidated financial statements based on our audits. We are a public accounting firm registered with the Public Company Accounting Oversight Board (United States) (PCAOB) and are required to be independent with respect to the Company in accordance with the U.S. federal securities laws and the applicable rules and regulations of the Securities and Exchange Commission and the PCAOB.
We conducted our audits of these consolidated financial statements in accordance with the standards of the PCAOB. Those standards require that we plan and perform the audit to obtain reasonable assurance about whether the consolidated financial statements are free of material misstatement, whether due to error or fraud.
Our audits included performing procedures to assess the risks of material misstatement of the consolidated financial statements, whether due to error or fraud, and performing procedures that respond to those risks. Such procedures included examining, on a test basis, evidence regarding the amounts and disclosures in the consolidated financial statements. Our audits also included evaluating the accounting principles used and significant estimates made by management, as well as evaluating the overall presentation of the consolidated financial statements. We believe that our audits provide a reasonable basis for our opinion.
/s/ PricewaterhouseCoopers LLP
Chicago, Illinois
December 4, 2020
We have served as the Company or its predecessor’s auditor since 2010
F-2
Table of Contents
The AZEK Company Inc.
(In thousands of U.S. dollars, except for share and per share amounts)
| As of September 30, | ||||||||
| 2020 | 2019 | |||||||
| ASSETS: |
||||||||
| Current assets: |
||||||||
| Cash and cash equivalents |
$ | 215,012 | $ | 105,947 | ||||
| Trade receivables, net of allowances |
70,886 | 52,623 | ||||||
| Inventories |
130,070 | 115,391 | ||||||
| Prepaid expenses |
8,367 | 6,037 | ||||||
| Other current assets |
360 | 10,592 | ||||||
|
|
|
|
|
|||||
| Total current assets |
424,695 | 290,590 | ||||||
|
|
|
|
|
|||||
| Property, plant and equipment, net |
261,774 | 208,694 | ||||||
| Goodwill |
951,390 | 944,298 | ||||||
| Intangible assets, net |
292,374 | 342,418 | ||||||
| Other assets |
1,623 | 2,263 | ||||||
|
|
|
|
|
|||||
| Total assets |
$ | 1,931,856 | $ | 1,788,263 | ||||
|
|
|
|
|
|||||
| LIABILITIES AND STOCKHOLDERS’ EQUITY: |
||||||||
| Current liabilities: |
||||||||
| Accounts payable |
$ | 42,059 | $ | 47,479 | ||||
| Accrued rebates |
30,362 | 22,733 | ||||||
| Accrued interest |
1,103 | 13,578 | ||||||
| Current portion of long-term debt obligations |
— | 8,304 | ||||||
| Accrued expenses and other liabilities |
50,516 | 47,903 | ||||||
|
|
|
|
|
|||||
| Total current liabilities |
124,040 | 139,997 | ||||||
| Deferred income taxes |
21,260 | 34,003 | ||||||
| Finance lease obligations — less current portion |
10,910 | 11,181 | ||||||
| Long-term debt — less current portion |
462,982 | 1,103,313 | ||||||
| Other non-current liabilities |
8,776 | 9,746 | ||||||
|
|
|
|
|
|||||
| Total liabilities |
$ | 627,968 | $ | 1,298,240 | ||||
| Commitments and contingencies (Note 17) |
||||||||
| Stockholders’ equity: |
||||||||
| Preferred stock, $0.001 par value; 1,000,000 shares authorized and no shares issued and outstanding at September 30, 2020 and September 30, 2019, respectively |
— | — | ||||||
| Class A common stock, $0.001 par value; 1,100,000,000 shares authorized, 154,637,240 shares issued and outstanding at September 30, 2020, and 75,093,778 issued and outstanding at September 30, 2019 |
155 | 75 | ||||||
| Class B common stock, $0.001 par value; 100,000,000 shares authorized, 100 shares issued and outstanding at September 30, 2020, and 33,068,963 issued and outstanding at September 30, 2019 |
— | 33 | ||||||
| Additional paid-in capital |
1,587,208 | 652,493 | ||||||
| Accumulated deficit |
(283,475 | ) | (162,578 | ) | ||||
|
|
|
|
|
|||||
| Total stockholders’ equity |
1,303,888 | 490,023 | ||||||
|
|
|
|
|
|||||
| Total liabilities and stockholders’ equity |
$ | 1,931,856 | $ | 1,788,263 | ||||
|
|
|
|
|
|||||
The accompanying notes are an integral part of these Consolidated Financial Statements.
F-3
Table of Contents
The AZEK Company Inc.
Consolidated Statements of Comprehensive Income (Loss)
(In thousands of U.S. dollars, except for share and per share amounts)
| Years Ended September 30, | ||||||||||||
| 2020 | 2019 | 2018 | ||||||||||
| Net sales |
$ | 899,259 | $ | 794,203 | $ | 681,805 | ||||||
| Cost of sales |
603,209 | 541,006 | 479,769 | |||||||||
|
|
|
|
|
|
|
|||||||
| Gross profit |
296,050 | 253,197 | 202,036 | |||||||||
| Selling, general and administrative expenses |
308,275 | 183,572 | 144,688 | |||||||||
| Other general expenses |
8,616 | 9,076 | 4,182 | |||||||||
| Loss on disposal of plant, property and equipment |
904 | 1,495 | 791 | |||||||||
|
|
|
|
|
|
|
|||||||
| Operating income (loss) |
(21,745 | ) | 59,054 | 52,375 | ||||||||
|
|
|
|
|
|
|
|||||||
| Other expenses: |
||||||||||||
| Interest expense |
71,179 | 83,205 | 68,742 | |||||||||
| Loss on extinguishment of debt |
37,587 | — | — | |||||||||
|
|
|
|
|
|
|
|||||||
| Total other expenses |
108,766 | 83,205 | 68,742 | |||||||||
|
|
|
|
|
|
|
|||||||
| Income (loss) before income taxes |
(130,511 | ) | (24,151 | ) | (16,367 | ) | ||||||
| Income tax expense (benefit) |
(8,278 | ) | (3,955 | ) | (23,112 | ) | ||||||
|
|
|
|
|
|
|
|||||||
| Net income (loss) |
$ | (122,233 | ) | $ | (20,196 | ) | $ | 6,745 | ||||
|
|
|
|
|
|
|
|||||||
| Net income (loss) per common share: |
||||||||||||
| Basic and Diluted |
$ | (1.01 | ) | $ | (0.19 | ) | $ | 0.06 | ||||
|
|
|
|
|
|
|
|||||||
| Comprehensive income (loss) |
$ | (122,233 | ) | $ | (20,196 | ) | $ | 6,745 | ||||
|
|
|
|
|
|
|
|||||||
| Weighted average shares used in calculating net income (loss) per common share: |
||||||||||||
| Basic and Diluted |
120,775,717 | 108,162,741 | 108,162,741 | |||||||||
|
|
|
|
|
|
|
|||||||
The accompanying notes are an integral part of these Consolidated Financial Statements.
F-4
Table of Contents
The AZEK Company Inc.
Consolidated Statements of Stockholders’ Equity
(In thousands of U.S. dollars, except for share amounts)
| Common Stock | ||||||||||||||||||||||||||||
| Class A | Class B | |||||||||||||||||||||||||||
| Shares | Amount | Shares | Amount | Additional Paid-In Capital |
Accumulated Deficit |
Total Stockholders’ Equity |
||||||||||||||||||||||
| Balance — September 30, 2017 |
75,093,778 | $ | 75 | 33,068,963 | $ | 33 | $ | 605,586 | $ | (149,321 | ) | $ | 456,373 | |||||||||||||||
| Net income (loss) |
— | — | — | — | — | 6,745 | 6,745 | |||||||||||||||||||||
| Member contributions prior to initial public offering |
— | — | — | — | 40,000 | — | 40,000 | |||||||||||||||||||||
| Non-cash contributions prior to initial public offering |
— | — | — | — | 2,475 | — | 2,475 | |||||||||||||||||||||
| Member redemptions prior to initial public offering |
— | — | — | — | (2,694 | ) | — | (2,694 | ) | |||||||||||||||||||
| Stock-based compensation |
— | — | — | — | 2,654 | — | 2,654 | |||||||||||||||||||||
|
|
|
|
|
|
|
|
|
|
|
|
|
|
|
|||||||||||||||
| Balance — September 30, 2018 |
75,093,778 | $ | 75 | 33,068,963 | $ | 33 | $ | 648,021 | $ | (142,576 | ) | $ | 505,553 | |||||||||||||||
|
|
|
|
|
|
|
|
|
|
|
|
|
|
|
|||||||||||||||
| Adoption of ASU 2014-09 |
— | — | — | — | — | 194 | 194 | |||||||||||||||||||||
| Net income (loss) |
— | — | — | — | — | (20,196 | ) | (20,196 | ) | |||||||||||||||||||
| Member contributions prior to initial public offering |
— | — | — | — | 1,311 | — | 1,311 | |||||||||||||||||||||
| Member redemptions prior to initial public offering |
— | — | — | — | (101 | ) | — | (101 | ) | |||||||||||||||||||
| Stock-based compensation |
— | — | — | — | 3,262 | — | 3,262 | |||||||||||||||||||||
|
|
|
|
|
|
|
|
|
|
|
|
|
|
|
|||||||||||||||
| Balance — September 30, 2019 |
75,093,778 | $ | 75 | 33,068,963 | $ | 33 | $ | 652,493 | $ | (162,578 | ) | $ | 490,023 | |||||||||||||||
|
|
|
|
|
|
|
|
|
|
|
|
|
|
|
|||||||||||||||
| Adoption of ASU 2016-16 |
— | — | — | — | — | 1,336 | 1,336 | |||||||||||||||||||||
| Net income (loss) |
— | — | — | — | — | (122,233 | ) | (122,233 | ) | |||||||||||||||||||
| Member contributions prior to initial public offering |
— | — | — | — | 1,500 | — | 1,500 | |||||||||||||||||||||
| Member redemptions prior to initial public offering |
— | — | — | — | (3,553 | ) | — | (3,553 | ) | |||||||||||||||||||
| Conversion of profits interests into common shares |
8,235,299 | 9 | — | — | (9 | ) | — | — | ||||||||||||||||||||
| Net proceeds from initial public offering |
38,237,500 | 38 | — | — | 819,652 | — | 819,690 | |||||||||||||||||||||
| Conversion of Class B common stock into Class A common stock |
33,068,863 | 33 | (33,068,863 | ) | (33 | ) | — | — | — | |||||||||||||||||||
| Exercise of vested stock options |
1,800 | — | — | — | 41 | — | 41 | |||||||||||||||||||||
| Stock-based compensation |
— | — | — | — | 117,084 | — | 117,084 | |||||||||||||||||||||
|
|
|
|
|
|
|
|
|
|
|
|
|
|
|
|||||||||||||||
| Balance — September 30, 2020 |
154,637,240 | $ | 155 | 100 | $ | — | $ | 1,587,208 | $ | (283,475 | ) | $ | 1,303,888 | |||||||||||||||
|
|
|
|
|
|
|
|
|
|
|
|
|
|
|
|||||||||||||||
The accompanying notes are an integral part of these Consolidated Financial Statements.
F-5
Table of Contents
The AZEK Company Inc.
Consolidated Statements of Cash Flows
(In thousands of U.S. dollars)
| Years Ended September 30, | ||||||||||||
| 2020 | 2019 | 2018 | ||||||||||
| Operating activities: |
||||||||||||
| Net income (loss) |
$ | (122,233 | ) | $ | (20,196 | ) | $ | 6,745 | ||||
| Adjustments to reconcile net income (loss) to net cash flows provided by (used in) operating activities: |
||||||||||||
| Depreciation expense |
44,637 | 33,703 | 26,293 | |||||||||
| Amortization expense |
55,144 | 60,226 | 51,372 | |||||||||
| Non-cash interest expense |
6,994 | 3,986 | 3,339 | |||||||||
| Deferred income tax benefit |
(10,110 | ) | (5,321 | ) | (24,125 | ) | ||||||
| Non-cash compensation expense |
117,084 | 4,564 | 3,542 | |||||||||
| Fair value adjustment for contingent consideration |
— | 53 | (1,810 | ) | ||||||||
| Loss on disposition of property, plant and equipment |
904 | 1,495 | 791 | |||||||||
| Bad debt provision |
512 | 383 | 176 | |||||||||
| Loss on extinguishment of debt |
37,587 | — | — | |||||||||
| Changes in operating assets and liabilities: |
||||||||||||
| Trade receivables |
(17,656 | ) | (9,015 | ) | 2,211 | |||||||
| Inventories |
(12,146 | ) | (4,492 | ) | 953 | |||||||
| Prepaid expenses and other current assets |
1,035 | (4,550 | ) | 3,460 | ||||||||
| Accounts payable |
(4,361 | ) | 11,679 | 4,398 | ||||||||
| Accrued expenses and interest |
2,664 | 20,376 | (12,839 | ) | ||||||||
| Other assets and liabilities |
(1,694 | ) | 1,981 | 2,796 | ||||||||
|
|
|
|
|
|
|
|||||||
| Net cash provided by (used in) operating activities |
98,361 | 94,872 | 67,302 | |||||||||
|
|
|
|
|
|
|
|||||||
| Investing activities: |
||||||||||||
| Purchases of property, plant and equipment |
(95,594 | ) | (63,006 | ) | (42,758 | ) | ||||||
| Proceeds from sale of property, plant and equipment |
253 | 71 | 60 | |||||||||
| Acquisitions, net of cash acquired |
(18,453 | ) | — | (292,984 | ) | |||||||
|
|
|
|
|
|
|
|||||||
| Net cash provided by (used in) investing activities |
(113,794 | ) | (62,935 | ) | (335,682 | ) | ||||||
|
|
|
|
|
|
|
|||||||
| Financing activities: |
||||||||||||
| Proceeds from initial public offering, net of related costs |
820,467 | — | — | |||||||||
| Proceeds from 2025 Senior Notes |
346,500 | — | — | |||||||||
| Redemption of 2021 and 2025 Senior Notes |
(665,000 | ) | — | — | ||||||||
| Payments of debt extinguishment costs related to 2021 and 2025 Senior Notes |
(24,938 | ) | — | — | ||||||||
| Proceeds under Revolving Credit Facility |
129,000 | 40,000 | 30,000 | |||||||||
| Payments under Revolving Credit Facility |
(129,000 | ) | (40,000 | ) | (30,000 | ) | ||||||
| Proceeds from long-term debt |
— | — | 224,438 | |||||||||
| Payments on long-term debt obligations |
(341,958 | ) | (8,304 | ) | (7,167 | ) | ||||||
| Payments of financing fees related to Term Loan Agreement |
— | — | (5,179 | ) | ||||||||
| Payments of debt issuance costs related to 2025 Senior Notes |
(7,754 | ) | — | — | ||||||||
| Proceeds (repayments) of finance lease obligations |
(807 | ) | 1,405 | (656 | ) | |||||||
| Payments of Ultralox contingent consideration |
— | (2,000 | ) | — | ||||||||
| Payments of initial public offering related costs |
— | (584 | ) | — | ||||||||
| Redemption of capital contributions prior to initial public offering |
(3,553 | ) | (101 | ) | (2,694 | ) | ||||||
| Capital contributions prior to initial public offering |
1,500 | 1,311 | 40,000 | |||||||||
| Exercise of vested stock options |
41 | — | — | |||||||||
|
|
|
|
|
|
|
|||||||
| Net cash provided by (used in) financing activities |
124,498 | (8,273 | ) | 248,742 | ||||||||
|
|
|
|
|
|
|
|||||||
| Net increase (decrease) in cash and cash equivalents |
109,065 | 23,664 | (19,638 | ) | ||||||||
| Cash and cash equivalents at beginning of period |
105,947 | 82,283 | 101,921 | |||||||||
|
|
|
|
|
|
|
|||||||
| Cash and cash equivalents at end of period |
$ | 215,012 | $ | 105,947 | $ | 82,283 | ||||||
|
|
|
|
|
|
|
|||||||
| Supplemental cash flow disclosure: |
||||||||||||
| Cash paid for interest, net of amounts capitalized |
$ | 76,670 | $ | 78,807 | $ | 65,050 | ||||||
| Cash paid for income taxes, net |
1,376 | 1,252 | 622 | |||||||||
| Supplemental non-cash investing and financing disclosure: |
||||||||||||
| Capital expenditures in accounts payable at end of period |
$ | 2,089 | $ | 3,674 | $ | 4,983 | ||||||
| Property, plant and equipment acquired under finance lease obligations |
966 | 1,637 | 7,045 | |||||||||
| Non-cash equity contribution |
— | — | 2,475 | |||||||||
The accompanying notes are an integral part of these Consolidated Financial Statements.
F-6
Table of Contents
The AZEK Company Inc.
Notes to Consolidated Financial Statements
(In thousands of U.S. dollars, unless otherwise specified)
1. ORGANIZATION AND SUMMARY OF SIGNIFICANT ACCOUNTING POLICIES
a. Organization
The AZEK Company Inc. (the “Company”) is a Delaware corporation that holds all of the limited liability company interests in CPG International LLC, the entity which directly and indirectly holds all of the equity interests in the operating subsidiaries. The Company is a leading manufacturer of premium, low-maintenance building products for residential, commercial and industrial markets. The Company’s products include trim, decking, porch, moulding, railing, pavers, bathroom and locker systems, as well as extruded plastic sheet products and other non-fabricated products for special applications in industrial markets. The Company operates in various locations throughout the United States. AZEK is a brand name for residential products while the commercial products are branded under the brand names Celtec, Playboard, Seaboard, Flametec, Designboard, Cortec, Sanatec, Scranton Products, Aria Partitions, Eclipse Partitions, Hiny Hiders, Tufftec Lockers and Duralife Lockers.
Initial Public Offering
On June 16, 2020, the Company completed its initial public offering (the “IPO”) of its Class A common stock, in which it sold 38,237,500 shares, including 4,987,500 shares pursuant to the underwriters’ over-allotment option. The shares began trading on the New York Stock Exchange on June 12, 2020 under the symbol “AZEK”. The shares were sold at an IPO price of $23.00 per share for net proceeds to the Company of approximately $819.7 million, after deducting underwriting discounts and commissions of $50.6 million and offering expenses of approximately $9.2 million payable by the Company. In addition, the Company used its net proceeds to redeem $350.0 million in aggregate principal of its then-outstanding 2025 Senior Notes, $70.0 million of its then-outstanding principal amount under the Revolving Credit Facility and effected a $337.7 million prepayment of its then-outstanding principal amount under the Term Loan Agreement. Refer to Note 8 for additional information.
In conjunction with the Company’s conversion from a limited liability company into a corporation (the “Corporate Conversion”) prior to the closing of the IPO, the Company effected a unit split of its then-outstanding limited liability company unit and then converted the units on a one-to-one basis into shares of capital stock of the Company, including shares of Class A common stock and Class B common stock. In connection with the closing of the IPO, the Company issued additional shares of its Class A common stock, options to purchase shares of Class A common stock and certain other equity awards to its indirect equity holders prior to the IPO and certain of its officers and employees. All share and per share information presented in the Consolidated Financial Statements has been retroactively adjusted for all periods presented for the effects of the unit split converted to stock. Refer to Note 12 and 13 for additional information.
Secondary Offering
On September 15, 2020, the Company completed an offering of 28,750,000 shares of Class A common stock, par value $0.001 per share, including the exercise in full by the underwriters of their option to purchase up to 3,750,000 additional shares of Class A common stock, at a public offering price of $33.25 per share. The shares were sold by certain stockholders of the Company (the “Selling Stockholders”). The Company did not receive any of the proceeds from the sale of the shares by the Selling Stockholders. The estimated offering expenses of approximately $1.4 million is payable by the Company and recorded in “Other general expenses” within the Consolidated Statements of Comprehensive Income (Loss). Immediately subsequent to the closing of the secondary offering, Class B common stockholders converted 33,068,863 shares of Class B common stock into Class A common stock. In addition, the secondary offering triggered a change in performance criteria, in which certain performance-vested restricted stock awards and stock options vested as a result of the secondary offering. Refer to Note 12 and 13 for additional information.
F-7
Table of Contents
b. Summary of Significant Accounting Policies
Basis of Presentation
The Company operates on a fiscal year ending September 30. The accompanying Consolidated Financial Statements and notes have been prepared in accordance with accounting principles generally accepted in the United States of America (“U.S. GAAP”). The Consolidated Financial Statements include the assets, liabilities and results of operations of the Company and its wholly owned subsidiaries. All material intercompany transactions and balances have been eliminated in consolidation.
Certain reclassifications have been made to prior year financial statements to conform to classifications used in the current year. These reclassifications had no impact on net loss, stockholders’ equity or cash flows as previously reported.
The Company’s financial condition and results of operations are being, and are expected to continue to be affected by the current COVID-19 public health pandemic. The economic effects of the COVID-19 pandemic will likely continue to affect demand for the Company’s products in the foreseeable future. Although management has implemented measures to mitigate any impact of the COVID-19 pandemic on the Company’s business, financial condition and results of operations, these measures may not fully mitigate the impact of the COVID-19 pandemic on the Company’s business, financial condition and results of operations. Management cannot predict the degree to, or the period over, which the Company will be affected by the COVID-19 pandemic and resulting governmental and other measures.
Use of Estimates
The preparation of financial statements in conformity with U.S. GAAP requires management to make estimates and assumptions that affect the reported amounts of assets and liabilities and disclosure of contingent assets and liabilities at the date of the financial statements and reported amounts of revenues and expenses during the reporting period. Significant estimates include revenue recognition, reserves for excess inventory, inventory obsolescence, product warranties, customer rebates, stock-based compensation, litigation, income taxes, contingent consideration, goodwill and intangible asset valuation and accounting for long-lived assets. Management’s estimates and assumptions are evaluated on an ongoing basis and are based on historical experience, current conditions and available information. Actual results may differ from estimated amounts. Estimates are revised as additional information becomes available.
Seasonality
Although the Company generally has demand for its products throughout the year, its sales have historically experienced some seasonality. The Company has typically experienced higher levels of sales of its residential products in the second fiscal quarter of the year as a result of its “early buy” sales, which encourages dealers to stock its residential products. The Company has generally experienced lower levels of sales of residential products in the first fiscal quarter due to adverse weather conditions in certain markets during the winter season. Although its products can be installed year-round, weather conditions can impact the timing of the sales of certain products. In addition, the Company has experienced higher levels of sales of its bathroom partition products and its locker products during the second half of its fiscal year, which includes the summer months when schools are typically closed and therefore are more likely to undergo remodel activities.
Change in Accounting Principle—Revenue Recognition
The Financial Accounting Standards Board (“FASB”) issued Accounting Standard Update (“ASU”) No. 2014-09, Revenue from Contracts with Customers (Topic 606) (referred to herein as “Accounting Standards
F-8
Table of Contents
Codification (“ASC”) 606”, “ASC 606” or “Topic 606”) in May 2014. The standard includes a five-step model for contracts with customers as follows:
| • | Identify the contract with a customer; |
| • | Identify the performance obligations in the contract; |
| • | Determine the transaction price, which is the total consideration provided by the customer; |
| • | Allocate the transaction price among the separate performance obligations within the contract; and |
| • | Recognize revenue when the performance obligations are satisfied. |
On October 1, 2018, the Company early adopted ASC 606, using the modified retrospective method with an adjustment to the opening balance of equity of $0.2 million, due to the cumulative impact of adopting Topic 606. The adoption of ASC 606 did not have a material impact on the Consolidated Financial Statements, and the Company did not restate comparative period amounts. Therefore, the comparative information for fiscal year 2018 continues to be reported under ASC 605, Revenue Recognition.
The Company sells its products to residential and commercial markets. The Company’s Residential segment principally generates revenue from the manufacture and sale of its premium, low-maintenance composite decking, railing, trim, moulding, pavers products and accessories. The Company’s Commercial segment generates revenue from the sale of its partition and locker systems along with plastic sheeting and other non-fabricated products for special applications in industrial markets.
The Company recognizes revenues when control of the promised goods is transferred to the Company’s customers in an amount that reflects the consideration the Company expects to be entitled to in exchange for those goods, at a point in time, when shipping occurs. Each product the Company transfers to the customer is considered one performance obligation. The Company has elected to account for shipping and handling costs as activities to fulfill the promise to transfer the goods. As a result of this accounting policy election, the Company does not consider shipping and handling activities as promised services to its customers. Shipping and handling costs billed to customers are recorded in net sales. The Company records all shipping and handling costs as “Cost of sales”.
Customer contracts are typically fixed price and short-term in nature. The transaction price is based on the product specifications and is determined at the time of order. The Company does not engage in contracts greater than one year, and therefore does not have any incremental costs capitalized as of September 30, 2020 or September 30, 2019. The Company may offer various sales incentive programs throughout the year. It estimates the amount of sales incentive to allocate to each performance obligation, or product shipped, using the most-likely-amount method of estimation, based on sales to the direct customer or sell-through customer. The estimate is updated each reporting period and any changes are allocated to the performance obligations on the same basis as at inception. Changes in estimate allocated to a previously satisfied performance obligation are recognized as part of net revenue in the period in which the change occurs under the cumulative catch-up method. In addition to sales incentive programs, the Company may offer a payment discount, if payments are received within 30 days. The Company estimates the payment discount that it believes will be taken by the customer based on prior history and using the most-likely-amount method of estimation. The Company believes the most-likely-amount method best predicts the amount of consideration to which it will be entitled. The payment discounts are also reflected as part of net revenue. The total amount of incentives were $63.1 million, $50.8 million and $42.4 million for the years ended September 30, 2020, 2019 and 2018, respectively.
The Company records deferred revenue when cash payments are received or due in advance of the Company’s performance.
F-9
Table of Contents
Change in Accounting Principle—Measurement Date for Conducting Annual Goodwill Impairment Test
During fiscal year 2019, the Company changed the annual impairment assessment date as a result of management’s improvements to the budgeting process to August 1st from September 30th. This change was determined to be immaterial to the financial statements.
Earnings Per Share
Basic net income per common share is computed based on the weighted average number of common shares outstanding. Potentially dilutive shares are included in the diluted per-share calculations using the treasury stock method for the periods in fiscal year 2020 when the effect of their inclusion is dilutive. As the Company did not have shares outstanding prior to its IPO in June 2020, the Company did not have dilutive shares during fiscal year 2019. Refer to Note 15 for additional information.
Advertising Costs
Advertising costs primarily relate to trade publication advertisements, cooperative advertising, product brochures and samples. Such costs are expensed as incurred and are included in “Selling, general and administrative expenses” within the Consolidated Statements of Comprehensive Income (Loss). Total advertising expenses were approximately $33.2 million, $41.7 million and $31.7 million for the years ended September 30, 2020, 2019 and 2018, respectively.
Research and Development Costs
Research and development costs primarily relate to new product development, product claims support and manufacturing process improvements. Such costs are expensed as incurred and are included in “Selling, general and administrative expenses” within the Consolidated Statements of Comprehensive Income (Loss). Total research and development expenses were approximately $7.7 million, $8.0 million, and $6.5 million, for the years ended September 30, 2020, 2019 and 2018, respectively.
Cash and Cash Equivalents
The Company considers cash and highly liquid investments with an original maturity of three months or less to be cash and cash equivalents. Cash and cash equivalents are stated at cost, which approximates or equals fair value due to their short-term nature.
Concentrations and Credit Risk
The Company’s financial instruments that are exposed to concentrations of credit risk consist primarily of cash and cash equivalents and trade accounts receivable. As of September 30, 2020, cash and cash equivalents were maintained at major financial institutions in the United States, and current deposits are in excess of insured limits. The Company believes these institutions have sufficient assets and liquidity to conduct their operations in the ordinary course of business with little or no credit risk to the Company. The Company has not experienced any losses in such accounts.
Sales to certain Residential segment distributors accounted for 10% or more of the Company’s total net sales in 2020, 2019 and 2018 were as follows:
| Years Ended September 30, | ||||||||||||
| 2020 | 2019 | 2018 | ||||||||||
| Distributor A |
20.3 | % | 19.8 | % | 21.2 | % | ||||||
|
|
|
|
|
|
|
|||||||
At September 30, 2020, three customers accounted for 10% or more of gross trade receivables; Customer A was 13.1%, Customer B was 12.6% and Customer C was 11.9%. At September 30, 2019, no customers accounted for 10% or more of gross trade receivables.
For each year ended September 30, 2020, 2019 and 2018, approximately 10%, 17% and 14%, respectively, of the Company’s materials purchases were purchased from its largest supplier.
F-10
Table of Contents
Allowance for Doubtful Accounts
The Company routinely assesses the financial strength of its customers and believes that its trade receivables credit risk exposure is limited. An allowance for doubtful accounts is provided for known and anticipated credit losses and disputed amounts, as determined by management in the course of regularly evaluating individual customer receivables. This evaluation takes into consideration a customer’s financial condition and credit history, as well as current economic conditions. Amounts are written-off if and when they are determined to be uncollectible.
Inventories
Inventories (mainly petrochemical resin in raw materials and finished goods), are valued at the lower of cost or net realizable value and are reduced for slow-moving and obsolete inventory. Management assesses the need for, and the amount of, obsolescence write-down based on customer demand of the item, the quantity of the item on hand and the length of time the item has been in inventory. Further, management also considers net realizable value in assessing inventory balances.
Inventory costs include those costs directly attributable to products, including all manufacturing overhead but excluding costs to distribute. The inventories cost is recorded at standard cost, which approximates actual cost, on the first-in first-out basis (“FIFO”).
Vendor Rebates
Certain vendor rebates and incentives are earned by the Company only when specified levels of periodic purchases are achieved. These vendor rebates are recognized based on a systematic and rational allocation of the cash consideration offered in respect of each of the underlying transactions, provided the amounts are probable and reasonably estimable. The Company records the incentives as a reduction in the cost of inventory. The Company records such incentives during interim periods based on actual results achieved on a year-to-date basis and its expectation that purchase levels will be obtained to earn the rebate.
Customer Rebates
The Company offers rebates to customers based on total amounts purchased by each customer during each calendar year. The Company provides for the estimated cost of rebates at the time revenue is recognized based on rebate program rates and anticipated sales to each customer eligible for rebates and other available information. Management reviews and adjusts these estimates, if necessary, based on the differences between actual experience and historical estimates. Refer to Note 2 for additional information.
Product Warranties
The Company provides product assurance warranties of various lengths and terms to certain customers based on standard terms and conditions. The Company provides for the estimated cost of warranties at the time revenue is recognized based on management’s judgment, considering such factors as cost per claim, historical experience, anticipated rates of claims, and other available information. Management reviews and adjusts these estimates, if necessary, based on the differences between actual experience and historical estimates. Refer to Note 9 for additional information.
Property, Plant and Equipment, Net
Property, plant and equipment (“PP&E”) is recorded at cost, net of accumulated depreciation. Major additions and betterments are capitalized while repair and/or maintenance expenses are charged to operations when incurred. Construction in progress is also recorded at cost and includes capitalized interest, if material.
F-11
Table of Contents
Depreciation for financial reporting purposes is computed using the straight-line method over the following estimated useful lives of the assets:
| Land improvements |
10 years | |||
| Building and improvements |
7-40 years | |||
| Manufacturing equipment |
1-15 years | |||
| Office furniture and equipment |
3-12 years | |||
| Vehicles |
5 years | |||
| Computer equipment |
3-7 years |
Leasehold improvements are recorded at cost and depreciated over the standard life of the type of asset or the remaining life of the lease, whichever is shorter. Equipment held under capital leases is stated at the lower of the fair value of the asset or the net present value of the future minimum lease payments at the inception of the lease. For equipment held under capital leases, depreciation is computed using the straight-line method over the shorter of the estimated useful lives of the leased assets or the related lease term and is included within depreciation expense.
PP&E is evaluated for impairment at the asset group level. If a triggering event suggests that a potential impairment has occurred, recoverability of these assets is assessed by evaluating whether or not future estimated undiscounted net cash flows are less than the carrying amount of the assets. If the estimated cash flows are less than the carrying amount, the assets are written down to their fair value through an impairment loss recognized as a non-cash component of “Operating income (loss)” within the Consolidated Statements of Comprehensive Income (Loss). The Company did not record an impairment charge for the years ended September 30, 2020, 2019 or 2018.
During the year ended September 30, 2020, the Company recognized a $0.9 million loss on disposal of fixed assets in the ordinary course of business, $1.0 million loss related to assets in the Residential segment and $0.1 million gain related to assets in the Commercial segment. During the year ended September 30, 2019, the Company recognized a $1.5 million loss on disposal of fixed assets, $1.2 million related to corporate assets and $0.3 million related to assets in the Residential segment. During the year ended September 30, 2018, the Residential segment recognized a $0.8 million loss on disposal of fixed assets in the ordinary course of business. These losses are classified as “Loss on disposal of property, plant and equipment” in a separate caption within the Consolidated Statements of Comprehensive Income (Loss) within “Operating income (loss)”.
Build-to-Suit Leases
The Company establishes assets and liabilities for the fair value of the building and estimated construction costs incurred under lease arrangements when it is considered the owner (for accounting purposes only), or build-to-suit leases, to the extent it is involved in the construction of structural improvements or takes on construction risk. Upon completion of construction of facilities under build-to-suit leases, the Company assesses whether these arrangements qualify for sales recognition under the sale-leaseback accounting guidance, and if so, the leased facility and financing obligation are removed from the balance sheet. If the Company does not qualify for sale-leaseback accounting, then the facility is accounted for as a financing obligation. Refer to Note 17 for additional information.
Deferred Financing Costs, Net
The Company has recorded deferred financing costs incurred in conjunction with its debt obligations. The Company amortizes debt issuance costs over the remaining life of the related debt using the straight-line method for the Revolving Credit Facility and the effective interest method for other debt. Deferred financing costs, net of accumulated amortization, are presented as “Other assets” (non-current) in the Consolidated Balance Sheets, insofar as they relate to the Revolving Credit Facility. Deferred financing costs related to the Term Loan
F-12
Table of Contents
Agreement and the Senior Notes are recorded as a reduction of “Long-term debt – less current portion” in the Consolidated Balance Sheets. Refer to Note 8 for additional information.
Goodwill
The Company accounts for goodwill as the excess of the purchase price over the net amount of identifiable assets acquired and liabilities assumed in a business combination measured at fair value. The Company assigns goodwill to four reporting units based on which reporting unit is expected to benefit from the business combination as of the acquisition date. Goodwill is not subject to amortization; rather, the Company tests goodwill for impairment annually during the fourth fiscal quarter ended September 30 and whenever events occur or changes in circumstances indicate that impairment may have occurred. Impairment testing is performed for each of the reporting units by first assessing qualitative factors to see if further testing of goodwill is required. If the Company concludes that it is more likely than not that a reporting unit’s fair value is less than its carrying amount based on the qualitative assessment, then a quantitative test is required. The Company may also choose to bypass the qualitative assessment and perform the quantitative test.
If the estimated fair value of a reporting unit exceeds the carrying value, the Company considers that goodwill is not impaired. If the carrying value exceeds estimated fair value, there is an impairment of goodwill and an impairment loss is recorded. The Company calculates the impairment loss by comparing the fair value of the reporting unit less the carrying amount, including goodwill. Goodwill impairment would be limited to the carrying value of the goodwill.
In performing the quantitative test, the Company measures the fair value of the reporting units to which goodwill is allocated using an income-based approach, a generally accepted valuation methodology, and relevant data available through and as of August 1, for the years ended September 30, 2020 and 2019, respectively, and through and as of September 30, for the year ended September 30, 2018. Under the income approach, fair value is determined using a discounted cash flow method, projecting future cash flows of each reporting unit, as well as a terminal value, and discounting such cash flows at a rate of return that reflects the relative risk of the cash flows. The key estimates and factors used in this approach include, but are not limited to, revenue growth rates and profit margins based on internal Company forecasts, discount rates, perpetuity growth rates, future capital expenditures, and working capital requirements, among others, and a review of comparable market multiples for the industry segment as well as historical operating trends for the Company.
The Company completed the annual goodwill impairment tests as of August 1, 2020 and 2019, and as of September 30, 2018, using a quantitative assessment approach. As a result of these respective annual assessments, the Company noted that the fair value of each reporting unit was determined to be in excess of the carrying value and as such, there were no impairment charges for the years ended September 30, 2020, 2019 or 2018. Refer to Note 6 for additional information.
Intangible Assets, Net
Amortizable intangible assets include proprietary knowledge, trademarks, customer relationships and other intangible assets. The Company does not have any indefinite lived intangible assets other than goodwill. The intangible assets are being amortized on an accelerated basis using the sum of the years’ digits method over their estimated useful lives, which range from 3 to 20 years, reflecting the pattern in which the economic benefits are consumed or otherwise used up. The Company evaluates whether events or circumstances have occurred that warrant a revision to the remaining useful lives of intangible assets. In cases where a revision is deemed appropriate, the remaining carrying amounts of the intangible assets are amortized over the revised remaining useful lives.
The Company evaluates amortizable intangible assets for potential impairment whenever events or changes in circumstances indicate that the carrying amounts of the assets may not be fully recoverable.
F-13
Table of Contents
If a triggering event suggests that a potential impairment has occurred, recoverability of these assets is assessed by evaluating the probability that future estimated undiscounted net cash flows will be less than the carrying amount of the long-lived assets. If the estimated cash flows are less than the carrying amount of the long-lived assets, the assets are written down to their fair value through an impairment loss recognized as a non-cash component of “Operating income (loss)”. The Company did not record an impairment charge for the years ended September 30, 2020, 2019 or 2018. Refer to Note 6 for additional information.
Stock-Based Compensation
The Company determines the expense for all employee stock-based compensation awards by estimating their fair value and recognizing such value as an expense, on a straight-line, ratable or cliff basis, depending on the award, in the Consolidated Financial Statements over the requisite service period in which employees earn the awards. The Company estimates the fair value of performance-based awards granted to employees using the Monte Carlo pricing model and for service-based awards granted to employees using the Black Scholes pricing model. The fair value of performance-based awards that are expected to vest is recognized as compensation expense on a straight-line basis over the requisite service period. The fair value of service-based awards that are expected to vest is recognized as compensation expense on either (1) straight-line basis, (2) a ratable vesting basis or (3) a cliff vesting basis. The Company accounts for forfeitures as they occur.
To determine the fair value of a stock-based award using the Monte Carlo and Black Scholes models, the Company makes assumptions regarding the risk-free interest rate, expected future volatility, expected dividend yield and performance period. The risk-free rate is based on the U.S. treasury yield curve in effect at the time of grant. The Company estimates the expected volatility of the share price by reviewing the estimated post-IPO volatility levels of its common stock in conjunction with the historical volatility levels of public companies that operate in similar industries or are similar in terms of stage of development or size and then projecting this information toward its future expected volatility. The Company exercises judgment in selecting these companies, as well as in evaluating the available historical and implied volatility for these companies. Dividend yield is determined based on the Company’s future plans to pay dividends. The Company calculates the performance period based on the specific market condition to be achieved and derived from estimates of future performance. The Company calculates the expected term in years for each stock option using a simplified method based on the average of each option’s vesting term and original contractual term. The simplified method is used due to the lack of sufficient historical data available to provide a reasonable basis upon which to estimate the expected term of each stock option. Concurrently with the closing of the IPO, the Company granted to certain of its directors, officers and employees restricted stock awards, restricted stock units and stock options, each of which vest upon the satisfaction of a service condition or a performance condition.
Refer to Note 13 for additional information.
Estimated Fair Value of Financial Instruments
The carrying amounts for the Company’s financial instruments classified as current assets and liabilities, including cash and cash equivalents, trade accounts receivable and accrued expenses and accounts payable, approximate fair value due to their short maturities.
Fair value is estimated by applying the following hierarchy, which prioritizes the inputs used to measure fair value into three levels and bases the categorization within the hierarchy upon the lowest level of input that is available and significant to the fair value measurement:
Level 1—Quoted prices in active markets for identical assets or liabilities.
Level 2—Observable inputs other than quoted prices in active markets for identical assets and liabilities, quoted prices for identical or similar assets or liabilities in inactive markets, or other inputs that are observable or can be corroborated by observable market data for substantially the full term of the assets or liabilities.
F-14
Table of Contents
Level 3—Inputs that are generally unobservable and typically reflect management’s estimate of assumptions that market participants would use in pricing the asset or liability.
Refer to Note 10 for additional information.
Income Taxes
Income taxes are provided on income reported for financial statement purposes, adjusted for permanent differences between financial statement reporting and income tax regulations. A valuation allowance is established whenever management believes that it is more likely than not that deferred tax assets may not be realizable. Deferred tax assets and liabilities are measured using enacted tax rates expected to apply to taxable income in the year in which the deferred tax assets or liabilities are expected to be realized or settled.
The realization of the net deferred tax assets is primarily dependent on estimated future taxable income. A change in the Company’s estimate of future taxable income may require an increase or decrease in the valuation allowance.
A liability for uncertain tax positions is recorded whenever management believes it is not more-likely than-not the position will be sustained on examination based solely on its technical merits. Interest and penalties related to underpayment of income taxes are classified as income tax expense. It is inherently difficult and subjective to estimate such amounts, as the Company has to determine the probability of various possible outcomes. The Company reevaluates these uncertain tax positions on a quarterly basis. This evaluation is based on factors including, but not limited to, changes in facts or circumstances, changes in tax law, effectively settled issues under audit, voluntary settlements and new audit activity. Such a change in recognition or measurement would result in the recognition of a tax benefit or an additional charge to the tax provision.
On December 22, 2017, the President of the United States signed and enacted comprehensive tax legislation into law in the form of H.R. 1, commonly referred to as the Tax Cuts and Jobs Act (the “Tax Act”). Except for certain provisions, the Tax Act is effective for tax years beginning on or after January 1, 2018. As a fiscal year U.S. taxpayer, the majority of the provisions applied to the Company’s fiscal year 2019, such as new limitations on certain business deductions, including the limitation on the Company’s interest expense deduction. For fiscal year 2018 and effective in the three months ended December 31, 2017, the most significant impact included: lowering of the U.S. federal corporate income tax rate and remeasuring the Company’s deferred tax assets and liabilities. The phase in of the lower federal income tax rate resulted in a blended rate of 24.5% for fiscal year 2018, as compared to the previous rate of 35%. The federal income tax rate was reduced to 21% in subsequent fiscal years. Because the Company has net operating loss carry-forwards and was not expected to owe federal tax in its fiscal year 2018 tax return, the remeasurement of deferred taxes recognized for the period was calculated using the future federal tax rate of 21%. During the year ended September 30, 2018, the Company recorded a $22.5 million net income tax benefit for the remeasurement of its deferred tax assets and liabilities. The Company’s effective tax rate was significantly impacted by the recognition of this remeasurement. Refer to Note 16 for further information regarding the impact of this legislation.
Recently Adopted Accounting Pronouncements
Under the Jumpstart Our Business Startups (“JOBS”) Act, the Company qualifies as an emerging growth company (“EGC”) and as such, has elected not to opt out of the extended transition period for complying with new or revised accounting pronouncements. During the extended transition period, the Company is not subject to new or revised accounting standards applicable to public companies. The accounting pronouncements pending adoption below reflect effective dates for the Company as an EGC with the extended transition period.
On October 1, 2017, the Company adopted Accounting Standards Update (“ASU”) ASU No. 2015-11, Inventory—Simplifying the Measurement of Inventory. The update requires that inventory be measured at the lower of cost and net realizable value. Net realizable value is the estimated selling prices in the ordinary course
F-15
Table of Contents
of business, less reasonably predictable costs of completion, disposal, and transportation. The adoption of this amendment did not have a material impact on the Company’s Consolidated Financial Statements.
On October 1, 2017, the Company adopted ASU No. 2016-15, Statement of Cash Flows (Topic 230): Classification of Certain Cash Receipts and Cash Payments. The update clarifies the classification of certain cash receipts and payments in the statement of cash flows. The application of the new guidance required reclassification of certain cash flows within operating activities to investing and financing activities in the consolidated statements of cash flows. The adoption of this standard did not have a material impact on the Company’s Consolidated Financial Statements.
On October 1, 2018, the Company early adopted ASU No. 2014-09, Revenue from Contracts with Customers, which outlines a single comprehensive model for entities to use in accounting for revenue arising from contracts with customers. The update supersedes most current revenue recognition guidance. Under the new standard, entities are required to identify the contract with a customer; identify the separate performance obligations in the contract; determine the transaction price; allocate the transaction price to the separate performance obligations in the contract; and recognize the appropriate amount of revenue when (or as) the entity satisfies each performance obligation. The adoption of this standard did not have a material impact on the Company’s Consolidated Financial Statements. Refer to Note 2 for additional information.
On October 1, 2019, the Company adopted ASU No. 2016-16, Income Taxes (Topic 740): Intra-Entity Transfer of Assets Other Than Inventory. The standard amends several aspects of the tax accounting and recognition timing for intra-company transfers. The Company adopted the standard using a modified retrospective approach, with an adjustment to the beginning retained earnings of approximately $1.3 million, due to the cumulative impact of adopting the standard. The adoption of this standard did not have a material impact on the Company’s Consolidated Financial Statements. Refer to Note 16 for additional information.
Recently Issued Accounting Pronouncements
In February 2016, the Financial Accounting Standards Board (“FASB”) issued ASU No. 2016-02, Leases (Topic 842), and issued subsequent amendments to the initial guidance in September 2017 within ASU No. 2017-13, in January 2018 within ASU No. 2018-01, in July 2018 within ASU Nos. 2018-10 and 2018-11, in December 2018 within ASU No. 2018-20, in March 2019 within ASU No. 2019-01, in November 2019 within ASU No. 2019-10 and in June 2020 within ASU No. 2020-05. This standard requires lessees to present right-of-use assets and lease liabilities on the balance sheet. For public entities, the updated standard is effective for fiscal years beginning after December 15, 2018. This standard is effective for the Company as an EGC for fiscal years beginning after December 15, 2021 and interim periods within fiscal years beginning after December 15, 2022, with early adoption permitted. Assuming the Company remains an EGC, the Company intends to adopt the updated standard during its fiscal year beginning October 1, 2022 and for interim periods within that fiscal year. This standard provides the option to adopt through a cumulative-effect adjustment to the opening balance of retained earnings in the period of adoption, instead of applying the new guidance retrospectively for each prior reporting period presented. The Company is currently evaluating the impact these ASU’s adoption will have on its Consolidated Financial Statements.
In June 2016, the FASB issued ASU No. 2016-13, Financial Instruments—Credit Losses (Topic 326), and issued subsequent amendments to the initial guidance in May 2019 within ASU No. 2019-05 and in November 2019 within ASU Nos. 2019-10 and 2019-11. This standard sets forth an expected credit loss model which requires the measurement of expected credit losses for financial instruments based on historical experience, current conditions and reasonable and supportable forecasts. This replaces the existing incurred loss model and is applicable to the measurement of credit losses on financial assets measured at amortized cost, and certain off-balance sheet credit exposures. For public entities, the updated standard is effective for fiscal years beginning after December 15, 2019, including interim periods within those fiscal years. This standard is effective
F-16
Table of Contents
for the Company as an EGC for fiscal years beginning after December 15, 2022 including interim periods within those fiscal years. Early adoption is permitted, and the standard is adopted using a modified retrospective transition method through a cumulative-effect adjustment to retained earnings as of the beginning of the first reporting period in which the guidance is effective. The Company is currently evaluating the impact the adoption of this standard will have on its Consolidated Financial Statements.
In August 2018, the FASB issued ASU No. 2018-13, Disclosure Framework—Changes to the Disclosure Requirements for Fair Value Measurement, which amends Topic 820, Fair Value Measurement. This standard modifies the disclosure requirements for fair value measurements by removing, modifying, or adding certain disclosures. For all entities, this standard is effective for annual reporting periods beginning after December 15, 2019, and interim periods within those fiscal years. The Company intends to adopt the updated standard during its fiscal year beginning October 1, 2020 and for interim periods within fiscal years beginning in that fiscal year. The removed and modified disclosures will be adopted on a retrospective basis and the new disclosures will be adopted on a prospective basis. The Company is currently evaluating the impact the adoption of this standard will have on its Consolidated Financial Statements.
In August 2018, the FASB issued ASU No. 2018-15, Intangibles—Goodwill and Other—Internal-Use Software (Subtopic 350-40): Customer’s Accounting for Implementation Costs Incurred in a Cloud Computing Arrangement That is a Service Contract. This standard aligns the requirements for capitalizing implementation costs incurred in a hosting arrangement that is a service contract with the requirements for capitalizing implementation costs incurred to develop or obtain internal-use software. For public entities, the updated standard is effective for fiscal years beginning after December 15, 2019, including interim periods within that fiscal year. The amendments in this ASU are effective for the Company, as an EGC, for annual periods beginning after December 15, 2020 and interim periods within annual periods beginning after December 15, 2021. The standard can be adopted either retrospectively or prospectively to all implementation costs incurred after the date of adoption. Early adoption is permitted. Assuming the Company remains an EGC, it intends to adopt the updated standard during its fiscal year beginning October 1, 2021 and for interim periods within fiscal year beginning October 1, 2022. The Company is currently evaluating the impact the adoption of this standard will have on its Consolidated Financial Statements.
In December 2019, the FASB issued ASU No. 2019-12, Income Taxes (Topic 740)—Simplifying the Accounting for Income Taxes. This standard simplifies the accounting for income taxes by removing certain exceptions to general principles in Topic 740 and clarifying and amending existing guidance. For public entities, the amendments in this ASU are effective for fiscal years, and interim periods within those fiscal years, beginning after December 15, 2020. For all other entities, the amendments are effective for fiscal years beginning after December 15, 2021, and interim periods within fiscal years beginning after December 15, 2022. Early adoption of the amendments is permitted, including adoption in any interim period for (1) public business entities for periods for which financial statements have not yet been issued and (2) all other entities for periods for which financial statements have not yet been made available for issuance. An entity that elects to early adopt the amendments in an interim period should reflect any adjustments as of the beginning of the annual period that includes that interim period. Additionally, an entity that elects early adoption must adopt all the amendments in the same period. The amendments are applied on a prospective or retrospective basis, depending upon the amendment adopted within this ASU. The amendments in this ASU are effective for the Company, as an EGC, for annual periods beginning after December 15, 2021 and interim periods within annual periods beginning after December 15, 2022. The Company is currently evaluating the impact this adoption will have on its Consolidated Financial Statements.
In March 2020, the FASB issued ASU No. 2020-04, Reference Rate Reform (Topic 848), Facilitation of the Effects of Reference Rate Reform on Financial Reporting. This standard provides optional expedients and exceptions for applying generally accepted accounting principles to contract modifications and hedging relationships, subject to meeting certain criteria, that reference LIBOR or another reference rate expected to be discontinued. The ASU is effective for all entities as of March 12, 2020, and will apply through December 31, 2022. The Company is currently evaluating the impact this adoption will have on its Consolidated Financial Statements.
F-17
Table of Contents
2. REVENUE
The Company sells its products to residential and commercial markets. The Company’s Residential segment principally generates revenue from the manufacture and sale of its premium, low-maintenance composite decking, railing, trim, moulding, pavers products and accessories. The Company’s Commercial segment generates revenue from the sale of its partition and locker systems along with plastic sheeting and other non-fabricated products for special applications in industrial markets.
The Company recognizes revenues when control of the promised goods is transferred to the Company’s customers in an amount that reflects the consideration the Company expects to be entitled to in exchange for those goods, at a point in time, when shipping occurs. Each product the Company transfers to the customer is considered one performance obligation. The Company has elected to account for shipping and handling costs as activities to fulfill the promise to transfer the goods. As a result of this accounting policy election, the Company does not consider shipping and handling activities as promised services to its customers.
Customer contracts are typically fixed price and short-term in nature. The transaction price is based on the product specifications and is determined at the time of order. The Company may offer various sales incentive programs throughout the year. It estimates the amount of sales incentive to allocate to each performance obligation, or product shipped, using the most-likely-amount method of estimation, based on sales to the direct customer or sell-through customer. The estimate is updated each reporting period and any changes are allocated to the performance obligations on the same basis as at inception. Changes in estimate allocated to a previously satisfied performance obligation are recognized as part of net revenue in the period in which the change occurs under the cumulative catch-up method. In addition to sales incentive programs, the Company may offer a payment discount, if payments are received within thirty days. The Company estimates the payment discount that it believes will be taken by the customer based on prior history and using the most-likely-amount method of estimation. The Company believes the most-likely-amount method best predicts the amount of consideration to which it will be entitled. The payment discounts are also reflected as part of net revenue.
The Company also engages in customer rebates, which are recorded in “Net sales” in the Consolidated Statements of Comprehensive Income (Loss) and in “Accrued rebates” and “Trade receivables” in the Consolidated Balance Sheets. The Company recorded accrued rebates of $30.4 million, $22.7 million and $19.7 million as of September 30, 2020, 2019 and 2018, respectively, and contra trade receivables of $2.3 million, $2.1 million and $2.1 million as of September 30, 2020, 2019 and 2018, respectively. The rebate activity was as follows (in thousands).
| As of September 30, | ||||||||||||
| 2020 | 2019 | 2018 | ||||||||||
| Beginning balance |
$ | 24,858 | $ | 21,914 | $ | 16,922 | ||||||
| Rebate expense |
54,083 | 50,847 | 42,400 | |||||||||
| Rebate payments |
(46,262 | ) | (47,903 | ) | (38,893 | ) | ||||||
| Acquisitions |
— | — | 1,485 | |||||||||
|
|
|
|
|
|
|
|||||||
| Ending balance |
$ | 32,679 | $ | 24,858 | $ | 21,914 | ||||||
|
|
|
|
|
|
|
|||||||
The Company records deferred revenue when cash payments are received or due in advance of the Company’s performance.
3. BUSINESS COMBINATIONS
On January 31, 2020, the Company acquired certain assets and assumed certain liabilities of Return Polymers, Inc. for a total purchase price of approximately $18.5 million, subject to customary post-closing working capital adjustments. Return Polymers is located in Ashland Ohio and is a provider of full-service recycled PVC material processing, sourcing, logistical support and scrap management programs. The Company financed the acquisition with cash on hand.
F-18
Table of Contents
The acquisition was accounted for as a business combination under Accounting Standards Codification (“ASC”) ASC 805 Business Combinations. Tangible and identifiable intangible assets acquired and liabilities assumed were recorded at their respective fair values. The excess of the consideration transferred over the fair value of the net assets received has been recorded as goodwill in the Residential segment. The factors that contributed to the recognition of goodwill primarily relate to future economic benefits arising from expected sales as well as consuming the recycled PVC materials in current products.
The following table represents the preliminary allocation of assets acquired and liabilities assumed on the acquisition date and certain measurement period adjustments attributable to customary working capital adjustments as of September 30, 2020 (in thousands):
|
|
||||
| Total purchase consideration |
$ | 18,453 | ||
|
|
|
|||
| Allocation of consideration to assets acquired and liabilities assumed: |
||||
| Cash and cash equivalents |
$ | — | ||
| Accounts receivable |
1,119 | |||
| Inventories |
2,532 | |||
| Prepaid expenses and other current assets |
39 | |||
| Property, plant and equipment |
4,080 | |||
| Intangible assets |
5,100 | |||
| Goodwill |
7,092 | |||
| Accounts payable |
(947 | ) | ||
| Accrued expenses and other liabilities |
(562 | ) | ||
|
|
|
|||
| Net assets acquired |
$ | 18,453 | ||
|
|
|
|||
At the acquisition date, total intangible assets and goodwill amounted to $11.6 million, comprised of $4.6 million related to customer relationships, and $0.7 million related to trademarks, as well as $6.3 million in goodwill. During the year ended September 30, 2020, the Company recognized $0.6 million in working capital adjustments and $0.2 million reduction in customer relationships, resulting in an increase in goodwill of $0.8 million, and $7.1 million in total goodwill as of September 30, 2020. It is expected that $7.1 million of the goodwill is deductible for tax purposes. The estimated useful life for customer relationships is 15 years and trademarks is 10 years. The weighted average useful life at the date of acquisition was 14.3 years.
4. INVENTORIES
Inventories are valued at the lower of cost or net realizable value, and are reduced for slow-moving and obsolete inventory. The inventories cost is recorded at standard cost, which approximates actual cost, on a first-in first-out (“FIFO”) basis. Inventories consisted of the following (in thousands):
| As of September 30, | ||||||||
| 2020 | 2019 | |||||||
| Raw materials |
$ | 33,850 | $ | 36,855 | ||||
| Work in process |
19,935 | 19,514 | ||||||
| Finished goods |
76,285 | 59,022 | ||||||
|
|
|
|
|
|||||
| Total inventories |
$ | 130,070 | $ | 115,391 | ||||
|
|
|
|
|
|||||
During the year ended September 30, 2018, the Company developed additional capabilities relating to the potential utilization or sale of off specification finished goods inventory and re-assessed the formulation of manufactured goods and the re-introduction rates of off specification finished goods, once reground into a usable production input. Based on these new manufacturing capabilities and decisions related to the formulations of the
F-19
Table of Contents
Company’s finished goods, the Company performed a review of its off specification finished goods inventory to determine the ability to sell the material based on market interest at the SKU level and volume of the associated SKU. Based on the review, it was determined that a portion of the off specification finished goods material was not salable or usable internally based on its color, dimension, density and/or magnitude of the off specification volume. The items determined not to be salable or usable were written off to zero value. The remaining SKU’s that were determined to be salable or usable internally were revalued down to net realizable value consistent with external market values. The net impact related to the revaluation of certain off specification finished goods inventory that required regrinding was $11.8 million, which was recorded within “Cost of sales” for the year ended September 30, 2018.
5. PROPERTY, PLANT AND EQUIPMENT — NET
Property, plant and equipment — net consisted of the following (in thousands):
| As of September 30, | ||||||||
| 2020 | 2019 | |||||||
| Land and improvements |
$ | 2,758 | $ | 2,758 | ||||
| Buildings and improvements |
71,059 | 67,770 | ||||||
| Capital lease – building |
2,021 | 2,021 | ||||||
| Capital lease – manufacturing equipment |
1,026 | 1,026 | ||||||
| Capital lease – vehicles |
3,782 | 3,835 | ||||||
| Manufacturing equipment |
306,036 | 254,570 | ||||||
| Computer equipment |
24,927 | 22,733 | ||||||
| Furnitures and fixtures |
5,689 | 5,409 | ||||||
| Vehicles |
465 | 339 | ||||||
|
|
|
|
|
|||||
| Total property, plant and equipment |
417,763 | 360,461 | ||||||
| Construction in progress |
54,412 | 16,453 | ||||||
|
|
|
|
|
|||||
| 472,175 | 376,914 | |||||||
| Accumulated depreciation |
(210,401 | ) | (168,220 | ) | ||||
|
|
|
|
|
|||||
| Total property, plant and equipment – net |
$ | 261,774 | $ | 208,694 | ||||
|
|
|
|
|
|||||
The Company is considered the owner, for accounting purposes only, of leased office space, as it had taken on certain risks of construction build cost overages above normal tenant improvement allowances. Accordingly, the estimated fair value of the leased property was $9.2 million as of both September 30, 2020 and September 30, 2019. The corresponding lease financing obligation was $7.9 million as of both September 30, 2020 and September 30, 2019. The lease financing obligation was recorded in “Finance lease obligations—less current portion” in the Consolidated Balance Sheets. Refer to Note 17 for additional information.
Depreciation expense was approximately $44.6 million, $33.7 million and $26.3 million in the years ended September 30, 2020, 2019 and 2018, respectively. During the years ended September 30, 2020 and 2019, $1.3 million and $0.9 million of interest was capitalized, respectively. Accumulated amortization for assets under capital leases was $4.0 million and $3.7 million as of September 30, 2020 and 2019, respectively. Accumulated amortization for the assets under the build-to-suit lease was $0.5 million as of September 30, 2020 and $0.3 million as of September 30, 2019.
F-20
Table of Contents
6. GOODWILL AND INTANGIBLE ASSETS — NET
Goodwill
Goodwill consisted of the following (in thousands):
| Residential | Commercial | Total | ||||||||||
| Goodwill as of September 30, 2019 |
$ | 903,909 | $ | 40,389 | $ | 944,298 | ||||||
| Acquisitions (1) |
7,092 | — | 7,092 | |||||||||
|
|
|
|
|
|
|
|||||||
| Goodwill as of September 30, 2020 |
$ | 911,001 | $ | 40,389 | $ | 951,390 | ||||||
|
|
|
|
|
|
|
|||||||
| Accumulated impairment losses as of September 30, 2019 |
$ | — | $ | 32,200 | $ | 32,200 | ||||||
|
|
|
|
|
|
|
|||||||
| Accumulated impairment losses as of September 30, 2020 |
$ | — | $ | 32,200 | $ | 32,200 | ||||||
|
|
|
|
|
|
|
|||||||
| (1) | Acquisition of Return Polymers, Inc., refer to Note 3. |
Intangible assets, net
The Company does not have any indefinite lived intangible assets other than goodwill as of September 30, 2020 and 2019. Finite-lived intangible assets consisted of the following (in thousands):
| As of September 30, 2020 | ||||||||||||||||
| Lives in Years |
Gross Carrying Value |
Accumulated Amortization |
Net Carrying Value |
|||||||||||||
| Propriety knowledge |
10 — 15 | $ | 289,300 | $ | (195,303 | ) | $ | 93,997 | ||||||||
| Trademarks |
5 — 20 | 223,840 | (124,521 | ) | 99,319 | |||||||||||
| Customer relationships |
15 — 19 | 146,670 | (52,119 | ) | 94,551 | |||||||||||
| Patents |
10 | 7,000 | (3,182 | ) | 3,818 | |||||||||||
| Other intangible assets |
3 — 15 | 4,076 | (3,387 | ) | 689 | |||||||||||
|
|
|
|
|
|
|
|||||||||||
| Total intangible assets |
$ | 670,886 | $ | (378,512 | ) | $ | 292,374 | |||||||||
|
|
|
|
|
|
|
|||||||||||
| As of September 30, 2019 | ||||||||||||||||
| Lives in Years |
Gross Carrying Value |
Accumulated Amortization |
Net Carrying Value |
|||||||||||||
| Propriety knowledge |
10 — 15 | $ | 289,300 | $ | (171,686 | ) | $ | 117,614 | ||||||||
| Trademarks |
5 — 20 | 223,140 | (108,096 | ) | 115,044 | |||||||||||
| Customer relationships |
15 — 19 | 142,270 | (39,084 | ) | 103,186 | |||||||||||
| Patents |
10 | 7,000 | (2,132 | ) | 4,868 | |||||||||||
| Other intangible assets |
3 — 15 | 4,076 | (2,370 | ) | 1,706 | |||||||||||
|
|
|
|
|
|
|
|||||||||||
| Total intangible assets |
$ | 665,786 | $ | (323,368 | ) | $ | 342,418 | |||||||||
|
|
|
|
|
|
|
|||||||||||
Amortization expense was approximately $55.1 million, $60.2 million and $51.4 million for the years September 30, 2020, 2019 and 2018, respectively. As of September 30, 2020, the remaining weighted average amortization period for acquired intangible assets was 12.9 years.
F-21
Table of Contents
Amortization expense relating to these amortizable intangible assets as of September 30, 2020, is expected to be as follows (in thousands):
| 2021 |
$ | 49,802 | ||
| 2022 |
44,347 | |||
| 2023 |
39,219 | |||
| 2024 |
34,227 | |||
| 2025 |
29,281 | |||
| Thereafter |
95,498 | |||
|
|
|
|||
| Total |
$ | 292,374 | ||
|
|
|
7. COMPOSITION OF CERTAIN BALANCE SHEET ACCOUNTS
Allowance for Doubtful Accounts
Allowance for doubtful accounts consisted of the following (in thousands):
| As of September 30, | ||||||||||||
| 2020 | 2019 | 2018 | ||||||||||
| Beginning balance |
$ | 904 | $ | 1,230 | $ | 1,048 | ||||||
| Provision |
512 | 383 | 176 | |||||||||
| Bad debt write-offs |
(119 | ) | (709 | ) | (89 | ) | ||||||
| Acquisitions |
35 | — | 95 | |||||||||
|
|
|
|
|
|
|
|||||||
| Ending balance |
$ | 1,332 | $ | 904 | $ | 1,230 | ||||||
|
|
|
|
|
|
|
|||||||
Accrued Expenses and Other Liabilities
Accrued expenses consisted of the following (in thousands):
| As of September 30, | ||||||||
| 2020 | 2019 | |||||||
| Employee related liabilities |
$ | 26,554 | $ | 17,202 | ||||
| Freight |
5,530 | 4,158 | ||||||
| Professional fees |
4,249 | 14,160 | ||||||
| Marketing |
3,343 | 2,026 | ||||||
| Warranty |
2,921 | 2,543 | ||||||
| Construction in progress |
1,303 | 903 | ||||||
| Capital lease |
969 | 721 | ||||||
| Contingent consideration |
— | 1,303 | ||||||
| Other |
5,647 | 4,887 | ||||||
|
|
|
|
|
|||||
| Total accrued expenses and other current liabilities |
$ | 50,516 | $ | 47,903 | ||||
|
|
|
|
|
|||||
F-22
Table of Contents
8. DEBT
Debt consisted of the following (in thousands):
| As of September 30, | ||||||||
| 2020 | 2019 | |||||||
| Term Loan Agreement due May 5, 2024 — LIBOR + 3.75% (4.75% and 5.93% at September 30, 2020 and 2019, respectively), (includes a discount of $507 and $1,105 at September 30, 2020 and 2019, respectively) |
$ | 467,147 | $ | 808,507 | ||||
| Revolving Credit Facility through March 9, 2022 — LIBOR + 2.00% |
— | — | ||||||
| 2021 Senior Notes due October 1, 2021 — Fixed at 8% |
— | 315,000 | ||||||
|
|
|
|
|
|||||
| Total |
467,147 | 1,123,507 | ||||||
| Less unamortized deferred financing fees |
(4,165 | ) | (11,890 | ) | ||||
| Less current portion |
— | (8,304 | ) | |||||
|
|
|
|
|
|||||
| Long-term debt — less current portion and unamortized financing fees |
$ | 462,982 | $ | 1,103,313 | ||||
|
|
|
|
|
|||||
As of September 30, 2020, the Company scheduled fiscal year debt payment on the Term Loan Agreement as $467.7 million in the year 2024. No other debt payments are due by the Company in any other fiscal year.
Term Loan Agreement
On September 30, 2013, CPG International LLC refinanced its then outstanding long-term debt and entered into (i) a new senior secured revolving credit facility (the “Revolving Credit Facility”) among CPG International LLC (as successor-in-interest to CPG Merger Sub LLC, a limited liability company formed to effect the acquisition of CPG International LLC), Deutsche Bank AG New York Branch (“Deutsche Bank”), as administrative agent and collateral agent (the “Revolver Administrative Agent”), and the lenders party thereto, (ii) a new secured term loan agreement (the “Term Loan Agreement”) among CPG International LLC (as successor-in-interest to CPG Merger Sub LLC), as the initial borrower; the Lenders Party thereto; Deutsche Bank and JPMorgan Chase Bank, N.A., as co-syndication agents; Citibank, N.A., the Royal Bank of Scotland PLC and UBS Securities LLC, as co-documentation agents; and Barclays Bank PLC, as administrative agent and collateral agent, (iii) an indenture (the “Indenture”) in respect of 8.000% senior notes due October 1, 2021 (the “2021 Senior Notes”) between CPG International LLC and Wilmington Trust, National Association, as trustee.
The proceeds from borrowings under the amended Term Loan Agreement and the 2021 Senior Notes were used to (i) fund the acquisition of CPG International LLC and (ii) repay all amounts outstanding under the Company’s prior term loan agreement, prior notes and related fees.
The Term Loan Agreement matures on May 5, 2024, since the 2021 Senior Notes were redeemed June 8, 2020. The Term Loan Agreement provides for interest on outstanding principal thereunder at a fluctuating rate, at CPG International LLC’s option, for (i) alternative base rate (“ABR”) borrowings, the highest of (a) the Federal Funds Rate as of such day plus 50 basis points, (b) the prime commercial lending rate announced as of such day by the Administrative Agent as defined in the Term Loan Agreement, as the “prime rate” as in effect on such day and (c) the LIBOR as of such day for a deposit in U.S. dollars with a maturity of one month plus 100 basis points, provided that in no event shall the ABR be less than 200 basis points, plus the applicable margin of 275 basis points per annum; or (ii) for Eurocurrency borrowings, the adjusted LIBOR of
F-23
Table of Contents
(a) the LIBOR in effect for such interest period divided by one, minus the statutory reserves applicable to such Eurocurrency borrowing, if any, and (b) 100 basis points, plus the applicable margin of 375 basis points per annum.
As of September 30, 2020 and 2019, unamortized deferred financing fees related to the Term Loan Agreement were $4.2 million and $9.1 million, respectively. The Term Loan Agreement may be voluntarily prepaid in whole, or in part, in each case without premium or penalty (other than the Prepayment Premium (as defined in the Term Loan Agreement), if applicable), subject to certain customary conditions. The Company used part of its net proceeds from the IPO to prepay outstanding principal of the Term Loan Agreement in the amount of $337.7 million, paid $4.3 million in accrued interest, and the Company recognized in interest expense an additional $3.2 million amortization of deferred financing fees associated with the prepayment amounts during the year ended September 30, 2020.
The obligations under the Term Loan Agreement are secured by a first priority security interest in the membership interests of CPG International LLC owned by The AZEK Company Inc. and substantially all of the present and future assets of the borrowers and guarantors including equity interests of their domestic subsidiaries, subject to certain exceptions, (the “Term Loan Priority Collateral”) and a second priority lien on current assets. The obligations under the Term Loan Agreement are guaranteed by the Company and the wholly owned domestic subsidiaries of CPG International LLC other than certain immaterial subsidiaries and other excluded subsidiaries.
The Term Loan Agreement requires mandatory prepayments of the term loan thereunder from certain debt issuances, certain asset dispositions (subject to certain reinvestment rights) and a percentage of excess cash flow (subject to step-downs upon CPG International LLC achieving certain leverage ratios). At September 30, 2020, no excess cash flow payment was required based on the current leverage ratio. At September 30, 2019, the estimated prepayment of excess cash flow was $6.4 million. The lenders do have the option to decline any prepayments based on excess cash flows. At the lenders’ option the excess cash flow payment made in January 2020 was $2.2 million with the remaining prepayment declined by the lenders. CPG International LLC is required to repay the outstanding principal amount under the Term Loan Agreement in quarterly installments equal to 0.25253% of the aggregate principal amount under the Term Loan Agreement outstanding on the amendment date of June 18, 2018 and such quarterly payments may be reduced as a result of prepayments. Based on the prepayment of $337.7 million made with the IPO proceeds, CPG International LLC has prepaid all of the quarterly principal payments through maturity. The Term Loan Agreement restricts payments of dividends unless certain conditions are met, as defined in the Term Loan Agreement.
Revolving Credit Facility
On March 9, 2017, CPG International LLC amended, restated and extended the maturity of the Revolving Credit Facility, and on June 5, 2020, CPG International LLC further amended the Revolving Credit Facility (the “Amendment”) to establish $8.5 million of commitments for FILO loans, which are available to be drawn in a single disbursement on or prior to December 31, 2020. The availability of the FILO Loans will be subject to satisfaction of certain conditions at the time of borrowing, including the value of borrowing-base eligible assets at the time of borrowing. Under the terms of the Revolving Credit Facility, as amended, FILO Loans may be borrowed against increased percentages of borrowing-base eligible assets (as compared to the percentages of borrowing-base eligible assets applicable to all other loans under the Revolving Credit Facility). The Amendment did not increase the total aggregate amount of commitments under the Revolving Credit Facility. Borrowing of FILO Loans under the Revolving Credit Facility will reduce the total aggregate commitments available for revolving loans for so long as the FILO Loans remain outstanding. If borrowed, the FILO Loans will mature on December 4, 2021. As of September 30, 2020, the Company has not drawn on the FILO loans.
F-24
Table of Contents
The Revolving Credit Facility matures on March 9, 2022. The Revolving Credit Facility provides for maximum aggregate borrowings of up to $150.0 million, subject to an asset-based borrowing base. The borrowing base is limited to a set percentage of eligible accounts receivable and inventory, less reserves that may be established by the administrative agent and the collateral agent in the exercise of their reasonable credit judgment.
On March 16, 2020, the Company borrowed $89.0 million under the Revolving Credit Facility to enhance financial flexibility in light of uncertainties resulting from the COVID-19 pandemic. The Company used part of its net proceeds from the 2025 Senior Notes issuance to repay $15.0 million of the then-outstanding principal under the Revolving Credit Facility. The Company had no outstanding borrowings under the Revolving Credit Facility as of September 30, 2020 and 2019, respectively. In addition, the Company had $6.8 million and $3.0 million of outstanding letters of credit held against the Revolving Credit Facility as of September 30, 2020 and 2019, respectively. Deferred financing costs, net of accumulated amortization, related to the Revolving Credit Facility at September 30, 2020 and 2019 were $0.8 million and $0.9 million, respectively. CPG International LLC had approximately $129.4 million available under the borrowing base for future borrowings as of September 30, 2020. CPG International LLC also has the option to increase the commitments under the Revolving Credit Facility by up to $100.0 million, subject to certain conditions.
The Revolving Credit Facility provides for an interest rate on outstanding principal thereunder at a fluctuating rate, at CPG International LLC’s option, at (i) for ABR borrowings, the highest of (a) the Federal Funds Rate plus 50 basis points, (b) the prime rate and (c) the LIBOR as of such date for a deposit in U.S. dollars with a maturity of one month plus 100 basis points, plus, in each case, a spread of 50 to 100 basis points, based on average historical availability, or (ii) for Eurocurrency borrowings, adjusted LIBOR plus a spread of 150 to 200 basis points, based on average historical availability. A “commitment fee” accrues on any unused portion of the commitments under the Revolving Credit Facility during the preceding three calendar month period. If the average daily used percentage is greater than 50%, the commitment fee equals 25 basis points, and if the average daily used percentage is less than or equal to 50%, the commitment fee equals 37.5 basis points. The commitment fees were $0.5 million, $0.5 million and $0.6 million for the years ended September 30, 2020, 2019 and 2018, respectively.
The obligations under the Revolving Credit Facility are guaranteed by The AZEK Company Inc. and its wholly owned domestic subsidiaries other than certain immaterial subsidiaries and other excluded subsidiaries. The obligations under the Revolving Credit Facility are secured by a first priority security interest in substantially all of the accounts receivable, inventory, deposit accounts, securities accounts and cash assets of The AZEK Company Inc., CPG International LLC and the subsidiaries of CPG International LLC that are guarantors under the Revolving Credit Facility, and the proceeds thereof (subject to certain exceptions) (the “Revolver Priority Collateral”), plus a second priority security interest in all of the Term Loan Priority Collateral. The Revolving Credit Facility may be voluntarily prepaid in whole, or in part, in each case without premium or penalty. CPG International LLC is also required to make mandatory prepayments (i) when aggregate borrowings exceed commitments or the applicable borrowing base and (ii) during “cash dominion,” which occurs if (a) the availability under the Revolving Credit Facility is less than the greater of (i) $12.5 million and (ii) 10% of the lesser of (x) $150.0 million and (y) the borrowing base, for five consecutive business days or (b) certain events of default have occurred and are continuing.
The Revolving Credit Facility contains affirmative covenants that are customary for financings of this type, including allowing the Revolver Administrative Agent to perform periodic field exams and appraisals to evaluate the borrowing base. The Revolving Credit Facility contains various negative covenants, including limitations on, subject to certain exceptions, the incurrence of indebtedness, the incurrence of liens, dispositions, investments, acquisitions, restricted payments, transactions with affiliates, as well as other negative covenants customary for financings of this type. The Revolving Credit Facility also includes a financial maintenance covenant, applicable only when the excess availability is less than the greater of (i) 10% of the lesser of the aggregate commitments under the Revolving Credit Facility and the borrowing base, and (ii) $12.5 million. In such circumstances, CPG International LLC would be required to maintain a minimum fixed charge coverage ratio (as defined in the Revolving Credit Facility) for the trailing four quarters equal to at least 1.0 to 1.0; subject to CPG International LLC’s ability to make an equity cure (no more than twice in any four quarter period and up to five times over the life of the facility). As of September 30, 2020,
F-25
Table of Contents
CPG International LLC was in compliance with the financial and nonfinancial covenants imposed by the Revolving Credit Facility. The Revolving Credit Facility also includes customary events of default, including the occurrence of a change of control.
2021 Senior Notes
The 2021 Senior Notes were issued on September 30, 2013, in an aggregate principal amount of $315.0 million, and had a maturity of October 1, 2021. The 2021 Senior Notes bore interest at the rate of 8.000% per annum payable in cash semi-annually in arrears on April 1 and October 1 of each year (computed based on a 360-day year of twelve 30-day months). The obligations under the 2021 Senior Notes were guaranteed by CPG International LLC and those of its subsidiaries that also guarantee the Revolving Credit Facility and the Term Loan Agreement. The redemption price of the 2021 Senior Notes (expressed as percentages of the principal amount to be redeemed) declined to the par value of the 2021 Senior Notes, plus accrued and unpaid interest based on the schedule below. The 2021 Senior Notes were redeemable in whole or in part, at any time after October 1, 2016 at the following redemption prices, if redeemed during the 12-month period beginning on October 1 of the years indicated below:
| 2016 |
106.0 | % | ||
| 2017 |
104.0 | % | ||
| 2018 |
102.0 | % | ||
| 2019 and thereafter |
100.0 | % |
The indenture relating to the 2021 Senior Notes contained negative covenants that are customary for financings of this type. The indenture did not contain any financial maintenance covenants. As of September 30, 2020, CPG International LLC was in compliance with the negative covenants imposed by the 2021 Senior Notes and the indenture.
In connection with the 2025 Senior Notes offering, the Company issued a redemption notice on May 7, 2020 for the full $315.0 million of outstanding 2021 Senior Notes, which were redeemed on June 8, 2020. The Company also paid $4.6 million in accrued interest and recognized a $1.9 million loss on the extinguishment in the “Loss on the extinguishment of debt” within the Consolidated Statements of Comprehensive Income (Loss). As of September 30, 2019, the unamortized deferred financing fees related to the 2021 Senior Notes consisted of $2.8 million.
2025 Senior Notes
On May 12, 2020, the Company issued $350.0 million of 9.500% 2025 Senior Notes with a maturity of May 15, 2025, and interest was payable on May 15 and November 15 of each year. The Company had the option to redeem all or a portion of the 2025 Senior Notes at any time on or after May 15, 2022 at certain redemption prices, plus accrued and unpaid interest, if any, to, but excluding, the redemption date. In addition, before May 15, 2022, the Company had the option to (i) redeem up to 40% of the aggregate principal amount of the 2025 Senior Notes with the net cash proceeds of certain equity offerings at a redemption price equal to 107.125% of the principal amount of the 2025 Senior Notes redeemed, (ii) redeem (x) up to 40% of the aggregate principal amount of the 2025 Senior Notes or (y) all of the 2025 Senior Notes with the proceeds from a Qualified IPO at a redemption price equal to 107.125% of the principal amount of the 2025 Senior Notes redeemed or (iii) redeem some or all of the 2025 Senior Notes at a price equal to 100% of the principal amount plus a “make-whole” premium, in the case of each of (i), (ii) and (iii), plus accrued and unpaid interest, if any, to, but excluding, the redemption date. The 2025 Senior Notes were redeemable in whole or in part, at any time after May 15, 2022 at the following redemption prices, plus accrued and unpaid interest, if redeemed during the 12-month period beginning on May 15 of the years indicated below:
| 2022 |
104.750 | % | ||
| 2023 |
102.375 | % | ||
| 2024 and thereafter |
100.000 | % |
F-26
Table of Contents
On June 8, 2020, the Company used the proceeds of the $350.0 million 2025 Senior Notes offering to redeem the 2021 Senior Notes in full and to repay $15.0 million of the outstanding principal amount under the Revolving Credit Facility, and other general corporate purposes. On June 16, 2020, the Company used part of its net proceeds from the IPO to redeem $350.0 million in aggregate principal of the outstanding 2025 Senior Notes, paid $3.9 million in accrued interest and recognized a $35.7 million loss on the extinguishment in the “Loss on extinguishment of debt” within the Consolidated Statements of Comprehensive Income (Loss).
Interest expense consisted of the following (in thousands):
| Years Ended September 30, | ||||||||||||
| 2020 | 2019 | 2018 | ||||||||||
| Interest expense |
||||||||||||
| Term Loan Agreement |
$ | 41,261 | $ | 52,504 | $ | 38,285 | ||||||
| 2021 Senior Notes |
17,150 | 25,200 | 25,200 | |||||||||
| 2025 Senior Notes |
3,879 | — | — | |||||||||
| Revolving Credit Facility |
1,654 | 904 | 682 | |||||||||
| Other |
1,530 | 1,506 | 1,709 | |||||||||
| Amortization |
||||||||||||
| Debt issue costs |
||||||||||||
| Term Loan Agreement |
4,910 | 1,980 | 1,397 | |||||||||
| 2021 Senior Notes |
880 | 1,407 | 1,407 | |||||||||
| 2025 Senior Notes |
180 | — | — | |||||||||
| Revolving Credit Facility |
426 | 358 | 358 | |||||||||
| Original issue discounts |
597 | 241 | 178 | |||||||||
| Less capitalized interest |
(1,288 | ) | (895 | ) | (474 | ) | ||||||
|
|
|
|
|
|
|
|||||||
| Interest expense |
$ | 71,179 | $ | 83,205 | $ | 68,742 | ||||||
|
|
|
|
|
|
|
|||||||
Refer to Note 10 for information pertaining to the fair value of the Company’s debt as of September 30, 2020 and 2019.
9. PRODUCT WARRANTIES
The Company provides product assurance warranties of various lengths ranging from 5 years to lifetime for limited coverage for a variety of material and workmanship defects based on standard terms and conditions between the Company and its customers. Warranty coverage depends on the product involved.
The warranty reserve activity was as follows (in thousands):
| As of September 30, | ||||||||
| 2020 | 2019 | |||||||
| Beginning balance |
$ | 11,133 | $ | 9,304 | ||||
| Adjustments to reserve |
2,710 | 4,503 | ||||||
| Warranty claims payment |
(3,159 | ) | (2,927 | ) | ||||
| Accretion — purchase accounting valuation |
229 | 253 | ||||||
|
|
|
|
|
|||||
| Ending balance |
10,913 | 11,133 | ||||||
| Current portion of accrued warranty |
(2,921 | ) | (2,543 | ) | ||||
|
|
|
|
|
|||||
| Accrued warranty — less current portion |
$ | 7,992 | $ | 8,590 | ||||
|
|
|
|
|
|||||
F-27
Table of Contents
TimberTech Warranties and Related Indemnification
In connection with the acquisition of TimberTech on September 21, 2012 and the acquisition of CPG International LLC on September 30, 2013, the Company recognized the fair value of the related warranty liabilities calculated as the net present value of the expected costs to settle all future warranty claims for products sold prior to the acquisition dates. The Company records accretion expense in “Cost of sales” in the Consolidated Statement of Comprehensive Income (Loss) in order to increase the value of the liability to reflect the future value of the warranty claims when they are actually settled. In addition, the Company records estimated warranty claims obligations related to current sales on an ongoing basis for the TimberTech product line.
Pursuant to the TimberTech purchase agreement, the seller, Crane Group Companies Limited (“Crane”), also agreed to indemnify the Company for claims made up to seven years after the acquisition date for the majority of the costs to settle warranty claims for certain identified problems related to two products which have exhibited a high number of claims related to scorching and fading defects. The products were produced between 2010 and 2011 and have not been sold by the Company since 2011. Similar to its recognition of the warranty liability, the Company recorded an indemnification receivable from Crane on the acquisition date equal to the fair value of the indemnification calculated as the net present value of the expected indemnification payments to be received in the future. At September 30, 2020, $1.8 million was classified as Other Current Assets. As of September 30, 2019, $1.3 million was classified as Other Current Assets and $0.5 million was classified as Other Assets (non-current). Due to a dispute by Crane of its ongoing obligations, the Company has a full reserve recorded against the amount receivable.
The Company will continue to monitor the actual cost to settle warranty claims in the future and will make adjustments to the warranty liability and indemnification receivable if needed. The indemnification period expired on September 21, 2019. Crane disputes the scope of its past indemnification obligations and the Company cannot predict the outcome of the dispute. The Company may need to record additional charges to the Consolidated Statements of Comprehensive Income (Loss) and the Consolidated Balance Sheets related to the reserve and any obligations as a result of the indemnification dispute in future periods.
10. FAIR VALUE OF FINANCIAL INSTRUMENTS
The Company measures and records in its consolidated financial statements certain assets and liabilities at fair value. ASC Topic 820, Fair Value Measurement and Disclosures, establishes a fair value hierarchy for instruments measured at fair value that distinguishes between assumptions based on market data (observable inputs) and the Company’s own assumptions (unobservable inputs). This hierarchy consists of the following three levels:
| • | Level 1—Assets and liabilities whose values are based on unadjusted quoted prices for identical assets or liabilities in an active market. |
| • | Level 2—Assets and liabilities whose values are based on inputs other than those included in Level 1, including quoted market prices in markets that are not active; quoted prices of assets or liabilities with similar attributes in active markets; or valuation models whose inputs are observable or unobservable but corroborated by market data. |
| • | Level 3—Assets and liabilities whose values are based on valuation models or pricing techniques that utilize unobservable inputs that are significant to the overall fair value measurement. Certain assets are measured at fair value on a nonrecurring basis; that is, the instruments are not measured at fair value on an ongoing basis, but are subject to fair value adjustments in certain circumstances (for example, when there is evidence of impairment). |
Financial instruments with a fair value that approximates carrying value—The carrying amounts of cash and cash equivalents, trade receivables and payables, as well as financial instruments included in other current assets and other current liabilities, approximate fair values because of their short-term maturities.
F-28
Table of Contents
Financial instruments with a fair value different from carrying value—The Company has, where appropriate, estimated the fair value of financial instruments for which the amortized cost carrying value may be significantly different than the fair value. As of September 30, 2020 and 2019, these instruments include outstanding debt. As described in Note 8 Debt, the Company records debt at amortized cost. The carrying values and the estimated fair values of the debt financial instruments (Level 2 measurements) consisted of the following (in thousands):
| As of September 30, | ||||||||||||||||
| 2020 | 2019 | |||||||||||||||
| Carrying Value |
Estimated Fair Value |
Carrying Value |
Estimated Fair Value |
|||||||||||||
| Term Loan Agreement due May 5, 2024 |
$ | 467,147 | $ | 465,185 | $ | 808,507 | $ | 804,464 | ||||||||
| 2021 Senior Notes due October 1, 2021 |
— | — | 315,000 | 315,000 | ||||||||||||
The fair values of the debt instruments were determined using trading prices between qualified institutional buyers; therefore, the 2021 Senior Notes are classified as Level 2.
In connection with the acquisition of WES, LLC and Ultralox Technology, LLC (together, “Ultralox”) on December 20, 2017, the Company provided a contingent payment to the employees of Ultralox. The contingent payment was based on achievement of a minimum EBITDA amount and a multiple of EBITDA, for EBITDA exceeding a higher threshold for calendar year 2018. Based on the formula, the potential minimum of the contingent payment was zero and the potential maximum was $30.0 million. During the year ended September 30, 2019, the Company paid the former owners of Ultralox $2.0 million as partial settlement of the original contingent liability. At the acquisition date, the fair value was estimated to be $5.3 million. Of the fair value, $2.8 million is accounted for as contingent consideration in conjunction with the acquisition related to the non-employee owners, and the remaining $2.5 million (which was subsequently adjusted downward to $0.9 million due to changes in the estimated fair value of the contingent payment) was recognized as compensation expense from date of acquisition through June 30, 2018 related to the employee owners, who forfeit their share of the contingent payment if not employed through that date.
The contingent payment made was based on achievement of a minimum EBITDA amount and a multiple of EBITDA, for EBITDA exceeding a higher threshold for calendar 2018. The Company classified the contingent liability as Level 3, due to the lack of observable inputs. Significant assumptions made by the Company included a central estimate of EBITDA and EBITDA volatility of 39%. Changes in assumptions could have an impact on the payout of the contingent consideration payout amount.
During the year ended September 30, 2019, the Company amended the earnout agreement to include two additional payments totaling $3.4 million to the former owners of Ultralox that are contingent upon the employee owners continued employment through December 31, 2018 and 2019. These additional earnout payments were recognized as compensation expense over the required employment periods, because they are contingent upon future service from the date of the amendment. During the year ended September 30, 2020, the Company paid the remaining $1.7 million as settlement of the amended earnout agreement. At September 30, 2020 and 2019, the contingent payment liability was $0.0 million and $1.3 million, respectively, and is recorded in “Accrued expenses and other liabilities” in the Consolidated Balance Sheets.
F-29
Table of Contents
The following table provides a roll-forward of the aggregate fair value of the contingent consideration and compensation expense categorized as Level 3 (in thousands).
| Years Ended September 30, | ||||||||||||
| 2020 | 2019 | 2018 | ||||||||||
| Beginning balance |
$ | 1,303 | $ | 1,900 | $ | — | ||||||
| Issuance of contingent consideration in connection with acquisition |
— | — | 2,822 | |||||||||
| Change in fair value of contingent consideration |
— | 53 | (1,810 | ) | ||||||||
| Less contingent payments |
(1,675 | ) | (3,675 | ) | — | |||||||
| Compensation expense recognized |
372 | 3,025 | 888 | |||||||||
|
|
|
|
|
|
|
|||||||
| Ending balance |
$ | — | $ | 1,303 | $ | 1,900 | ||||||
|
|
|
|
|
|
|
|||||||
For the years ended September 30, 2020, 2019 and 2018, the estimated contingent payment recognized as compensation expense was $0.0 million, $1.3 million and $0.9 million, respectively, and was included in Non-cash compensation expense in the Consolidated Statements of Cash Flows.
11. SEGMENTS
Operating segments for the Company are determined based on information used by the chief operating decision maker (“CODM”) in deciding how to evaluate performance and allocate resources to each of the segments. The CODM reviews Adjusted EBITDA and Adjusted EBITDA Margin as the key segment measures of performance. Adjusted EBITDA is defined as segment operating income (loss) plus depreciation and amortization, adjusted by adding thereto or subtracting therefrom stock-based compensation costs, business transformation costs, acquisition costs, capital structure transaction costs, and certain other costs. Adjusted EBITDA Margin is defined as Adjusted EBITDA divided by net sales.
The Company has two reportable segments, Residential and Commercial. The reportable segments were determined primarily based on products and end markets as follows:
| • | Residential—The Residential segment manufactures and distributes decking, railing, trim and accessories through a national network of dealers and distributors and multiple home improvement retailers providing extensive geographic coverage and enabling the Company to effectively serve contractors. The additions of Ultralox and Versatex are complementary to the Residential segment railing and trim businesses, respectively. The recent addition of Return Polymers provides a full-service recycled PVC material processing, sourcing, logistical support, and scrap management programs. This segment is impacted by trends in and the strength of home repair and remodel activity. |
| • | Commercial—The Commercial segment manufactures, fabricates and distributes resin based extruded sheeting products for a variety of commercial and industrial applications through a widespread distribution network as well as directly to original equipment manufacturers. This segment includes Scranton Products which manufactures lockers and partitions and Vycom which manufactures resin based sheeting products. This segment is impacted by trends in and the strength of the new construction sector. |
The accounting policies of the operating segments are the same as those described in Note 1, “Summary of Significant Accounting Policies”. Intercompany transactions between segments are excluded as they are not included in management’s performance review of the segments. Currently foreign revenue accounts for less than 10% of consolidated revenue. The Company does not disclose assets outside of the United States as they totaled less than 10% of the consolidated assets as of September 30, 2020, 2019 and 2018.
F-30
Table of Contents
The segment data below includes data for Residential and Commercial for the years ended and as of September 30, 2020, 2019 and 2018 (in thousands).
| Years Ended and As of September 30, | ||||||||||||||||||||||||||||||||||||||||||||||||
| Residential | Commercial | Corporate and Eliminations |
Total | |||||||||||||||||||||||||||||||||||||||||||||
| 2020 | 2019 | 2018 | 2020 | 2019 | 2018 | 2020 | 2019 | 2018 | 2020 | 2019 | 2018 | |||||||||||||||||||||||||||||||||||||
| Net Sales |
$ | 771,167 | $ | 655,445 | $ | 541,942 | $ | 128,092 | $ | 138,758 | $ | 139,863 | $ | — | $ | — | $ | — | $ | 899,259 | $ | 794,203 | $ | 681,805 | ||||||||||||||||||||||||
| Adjusted EBITDA |
238,060 | 188,742 | 168,438 | 15,051 | 21,493 | 21,669 | (39,598 | ) | (30,669 | ) | (25,693 | ) | 213,513 | 179,566 | 164,414 | |||||||||||||||||||||||||||||||||
| Capital Expenditures |
86,473 | 48,206 | 36,121 | 6,472 | 4,592 | 4,308 | 2,649 | 10,208 | 2,329 | 95,594 | 63,006 | 42,758 | ||||||||||||||||||||||||||||||||||||
| Depreciation and Amortization |
85,148 | 81,716 | 66,396 | 9,302 | 8,845 | 8,961 | 5,331 | 3,368 | 2,308 | 99,781 | 93,929 | 77,665 | ||||||||||||||||||||||||||||||||||||
| Goodwill |
911,001 | 903,909 | 903,909 | 40,389 | 40,389 | 40,389 | — | — | — | 951,390 | 944,298 | 944,298 | ||||||||||||||||||||||||||||||||||||
| Total Assets |
1,726,705 | 1,584,383 | 1,596,075 | 180,116 | 171,721 | 162,543 | 25,035 | 32,159 | 20,562 | 1,931,856 | 1,788,263 | 1,779,180 | ||||||||||||||||||||||||||||||||||||
| Years Ended September 30, | ||||||||||||
| 2020 | 2019 | 2018 | ||||||||||
| Segment Adjusted EBITDA |
||||||||||||
| Residential |
$ | 238,060 | $ | 188,742 | $ | 168,438 | ||||||
| Commercial |
15,051 | 21,493 | 21,669 | |||||||||
|
|
|
|
|
|
|
|||||||
| Total Adjusted EBITDA for reporting segments |
$ | 253,111 | $ | 210,235 | $ | 190,107 | ||||||
| Unallocated net expenses |
(39,598 | ) | (30,669 | ) | (25,693 | ) | ||||||
| Adjustments to Income (loss) before income tax provision (benefit) |
||||||||||||
| Depreciation and amortization |
(99,781 | ) | (93,929 | ) | (77,665 | ) | ||||||
| Stock-based compensation costs |
(120,517 | ) | (3,682 | ) | (3,099 | ) | ||||||
| Asset impairment and inventory revaluation costs (1) |
— | — | (12,747 | ) | ||||||||
| Business transformation costs (2) |
(594 | ) | (16,560 | ) | (5,822 | ) | ||||||
| Acquisition costs (3) |
(1,596 | ) | (4,110 | ) | (7,361 | ) | ||||||
| Initial public offering and Secondary offering costs (4) |
(8,616 | ) | (9,076 | ) | (789 | ) | ||||||
| Other costs (5) |
(4,154 | ) | 6,845 | (4,189 | ) | |||||||
| Capital structure transaction costs (6) |
(37,587 | ) | — | (367 | ) | |||||||
| Interest expense |
(71,179 | ) | (83,205 | ) | (68,742 | ) | ||||||
|
|
|
|
|
|
|
|||||||
| Income (loss) before income taxes |
$ | (130,511 | ) | $ | (24,151 | ) | $ | (16,367 | ) | |||
|
|
|
|
|
|
|
|||||||
| (1) | Asset impairment and inventory revaluation costs reflect tangible and intangible asset impairment costs of $0.0 million, $0.0 million and $0.9 million for fiscal years 2020, 2019 and 2018, respectively, and inventory revaluations of $0.0 million, $0.0 million and $11.8 million for fiscal years 2020, 2019 and 2018, respectively, in the ordinary course of business. |
| (2) | Business transformation costs reflect consulting and other costs related to repositioning of brands of $0.0 million, $4.3 million and $0.0 million for fiscal years 2020, 2019 and 2018, respectively, compensation costs related to the transformation of the senior management team of $0.6 million, $2.3 million and $0.2 million for fiscal years 2020, 2019 and 2018, respectively, costs related to the relocation of the Company’s corporate headquarters of $2.0 million for fiscal year 2019, start-up costs of the Company’s new recycling facility of $5.3 million for fiscal year 2019, and other integration-related costs of $2.7 million and $5.6 million for fiscal years 2019 and 2018, respectively. |
| (3) | Acquisition costs reflect costs directly related to completed acquisitions of $0.9 million, $4.1 million and $4.9 million for fiscal years 2020, 2019 and 2018, respectively and inventory step-up adjustments related to recording the inventory of acquired businesses at fair value on the date of acquisition of $0.7 million, $0.0 million and $2.4 million for fiscal years 2020, 2019 and 2018, respectively. |
F-31
Table of Contents
| (4) | Initial public offering costs includes $1.4 million in fees related to the Secondary offering of class A common stock in fiscal year 2020. |
| (5) | Other costs reflect costs for legal expenses of $0.9 million, $0.9 million and $1.5 million for fiscal years 2020, 2019 and 2018, respectively, reduction in workforce costs of $0.4 million for fiscal year 2020, costs related to a change in the estimated warranty obligation based on a change in operational policy on reimbursement of claims of $2.1 million in fiscal year 2018, other miscellaneous adjustments of $0.6 million for fiscal year 2018, income from an insurance recovery of legal loss of $7.7 million for fiscal year 2019, and costs related to an incentive plan associated with the IPO of $2.9 million for fiscal year 2020. |
| (6) | Capital structure transaction costs include loss on extinguishment of debt of $1.9 million for the 2021 Senior Notes and $35.7 million for the 2025 Senior Notes for fiscal year 2020, and debt related issuance costs of $0.4 million for fiscal year 2018. |
12. CAPITAL STOCK
The Company completed its IPO on June 16, 2020, in which it sold 38,237,500 shares of its Class A common stock, including 4,987,500 shares pursuant to the underwriters’ over-allotment option. The shares were sold at an IPO price of $23.00 per share for net proceeds to the Company of approximately $819.7 million, after deducting underwriting discounts and commissions of $50.6 million and offering expenses of approximately $9.2 million payable by the Company.
Immediately prior to the completion of the IPO, the Company converted to a Delaware corporation from a limited liability company. The Company’s certificate of incorporation provides for two classes of common stock: Class A common stock and Class B common stock. In addition, the certificate of incorporation authorizes shares of undesignated preferred stock, the rights, preferences and privileges of which may be designated from time to time by the board of directors. The Company is authorized to issue up to 1.1 billion shares of Class A common stock, up to 1 hundred million shares of Class B common stock and up to 1 million shares of preferred stock, each par value $0.001 per share, in one or more series. The Class A common stock and Class B common stock provide identical economic rights, but holders of Class B common stock have limited voting rights, specifically that such holders have no right to vote, solely with respect to their shares of Class B common stock, with respect to the election, replacement or removal of directors. Holders of Class A common stock and Class B common stock are not entitled to preemptive rights. Holders of Class B common stock may convert their shares of Class B common stock into shares of Class A common stock on a one-for-one basis, in whole or in part, at any time and from time to time at their option. The Company’s Class A common stock is traded on the New York Stock Exchange under the symbol “AZEK.”
In conjunction with the Corporate Conversion and prior to the closing of the IPO, the Company effected a unit split of its then-outstanding unit, resulting in an aggregate of 108,162,741 units, including 75,093,778 Class A units and 33,068,963 Class B units. Concurrently with the Corporate Conversion, the units were converted to an aggregate of 108,162,741 shares of common stock, including 75,093,778 shares of Class A common stock and 33,068,963 shares of Class B common stock. In addition, a class of the Company’s former indirect parent’s partnership interests referred to as “Profits Interests” were exchanged for an aggregate of 2,703,243 shares of Class A common stock and 5,532,057 shares of Class A restricted stock, and 3,477,413 shares of Class A common stock reserved for issuance upon the exercise of stock options.
On September 15, 2020, the Company completed an offering of 28,750,000 shares of Class A common stock, par value $0.001 per share, including the exercise in full by the underwriters of their option to purchase up to 3,750,000 additional shares of Class A common stock, at a public offering price of $33.25 per share. The shares were sold by the Selling Stockholders. The Company did not receive any of the proceeds from the sale of the shares by the Selling Stockholders. The estimated offering expenses of approximately $1.4 million is payable by the Company and recorded in “Other general expenses” within the Consolidated Statements of Comprehensive Income (Loss). Immediately subsequent to the closing of the secondary offering, Class B common stockholders converted 33,068,863 shares of Class B common stock into Class A common stock.
F-32
Table of Contents
At September 30, 2020, the following amounts were issued and outstanding: 154,637,240 shares of Class A common stock and 100 shares of Class B common stock. The Company has not issued any shares of preferred stock.
13. STOCK-BASED COMPENSATION
The Company grants stock-based awards to attract, retain and motivate key employees and directors.
Prior to the completion of the IPO, Profits Interests were issued through an LP Interest Agreement. The Profits Interests were, as part of the Corporate Conversion, converted into shares of common stock, restricted stock and stock options. The 2020 Omnibus Incentive Compensation Plan (“2020 Plan”), became effective as of June 11, 2020, the day of effectiveness of the registration statement filed in connection with the IPO. The 2020 Plan provides for the grant of stock options, stock appreciation rights, restricted stock, restricted stock units, dividend equivalent rights, and performance-based or other equity-related awards to the Company’s employees and directors. The maximum aggregate number of shares that may be issued under the 2020 Plan is 15,852,319 shares with 5,040,776 shares remaining in the reserve. The total aggregate number of shares may be adjusted as determined by the Board of Directors.
As part of the Corporate Conversion, the Company modified its terms and conditions of the performance-based awards by changing the vesting conditions. The change was treated as a modification under ASC 718, Stock Compensation, in which the fair value of the performance based awards was measured at the modification date and compared to the fair value of the modified award immediately prior to the modification, with the difference resulting in incremental compensation expense. As a result of the incremental fair value of the modified awards, the Company recognized $103.4 million in incremental compensation cost in “Selling, general and administrative expenses” in the Consolidated Statements of Comprehensive Income (Loss), for the year ended September 30, 2020.
Subsequent to the IPO, the Company participated in a non-dilutive secondary offering, which resulted in certain performance based awards accelerated vesting. Included in the $103.4 million, the Company recognized $43.1 million related to the accelerated vesting in compensation cost in the “Selling, general and administrative expenses” in the Consolidated Statements of Comprehensive Income (Loss), for the year ended September 30, 2020.
Stock-based compensation expense for the years ended September 30, 2020, 2019 and 2018 was $120.5 million, $3.3 million and $2.5 million, respectively, recognized in “Selling, general and administrative expenses” in the Consolidated Statements of Comprehensive Income (Loss). Total income tax benefit for the years ended September 30, 2020, 2019 and 2018 was $6.3 million, $0.0 million and $0.0 million, respectively. As of September 30, 2020, the Company had not yet recognized compensation cost on unvested stock-based awards of $25.4 million, with a weighted average remaining recognition period of 3.1 years.
The Company uses the Monte Carlo pricing model to estimate the fair value of its performance-based awards as of the grant date, and uses the Black Scholes pricing model to estimate the fair value of its service-based awards as of the grant date. Under the terms of the 2020 Plan, all stock options will expire if not exercised within ten years of the grant date.
The following table sets forth the significant assumptions used for the performance-based awards granted during the year ended September 30, 2020:
| June 12, 2020 Grant Date |
||||
| Risk-free interest rate |
0.75% | |||
| Expected volatility |
40.00% | |||
| Expected term (in years) |
0.50 | |||
| Expected dividend yield |
0.00% | |||
F-33
Table of Contents
The following table sets forth the significant assumptions used for the service-based awards granted during the year ended September 30, 2020:
| June 12, 2020 Grant Date |
||||
| Risk-free interest rate |
0.47%-0.56% | |||
| Expected volatility |
35.00% | |||
| Expected term (in years) |
6.25 – 7.00 | |||
| Expected dividend yield |
0.00% | |||
Stock Options
The following table summarizes the performance-based stock option activity for the year ended September 30, 2020:
| Number of Shares |
Weighted Average Exercise Price Per Share |
Weighted Average Remaining Contract Term |
Aggregate Intrinsic Value |
|||||||||||||
| (in years) | (in thousands) | |||||||||||||||
| Outstanding at October 1, 2019 |
— | $ | — | — | $ | — | ||||||||||
| Granted |
1,706,098 | 23.00 | — | — | ||||||||||||
| Exercised |
(600 | ) | 23.00 | — | — | |||||||||||
| Cancelled/Forfeited |
— | — | — | — | ||||||||||||
| Expired |
— | — | — | — | ||||||||||||
|
|
|
|||||||||||||||
| Outstanding at September 30, 2020 |
1,705,498 | 23.00 | 9.7 | 20,142 | ||||||||||||
|
|
|
|||||||||||||||
| Vested and exercisable at September 30, 2020 |
1,705,498 | 23.00 | 9.7 | 20,142 | ||||||||||||
|
|
|
|||||||||||||||
The following table summarizes the service-based stock option activity for the year ended September 30, 2020:
| Number of Shares |
Weighted Average Exercise Price Per Share |
Weighted Average Remaining Contract Term |
Aggregate Intrinsic Value |
|||||||||||||
| (in years) | (in thousands) | |||||||||||||||
| Outstanding at October 1, 2019 |
— | $ | — | — | $ | — | ||||||||||
| Granted |
3,384,147 | 23.00 | — | — | ||||||||||||
| Exercised |
(1,200 | ) | 23.00 | — | — | |||||||||||
| Cancelled/Forfeited |
— | — | — | — | ||||||||||||
| Expired |
— | — | — | — | ||||||||||||
|
|
|
|||||||||||||||
| Outstanding at September 30, 2020 |
3,382,947 | 23.00 | 9.7 | 39,953 | ||||||||||||
|
|
|
|||||||||||||||
| Vested and exercisable at September 30, 2020 |
979,583 | 23.00 | 9.7 | 11,569 | ||||||||||||
|
|
|
|||||||||||||||
F-34
Table of Contents
Both the performance-based stock options and the service-based stock options were subject to a 180-day lock up period, as described in the final prospectus filed pursuant to Rule 424(b) under the Securities Act of 1933, as amended (the “Securities Act”), with the Securities and Exchange Commission (“SEC”) on June 15, 2020 (the “Prospectus”). As a result of the secondary offering, 26.4% of the options were released from the 180-day lock up period. The Company received less than $0.1 million in cash (excluding withholding taxes) in connection with the exercise of 1,800 options by certain stockholders.
Restricted Stock Awards
A summary of the performance-based restricted stock awards activity for the year ended September 30, 2020 was as follows:
| Number of Shares | Weighted Average Grant Date Fair Value |
|||||||
| Outstanding and unvested at October 1, 2019 |
— | $ | — | |||||
| Granted |
3,884,615 | 23.00 | ||||||
| Vested |
(3,884,615 | ) | 23.00 | |||||
| Forfeited |
— | — | ||||||
|
|
|
|||||||
| Outstanding and unvested at September 30, 2020 |
— | — | ||||||
|
|
|
|||||||
A summary of the service-based restricted stock awards activity for the year ended September 30, 2020 was as follows:
| Number of Shares | Weighted Average Grant Date Fair Value |
|||||||
| Outstanding and unvested at October 1, 2019 |
— | $ | — | |||||
| Granted |
1,647,442 | 23.00 | ||||||
| Vested |
(161,831 | ) | 23.00 | |||||
| Forfeited |
— | — | ||||||
|
|
|
|||||||
| Outstanding and unvested at September 30, 2020 |
1,485,611 | 23.00 | ||||||
|
|
|
|||||||
Restricted Stock Units
A summary of the service-based restricted stock unit awards activity for the year ended September 30, 2020 was as follows:
| Number of Shares | Weighted Average Grant Date Fair Value |
|||||||
| Outstanding and unvested at October 1, 2019 |
— | $ | — | |||||
| Granted |
191,443 | 23.00 | ||||||
| Vested |
— | — | ||||||
| Forfeited |
(6,592 | ) | 23.00 | |||||
|
|
|
|||||||
| Outstanding and unvested at September 30, 2020 |
184,851 | 23.00 | ||||||
|
|
|
|||||||
F-35
Table of Contents
14. EMPLOYEE BENEFIT PLANS
The Company has a 401(k) defined contribution plans (the “401(k) Plans”) for the benefit of its employees who meet certain eligibility requirements. The Company does not offer a defined benefit plan (pension plan) nor does the Company offer any other post-retirement benefits. The 401(k) Plans cover substantially all of the Company’s full-time employees. Each participant may contribute up to 85% of his or her salary, within dollar limitations set forth by the ERISA guidelines. The 401(k) Plans match employee pre-tax and Roth IRA contributions. Effective January 1, 2018, the Company amended the 401(k) plan to increase the Company match to be 100% of the first 1% of employee contributions, plus 50% of the next 5% of employee contributions. Prior to January 1, 2018, the Company matched 50% of the first 5% of employee contributions.
The Company’s contributions to the plans totaled $3.2 million, $2.7 million and $1.7 million, for the years ended September 30, 2020, 2019 and 2018, respectively.
15. EARNINGS PER SHARE
The Company computes earnings per common share (“EPS”) under the two-class method which requires the allocation of all distributed and undistributed earnings attributable to the Company to common stock and other participating securities based on their respective rights to receive distributions of earnings or losses. The Company’s Class A common stock and Class B common stock equally share in distributed and undistributed earnings, therefore, no allocation to participating securities or dilutive securities is performed.
Basic EPS attributable to common stockholders is calculated by dividing net income (loss) attributable to common stockholders by the weighted average number of shares of common stock outstanding. Diluted EPS is calculated by adjusting weighted average shares outstanding for the dilutive effect of potential common shares, determined using the treasury-stock method. For purposes of the diluted EPS calculation, restricted stock awards, restricted stock units and options to purchase shares of common stock are considered to be potential common shares. The following table sets forth the computation of the Company’s basic and diluted EPS attributable to common stockholders (in thousands, except share and per share amounts):
| Years Ended September 30, | ||||||||||||
| 2020 | 2019 | 2018 | ||||||||||
| Numerator: |
||||||||||||
| Net income (loss) |
$ | (122,233 | ) | $ | (20,196 | ) | $ | 6,745 | ||||
|
|
|
|
|
|
|
|||||||
| Net income (loss) attributable to common stockholders — basic and diluted |
$ | (122,233 | ) | $ | (20,196 | ) | $ | 6,745 | ||||
|
|
|
|
|
|
|
|||||||
| Denominator: |
||||||||||||
| Weighted average shares of common stock — basic and diluted |
120,775,717 | 108,162,741 | 108,162,741 | |||||||||
|
|
|
|
|
|
|
|||||||
| Net income (loss) attributable to common stockholders: |
||||||||||||
|
|
|
|
|
|
|
|||||||
| Net income (loss) per share attributable to common stockholders — basic and diluted |
$ | (1.01 | ) | $ | (0.19 | ) | $ | 0.06 | ||||
|
|
|
|
|
|
|
|||||||
F-36
Table of Contents
The following table includes the number of shares that may be dilutive common shares in the future, and were not included in the computation of diluted net income (loss) per share because the effect was anti-dilutive:
| Years Ended September 30, | ||||||||||||
| 2020 | 2019 | 2018 | ||||||||||
| Restricted Stock Awards |
1,064,897 | — | — | |||||||||
| Stock Options |
268,177 | — | — | |||||||||
| Restricted Stock Units |
19,724 | — | — | |||||||||
16. INCOME TAXES
The Company’s operations are substantially all domestic. The components of income tax expense (benefit) consisted of the following (in thousands):
| Years Ended September 30, | ||||||||||||
| 2020 | 2019 | 2018 | ||||||||||
| Current: |
||||||||||||
| Federal |
$ | (55 | ) | $ | (62 | ) | $ | (41 | ) | |||
| State and local |
1,887 | 1,428 | 1,054 | |||||||||
|
|
|
|
|
|
|
|||||||
| Total current |
1,832 | 1,366 | 1,013 | |||||||||
| Deferred: |
||||||||||||
| Federal |
(7,408 | ) | (3,128 | ) | (25,534 | ) | ||||||
| State and local |
(2,702 | ) | (2,193 | ) | 1,409 | |||||||
|
|
|
|
|
|
|
|||||||
| Total deferred |
(10,110 | ) | (5,321 | ) | (24,125 | ) | ||||||
|
|
|
|
|
|
|
|||||||
| Income tax benefit |
$ | (8,278 | ) | $ | (3,955 | ) | $ | (23,112 | ) | |||
|
|
|
|
|
|
|
|||||||
The effective income tax rate was different from the statutory U.S. federal income tax rate of 21.0%, 21.0% and 21.0% for the years ended September 30, 2020, 2019 and 2018, respectively, due to the following (in thousands):
| 2020 | Rate | 2019 | Rate | 2018 | Rate | |||||||||||||||||||
| Income tax benefit / federal statutory rate |
$ | (27,407 | ) | 21.0 | % | $ | (5,072 | ) | 21.0 | % | $ | (3,437 | ) | 21.0 | % | |||||||||
| State and local taxes — net of federal benefit |
(960 | ) | 0.6 | (667 | ) | 2.8 | 275 | (1.7 | ) | |||||||||||||||
| Increase in valuation allowance |
280 | (0.2 | ) | 20 | (0.1 | ) | 140 | (0.9 | ) | |||||||||||||||
| Increase in valuation allowance — impact of U.S. tax reform |
— | — | — | — | 902 | (5.5 | ) | |||||||||||||||||
| Stock-based compensation |
19,344 | (14.8 | ) | 685 | (2.8 | ) | 558 | (3.4 | ) | |||||||||||||||
| State tax law change |
— | — | — | 1,453 | (8.9 | ) | ||||||||||||||||||
| Deferred impact of U.S. tax reform rate change |
— | — | — | — | (23,409 | ) | 143.0 | |||||||||||||||||
| Non-deductible transaction costs |
411 | (0.3 | ) | 407 | (1.7 | ) | — | — | ||||||||||||||||
| Executive compensation |
235 | (0.2 | ) | — | — | — | — | |||||||||||||||||
| Federal research and development credit |
(465 | ) | 0.4 | — | — | — | — | |||||||||||||||||
| Meals and entertainment |
262 | (0.2 | ) | 350 | (1.5 | ) | 206 | (1.3 | ) | |||||||||||||||
| Other |
22 | — | 322 | (1.3 | ) | 200 | (1.2 | ) | ||||||||||||||||
|
|
|
|
|
|
|
|
|
|
|
|
|
|||||||||||||
| Income tax benefit / effective tax rate |
$ | (8,278 | ) | 6.3 | % | $ | (3,955 | ) | 16.4 | % | $ | (23,112 | ) | 141.2 | % | |||||||||
|
|
|
|
|
|
|
|
|
|
|
|
|
|||||||||||||
The effective income tax rate was 6.3% for the year ended September 30, 2020 compared to 16.4% for the year ended September 30, 2019. The 2020 effective income tax rate was negatively impacted by non-deductible costs related to the Company’s initial public offering that occurred in June 2020.
F-37
Table of Contents
The components of the deferred tax assets and liabilities consisted of the following (in thousands):
| As of September 30, | ||||||||
| 2020 | 2019 | |||||||
| Deferred tax asset: |
||||||||
| Federal net operating loss carryforwards |
$ | 23,389 | $ | 19,706 | ||||
| State loss carryforwards and other benefits |
9,797 | 8,866 | ||||||
| Inventory reserves |
5,181 | 7,867 | ||||||
| Warranty reserves |
3,016 | 2,819 | ||||||
| Legal reserves |
365 | 451 | ||||||
| Accrued expenses |
7,876 | 7,407 | ||||||
| Disallowed interest carryforward |
12,019 | 9,222 | ||||||
| Stock-based compensation |
6,325 | — | ||||||
| Federal research and development credit |
465 | — | ||||||
| Valuation allowance |
(5,530 | ) | (5,250 | ) | ||||
|
|
|
|
|
|||||
| Total deferred tax assets |
62,903 | 51,088 | ||||||
|
|
|
|
|
|||||
| Deferred tax liabilities: |
||||||||
| Intangible assets — net |
45,509 | 51,823 | ||||||
| Property, plant and equipment |
37,617 | 32,747 | ||||||
| Indemnification receivable related to warranty reserves |
1,037 | 521 | ||||||
|
|
|
|
|
|||||
| Total deferred tax liabilities |
84,163 | 85,091 | ||||||
|
|
|
|
|
|||||
| Net deferred tax liability |
$ | 21,260 | $ | 34,003 | ||||
|
|
|
|
|
|||||
At September 30, 2020, the Company has approximately $85.8 million (gross of tax) of net operating loss carryforwards for federal income tax purposes which begin to expire after 2031 and $27.9 million of net operating loss carryforwards for federal income tax purposes that have an indefinite carryforward period. Additionally, the Company has approximately $94.3 million of net operating loss carryforwards for state and local tax purposes, which expire in varying amounts beginning in 2021 and through 2038. The valuation allowance was determined in accordance with the provisions of ASC 740, Income Taxes, which requires that a valuation allowance be established and maintained when management’s analysis indicates it is “not more likely than not” that all or a portion of deferred tax assets will be realized. The valuation allowance for certain net deferred tax assets of $5.5 million and $5.3 million at September 30, 2020 and 2019, respectively, is attributable to the uncertainty as to the realization of state deferred tax assets related to Pennsylvania state tax loss carryforwards at certain U.S. subsidiaries of the Company (CPG International LLC and Scranton Products, Inc.). The activity in the valuation allowance consisted of the following (in thousands):
| As of September 30, | ||||||||
| 2020 | 2019 | |||||||
| Beginning balance |
$ | 5,250 | $ | 5,230 | ||||
| Expense |
280 | 20 | ||||||
|
|
|
|
|
|||||
| Ending balance |
$ | 5,530 | $ | 5,250 | ||||
|
|
|
|
|
|||||
F-38
Table of Contents
A reconciliation of the beginning and ending balances for liabilities associated with unrecognized tax benefits consisted of the following (in thousands):
| As of September 30, | ||||||||
| 2020 | 2019 | |||||||
| Beginning balance |
$ | 961 | $ | 924 | ||||
| Unrecognized tax benefits related to prior years |
35 | 37 | ||||||
|
|
|
|
|
|||||
| Ending balance |
$ | 996 | $ | 961 | ||||
|
|
|
|
|
|||||
Unrecognized tax benefits of $0.5 million and $0.5 million are recorded as an offset to certain non-current deferred tax assets at September 30, 2020 and 2019, respectively. The total liabilities associated with the unrecognized tax benefits that, if recognized, would impact the Company’s effective tax rate were $1.0 million and $1.0 million at September 30, 2020 and 2019, respectively. It is not anticipated that the balance of unrecognized tax benefits will change significantly over the next twelve months.
When applicable, the Company’s practice is to recognize interest and penalties related to uncertain income tax positions in income tax expense. For the years ended September 30, 2020, 2019 and 2018 the amounts recognized by the Company for interest and penalties were not material. The corresponding liability recorded in the Consolidated Balance Sheets as of September 30, 2020 and 2019 was also not material.
The Company and its subsidiaries file U.S. federal income tax returns. The Company and its subsidiaries’ federal income tax returns for tax years 2016 and beyond are open tax years subject to examination by the Internal Revenue Service (“IRS”). The Company also has net operating loss carry-forwards from prior to 2016, which are subject to examination upon future utilization of such losses. The Company and its subsidiaries also file income tax returns in various state jurisdictions, as appropriate, with varying statutes of limitation. These returns are not material to the consolidated income tax provision.
US Tax Reform Legislation
On December 22, 2017, the President of the United States signed into law H.R. 1, comprehensive tax legislation commonly referred to as the Tax Cuts and Jobs Act (the “Tax Act”). Except for certain provisions, the Tax Act is effective for tax years beginning on or after January 1, 2018. As a fiscal year U.S. taxpayer, the majority of the provisions, such as new limitations on certain business deductions, including the limitation on the Company’s interest expense deduction, applied to the Company beginning in fiscal year 2019. For fiscal year 2018 and effective in the three months ended December 31, 2017, the most significant impact included: lowering of the U.S. federal corporate income tax rate and remeasuring certain net deferred tax assets and liabilities. The phase in of the lower corporate income tax rate resulted in a blended rate of 24.5% for fiscal year 2018, as compared to the previous rate of 35%. The tax rate was reduced to 21% in subsequent fiscal years. Because the Company has net operating loss carry-forwards and was not expected to owe federal tax in the fiscal year 2018 tax return, the remeasurement of deferred taxes and the annual effective tax rate for the period are calculated using the future federal tax rate of 21%. In the year ended September 30, 2018, the Company recorded a $22.5 million net income tax benefit for the remeasurement of certain deferred tax assets and liabilities. The Company’s effective tax rate was significantly impacted by the recognition of this remeasurement.
In December 2017, the SEC issued Staff Accounting Bulletin No. 118 (“SAB 118”) which provided guidance on how companies should account for the tax effects related to the Tax Act. According to SAB 118, companies were to make a good faith effort to compute the impact of the Tax Act in a timely manner once the company obtained, prepared, and analyzed the information needed to complete their accounting requirements under ASC 740. The measurement period for SAB 118 ended December 22, 2018, and companies are now required to report the impact of the Tax Act using existing tax law and other sources of authority. The Company was able to record the impact of the Tax Act without using the measurement period provisions of the Tax Act. The material elements of the Tax Act are reflected in the rate reconciliation as final.
F-39
Table of Contents
Certain law changes from the Tax Act require the Company to analyze new items including, but not limited to, limitations on interest deductions and accelerated cost recovery of fixed assets. The Company has made policy decisions as to how to account for the tax effects of these items, as required by authoritative regulatory guidance, and will continue to analyze the impact as additional authoritative and technical guidance is issued and finalized at the federal and state levels.
The Tax Act also revised the definition of “covered employees” who are subject to the $1.0 million limitation imposed on deductions for executive compensation paid by publicly-traded corporations. As a result, the limitation now applies to the chief executive officer, the chief financial officer, the three other highest compensated employees and any employee who was a covered employee for any taxable year beginning after 2016. The Tax Act also eliminated the exception to this rule for commission or performance-based compensation paid to these covered employees. This new provision generally does not apply to compensation paid pursuant to a written contract in effect on or before November 3, 2017 that is not materially modified or renewed. Based on this new provision, since the Company became publicly traded in June 2020, it is now required to adjust the Deferred Tax Asset related to future stock compensation deductions for amounts that it does not expect it will be able to deduct in the future. The Company will continue to analyze executive compensation in future periods and adjust the Deferred Tax Asset for limitations of estimated future compensation deductions as information becomes available.
The Company adopted ASU No. 2016-16, Income Taxes (Topic 740): Intra-Entity Transfers of Assets Other Than Inventory, on October 1, 2019. The updated guidance requires companies to recognize the income tax consequences of an intra-entity transfer of an asset other than inventory when the transfer occurs. Income tax effects of intra-entity transfers of inventory will continue to be deferred until the inventory has been sold to a third party. The adoption of this standard did not have a material impact on the Company’s Consolidated Financial Statements.
17. COMMITMENTS AND CONTINGENCIES
Lease Commitments
The Company leases vehicles, machinery and a manufacturing facility under various capital leases. The Company also leases office equipment, vehicles and manufacturing and office facilities under various operating leases.
In 2018, the Company entered into a lease agreement for its corporate headquarters in Chicago, IL. The Company was responsible for costs to build out the office space and spent approximately $3.4 million in improvements to meet the Company’s needs. Based on the lease agreement and the changes made to the office space the Company concluded that it was the “deemed owner” of the building (for accounting purposes only) during the construction period. The Company recorded the build out costs as an asset with a corresponding build-to-suit liability while the building was under construction. Upon completion of the improvements to the building, the Company evaluated the derecognition of the asset and liability under the provisions of ASC 840-40, Leases—Sale-Leaseback Transactions. The Company determined that the lease does not meet the criteria for sale-leaseback accounting treatment, due to the Company’s continuing involvement in the project. As a result, the building is being accounted for as a financing obligation. The underlying assets amount to approximately $9.2 million. The Company determined its incremental borrowing rate for the purpose of calculating the interest and principal components of each lease payment was 8.4%.
F-40
Table of Contents
Future minimum annual payments under noncancelable leases with initial or remaining noncancelable lease terms in excess of one year as of September 30, 2020 were as follows (in thousands):
| Capital | Financing | Operating | ||||||||||
| 2021 |
$ | 1,635 | $ | 776 | $ | 2,646 | ||||||
| 2022 |
1,522 | 787 | 2,555 | |||||||||
| 2023 |
1,118 | 806 | 2,355 | |||||||||
| 2024 |
735 | 826 | 1,974 | |||||||||
| 2025 |
598 | 846 | 1,569 | |||||||||
| Thereafter |
2,191 | 3,823 | 3,397 | |||||||||
|
|
|
|
|
|
|
|||||||
| Total payments |
$ | 7,799 | $ | 7,864 | $ | 14,496 | ||||||
|
|
|
|
|
|
|
|||||||
| Less amount representing interest |
(3,843 | ) | ||||||||||
|
|
|
|||||||||||
| Present value of minimum capital lease payments |
$ | 3,956 | ||||||||||
|
|
|
|||||||||||
Total rent expense was approximately $1.6 million, $1.3 million and $1.4 million for the years ended September 30, 2020, 2019 and 2018, respectively. The future minimum sublease income under a noncancelable sublease was $0.9 million at September 30, 2020.
Raw Material and Fixed Asset Purchase Commitments
The Company fulfills requirements for raw materials under both purchase orders and supply contracts. In the year ended September 30, 2020, the Company purchased substantially all of its raw materials, other than resins, under purchase orders which do not involve long-term supply commitments.
Substantially all of the Company’s resins are purchased under supply contracts that may average approximately one to two years, for which pricing is variable based on certain industry-based market indices. The resin supply contracts are negotiated annually and generally provide that the Company is obligated to purchase a minimum amount of resins from each supplier. As of September 30, 2020, the Company has purchase commitments under material supply contracts of $3.1 million for the calendar year ending December 31, 2020. As of September 30, 2020, and 2019, the Company had committed to purchase $1.5 million and $0.7 million of equipment, respectively.
Legal Proceedings
In the normal course of the Company’s business, it is at times subject to pending and threatened legal actions, in some cases for which the relief or damages sought may be substantial. Although the Company is not able to predict the outcome of such actions, after reviewing all pending and threatened actions with counsel and based on information currently available, management believes that the outcome of such actions, individually or in the aggregate, will not have a material adverse effect on the Company’s results of operations or financial position. However, it is possible that the ultimate resolution of such matters, if unfavorable, may be material to the Company’s results of operations in a particular future period as the time and amount of any resolution of such actions and its relationship to the future results of operations are not currently known. The Company accrues for losses when they are probable of occurrence and such losses are reasonably estimable. Legal costs expected to be incurred are accounted for as they are incurred.
Loss Contingencies
On June 18, 2018, the Company acquired Versatex. In connection with a contingent liability assumed by the Company in the acquisition, the Company recorded a contingent liability of $5.8 million as a measurement period adjustment to the opening balance sheet related to the assumption of a contingency related to an automobile accident involving a Versatex employee prior to the acquisition. The case was fully settled during the year ended September 30, 2020 and payment of $5.8 million was made by the Company’s insurer to the claimants.
F-41
Table of Contents
During the year ended September 30, 2019, the Company was made aware of a worker’s compensation case that became reasonably possible to give rise to a liability. The case is in discovery as the nature and extent of the Company’s exposure is currently being determined. The Company expects a range of loss of $0.4 million to $0.5 million. As of September 30, 2020, there are various other worker’s compensation and personal injury claims that have been made against the Company. All such claims are being contested and the Company does not believe a loss is probable; therefore, no reserve has been recorded related to these matters. In addition, the Company carries insurance for these types of matters and is expecting to recover thereon.
The Company is a party to various legal proceedings and claims, which arise in the ordinary course of business. As of September 30, 2020, the Company determined that there was not at least a reasonable possibility that it had incurred a material loss, or a material loss in excess of a recorded accrual, with respect to such proceedings.
Gain Contingency
During the quarter ended March 31, 2018, the Company paid a litigation settlement of $7.5 million. The Company had previously recorded a reserve in the same amount during the quarter ended March 31, 2017. The Company maintains specialty insurance policies. The Company filed claims under its insurance policies to recover the loss and legal defense costs. During the year ended September 30, 2019, the Company received $7.7 million as settlement of its claims under the specialty insurance policies. The settlement of $7.7 million is included in operating income for the year ended September 30, 2019.
18. QUARTERLY FINANCIAL INFORMATION (UNAUDITED)
(In thousands, except per share amounts):
| Three Months Ended | ||||||||||||||||||||||||||||||||||||||||||||||||
| September 30, 2020 |
June 30, 2020 |
March 31, 2020 |
December 31, 2019 |
September 30, 2019 |
June 30, 2019 |
March 31, 2019 |
December 31, 2018 |
September 30, 2018 |
June 30, 2018 |
March 31, 2018 |
December 31, 2017 |
|||||||||||||||||||||||||||||||||||||
| Net sales (1) |
$ | 263,920 | $ | 223,711 | $ | 245,585 | $ | 166,043 | $ | 215,534 | $ | 221,307 | $ | 219,931 | $ | 137,431 | $ | 191,137 | $ | 184,406 | $ | 200,863 | $ | 105,399 | ||||||||||||||||||||||||
|
|
|
|
|
|
|
|
|
|
|
|
|
|
|
|
|
|
|
|
|
|
|
|
|
|||||||||||||||||||||||||
| Gross profit |
90,264 | 75,123 | 79,372 | 51,291 | 69,476 | 75,410 | 67,405 | 40,906 | 56,003 | 51,361 | 65,211 | 29,461 | ||||||||||||||||||||||||||||||||||||
|
|
|
|
|
|
|
|
|
|
|
|
|
|
|
|
|
|
|
|
|
|
|
|
|
|||||||||||||||||||||||||
| Net income (loss) |
$ | (64,359 | ) | $ | (52,116 | ) | $ | 4,088 | $ | (9,846 | ) | $ | (920 | ) | $ | 1,511 | $ | (1,516 | ) | $ | (19,271 | ) | $ | (4,564 | ) | $ | (10,228 | ) | $ | 9,072 | $ | 12,465 | ||||||||||||||||
|
|
|
|
|
|
|
|
|
|
|
|
|
|
|
|
|
|
|
|
|
|
|
|
|
|||||||||||||||||||||||||
| Net income (loss) per common share: |
||||||||||||||||||||||||||||||||||||||||||||||||
| Basic and Diluted |
$ | (0.43 | ) | $ | (0.44 | ) | $ | 0.04 | $ | (0.09 | ) | $ | (0.01 | ) | $ | 0.01 | $ | (0.01 | ) | $ | (0.18 | ) | $ | (0.04 | ) | $ | (0.09 | ) | $ | 0.08 | $ | 0.12 | ||||||||||||||||
|
|
|
|
|
|
|
|
|
|
|
|
|
|
|
|
|
|
|
|
|
|
|
|
|
|||||||||||||||||||||||||
| (1) | Net sales are impacted by seasonality as the Company has typically experienced moderately higher levels of sales of residential products in the second fiscal quarter of the year as a result of “early buy” sales. Net sales are also generally impacted by the number of days in a quarter or a year that contractors and other professionals are able to install products. This can vary dramatically based on, among other things, weather events such as rain, snow and extreme temperatures. The Company has generally experienced lower levels of sales of residential products in the first fiscal quarter due to adverse weather conditions in certain markets, which typically reduce the construction and renovation activity during the winter season. In addition, the Company has experienced higher levels of sales of bathroom partition products and locker products during the second half of a fiscal year, which includes the summer months when schools are typically closed and therefore are more likely to undergo remodel activities. |
F-42
Table of Contents
19. CONDENSED FINANCIAL INFORMATION OF REGISTRANT (PARENT COMPANY ONLY)
| The AZEK Company Inc. (parent company only) | ||||
| Balance Sheets | ||||
| (In thousands of U.S. dollars, except for share and per share amounts) | ||||
| As of September 30, | ||||||||
| 2020 | 2019 | |||||||
| ASSETS: | ||||||||
| Non-current assets: |
||||||||
| Investments in subsidiaries |
$ | 1,303,888 | $ | 490,023 | ||||
|
|
|
|
|
|||||
| Total non-current assets |
1,303,888 | 490,023 | ||||||
|
|
|
|
|
|||||
| Total assets |
$ | 1,303,888 | $ | 490,023 | ||||
|
|
|
|
|
|||||
| LIABILITIES AND STOCKHOLDERS’ EQUITY: | ||||||||
| Total liabilities |
$ | — | $ | — | ||||
|
|
|
|
|
|||||
| Stockholders’ equity: |
||||||||
| Preferred stock, $0.001 par value; 1,000,000 shares authorized and no shares issued and outstanding at September 30, 2020 and September 30, 2019, respectively |
— | — | ||||||
| Class A common stock, $0.001 par value; 1,100,000,000 shares authorized, 154,637,240 shares issued and outstanding at September 30, 2020, and 75,093,778 shares issued and outstanding at September 30, 2019 |
155 | 75 | ||||||
| Class B common stock, $0.001 par value; 100,000,000 shares authorized, 100 shares issued and outstanding at September 30, 2020, and 33,068,963 shares issued and outstanding at September 30, 2019 |
— | 33 | ||||||
| Additional paid-in capital |
1,587,208 | 652,493 | ||||||
| Accumulated deficit |
(283,475 | ) | (162,578 | ) | ||||
|
|
|
|
|
|||||
| Total stockholders’ equity |
1,303,888 | 490,023 | ||||||
|
|
|
|
|
|||||
| Total liabilities and stockholders’ equity |
$ | 1,303,888 | $ | 490,023 | ||||
|
|
|
|
|
|||||
| The AZEK Company Inc. (parent company only) | ||||||
| Statements of Comprehensive Income (Loss) | ||||||
| (In thousands of U.S. dollars) | ||||||
| Years Ended September 30, | ||||||||||||
| 2020 | 2019 | 2018 | ||||||||||
| Net income (loss) of subsidiaries |
$ | (122,233 | ) | $ | (20,196 | ) | $ | 6,745 | ||||
|
|
|
|
|
|
|
|||||||
| Net income (loss) of subsidiaries |
$ | (122,233 | ) | $ | (20,196 | ) | $ | 6,745 | ||||
|
|
|
|
|
|
|
|||||||
| Comprehensive income (loss) |
$ | (122,233 | ) | $ | (20,196 | ) | $ | 6,745 | ||||
|
|
|
|
|
|
|
|||||||
The AZEK Company Inc. did not have any cash as of September 30, 2020, 2019 or 2018, accordingly a Statement of Cash Flows has not been presented.
F-43
Table of Contents
Basis of Presentation
The parent company financial statements should be read in conjunction with the Company’s Consolidated Financial Statements and the accompanying notes thereto. For purposes of this condensed financial information, the Company’s wholly owned and majority owned subsidiaries are recorded based upon its proportionate share of the subsidiaries’ net assets (similar to presenting them on the equity method).
Since the restricted net assets of The AZEK Company Inc. and its subsidiaries exceed 25% of the consolidated net assets of the Company and its subsidiaries, the accompanying condensed parent company financial statements have been prepared in accordance with Rule 12-04, Schedule 1 of Regulation S-X. This information should be read in conjunction with the accompanying Consolidated Financial Statements.
Dividends from Subsidiaries
There were no cash dividends paid to The AZEK Company Inc. from the Company’s consolidated subsidiaries during each of the years ended September 30, 2020, 2019 and 2018.
Restricted Payments
CPG International LLC is party to the Revolving Credit Facility and the Term Loan Agreement originally executed on September 30, 2013, both of which have been amended and extended from time to time. The obligations under the Revolving Credit Facility and Term Loan Agreement are secured by substantially all of the present and future assets of the borrowers and guarantors, including equity interests of their domestic subsidiaries, subject to certain exceptions.
The obligations under the Revolving Credit Facility and Term Loan Agreement are guaranteed by the Company and its wholly owned domestic subsidiaries other than certain immaterial subsidiaries and other excluded subsidiaries. CPG International LLC is not permitted to make certain payments unless those payments are consistent with exceptions outlined in the agreements. These payments include repurchase of equity interests, fees associated with a public offering, income taxes due in other applicable payments. Further, the payments are only permitted if certain conditions are met related to availability and fixed charge coverage as defined in the Revolving Credit Facility and described in Note 8 to these Consolidated Financial Statements.
20. SUBSEQUENT EVENTS
The Company has evaluated subsequent events through the date the Consolidated Financial Statements were issued. The Company has determined that there were no subsequent events.
F-44