Attached files
| file | filename |
|---|---|
| 8-K - 8-K - Sabre Corp | d38430d8k.htm |

Exhibit 99.1 Sabre Presents at BofA Securities 2020 Leveraged Finance Virtual Conference Doug Barnett CFO 1 December 2020Exhibit 99.1 Sabre Presents at BofA Securities 2020 Leveraged Finance Virtual Conference Doug Barnett CFO 1 December 2020
Forward-looking statements Forward-looking Statements Certain statements herein are forward-looking statements about trends, future events, uncertainties and our plans and expectations of what may happen in the future. Any statements that are not historical or current facts are forward-looking statements. In many cases, you can identify forward-looking statements by terms such as expect, believe, “tomorrow,” position, guidance, outlook, “hope,” “estimate, project, anticipate, will, continue, commit, may,” “should,” “would,” “intend, “potential,” long-term, growth, results or the negative of these terms or other comparable terminology. Forward-looking statements involve known and unknown risks, uncertainties and other factors that may cause Sabre’s actual results, performance or achievements to be materially different from any future results, performances or achievements expressed or implied by the forward-looking statements. The potential risks and uncertainties include, among others, the severity, extent and duration of the global COVID-19 pandemic and its impact on our business and results of operations, financial condition and credit ratings, as well as on the travel industry and consumer spending more broadly, the actions taken to contain the disease or treat its impact, the effect of remote working arrangements on our operations and the speed and extent of the recovery across the broader travel ecosystem, dependency on transaction volumes in the global travel industry, particularly air travel transaction volumes, including from airlines' insolvency, suspension of service or aircraft groundings, the effect of cost savings initiatives, the timing, implementation and effects of the technology investment and other strategic initiatives, the completion and effects of travel platforms, travel suppliers' usage of alternative distribution models, exposure to pricing pressure in the Travel Solutions business, changes affecting travel supplier customers, maintenance of the integrity of our systems and infrastructure and the effect of any security breaches, failure to adapt to technological advancements, competition in the travel distribution market and solutions markets, implementation of software solutions, reliance on third parties to provide information technology services and the effects of these services, the execution, implementation and effects of new, amended or renewed agreements and strategic partnerships, including anticipated savings, dependence on establishing, maintaining and renewing contracts with customers and other counterparties and collecting amounts due to us under these agreements, dependence on relationships with travel buyers, our collection, processing, storage, use and transmission of personal data and risks associated with PCI compliance, our ability to recruit, train and retain employees, including our key executive officers and technical employees, the financial and business results and effects of acquisitions, the effects of any litigation and regulatory reviews and investigations, adverse global and regional economic and political conditions, including, but not limited to, economic conditions in countries or regions with traditionally high levels of exports to China or that have commodities-based economies and the effect of Brexit and uncertainty due to related negotiations, risks arising from global operations, reliance on the value of our brands, failure to comply with regulations, use of third-party distributor partners, the effects of the implementation of new accounting standards, and tax-related matters, including the effect of the Tax Cuts and Jobs Act. More information about potential risks and uncertainties that could affect our business and results of operations is included in the Risk Factors and “Forward-Looking Statements” sections in our Quarterly Report on Form 10-Q filed with the SEC on November 6, 2020, in our Annual Report on Form 10-K filed with the SEC on February 26, 2020 and in our other filings with the SEC. Although we believe that the expectations reflected in the forward-looking statements are reasonable, we cannot guarantee future events, outlook, guidance, results, actions, levels of activity, performance or achievements. Readers are cautioned not to place undue reliance on these forward-looking statements. Unless required by law, Sabre undertakes no obligation to publicly update or revise any forward-looking statements to reflect circumstances or events after the date they are made. Industry Data/Certain Definitions This presentation and accompanying comments contain industry data, forecasts and other information that we obtained from industry publications and surveys, public filings and internal company sources, and there can be no assurance as to the accuracy or completeness of the included information. Statements as to our ranking, market position, bookings share and market estimates are based on independent industry publications, government publications, third-party forecasts and management’s estimates and assumptions about our markets and our internal research. We have not independently verified this third-party information, nor have we ascertained the underlying economic assumptions relied upon in those sources, and we cannot assure you of the accuracy or completeness of this information. ©2020 Sabre GLBL Inc. All rights reserved. 2Forward-looking statements Forward-looking Statements Certain statements herein are forward-looking statements about trends, future events, uncertainties and our plans and expectations of what may happen in the future. Any statements that are not historical or current facts are forward-looking statements. In many cases, you can identify forward-looking statements by terms such as expect, believe, “tomorrow,” position, guidance, outlook, “hope,” “estimate, project, anticipate, will, continue, commit, may,” “should,” “would,” “intend, “potential,” long-term, growth, results or the negative of these terms or other comparable terminology. Forward-looking statements involve known and unknown risks, uncertainties and other factors that may cause Sabre’s actual results, performance or achievements to be materially different from any future results, performances or achievements expressed or implied by the forward-looking statements. The potential risks and uncertainties include, among others, the severity, extent and duration of the global COVID-19 pandemic and its impact on our business and results of operations, financial condition and credit ratings, as well as on the travel industry and consumer spending more broadly, the actions taken to contain the disease or treat its impact, the effect of remote working arrangements on our operations and the speed and extent of the recovery across the broader travel ecosystem, dependency on transaction volumes in the global travel industry, particularly air travel transaction volumes, including from airlines' insolvency, suspension of service or aircraft groundings, the effect of cost savings initiatives, the timing, implementation and effects of the technology investment and other strategic initiatives, the completion and effects of travel platforms, travel suppliers' usage of alternative distribution models, exposure to pricing pressure in the Travel Solutions business, changes affecting travel supplier customers, maintenance of the integrity of our systems and infrastructure and the effect of any security breaches, failure to adapt to technological advancements, competition in the travel distribution market and solutions markets, implementation of software solutions, reliance on third parties to provide information technology services and the effects of these services, the execution, implementation and effects of new, amended or renewed agreements and strategic partnerships, including anticipated savings, dependence on establishing, maintaining and renewing contracts with customers and other counterparties and collecting amounts due to us under these agreements, dependence on relationships with travel buyers, our collection, processing, storage, use and transmission of personal data and risks associated with PCI compliance, our ability to recruit, train and retain employees, including our key executive officers and technical employees, the financial and business results and effects of acquisitions, the effects of any litigation and regulatory reviews and investigations, adverse global and regional economic and political conditions, including, but not limited to, economic conditions in countries or regions with traditionally high levels of exports to China or that have commodities-based economies and the effect of Brexit and uncertainty due to related negotiations, risks arising from global operations, reliance on the value of our brands, failure to comply with regulations, use of third-party distributor partners, the effects of the implementation of new accounting standards, and tax-related matters, including the effect of the Tax Cuts and Jobs Act. More information about potential risks and uncertainties that could affect our business and results of operations is included in the Risk Factors and “Forward-Looking Statements” sections in our Quarterly Report on Form 10-Q filed with the SEC on November 6, 2020, in our Annual Report on Form 10-K filed with the SEC on February 26, 2020 and in our other filings with the SEC. Although we believe that the expectations reflected in the forward-looking statements are reasonable, we cannot guarantee future events, outlook, guidance, results, actions, levels of activity, performance or achievements. Readers are cautioned not to place undue reliance on these forward-looking statements. Unless required by law, Sabre undertakes no obligation to publicly update or revise any forward-looking statements to reflect circumstances or events after the date they are made. Industry Data/Certain Definitions This presentation and accompanying comments contain industry data, forecasts and other information that we obtained from industry publications and surveys, public filings and internal company sources, and there can be no assurance as to the accuracy or completeness of the included information. Statements as to our ranking, market position, bookings share and market estimates are based on independent industry publications, government publications, third-party forecasts and management’s estimates and assumptions about our markets and our internal research. We have not independently verified this third-party information, nor have we ascertained the underlying economic assumptions relied upon in those sources, and we cannot assure you of the accuracy or completeness of this information. ©2020 Sabre GLBL Inc. All rights reserved. 2

Today’s presenter Doug Barnett EVP & CFO ©2020 Sabre GLBL Inc. All rights reserved. 3Today’s presenter Doug Barnett EVP & CFO ©2020 Sabre GLBL Inc. All rights reserved. 3
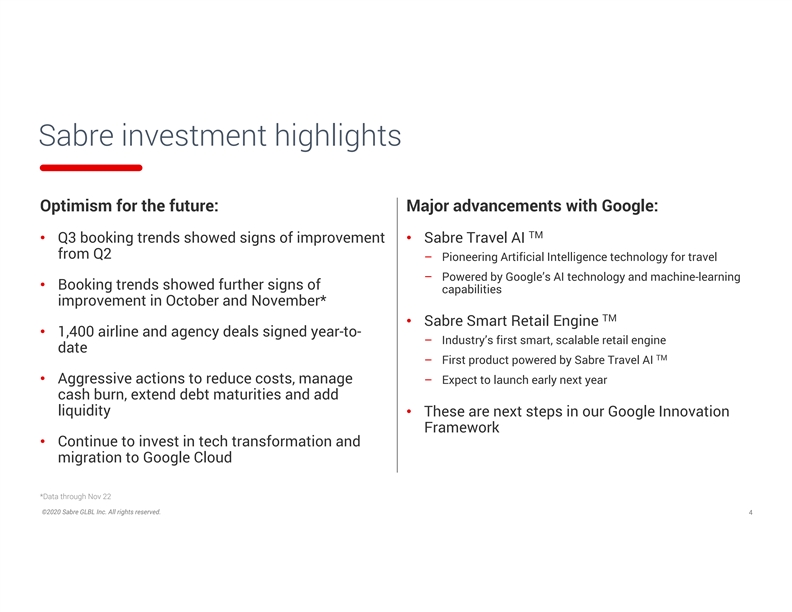
Sabre investment highlights Optimism for the future: Major advancements with Google: TM • Q3 booking trends showed signs of improvement • Sabre Travel AI from Q2 – Pioneering Artificial Intelligence technology for travel – Powered by Google’s AI technology and machine-learning • Booking trends showed further signs of capabilities improvement in October and November* TM • Sabre Smart Retail Engine • 1,400 airline and agency deals signed year-to- – Industry’s first smart, scalable retail engine date TM – First product powered by Sabre Travel AI • Aggressive actions to reduce costs, manage – Expect to launch early next year cash burn, extend debt maturities and add liquidity • These are next steps in our Google Innovation Framework • Continue to invest in tech transformation and migration to Google Cloud *Data through Nov 22 ©2020 Sabre GLBL Inc. All rights reserved. 4Sabre investment highlights Optimism for the future: Major advancements with Google: TM • Q3 booking trends showed signs of improvement • Sabre Travel AI from Q2 – Pioneering Artificial Intelligence technology for travel – Powered by Google’s AI technology and machine-learning • Booking trends showed further signs of capabilities improvement in October and November* TM • Sabre Smart Retail Engine • 1,400 airline and agency deals signed year-to- – Industry’s first smart, scalable retail engine date TM – First product powered by Sabre Travel AI • Aggressive actions to reduce costs, manage – Expect to launch early next year cash burn, extend debt maturities and add liquidity • These are next steps in our Google Innovation Framework • Continue to invest in tech transformation and migration to Google Cloud *Data through Nov 22 ©2020 Sabre GLBL Inc. All rights reserved. 4
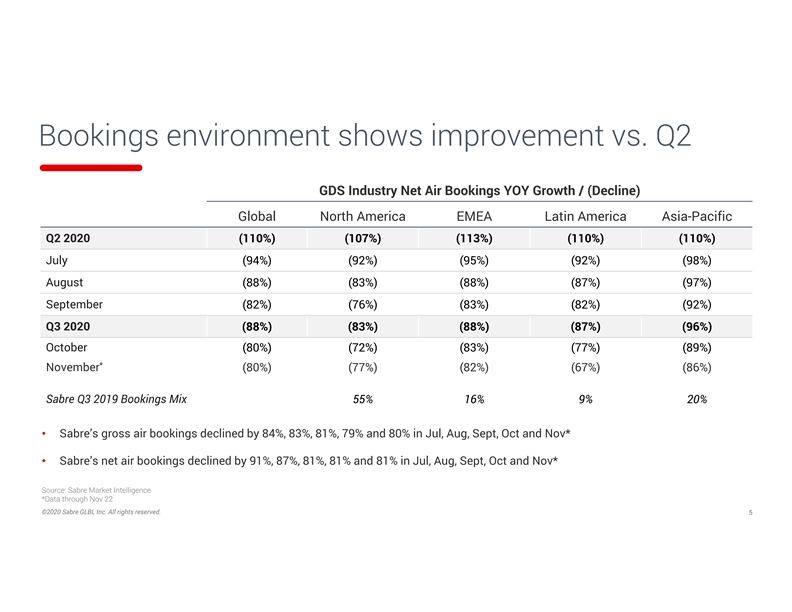
Bookings environment shows improvement vs. Q2 GDS Industry Net Air Bookings YOY Growth / (Decline) Global North America EMEA Latin America Asia-Pacific Q2 2020 (110%) (107%) (113%) (110%) (110%) July (94%) (92%) (95%) (92%) (98%) August (88%) (83%) (88%) (87%) (97%) September (82%) (76%) (83%) (82%) (92%) Q3 2020 (88%) (83%) (88%) (87%) (96%) October (80%) (72%) (83%) (77%) (89%) * November (80%) (77%) (82%) (67%) (86%) Sabre Q3 2019 Bookings Mix 55% 16% 9% 20% • Sabre’s gross air bookings declined by 84%, 83%, 81%, 79% and 80% in Jul, Aug, Sept, Oct and Nov* • Sabre’s net air bookings declined by 91%, 87%, 81%, 81% and 81% in Jul, Aug, Sept, Oct and Nov* Source: Sabre Market Intelligence *Data through Nov 22 ©2020 Sabre GLBL Inc. All rights reserved. 5Bookings environment shows improvement vs. Q2 GDS Industry Net Air Bookings YOY Growth / (Decline) Global North America EMEA Latin America Asia-Pacific Q2 2020 (110%) (107%) (113%) (110%) (110%) July (94%) (92%) (95%) (92%) (98%) August (88%) (83%) (88%) (87%) (97%) September (82%) (76%) (83%) (82%) (92%) Q3 2020 (88%) (83%) (88%) (87%) (96%) October (80%) (72%) (83%) (77%) (89%) * November (80%) (77%) (82%) (67%) (86%) Sabre Q3 2019 Bookings Mix 55% 16% 9% 20% • Sabre’s gross air bookings declined by 84%, 83%, 81%, 79% and 80% in Jul, Aug, Sept, Oct and Nov* • Sabre’s net air bookings declined by 91%, 87%, 81%, 81% and 81% in Jul, Aug, Sept, Oct and Nov* Source: Sabre Market Intelligence *Data through Nov 22 ©2020 Sabre GLBL Inc. All rights reserved. 5
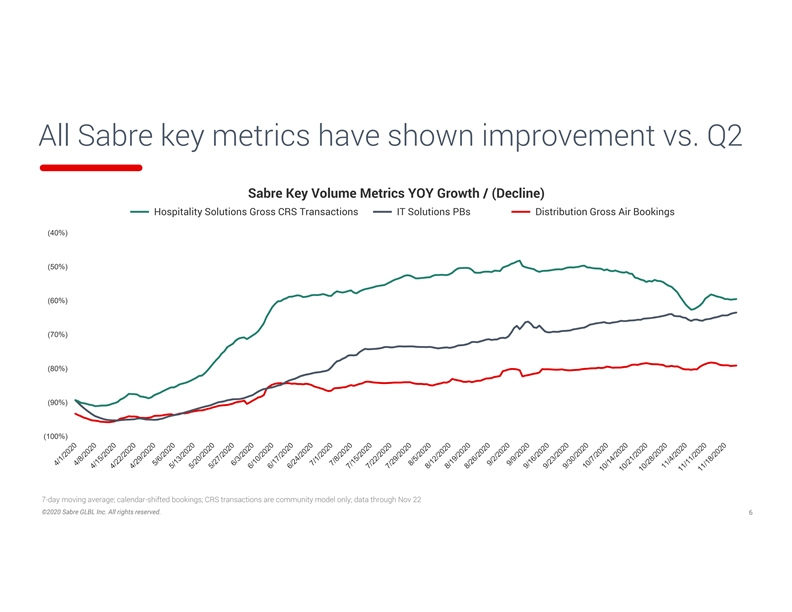
All Sabre key metrics have shown improvement vs. Q2 Sabre Key Volume Metrics YOY Growth / (Decline) Hospitality Solutions Gross CRS Transactions IT Solutions PBs Distribution Gross Air Bookings (40%) (50%) (60%) (70%) (80%) (90%) (100%) 7-day moving average; calendar-shifted bookings; CRS transactions are community model only; data through Nov 22 ©2020 Sabre GLBL Inc. All rights reserved. 6All Sabre key metrics have shown improvement vs. Q2 Sabre Key Volume Metrics YOY Growth / (Decline) Hospitality Solutions Gross CRS Transactions IT Solutions PBs Distribution Gross Air Bookings (40%) (50%) (60%) (70%) (80%) (90%) (100%) 7-day moving average; calendar-shifted bookings; CRS transactions are community model only; data through Nov 22 ©2020 Sabre GLBL Inc. All rights reserved. 6
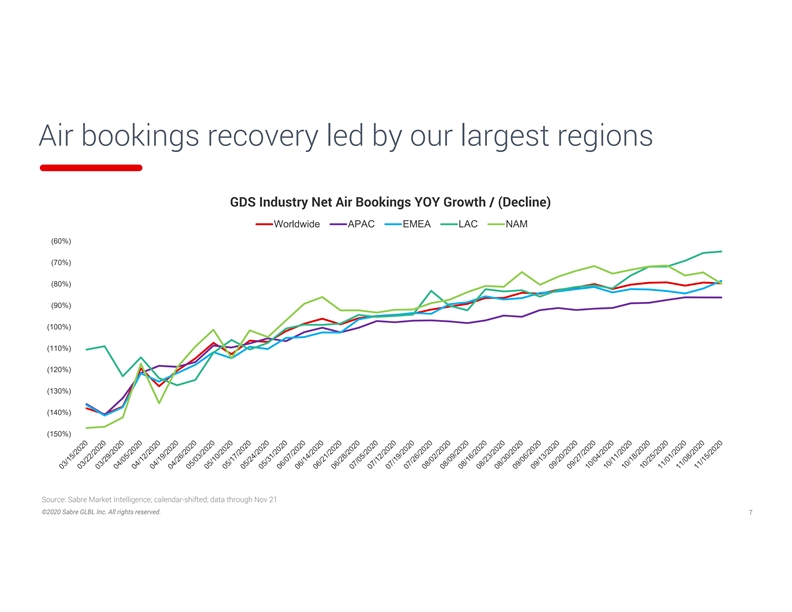
Air bookings recovery led by our largest regions GDS Industry Net Air Bookings YOY Growth / (Decline) Worldwide APAC EMEA LAC NAM (60%) (70%) (80%) (90%) (100%) (110%) (120%) (130%) (140%) (150%) Source: Sabre Market Intelligence; calendar-shifted; data through Nov 21 ©2020 Sabre GLBL Inc. All rights reserved. 7Air bookings recovery led by our largest regions GDS Industry Net Air Bookings YOY Growth / (Decline) Worldwide APAC EMEA LAC NAM (60%) (70%) (80%) (90%) (100%) (110%) (120%) (130%) (140%) (150%) Source: Sabre Market Intelligence; calendar-shifted; data through Nov 21 ©2020 Sabre GLBL Inc. All rights reserved. 7
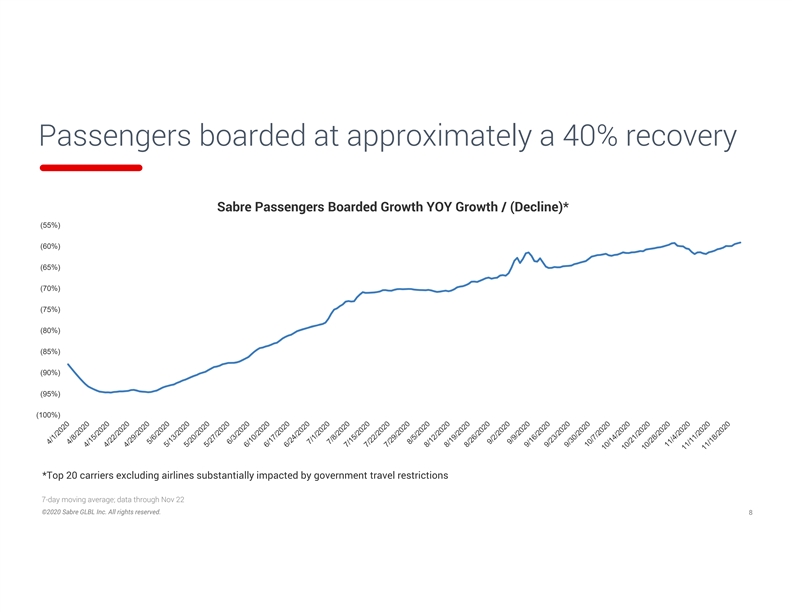
Passengers boarded at approximately a 40% recovery Sabre Passengers Boarded Growth YOY Growth / (Decline)* (55%) (60%) (65%) (70%) (75%) (80%) (85%) (90%) (95%) (100%) *Top 20 carriers excluding airlines substantially impacted by government travel restrictions 7-day moving average; data through Nov 22 ©2020 Sabre GLBL Inc. All rights reserved. 8Passengers boarded at approximately a 40% recovery Sabre Passengers Boarded Growth YOY Growth / (Decline)* (55%) (60%) (65%) (70%) (75%) (80%) (85%) (90%) (95%) (100%) *Top 20 carriers excluding airlines substantially impacted by government travel restrictions 7-day moving average; data through Nov 22 ©2020 Sabre GLBL Inc. All rights reserved. 8
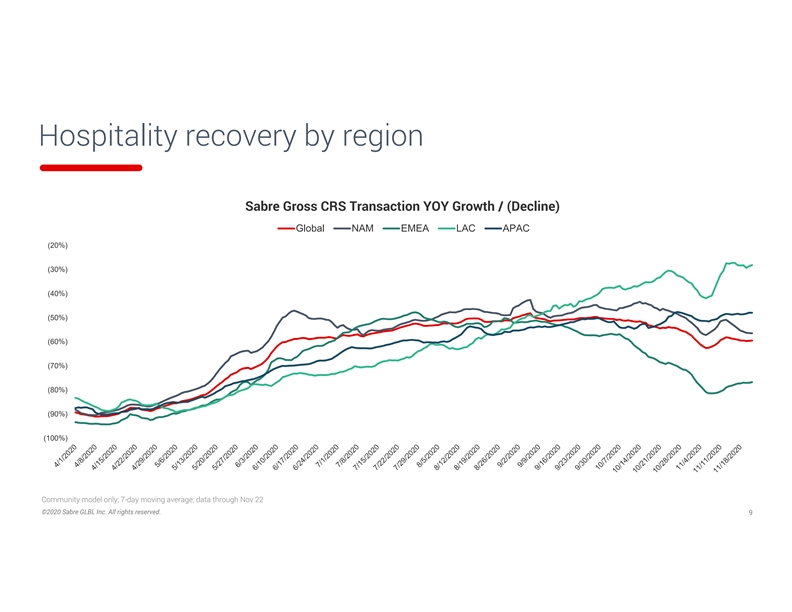
Hospitality recovery by region Sabre Gross CRS Transaction YOY Growth / (Decline) Global NAM EMEA LAC APAC (20%) (30%) (40%) (50%) (60%) (70%) (80%) (90%) (100%) Community model only; 7-day moving average; data through Nov 22 ©2020 Sabre GLBL Inc. All rights reserved. 9Hospitality recovery by region Sabre Gross CRS Transaction YOY Growth / (Decline) Global NAM EMEA LAC APAC (20%) (30%) (40%) (50%) (60%) (70%) (80%) (90%) (100%) Community model only; 7-day moving average; data through Nov 22 ©2020 Sabre GLBL Inc. All rights reserved. 9
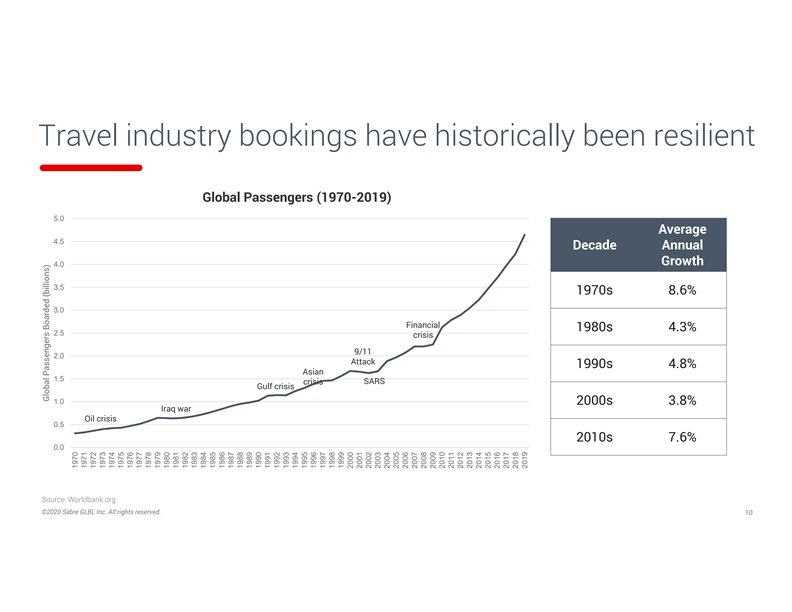
Travel industry bookings have historically been resilient Global Passengers (1970-2019) 5.0 Average 4.5 Decade Annual Growth 4.0 3.5 1970s 8.6% 3.0 Financial 1980s 4.3% 2.5 crisis 9/11 2.0 Attack 1990s 4.8% Asian 1.5 SARS crisis Gulf crisis 1.0 2000s 3.8% Iraq war Oil crisis 0.5 2010s 7.6% 0.0 Source: Worldbank.org ©2020 Sabre GLBL Inc. All rights reserved. 10 Global Passengers Boarded (billions) 1970 1971 1972 1973 1974 1975 1976 1977 1978 1979 1980 1981 1982 1983 1984 1985 1986 1987 1988 1989 1990 1991 1992 1993 1994 1995 1996 1997 1998 1999 2000 2001 2002 2003 2004 2005 2006 2007 2008 2009 2010 2011 2012 2013 2014 2015 2016 2017 2018 2019Travel industry bookings have historically been resilient Global Passengers (1970-2019) 5.0 Average 4.5 Decade Annual Growth 4.0 3.5 1970s 8.6% 3.0 Financial 1980s 4.3% 2.5 crisis 9/11 2.0 Attack 1990s 4.8% Asian 1.5 SARS crisis Gulf crisis 1.0 2000s 3.8% Iraq war Oil crisis 0.5 2010s 7.6% 0.0 Source: Worldbank.org ©2020 Sabre GLBL Inc. All rights reserved. 10 Global Passengers Boarded (billions) 1970 1971 1972 1973 1974 1975 1976 1977 1978 1979 1980 1981 1982 1983 1984 1985 1986 1987 1988 1989 1990 1991 1992 1993 1994 1995 1996 1997 1998 1999 2000 2001 2002 2003 2004 2005 2006 2007 2008 2009 2010 2011 2012 2013 2014 2015 2016 2017 2018 2019
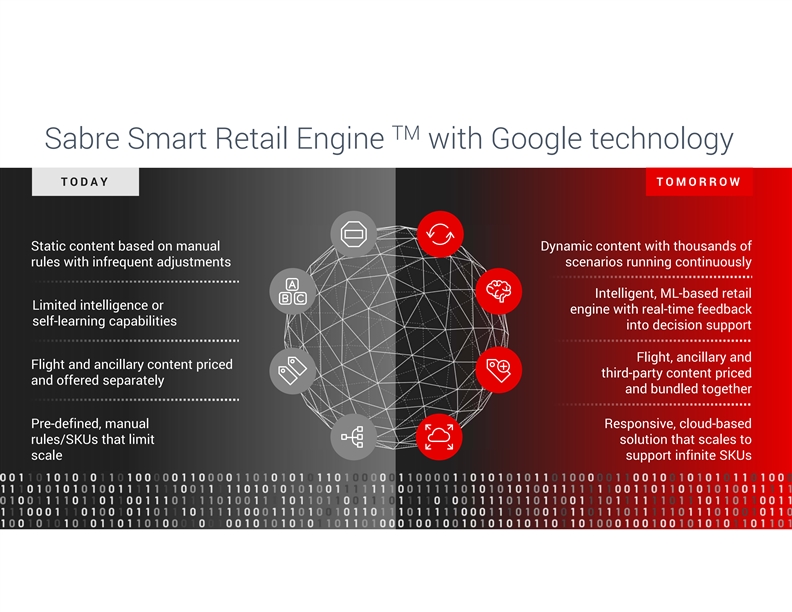
TM Sabre Smart Retail Engine with Google technology TODAY TOMORROW Static content based on manual Dynamic content with thousands of rules with infrequent adjustments scenarios running continuously Intelligent, ML-based retail Limited intelligence or engine with real-time feedback self-learning capabilities into decision support Flight, ancillary and Flight and ancillary content priced third-party content priced and offered separately and bundled together Pre-defined, manual Responsive, cloud-based rules/SKUs that limit solution that scales to scale support infinite SKUsTM Sabre Smart Retail Engine with Google technology TODAY TOMORROW Static content based on manual Dynamic content with thousands of rules with infrequent adjustments scenarios running continuously Intelligent, ML-based retail Limited intelligence or engine with real-time feedback self-learning capabilities into decision support Flight, ancillary and Flight and ancillary content priced third-party content priced and offered separately and bundled together Pre-defined, manual Responsive, cloud-based rules/SKUs that limit solution that scales to scale support infinite SKUs
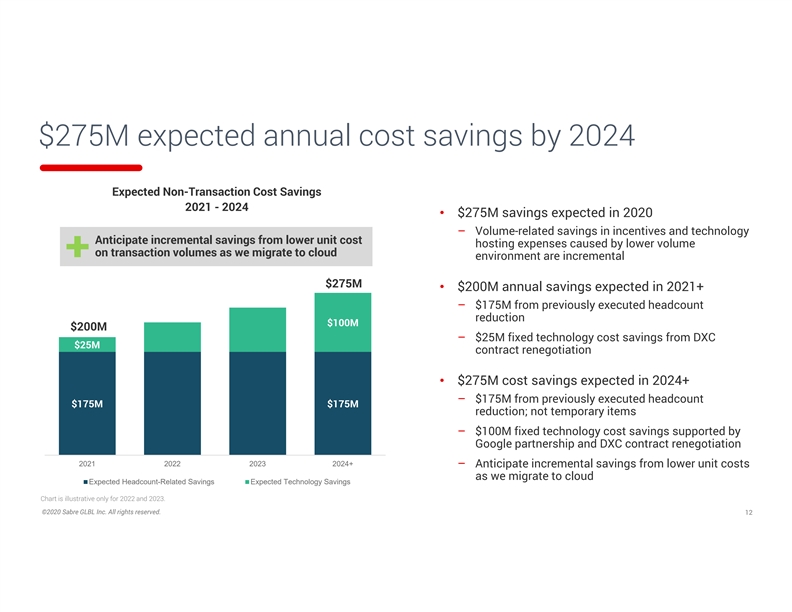
$275M expected annual cost savings by 2024 Expected Non-Transaction Cost Savings 2021 - 2024 • $275M savings expected in 2020 – Volume-related savings in incentives and technology Anticipate incremental savings from lower unit cost hosting expenses caused by lower volume on transaction volumes as we migrate to cloud environment are incremental $275M • $200M annual savings expected in 2021+ – $175M from previously executed headcount reduction $100M $200M – $25M fixed technology cost savings from DXC $25M contract renegotiation • $275M cost savings expected in 2024+ – $175M from previously executed headcount $175M $175M reduction; not temporary items – $100M fixed technology cost savings supported by Google partnership and DXC contract renegotiation 2021 2022 2023 2024+ – Anticipate incremental savings from lower unit costs as we migrate to cloud Expected Headcount-Related Savings Expected Technology Savings Chart is illustrative only for 2022 and 2023. ©2020 Sabre GLBL Inc. All rights reserved. 12$275M expected annual cost savings by 2024 Expected Non-Transaction Cost Savings 2021 - 2024 • $275M savings expected in 2020 – Volume-related savings in incentives and technology Anticipate incremental savings from lower unit cost hosting expenses caused by lower volume on transaction volumes as we migrate to cloud environment are incremental $275M • $200M annual savings expected in 2021+ – $175M from previously executed headcount reduction $100M $200M – $25M fixed technology cost savings from DXC $25M contract renegotiation • $275M cost savings expected in 2024+ – $175M from previously executed headcount $175M $175M reduction; not temporary items – $100M fixed technology cost savings supported by Google partnership and DXC contract renegotiation 2021 2022 2023 2024+ – Anticipate incremental savings from lower unit costs as we migrate to cloud Expected Headcount-Related Savings Expected Technology Savings Chart is illustrative only for 2022 and 2023. ©2020 Sabre GLBL Inc. All rights reserved. 12
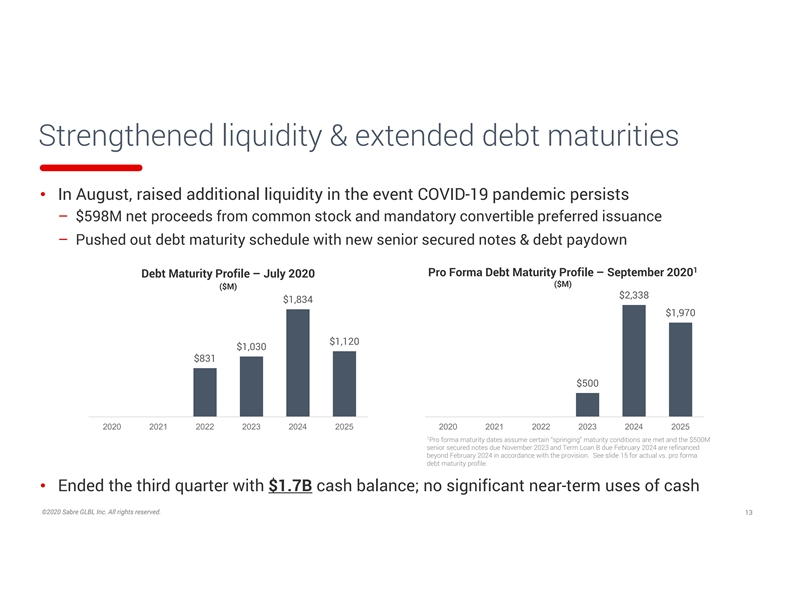
Strengthened liquidity & extended debt maturities • In August, raised additional liquidity in the event COVID-19 pandemic persists – $598M net proceeds from common stock and mandatory convertible preferred issuance – Pushed out debt maturity schedule with new senior secured notes & debt paydown 1 Pro Forma Debt Maturity Profile – September 2020 Debt Maturity Profile – July 2020 ($M) ($M) $2,338 $1,834 $1,970 $1,120 $1,030 $831 $500 2020 2021 2022 2023 2024 2025 2020 2021 2022 2023 2024 2025 1 Pro forma maturity dates assume certain “springing” maturity conditions are met and the $500M senior secured notes due November 2023 and Term Loan B due February 2024 are refinanced beyond February 2024 in accordance with the provision. See slide 15 for actual vs. pro forma debt maturity profile. • Ended the third quarter with $1.7B cash balance; no significant near-term uses of cash ©2020 Sabre GLBL Inc. All rights reserved. 13Strengthened liquidity & extended debt maturities • In August, raised additional liquidity in the event COVID-19 pandemic persists – $598M net proceeds from common stock and mandatory convertible preferred issuance – Pushed out debt maturity schedule with new senior secured notes & debt paydown 1 Pro Forma Debt Maturity Profile – September 2020 Debt Maturity Profile – July 2020 ($M) ($M) $2,338 $1,834 $1,970 $1,120 $1,030 $831 $500 2020 2021 2022 2023 2024 2025 2020 2021 2022 2023 2024 2025 1 Pro forma maturity dates assume certain “springing” maturity conditions are met and the $500M senior secured notes due November 2023 and Term Loan B due February 2024 are refinanced beyond February 2024 in accordance with the provision. See slide 15 for actual vs. pro forma debt maturity profile. • Ended the third quarter with $1.7B cash balance; no significant near-term uses of cash ©2020 Sabre GLBL Inc. All rights reserved. 13

Thank youThank you
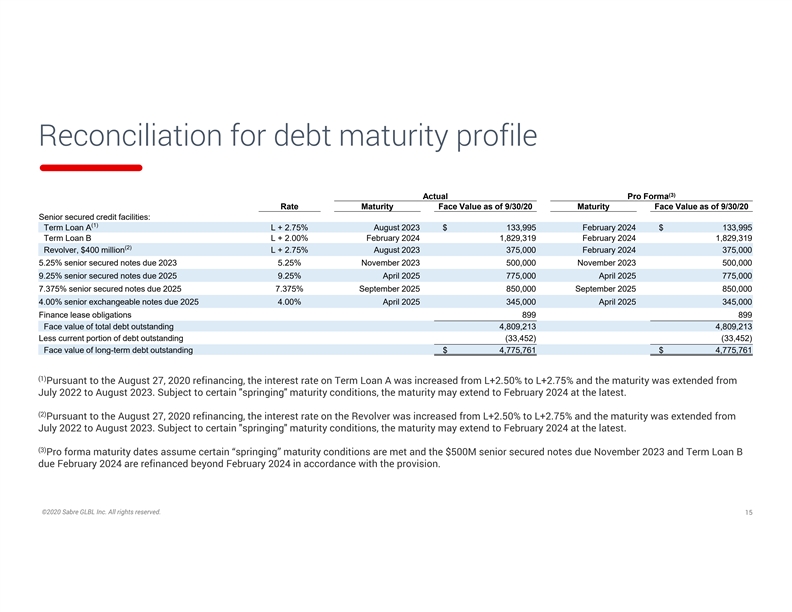
Reconciliation for debt maturity profile (3) Actual Pro Forma Rate Maturity Face Value as of 9/30/20 Maturity Face Value as of 9/30/20 Senior secured credit facilities: (1) Term Loan A L + 2.75% August 2023 $ 133,995 February 2024 $ 133,995 Term Loan B L + 2.00% February 2024 1,829,319 February 2024 1,829,319 (2) Revolver, $400 million L + 2.75% August 2023 375,000 February 2024 375,000 5.25% senior secured notes due 2023 5.25% November 2023 500,000 November 2023 500,000 9.25% senior secured notes due 2025 9.25% April 2025 775,000 April 2025 775,000 7.375% senior secured notes due 2025 7.375% September 2025 850,000 September 2025 850,000 4.00% senior exchangeable notes due 2025 4.00% April 2025 345,000 April 2025 345,000 Finance lease obligations 899 899 Face value of total debt outstanding 4,809,213 4,809,213 Less current portion of debt outstanding (33,452) (33,452) Face value of long-term debt outstanding $ 4,775,761 $ 4,775,761 (1) Pursuant to the August 27, 2020 refinancing, the interest rate on Term Loan A was increased from L+2.50% to L+2.75% and the maturity was extended from July 2022 to August 2023. Subject to certain springing maturity conditions, the maturity may extend to February 2024 at the latest. (2) Pursuant to the August 27, 2020 refinancing, the interest rate on the Revolver was increased from L+2.50% to L+2.75% and the maturity was extended from July 2022 to August 2023. Subject to certain springing maturity conditions, the maturity may extend to February 2024 at the latest. (3) Pro forma maturity dates assume certain “springing” maturity conditions are met and the $500M senior secured notes due November 2023 and Term Loan B due February 2024 are refinanced beyond February 2024 in accordance with the provision. ©2020 Sabre GLBL Inc. All rights reserved. 15Reconciliation for debt maturity profile (3) Actual Pro Forma Rate Maturity Face Value as of 9/30/20 Maturity Face Value as of 9/30/20 Senior secured credit facilities: (1) Term Loan A L + 2.75% August 2023 $ 133,995 February 2024 $ 133,995 Term Loan B L + 2.00% February 2024 1,829,319 February 2024 1,829,319 (2) Revolver, $400 million L + 2.75% August 2023 375,000 February 2024 375,000 5.25% senior secured notes due 2023 5.25% November 2023 500,000 November 2023 500,000 9.25% senior secured notes due 2025 9.25% April 2025 775,000 April 2025 775,000 7.375% senior secured notes due 2025 7.375% September 2025 850,000 September 2025 850,000 4.00% senior exchangeable notes due 2025 4.00% April 2025 345,000 April 2025 345,000 Finance lease obligations 899 899 Face value of total debt outstanding 4,809,213 4,809,213 Less current portion of debt outstanding (33,452) (33,452) Face value of long-term debt outstanding $ 4,775,761 $ 4,775,761 (1) Pursuant to the August 27, 2020 refinancing, the interest rate on Term Loan A was increased from L+2.50% to L+2.75% and the maturity was extended from July 2022 to August 2023. Subject to certain springing maturity conditions, the maturity may extend to February 2024 at the latest. (2) Pursuant to the August 27, 2020 refinancing, the interest rate on the Revolver was increased from L+2.50% to L+2.75% and the maturity was extended from July 2022 to August 2023. Subject to certain springing maturity conditions, the maturity may extend to February 2024 at the latest. (3) Pro forma maturity dates assume certain “springing” maturity conditions are met and the $500M senior secured notes due November 2023 and Term Loan B due February 2024 are refinanced beyond February 2024 in accordance with the provision. ©2020 Sabre GLBL Inc. All rights reserved. 15