Attached files
| file | filename |
|---|---|
| 8-K - 8-K - NEW YORK COMMUNITY BANCORP INC | d17538d8k.htm |
Loan Deferrals Update November 30, 2020 Exhibit 99.1
Forward-Looking Information This presentation may include forward‐looking statements by the Company and our authorized officers pertaining to such matters as our goals, intentions, and expectations regarding revenues, earnings, loan production, asset quality, capital levels, and acquisitions, among other matters; our estimates of future costs and benefits of the actions we may take; our assessments of probable losses on loans; our assessments of interest rate and other market risks; and our ability to achieve our financial and other strategic goals. Forward‐looking statements are typically identified by such words as “believe,” “expect,” “anticipate,” “intend,” “outlook,” “estimate,” “forecast,” “project,” “should,” and other similar words and expressions, and are subject to numerous assumptions, risks, and uncertainties, which change over time. Additionally, forward‐looking statements speak only as of the date they are made; the Company does not assume any duty, and does not undertake, to update our forward‐looking statements. Furthermore, because forward‐looking statements are subject to assumptions and uncertainties, actual results or future events could differ, possibly materially, from those anticipated in our statements, and our future performance could differ materially from our historical results. Our forward‐looking statements are subject to the following principal risks and uncertainties: the effect of the COVID-19 pandemic, including the length of time that the pandemic continues, the potential imposition of future shelter in place orders or additional restrictions on travel in the future, the effect of the pandemic on the general economy and on the businesses of our borrowers and their ability to make payments on their obligation, the remedial actions and stimulus measures adopted by federal, state, and local governments; the inability of employees to work due to illness, quarantine, or government mandates; general economic conditions and trends, either nationally or locally; conditions in the securities markets; changes in interest rates; changes in deposit flows, and in the demand for deposit, loan, and investment products and other financial services; changes in real estate values; changes in the quality or composition of our loan or investment portfolios; changes in competitive pressures among financial institutions or from non‐financial institutions; our ability to obtain the necessary shareholder and regulatory approvals of any acquisitions we may propose; our ability to successfully integrate any assets, liabilities, customers, systems, and management personnel we may acquire into our operations, and our ability to realize related revenue synergies and cost savings within expected time frames; changes in legislation, regulations, and policies; the impact of recently adopted accounting pronouncements; and a variety of other matters which, by their nature, are subject to significant uncertainties and/or are beyond our control. More information regarding some of these factors is provided in the Risk Factors section of our Form 10‐K for the year ended December 31, 2019 and in other SEC reports we file. Our forward‐looking statements may also be subject to other risks and uncertainties, including those we may discuss in this presentation, or in our SEC filings, which are accessible on our website and at the SEC’s website, www.sec.gov. Our Supplemental Use of Non-GAAP Financial Measures This presentation may contain certain non-GAAP financial measures which management believes to be useful to investors in understanding the Company’s performance and financial condition, and in comparing our performance and financial condition with those of other banks. Such non-GAAP financial measures are supplemental to, and are not to be considered in isolation or as a substitute for, measures calculated in accordance with GAAP. Cautionary Statements
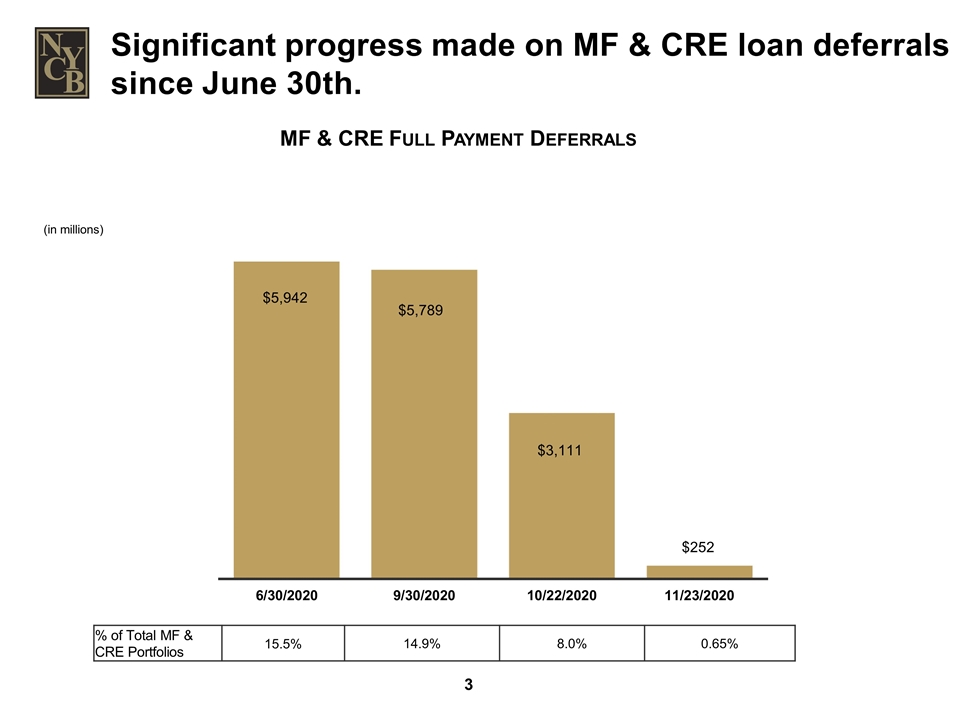
MF & CRE Full Payment Deferrals (in millions) % of Total MF & CRE Portfolios 15.5% 14.9% 8.0% 0.65% Significant progress made on MF & CRE loan deferrals since June 30th.
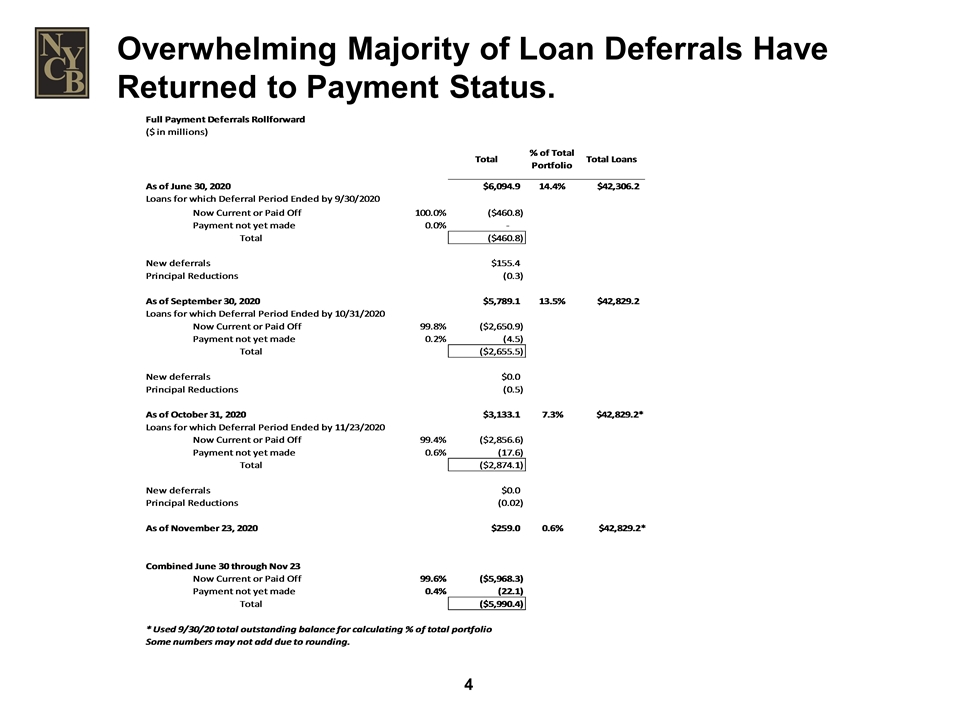
Overwhelming Majority of Loan Deferrals Have Returned to Payment Status.
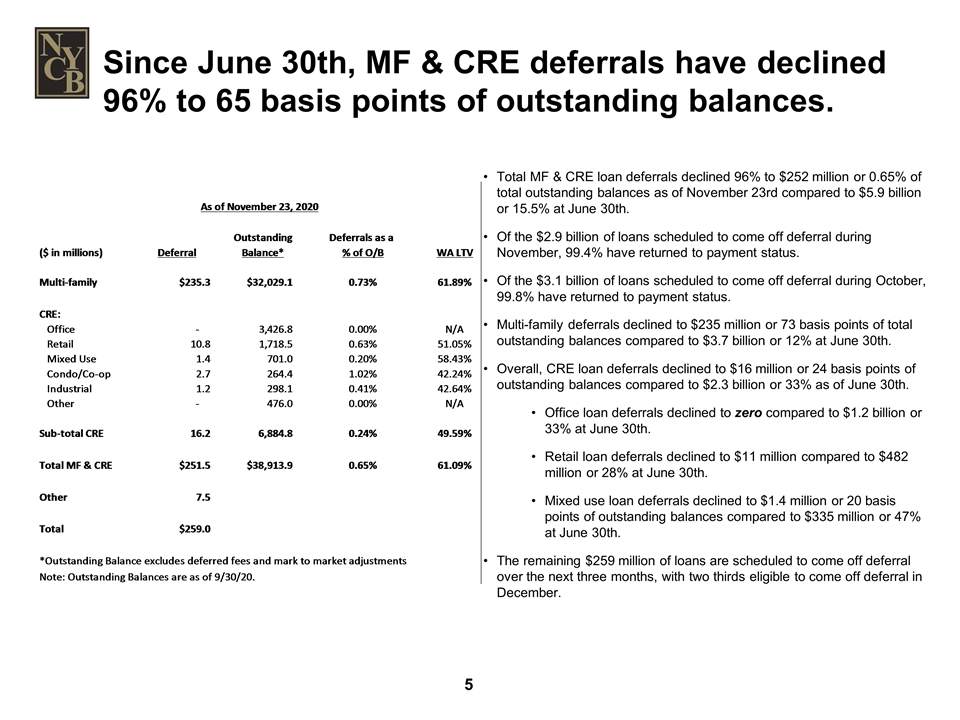
Since June 30th, MF & CRE deferrals have declined 96% to 65 basis points of outstanding balances. Total MF & CRE loan deferrals declined 96% to $252 million or 0.65% of total outstanding balances as of November 23rd compared to $5.9 billion or 15.5% at June 30th. Of the $2.9 billion of loans scheduled to come off deferral during November, 99.4% have returned to payment status. Of the $3.1 billion of loans scheduled to come off deferral during October, 99.8% have returned to payment status. Multi-family deferrals declined to $235 million or 73 basis points of total outstanding balances compared to $3.7 billion or 12% at June 30th. Overall, CRE loan deferrals declined to $16 million or 24 basis points of outstanding balances compared to $2.3 billion or 33% as of June 30th. Office loan deferrals declined to zero compared to $1.2 billion or 33% at June 30th. Retail loan deferrals declined to $11 million compared to $482 million or 28% at June 30th. Mixed use loan deferrals declined to $1.4 million or 20 basis points of outstanding balances compared to $335 million or 47% at June 30th. The remaining $259 million of loans are scheduled to come off deferral over the next three months, with two thirds eligible to come off deferral in December. As of November 23, 2020 Outstanding Deferrals as a ($ in millions) Deferral Balance* % of O/B WA LTV Multi-family $235.25886499999999 $32,029.104871219999 7.3451589092454993E-3 0.61885074858114286 CRE: Office 0 3,426.7571085699992 0 N/A Retail 10.846118000000001 1,718.5212889300003 6.311308489377573E-3 0.51050416644923102 Mixed Use 1.4308289999999999 701.01000858999987 2.0410963930143394E-3 0.58434471337944638 Condo/Co-op 2.7035429999999998 264.44389276999999 1.0223503260676191E-2 0.4224 Industrial 1.2339690000000001 298.11048362000002 4.1393009229857688E-3 0.4264 Other 0 475.96888535999994 0 N/A Sub-total CRE 16.214458999999998 6,884.8116678400002 2.3551056706082748E-3 0.49592938842424528 Total MF & CRE $251.47332399999999 $38,913.916539059996 6.4622979737231703E-3 0.61092504368813294 Other 7.5073204500987458 Total $258.98064445009874 *Outstanding Balance excludes deferred fees and mark to market adjustments Note: Outstanding Balances are as of 9/30/20.
