Attached files
| file | filename |
|---|---|
| 8-K - 8-K - Silvergate Capital Corp | si-20201120.htm |

Exhibit 99.1 Silvergate Capital Corporation Investor Presentation Third Quarter 2020

1 5 0 Forward Looking Statements #010500 This presentation contains forward looking statements within the meaning of the Securities and Exchange Act of 1934, as amended, including statements of goals, intentions, and expectations as to future trends, plans, events or results of Company operations and policies and regarding general economic conditions. In some cases, forward-looking statements can be identified by use of words such as “may,” 41 “will,” “anticipates,” “believes,” “expects,” “plans,” “estimates,” “potential,” “continue,” “should,” and similar words or phrases. These statements are based upon current and anticipated economic conditions, nationally and in the Company’s market, interest rates and interest 42 rate policy, competitive factors and other conditions which by their nature, are not susceptible to accurate forecast and are subject to 44 significant uncertainty. For details on factors that could affect these expectations, see the risk factors and other cautionary language included in the Company’s periodic and current reports filed with the U.S. Securities and Exchange Commission. Because of these #292A2C uncertainties and the assumptions on which this discussion and the forward-looking statements are based, actual future operations and results may differ materially from those indicated herein. Readers are cautioned against placing undue reliance on any such forward-looking statements. The Company’s past results are not necessarily indicative of future performance. Further, given its ongoing and dynamic nature, 221 it is difficult to predict the full impact of the COVID-19 outbreak on our business. The extent of such impact will depend on future 228 developments, which are highly uncertain, including when the coronavirus can be controlled and abated and when and how the economy may be fully reopened. As the result of the COVID-19 pandemic and the related adverse local and national economic consequences, we 231 could be subject to any of the following risks, any of which could have a material, adverse effect on our business, financial condition, liquidity, #DDE4E7 #919498 and results of operations: the demand for our products and services may decline, making it difficult to grow assets and income; if the economy is unable to fully reopen as planned, and high levels of unemployment continue for an extended period of time, loan delinquencies, problem assets, and foreclosures may increase, resulting in increased charges and reduced income; collateral for loans, especially real estate, may decline in value, which could cause loan losses to increase; our allowance for loan losses may increase if borrowers experience 146 financial difficulties, which will adversely affect our net income; the net worth and liquidity of loan guarantors may decline, impairing their 183 ability to honor commitments to us; as the result of the decline in the Federal Reserve Board’s target federal funds rate to near 0%, the yield on our assets may decline to a greater extent than the decline in our cost of interest-bearing liabilities, reducing our net interest margin and 188 spread and reducing net income; our cyber security risks are increased as the result of an increase in the number of employees working #92B7BC remotely; and FDIC premiums may increase if the agency experiences additional resolution costs. The Company does not undertake to publicly revise or update forward-looking statements in this presentation to reflect events or circumstances that arise after the date of this presentation, except as may be required under applicable law. The Company makes no representation that subsequent to delivery of the presentation it was not altered. For the most current, accurate information, please refer to the investor relations section of the Company's 0 website at https://ir.silvergatebank.com. 175 220 Silvergate #00AFDC “Silvergate Bank” and its logos and other trademarks referred to and included in this presentation belong to us. Solely for convenience, we refer to our trademarks in this presentation without the ® or the ™ or symbols, but such references are not intended to indicate that we will not fully assert under applicable law our trademark rights. Other service marks, trademarks and trade names referred to in this presentation, 0 if any, are the property of their respective owners, although for presentational convenience we may not use the ® or the ™ symbols to identify such trademarks. In this presentation, we refer to Silvergate Capital Corporation as “Silvergate” or the “Company” and to Silvergate 107 Bank as the “Bank”. 183 #006BB7 2

1 5 0 Introduction #010500 Alan Lane, President and Chief Executive Officer • Over 35 years of corporate and financial institution leadership experience (11 years at Silvergate) 41 • Joined the Company in December 2008 and formerly held the positions of Director, President and Chief 42 Operating Officer of Southwest Community Bancorp; Vice-Chairman and Chief Executive Officer of Financial 44 Data Solutions, Inc. and President and Chief Executive Officer of Business Bank of California #292A2C • Served as President/Chief Executive Officer or Chief Financial Officer of both manufacturing and retail companies 221 228 Ben Reynolds, Executive Vice President, Corporate Development 231 • Over 20 years of product development, marketing, strategy, risk and accounting experience (4 years at #DDE4E7 #919498 Silvergate) • Joined the Company in January 2016 and formerly held the positions of Chief Marketing Officer of Carsinia Software, Chief Financial Officer of Henry Clay Motors, VP of Marketing and Product Management of HSBC and Senior Associate of KPMG 146 • Responsible for strategy, growth and delivering products to entrepreneurs within the digital currency, 183 blockchain and fintech ecosystem at Silvergate 188 #92B7BC Tony Martino, Chief Financial Officer • Joined the company in September 2019, brings 30 years of experience with 20 years in financial services and 0 10 years in public accounting with Ernst & Young. Tony is a Chartered Accountant. 175 • Most recently Chief Financial Officer at LendingPoint, a fintech lending platform that recently placed No. 17 on 220 Inc. magazine’s 37th annual ranking of the nation’s fastest growing companies • Spent 17 years with Citigroup, Inc. in various finance leadership roles across North America and EMEA #00AFDC regions, including Regional CFO in Central Europe, Country CFO in Turkey, and in Corporate Treasury in New York 0 107 183 #006BB7 3

1 5 0 Silvergate Overview #010500 Our Solutions and Services Business Model Our Customers 41 42 44 Silvergate Exchange Network Digital Currency Exchanges #292A2C Available 24/7, the SEN is a global Exchanges through which digital payments platform that enables currencies are bought and sold; real-time transfer of U.S. dollars includes OTC trading desks 221 between our digital currency 228 exchange customers and our 231 institutional investor customers #DDE4E7 #919498 Cash Management Solutions Institutional Investors 146 Enable customers to send, receive Hedge funds, venture capital and manage payments funds, private equity funds, family 183 offices and traditional asset 188 managers, which are investing in digital currencies as an asset class #92B7BC Deposit Account Services Other Customers 0 175 Maintain U.S. dollar deposits for Companies developing new our customers protocols, platforms and 220 applications; mining operations; #00AFDC and providers of other services We believe we are the leading provider of innovative financial infrastructure solutions and services 0 to participants in the nascent and expanding digital currency industry 107 183 #006BB7 4

1 5 0 Digital Currency Platform Growth #010500 Digital Currency Net Customer Growth Global Payments Platform Utilization (SEN Transfers) ($ in millions) 928 68,361 41 881 42 850 44 804 #292A2C 756 40,286 $36,663 31,405 221 $22,423 $17,372 228 12,312 14,400 231 #DDE4E7 $10,425 $9,607 #919498 3Q19 4Q19 1Q20 2Q20 3Q20 3Q19 4Q19 1Q20 2Q20 3Q20 SEN Transfer $ SEN Transaction # 146 183 Fee Income from Digital Currency Customers Commentary 188 ($ in thousands) • At September 30, 2020, digital currency customers #92B7BC $3,255 increased net 23% year over year to 928 • $36.7 billion of U.S. dollar transfers occurred on the SEN in 3Q20, an increase of 64% versus 2Q20 and 252% 0 $2,392 versus 3Q19 175 • 3Q20 fee income from digital currency customers 220 $1,700 $1,579 increased 36% versus 2Q20 and 106% versus 3Q19 #00AFDC $1,366 • At September 30, 2020, Silvergate had over 200 prospective digital currency customer leads in pipeline or 0 onboarding processes 107 183 3Q19 4Q19 1Q20 2Q20 3Q20 #006BB7 5

1 5 0 Investment Highlights #010500 Established and Rapidly Growing Customer Network 41 42 44 #292A2C Unique and Innovative API-enabled Payments and Technology Platform 221 228 231 #DDE4E7 Robust Compliance Framework #919498 146 183 Low-Cost Deposit Base and Low-Risk Asset Strategy 188 #92B7BC 0 Digital Currency Expansion Contributes to Attractive Risk-Adjusted Returns 175 220 #00AFDC Innovative Business with Multiple Growth Vectors 0 107 183 #006BB7 6
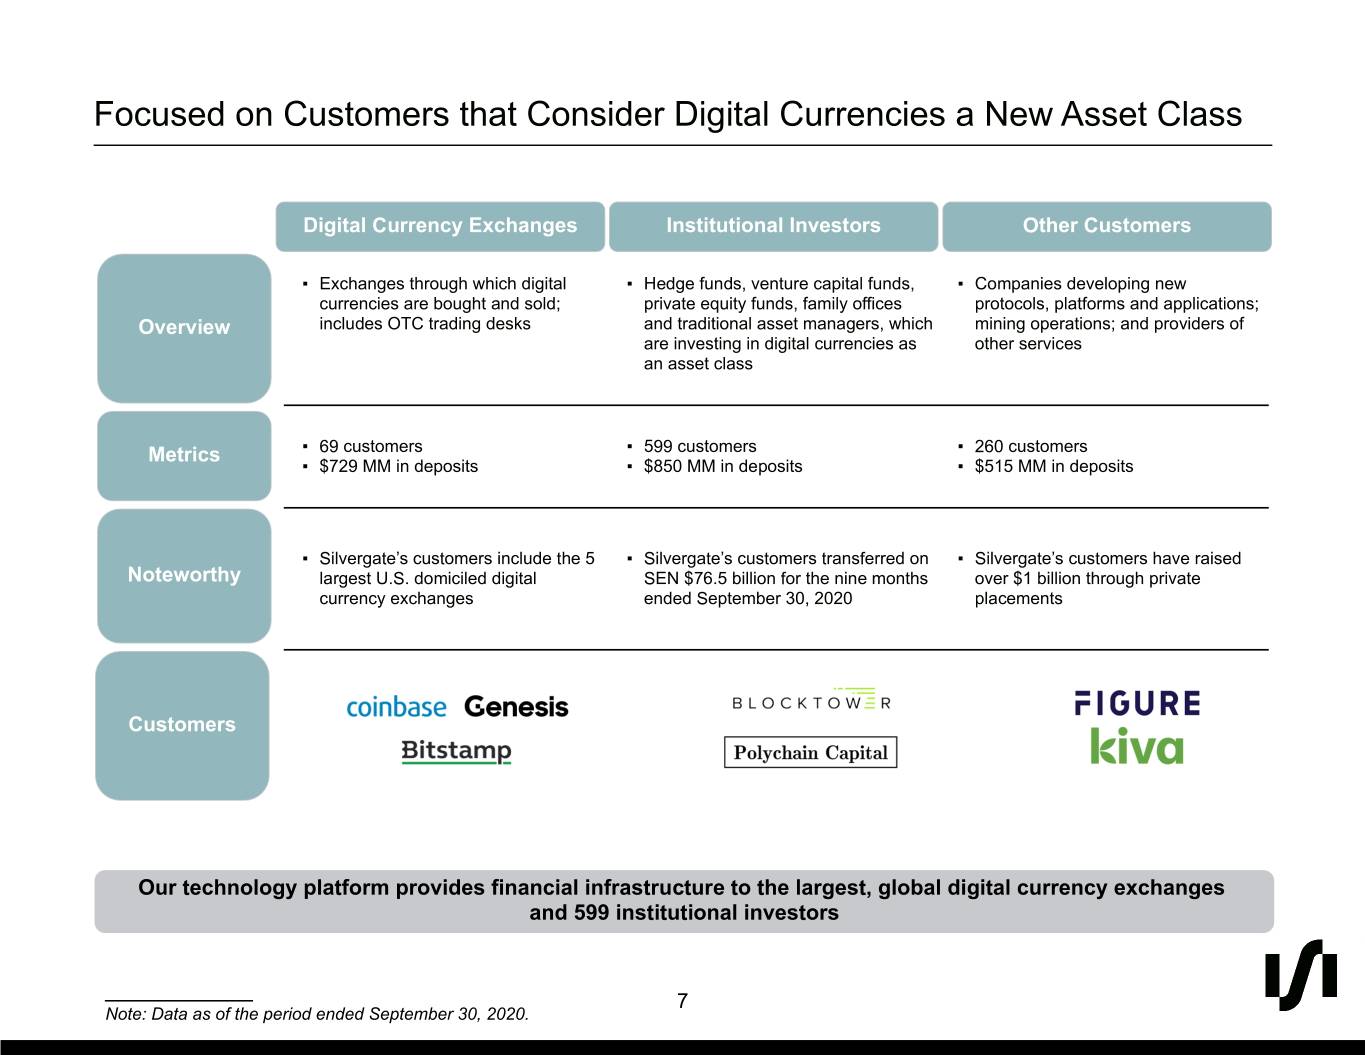
1 5 0 Focused on Customers that Consider Digital Currencies a New Asset Class #010500 41 Digital Currency Exchanges Institutional Investors Other Customers 42 44 ▪ Exchanges through which digital ▪ Hedge funds, venture capital funds, ▪ Companies developing new currencies are bought and sold; private equity funds, family offices protocols, platforms and applications; #292A2C Overview includes OTC trading desks and traditional asset managers, which mining operations; and providers of are investing in digital currencies as other services an asset class 221 228 Metrics ▪ 69 customers ▪ 599 customers ▪ 260 customers 231 ▪ $729 MM in deposits ▪ $850 MM in deposits ▪ $515 MM in deposits #DDE4E7 #919498 ▪ Silvergate’s customers include the 5 ▪ Silvergate’s customers transferred on ▪ Silvergate’s customers have raised 146 Noteworthy largest U.S. domiciled digital SEN $76.5 billion for the nine months over $1 billion through private 183 currency exchanges ended September 30, 2020 placements 188 #92B7BC Customers 0 175 220 #00AFDC Our technology platform provides financial infrastructure to the largest, global digital currency exchanges 0 and 599 institutional investors 107 183 ___________ 7 #006BB7 Note: Data as of the period ended September 30, 2020.

1 5 0 Customers were Previously Limited by Traditional Banking Services #010500 41 Counterparty Risk Liquidity Banking Friction 42 44 #292A2C Historical Customer Pain Points 221 228 231 #DDE4E7 Legacy Solution: Several Hour(s) to Several Day(s) Execution #919498 Institutional Traditional Clearing Traditional Institutional Investor Bank Bank Bank Investor send fiat send fiat 146 Digital via wire via wire Digital Currency Currency 183 Exchange Exchange 188 A B Sell bitcoin Buy bitcoin #92B7BC Only operates within the confines of traditional banking hours 0 175 220 #00AFDC Dependencies include internal process, time of day, holidays, geography and financial institution 0 107 183 #006BB7 8
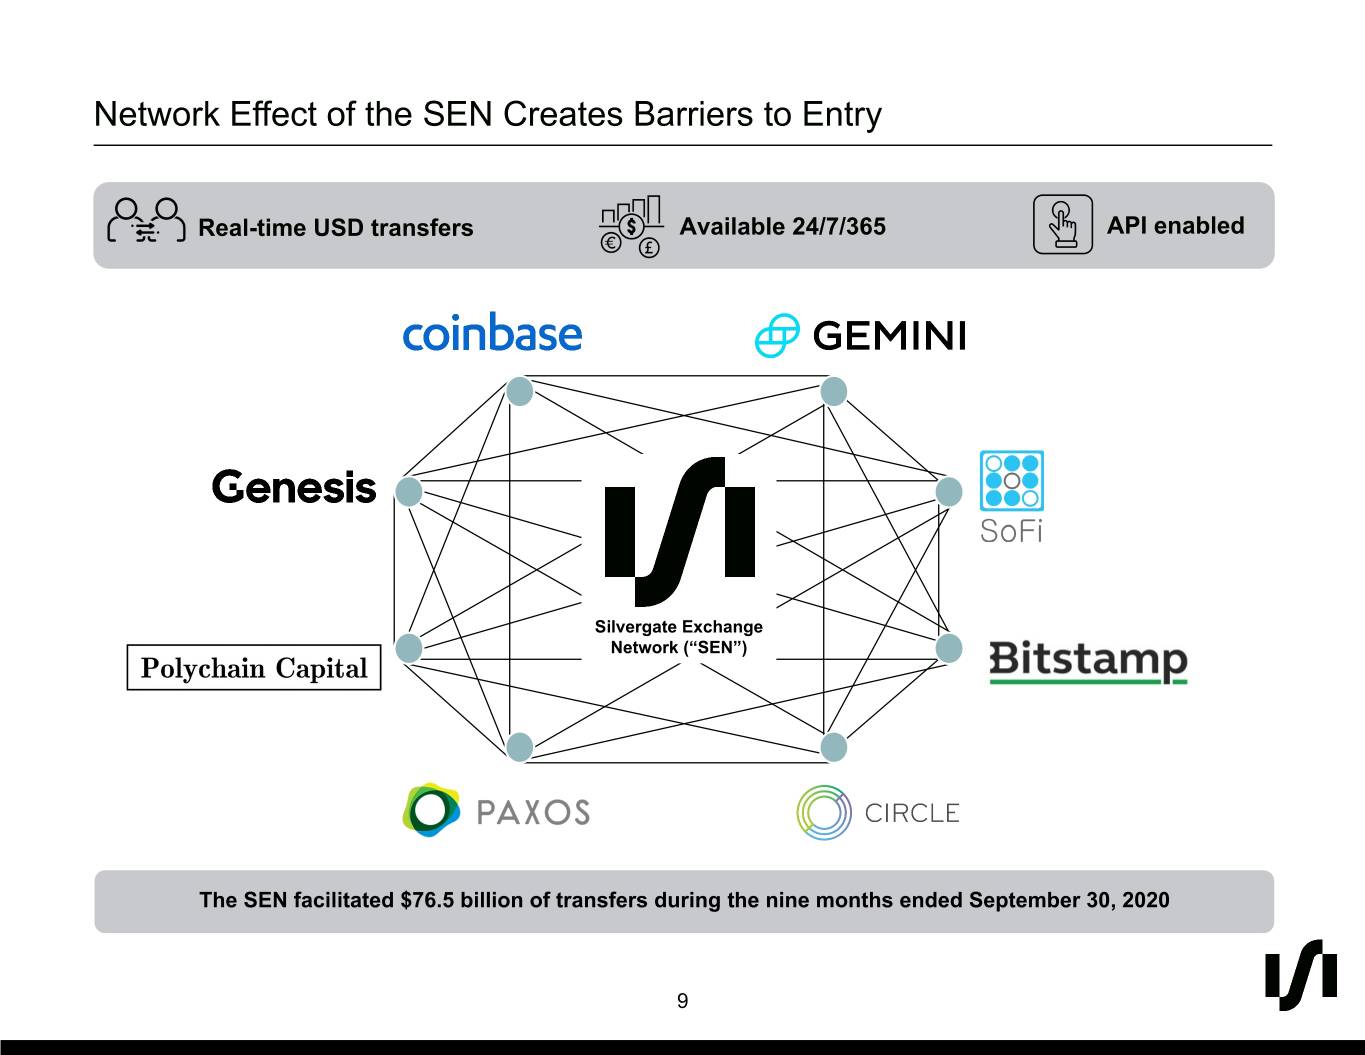
1 5 0 Network Effect of the SEN Creates Barriers to Entry #010500 41 Real-time USD transfers Available 24/7/365 API enabled 42 44 #292A2C 221 228 231 #DDE4E7 #919498 146 183 188 Silvergate Exchange Network (“SEN”) #92B7BC 0 175 220 #00AFDC The SEN facilitated $76.5 billion of transfers during the nine months ended September 30, 2020 0 107 183 #006BB7 9
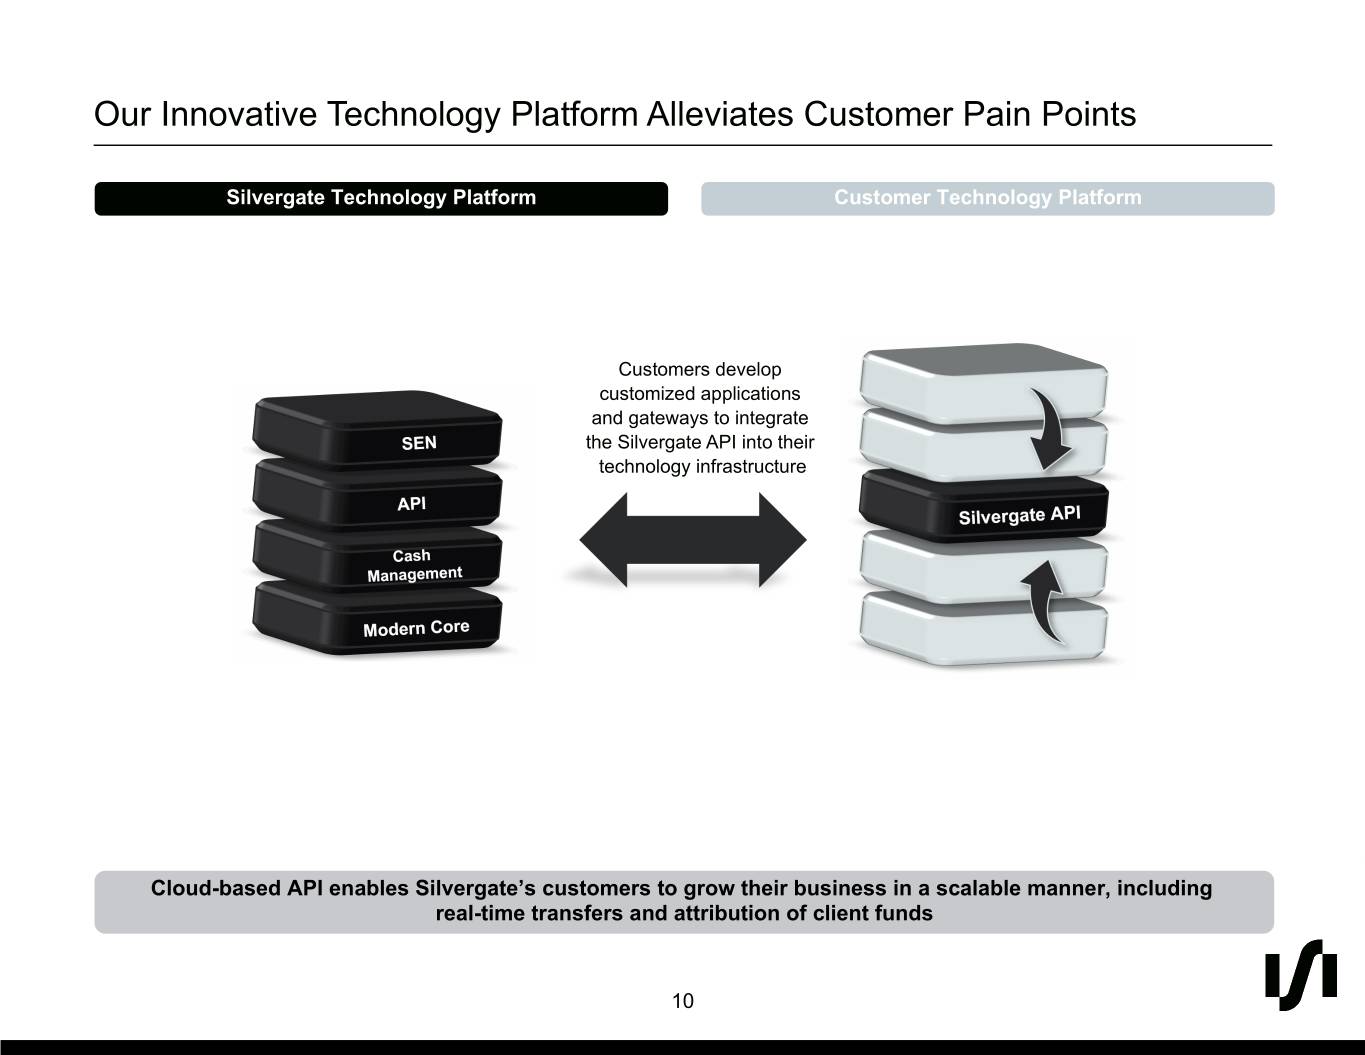
1 5 0 Our Innovative Technology Platform Alleviates Customer Pain Points #010500 Silvergate Technology Platform Customer Technology Platform 41 42 44 #292A2C Customers develop customized applications 221 and gateways to integrate 228 the Silvergate API into their 231 S technology infrastructure #DDE4E7 E #919498 N Silvergate 146 API 183 188 #92B7BC 0 175 220 #00AFDC Cloud-based API enables Silvergate’s customers to grow their business in a scalable manner, including 0 real-time transfers and attribution of client funds 107 183 #006BB7 10
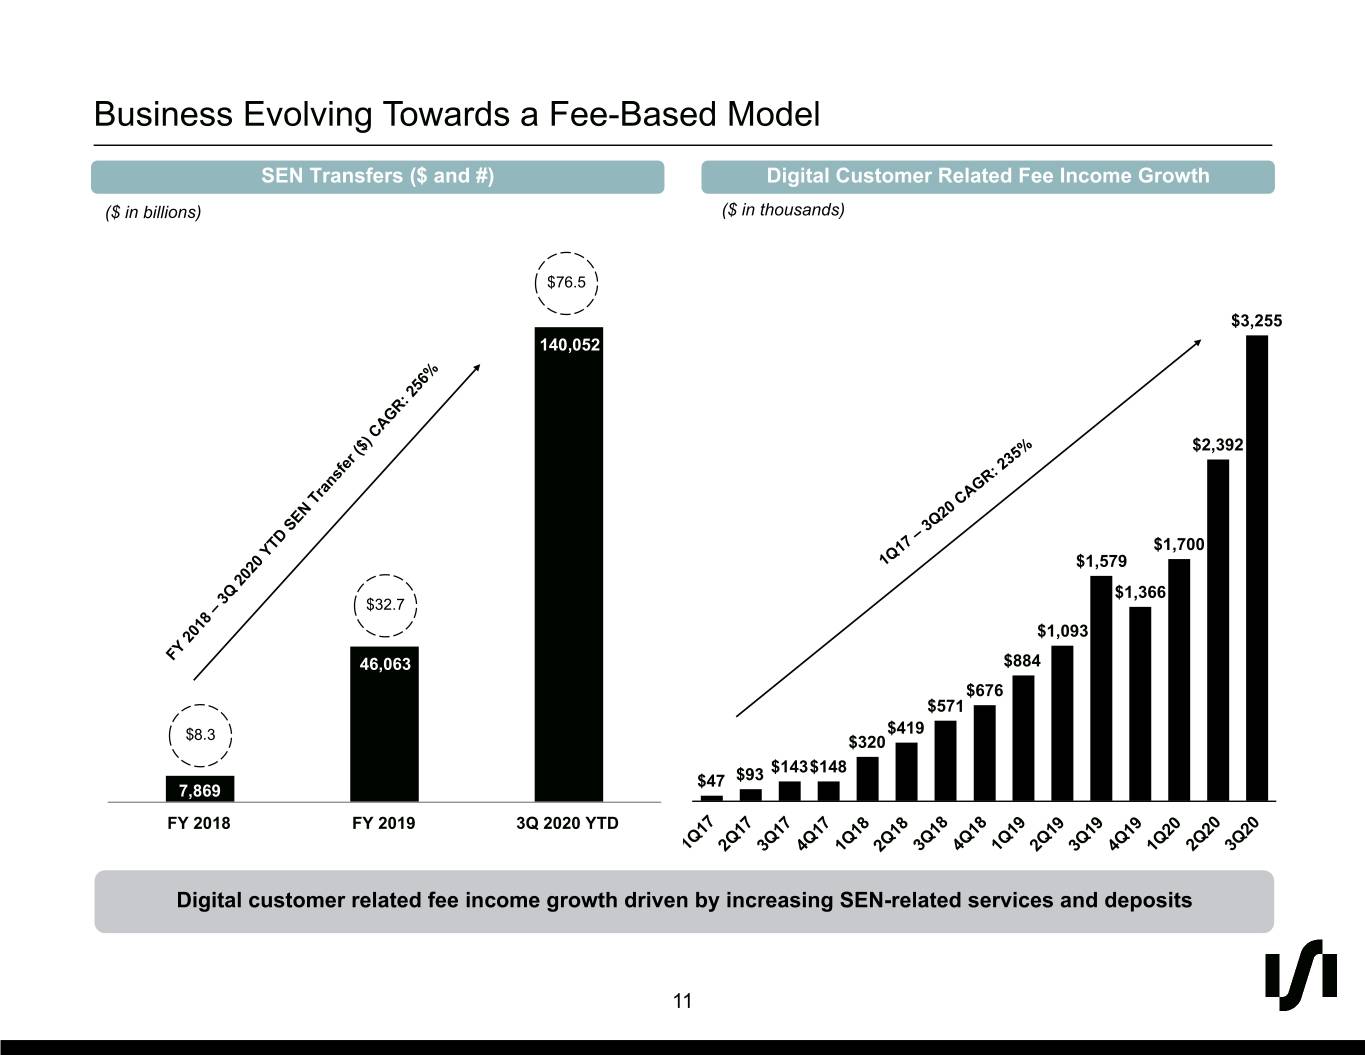
1 5 0 Business Evolving Towards a Fee-Based Model #010500 SEN Transfers ($ and #) Digital Customer Related Fee Income Growth ($ in billions) ($ in thousands) 41 42 44 $76.5 #292A2C $3,255 140,052 221 228 $2,392 231 #DDE4E7 #919498 $1,700 1Q17 – 3Q20 CAGR: 235% $1,579 146 $1,366 183 $32.7 188 $1,093 FY 2018 – 3Q 2020 YTD SEN Transfer ($) CAGR: 256% #92B7BC 46,063 $884 $676 $571 $8.3 $419 0 $320 $143$148 175 $47 $93 7,869 220 FY 2018 FY 2019 3Q 2020 YTD #00AFDC 1Q17 2Q17 3Q17 4Q17 1Q18 2Q18 3Q18 4Q18 1Q19 2Q19 3Q19 4Q19 1Q20 2Q20 3Q20 Digital customer related fee income growth driven by increasing SEN-related services and deposits 0 107 183 #006BB7 11

1 5 0 Robust Compliance and Risk Management Framework #010500 Daily Enhanced Due Customer Periodic Prospecting Transaction Due Diligence Approval Review 41 Monitoring Diligence 42 44 #292A2C Initial Due Diligence Ongoing Monitoring • Executive Summary • Daily 221 ◦ Company Description & Management Team ◦ BSA/AML Alerts Monitoring 228 ◦ Product & Target Customer ◦ Industry News Monitoring 231 ◦ Operational Needs • Enhanced Due Diligence #DDE4E7 #919498 • Reputation Review ◦ Customer Counterparty Reviews ◦ Customer Complaints ◦ Negative News Reviews 146 ◦ Pending/Prior Litigation • Periodic Review 183 • Compliance Review ◦ Quarterly Account Activity Reviews 188 ◦ Review of Organization’s Culture of Compliance ◦ Annual Company Reviews #92B7BC ◦ BSA/AML Program • Management Reporting ◦ Confirm Money Transmitter Registration & Licensing ◦ Monthly Fintech Committee Meeting ◦ Review Independent Audits & Exams ◦ Reports to Enterprise Risk Committee 0 175 ◦ Site Visit ◦ Reports to Directors Loan Committee (ACH 220 ◦ UDAAP Policy/Procedure Origination) #00AFDC ◦ Information Security ◦ Quarterly BSA Risk Assessment Our compliance process was built over the past six years and has provided us with a first-mover advantage 0 within the digital currency industry that is the cornerstone of our leadership position today 107 183 #006BB7 12
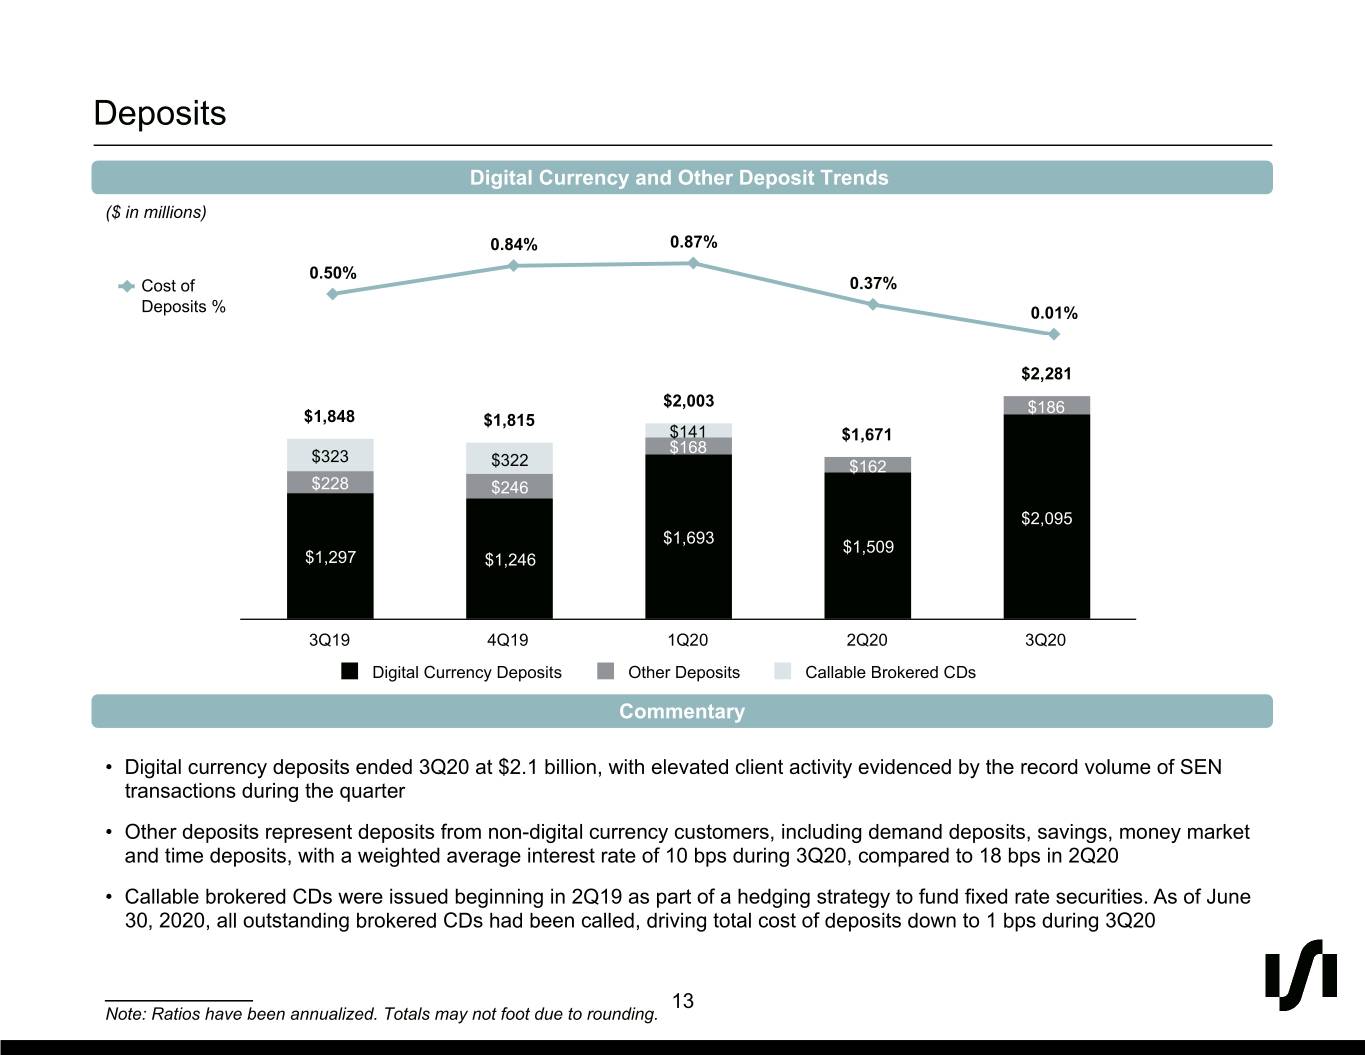
1 5 0 Deposits #010500 Digital Currency and Other Deposit Trends ($ in millions) 41 0.84% 0.87% 42 0.50% 44 Cost of 0.37% Deposits % 0.01% #292A2C $2,281 221 $2,003 $186 $1,848 $1,815 228 $141 $1,671 $168 $323 231 $322 $162 #DDE4E7 $228 #919498 $246 $2,095 $1,693 $1,509 $1,297 $1,246 146 183 188 3Q19 4Q19 1Q20 2Q20 3Q20 #92B7BC Digital Currency Deposits Other Deposits Callable Brokered CDs Commentary 0 175 • Digital currency deposits ended 3Q20 at $2.1 billion, with elevated client activity evidenced by the record volume of SEN transactions during the quarter 220 #00AFDC • Other deposits represent deposits from non-digital currency customers, including demand deposits, savings, money market and time deposits, with a weighted average interest rate of 10 bps during 3Q20, compared to 18 bps in 2Q20 • Callable brokered CDs were issued beginning in 2Q19 as part of a hedging strategy to fund fixed rate securities. As of June 0 30, 2020, all outstanding brokered CDs had been called, driving total cost of deposits down to 1 bps during 3Q20 107 183 ___________ 13 #006BB7 Note: Ratios have been annualized. Totals may not foot due to rounding.

1 5 0 Securities and Loan Portfolio #010500 Securities Composition – 36% of Total Assets Securities Commentary • Securities portfolio is managed with the same 41 disciplined credit approach as is applicable to our loan 42 portfolio, with consideration for the underlying debt Residential components and credit exposure for underlying asset 44 Municipal (MBS/CMO) classes #292A2C Bonds 24.8% 29.9% • There were no purchases or sales during 3Q20 $944.2mm Yield: 2.49% • Municipal bonds are all general obligation or revenue 221 bonds with 95% rated AA- or better 228 231 • Commercial MBS/CMO are non-agency with 96% rated #DDE4E7 Commercial AAA #919498 (MBS/CMO) 19.4% • Residential MBS/CMO are 99% agency backed Asset Backed Securities • 100% of asset backed securities are agency backed 146 25.9% FFELP student loan bonds and rated AA+ or better 183 Loan Composition – 54% of Total Assets Loan Commentary 188 Mortgage #92B7BC 1-4 Family Real Estate Warehouse HFI • 3Q20 total loans were up $286.3 million versus 2Q20 14.9% 6.8% driven by an increase in mortgage warehouse loans • Mortgage warehouse loans were $760.5 million 0 Multi-Family representing 54% of total loans 175 Real Estate 5.2% 220 $1,401.7mm • SEN Leverage loans were $22.4 million Yield: 4.45% #00AFDC Commercial • Nonperforming assets totaled $4.1 million, or 0.16% of Real Estate Mortgage total assets at September 30, 2020 compared to $4.6 22.6% Warehouse million, or 0.20% of total assets at June 30, 2020 HFS 0 SEN Leverage 47.5% 107 1.6% 183 Other HFI ___________ 1.5% 14 #006BB7 Note: Securities and loan yields are for 3Q20 and have been annualized.
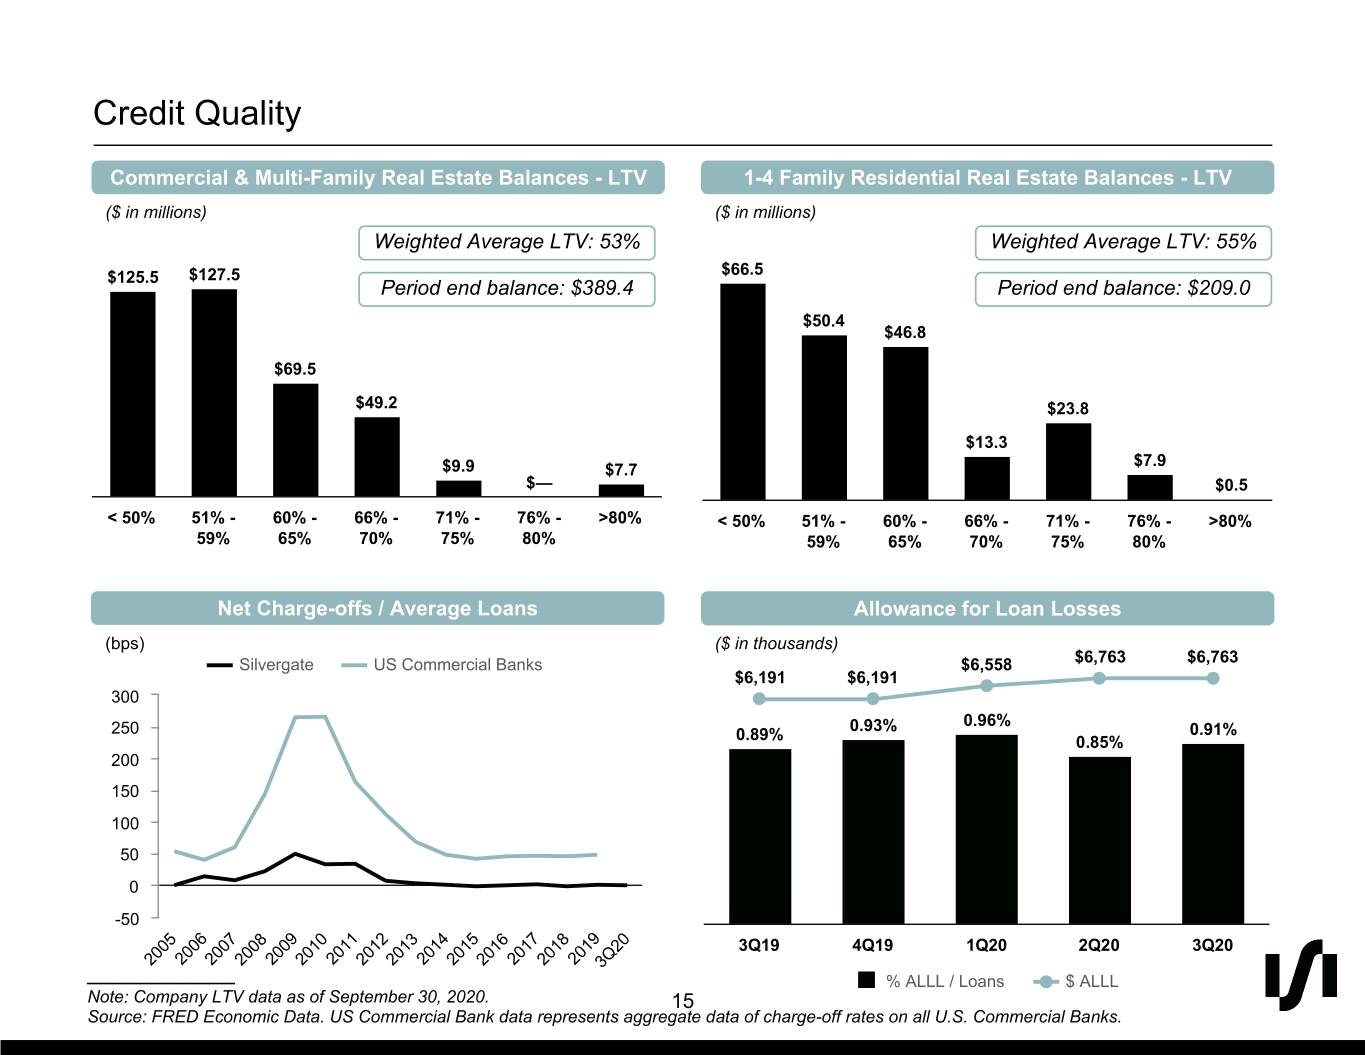
1 5 0 Credit Quality #010500 Commercial & Multi-Family Real Estate Balances - LTV 1-4 Family Residential Real Estate Balances - LTV ($ in millions) ($ in millions) 41 Weighted Average LTV: 53% Weighted Average LTV: 55% 42 $125.5 $127.5 $66.5 44 Period end balance: $389.4 Period end balance: $209.0 $50.4 #292A2C $46.8 $69.5 221 $49.2 $23.8 228 $13.3 $7.9 231 $9.9 $7.7 #DDE4E7 $— $0.5 #919498 < 50% 51% - 60% - 66% - 71% - 76% - >80% < 50% 51% - 60% - 66% - 71% - 76% - >80% 59% 65% 70% 75% 80% 59% 65% 70% 75% 80% 146 183 Net Charge-offs / Average Loans Allowance for Loan Losses 188 (bps) ($ in thousands) $6,763 $6,763 #92B7BC Silvergate US Commercial Banks $6,558 $6,191 $6,191 300 0.96% 250 0.93% 0.91% 0.89% 0.85% 0 200 175 150 220 100 #00AFDC 50 0 0 -50 107 3Q19 4Q19 1Q20 2Q20 3Q20 2005 2006 2007 2008 2009 2010 2011 2012 2013 2014 2015 2016 2017 2018 20193Q20 183 ___________ % ALLL / Loans $ ALLL Note: Company LTV data as of September 30, 2020. #006BB7 15 Source: FRED Economic Data. US Commercial Bank data represents aggregate data of charge-off rates on all U.S. Commercial Banks.

1 5 0 3Q20 Highlights #010500 Digital Currency Platform Loan Portfolio & Credit • Record number of 3Q20 Silvergate Exchange Network • Loan portfolio balance up 26% from prior quarter and up 41 (SEN) transactions of 68,361 and SEN volumes of $36.7 40% from September 30, 2019, driven by recent 42 billion, up 70% and 64%, respectively, versus 2Q20 residential mortgage refinance activity resulting in $283 44 million growth in mortgage warehouse balance from June • SEN transfers volumes since inception surpass $100 30, 2020 #292A2C billion during 3Q20 • Conservative credit culture evidenced by relatively low • Digital currency fee income of $3.3 million, up 36% as loan-to-value (LTV), with a 53% LTV in commercial and compared to 2Q20 and up 106% compared to 3Q19 221 multi-family real estate loans, and 55% LTV in 1-4 family loans 228 • SEN Leverage pilot completed with approved lines of 231 credit totaling $35.5 million versus $22.5 million in 2Q20 • As of September 30, 2020, the proportion of loans which #DDE4E7 continued under various forms of COVID-19 related #919498 • Digital currency deposits grew by $586 million to $2.1 modification was 4.4% of total gross HFI loans billion as of September 30, 2020 compared to $1.5 billion outstanding compared to 15.5% at June 30, 2020 as of June 30, 2020 146 183 3Q20 Financial Highlights Other 188 • Net income of $7.1 million as compared to $5.5 million for • Net income of $7.1 million in 3Q20 included a $0.5 million #92B7BC 2Q20 benefit to income taxes, which arose upon filing prior year tax returns including the benefit of R&D tax credits. • Diluted EPS of $0.37 per share compared to $0.29 per Net income of $5.5 million in 2Q20 included a $2.6 million share for 2Q20 0 pre-tax gain on sale of securities and a $1.2 million pre- tax accelerated premium expense related to calling • Book value per share of $15.18 compared to $14.36 for 175 brokered CDs 220 2Q20 • Total assets increased 12% from prior quarter to $2.6 #00AFDC • NIM was 3.19% compared to 3.14% for 2Q20 billion, driven by record levels of digital currency deposits • Total risk-based capital ratio of 24.68% and Tier 1 and mortgage warehouse loans leverage ratio of 10.36% as of September 30, 2020 0 • Silvergate continued to operate with uninterrupted 107 banking access for customers with approximately 95% of 183 the Company’s employees working remotely #006BB7 16

1 5 0 Multiple Avenues for Growth – Leverage Network Effects of SEN #010500 41 42 44 #292A2C 221 228 231 #DDE4E7 #919498 146 183 188 Credit Products #92B7BC 0 175 220 #00AFDC The network effects of SEN reinforce the strength of our product offerings and create a platform to launch 0 new customer solutions and generate attractive returns 107 183 #006BB7 17

Appendix

1 5 0 3Q20 Financial Results #010500 ($ in millions, except per share data) 3Q20 vs 41 3Q20 2Q20 3Q19 2Q20 3Q19 42 % Inc / (Dec) 44 Income Statement Net interest income $ 18.9 $ 16.1 $ 18.4 18 % 3 % #292A2C Provision for (reversal of) loan losses — 0.2 (0.9) N/M N/M Noninterest income 4.0 5.4 2.6 (27) % 53 % Noninterest expense 14.1 14.0 12.6 1 % 12 % 221 Pre-tax income 8.8 7.3 9.3 21 % (5) % 228 Income tax expense 1.7 1.8 2.6 (7) % (36) % 231 #DDE4E7 Net income $ 7.1 $ 5.5 $ 6.7 29 % 6 % #919498 Diluted EPS $ 0.37 $ 0.29 $ 0.36 Balance Sheet 146 Securities $ 944 $ 951 $ 910 (1) % 4 % 183 Total loans $ 1,402 $ 1,115 $ 1,003 26 % 40 % 188 Total assets $ 2,621 $ 2,341 $ 2,137 12 % 23 % #92B7BC Digital currency related deposits $ 2,095 $ 1,509 $ 1,297 39 % 61 % Total shareholders' equity $ 284 $ 268 $ 231 6 % 23 % Book value per share $ 15.18 $ 14.36 $ 12.92 6 % 17 % 0 175 Key Ratios 220 ROAA 1.13 % 1.02 % 1.20 % ROAE 10.14 % 8.72 % 11.78 % #00AFDC NIM 3.19 % 3.14 % 3.39 % Net charge-offs / Avg. loans 0.00 % 0.00 % 0.01 % 0 107 N/M - Not meaningful 183 ___________ #006BB7 19 Note: ROAA, ROAE and NIM have been annualized. Totals may not foot due to rounding.

1 5 0 Yields, Cost of Funds and Net Interest Margin Trends #010500 Yields, Cost of Deposits and Net Interest Margin Trends 41 NIM Yield on Loans Yield on Securities Yield on Cash Cost of Funds 42 5.50% 44 5.14% 5.15% 4.67% #292A2C 4.45% 3.39% 3.14% 3.19% 221 2.97% 2.86% 2.76% 2.67% 228 2.49% 231 #DDE4E7 2.00% 2.68% 2.70% #919498 1.24% 1.64% 0.97% 146 0.94% 0.94% 0.32% 0.59% 183 0.42% 188 0.07% #92B7BC 3Q19 4Q19 1Q20 2Q20 3Q20 Commentary 0 175 • Net interest margin increase was driven by the reduction in callable brokered CDs, which drove down cost of funds, partially 220 offset by lower yield on loans and the variable rate portion of securities, along with the impact of maintaining a higher level of cash and cash equivalents during the quarter related to the increase in digital currency deposits #00AFDC • Securities yields down 18 bps compared to the prior quarter, as lower rates impacting variable rate securities were mitigated by the impact of interest rate floors and the fixed rate component of the securities portfolio 0 107 183 ___________ 20 #006BB7 Note: Ratios have been annualized. NIM and yield on securities are presented on a taxable equivalent basis.

1 5 0 Noninterest Income #010500 Noninterest Income ($ in thousands) 41 $5,434 42 44 $4,931 #292A2C $2,556 $3,964 $2,122 $709 221 $3,130 Gain on sale of securities and 228 extinguishment of debt, net $2,599 $740 Other noninterest income, net $486 231 Fee income from #DDE4E7 $1,109 #919498 $1,020 digital currency customers $1,024 $3,255 $2,392 146 $1,579 $1,700 183 $1,366 188 #92B7BC 3Q19 4Q19 1Q20 2Q20 3Q20 Commentary 0 • 3Q20 fee income from digital currency customers was up 106% year over year driven by increased transactional volume 175 and related demand for cash management services 220 • Other noninterest income is made up primarily of mortgage warehouse fee income of $0.8 million, up 68% from the prior #00AFDC quarter and up 103% from 3Q19 • 2Q20 includes a $2.6 million gain on sale of securities 0 • 1Q20 includes a $1.2 million gain on sale of securities and $0.9 million gain on extinguishment of debt from termination of 107 FHLB term advance 183 ___________ 21 #006BB7 Note: 3Q19 other noninterest income includes a $16,000 loss on sale of securities.

1 5 0 Noninterest Expense #010500 Noninterest Expense ($ in thousands) $13,972 $14,133 41 $13,660 $13,875 42 $12,611 $1,658 $1,793 $1,679 $1,767 44 $1,255 $1,105 $1,207 $1,198 $985 #292A2C $889 $1,313 $1,149 $1,261 $1,389 $1,298 $861 $907 $894 $845 $892 221 228 231 #DDE4E7 #919498 $8,955 $9,002 $8,277 $8,773 $8,899 146 183 188 3Q19 4Q19 1Q20 2Q20 3Q20 #92B7BC Salaries/Employee Benefits Occupancy/Equipment Communications/Data Professional Services Other Commentary 0 175 • 3Q20 noninterest expense up 1% versus 2Q20 and 12% versus 3Q19 220 • Noninterest expense remains relatively stable throughout 2020 as investments in operational infrastructure and technology #00AFDC have allowed for significant transactional growth and scalability • Headcount was 215 as of September 30, 2020 compared to 213 at June 30, 2020 and 215 at December 31, 2019 0 107 183 #006BB7 22
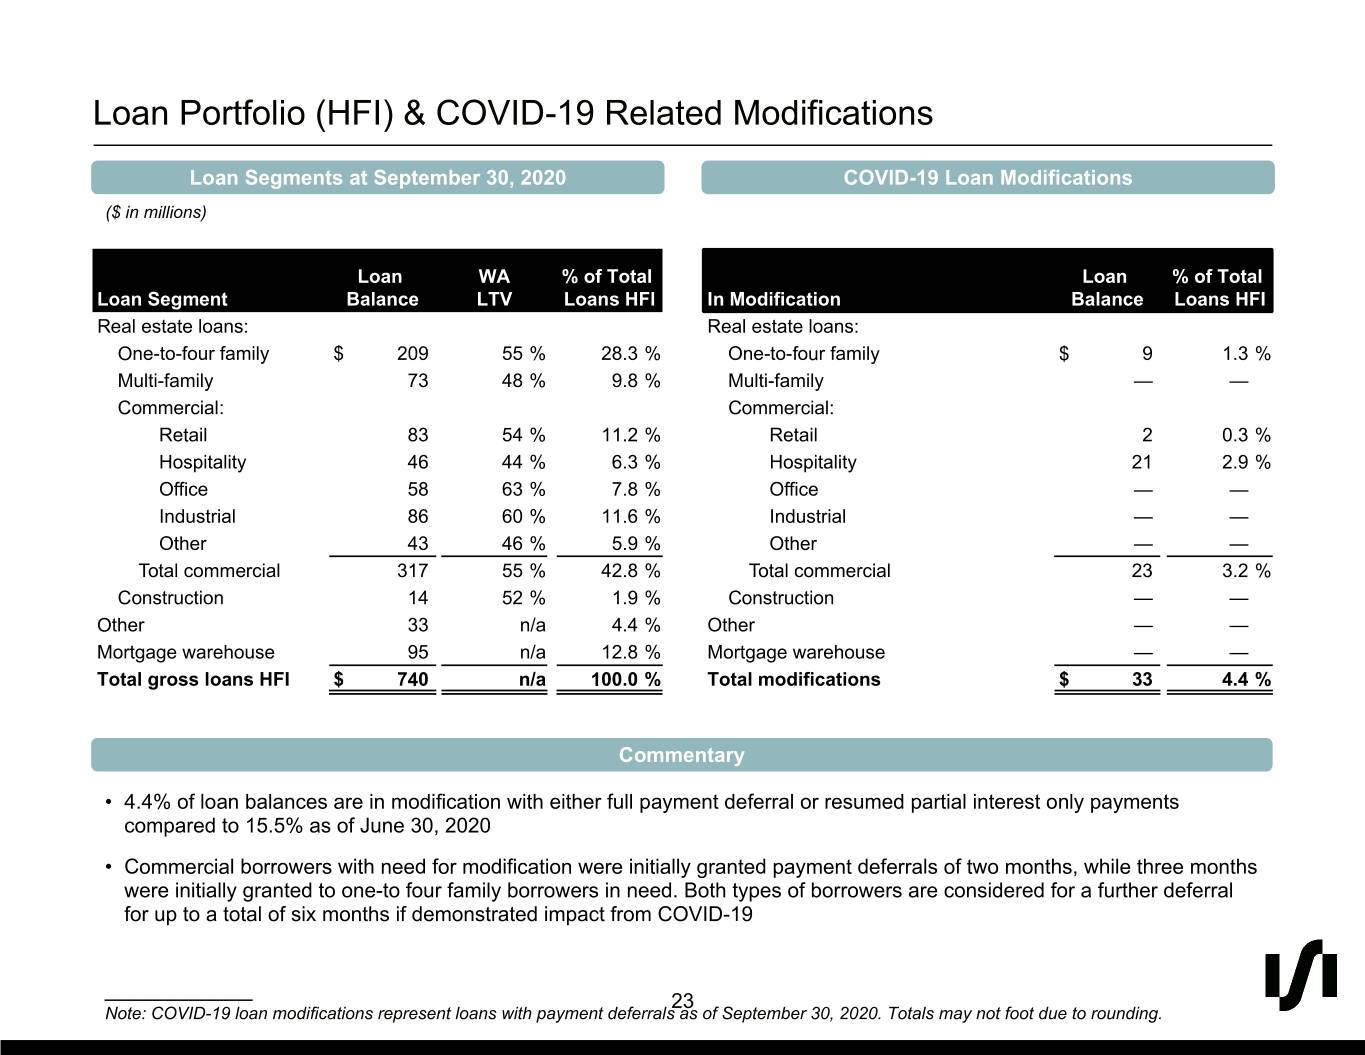
1 5 0 Loan Portfolio (HFI) & COVID-19 Related Modifications #010500 Loan Segments at September 30, 2020 COVID-19 Loan Modifications ($ in millions) 41 42 Loan WA % of Total Loan % of Total 44 Loan Segment Balance LTV Loans HFI In Modification Balance Loans HFI #292A2C Real estate loans: Real estate loans: One-to-four family $ 209 55 % 28.3 % One-to-four family $ 9 1.3 % Multi-family 73 48 % 9.8 % Multi-family — — 221 Commercial: Commercial: 228 Retail 83 54 % 11.2 % Retail 2 0.3 % 231 Hospitality 46 44 % 6.3 % Hospitality 21 2.9 % #DDE4E7 #919498 Office 58 63 % 7.8 % Office — — Industrial 86 60 % 11.6 % Industrial — — Other 43 46 % 5.9 % Other — — 146 Total commercial 317 55 % 42.8 % Total commercial 23 3.2 % 183 Construction 14 52 % 1.9 % Construction — — 188 Other 33 n/a 4.4 % Other — — Mortgage warehouse 95 n/a 12.8 % Mortgage warehouse — — #92B7BC Total gross loans HFI $ 740 n/a 100.0 % Total modifications $ 33 4.4 % 0 Commentary 175 220 • 4.4% of loan balances are in modification with either full payment deferral or resumed partial interest only payments compared to 15.5% as of June 30, 2020 #00AFDC • Commercial borrowers with need for modification were initially granted payment deferrals of two months, while three months were initially granted to one-to four family borrowers in need. Both types of borrowers are considered for a further deferral 0 for up to a total of six months if demonstrated impact from COVID-19 107 183 ___________ 23 #006BB7 Note: COVID-19 loan modifications represent loans with payment deferrals as of September 30, 2020. Totals may not foot due to rounding.
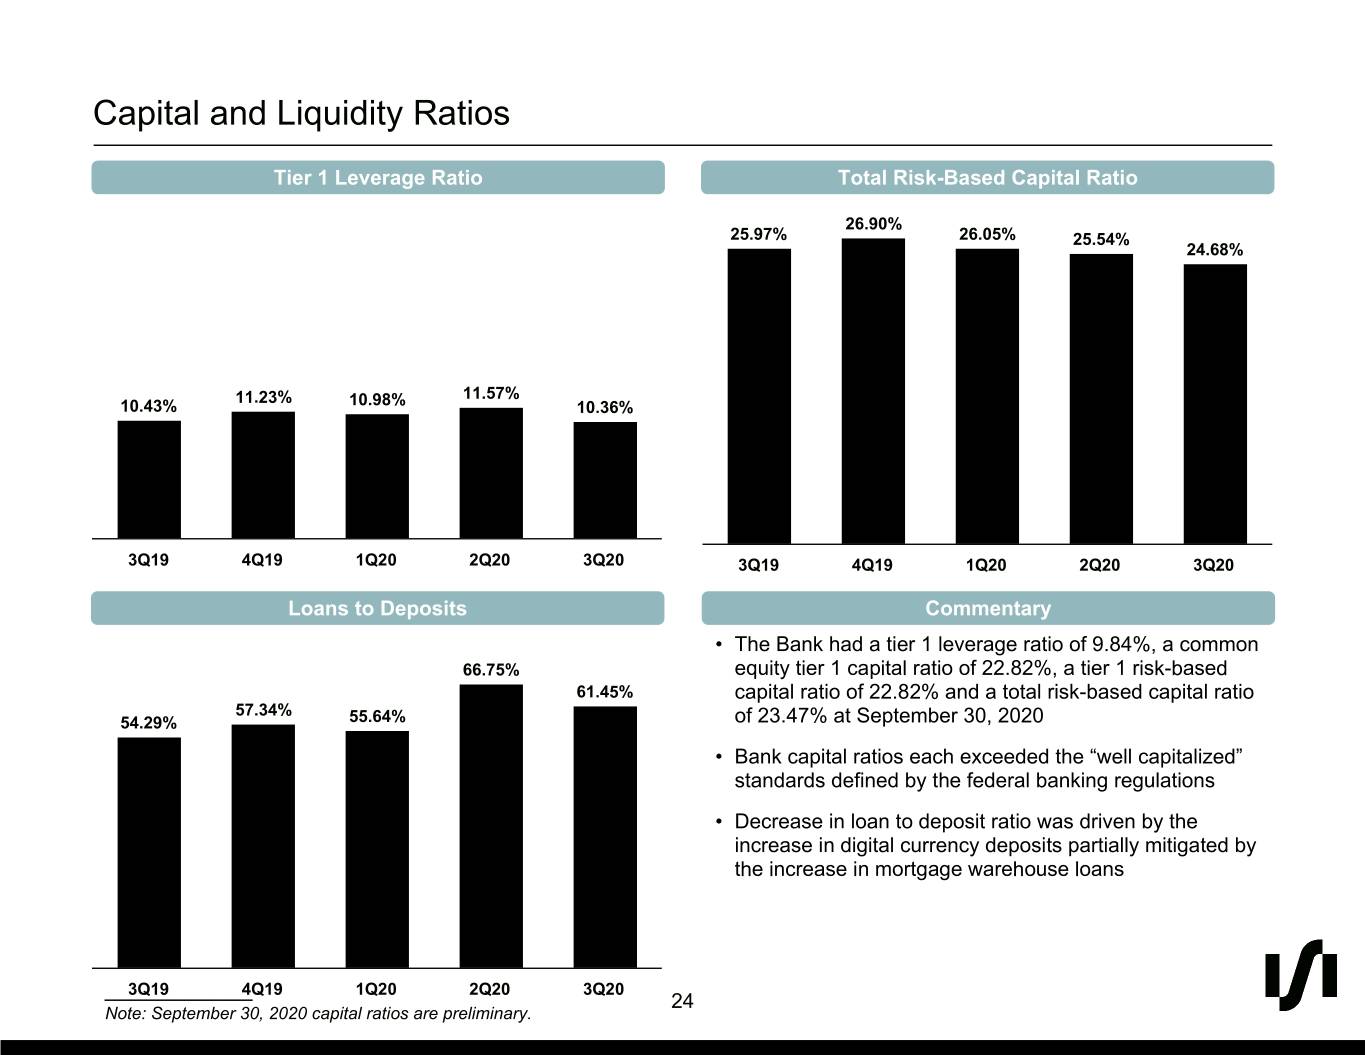
1 5 0 Capital and Liquidity Ratios #010500 Tier 1 Leverage Ratio Total Risk-Based Capital Ratio 26.90% 41 25.97% 26.05% 25.54% 24.68% 42 44 #292A2C 11.23% 11.57% 221 10.43% 10.98% 10.36% 228 231 #DDE4E7 #919498 3Q19 4Q19 1Q20 2Q20 3Q20 3Q19 4Q19 1Q20 2Q20 3Q20 146 183 Loans to Deposits Commentary 188 • The Bank had a tier 1 leverage ratio of 9.84%, a common #92B7BC 66.75% equity tier 1 capital ratio of 22.82%, a tier 1 risk-based 61.45% capital ratio of 22.82% and a total risk-based capital ratio 57.34% 54.29% 55.64% of 23.47% at September 30, 2020 0 • Bank capital ratios each exceeded the “well capitalized” 175 standards defined by the federal banking regulations 220 • Decrease in loan to deposit ratio was driven by the #00AFDC increase in digital currency deposits partially mitigated by the increase in mortgage warehouse loans 0 107 183 ___________3Q19 4Q19 1Q20 2Q20 3Q20 24 #006BB7 Note: September 30, 2020 capital ratios are preliminary.

1 5 0 Summary Financials #010500 ($ in thousands) 2017 2018 2019 3Q20 Balance Sheet Cash and cash equivalents $ 797,668 $ 674,420 $ 133,604 $ 197,482 41 Securities 191,921 357,251 897,766 944,161 42 Net loans 879,695 943,417 1,040,544 1,401,699 Other assets 22,664 29,230 56,213 77,231 44 Total assets $ 1,891,948 $ 2,004,318 $ 2,128,127 $ 2,620,573 #292A2C Total deposits 1,775,146 1,783,005 1,814,654 2,281,108 Total borrowings 36,788 20,659 68,530 25,827 Operating lease liabilities — — 4,881 3,770 Other liabilities 6,214 9,408 9,026 26,107 221 Total liabilities 1,818,148 1,813,072 1,897,091 2,336,812 228 Total shareholders' equity 73,800 191,246 231,036 283,761 231 Total liabilities and shareholders' equity $ 1,891,948 $ 2,004,318 $ 2,128,127 $ 2,620,573 #DDE4E7 Income Statement #919498 Interest income $ 48,306 $ 72,752 $ 81,035 $ 57,382 Interest expense 6,355 3,129 10,078 6,926 Net interest income 41,951 69,623 70,957 50,456 Provision for (reversal of) loan losses 262 (1,527) (439) 589 146 Net interest income after provision 41,689 71,150 71,396 49,867 183 Noninterest income 3,448 7,563 15,754 14,329 (1) 188 Noninterest expense 30,706 48,314 52,478 41,980 Income tax expense 6,788 8,066 9,826 5,297 #92B7BC Net income $ 7,643 $ 22,333 $ 24,846 $ 16,919 (1) Key Metrics Loan yield 5.20 % 5.52 % 5.45 % 4.74 % Yield on securities 2.13 % 2.78 % 2.87 % 2.62 % 0 Cost of deposits 0.44 % 0.10 % 0.43 % 0.40 % 175 Net interest margin 3.68 % 3.49 % 3.47 % 3.07 % 220 Noninterest income to average assets 0.30 % 0.38 % 0.76 % 0.83 % (1) Noninterest expense to average assets 2.67 % 2.41 % 2.52 % 2.45 % #00AFDC Efficiency ratio 67.64 % 62.59 % 60.52 % 64.80 % (1) ALLL / Loans HFI 1.17 % 1.13 % 0.93 % 0.91 % Net charge-offs (recoveries) / Avg. loans 0.02 % (0.01) % 0.01 % 0.00 % Return on average assets (ROAA) 0.66 % 1.11 % 1.19 % 0.99 % (1) 0 Return on average equity (ROAE) 10.80 % 13.47 % 11.54 % 8.73 % (1) 107 (1) Noninterest income in 2019 includes a $5.5 million pre-tax / $3.9 million after-tax gain on our branch sale in Q1 2019. 183 ___________________________ 25 #006BB7 Note: Financial data as of or for the nine months ended September 30, 2020. All ratios have been annualized except for ALLL / Loans HFI and Net Charge-offs (Recoveries) / Avg. Loans and Efficiency Ratio.

1 5 0 Reconciliation of Non-GAAP Financial Measures #010500 41 42 44 #292A2C 221 228 231 #DDE4E7 #919498 146 183 188 #92B7BC 0 175 220 #00AFDC 0 107 183 #006BB7 26
