Attached files
| file | filename |
|---|---|
| EX-99.1 - EX-99.1 - UGI CORP /PA/ | ugisept2020ex991.htm |
| 8-K - 8-K - UGI CORP /PA/ | ugi-20201118.htm |
Fiscal 2020 Results and Fiscal 2021 Outlook John L. Walsh President & CEO, UGI Corporation Ted J. Jastrzebski Chief Financial Officer, UGI Corporation Robert F. Beard Executive Vice President Natural Gas, UGI Corporation Roger Perreault Executive Vice President Global LPG, UGI Corporation 1

About This Presentation This presentation contains statements, estimates and projections that are forward-looking statements (as defined in Section 21E of the Securities and Exchange Act of 1934, as amended). Management believes that these are reasonable as of today’s date only. Actual results may differ significantly because of risks and uncertainties that are difficult to predict and many of which are beyond management’s control. You should read UGI’s Annual Report on Form 10-K and its Quarterly Report on Form 10-Q for the fiscal quarter ended March 31, 2020 for a more extensive list of factors that could affect results. Among them are adverse weather conditions and the seasonal nature of our business; cost volatility and availability of all energy products, including propane, natural gas, electricity and fuel oil; increased customer conservation measures; the impact of pending and future legal proceedings; liability for uninsured claims and for claims in excess of insurance coverage; domestic and international political, regulatory and economic conditions in the United States and in foreign countries, including the current conflicts in the Middle East and the withdrawal of the United Kingdom from the European Union; and foreign currency exchange rate fluctuations (particularly the euro); the timing of development of Marcellus Shale gas production; the availability, timing and success of our acquisitions, commercial initiatives and investments to grow our business; our ability to successfully integrate acquired businesses and achieve anticipated synergies; the interruption, disruption, failure, malfunction, or breach of our information technology systems, including due to cyber-attack; the inability to complete pending or future energy infrastructure projects; our ability to achieve the operational benefits and cost efficiencies expected from the completion of pending and future transformation initiatives at our business units; and uncertainties related to the global pandemic, including the duration and/or impact of the COVID-19 pandemic. UGI Corporation | Fiscal 2020 Results 2

Fiscal Year Recap 3 John L. Walsh President & CEO, UGI

Fiscal Year Earnings Recap • GAAP EPS of $2.54 and adjusted EPS1 of $2.67; FY20 adjusted EPS up ~17% from FY19 • Strong FY20 performance driven by UGI Appalachia, AmeriGas buy-in, disciplined expense and cash flow management, and tax benefits • The new High Tax legislation (GILTI) provided compounding benefits under the CARES Act when carrying back net operating losses fully 5 years Adjusted EPS1 Reportable Segments EBIT2 $2.67 $0.98B $1.03B $2.28 FY 2019 FY 2020 FY 2019 FY 2020 1 UGI Corporation | Fiscal 2020 Results Adjusted EPS is a non-GAAP measure. See slide 10 for reconciliation. 4 2Reportable segments earnings before interest expense and income taxes represents an aggregate of our segment level EBIT as determined in accordance with GAAP.

Fiscal Year 2021 Guidance Update FY21 Adjusted EPS Guidance Range $2.65 - $2.951 Guidance Impacts • Updated normal weather to a 10-year average as basis for FY21; affects budgeted volumes by 1-1.5% and adjusted EPS by ~$0.04 • Expect lingering COVID-19 volume impact on certain customer segments, mainly in Q1 • Anticipate minimal impact from new tax legislation in Fiscal 2021 1Because we are unable to predict certain potentially material items affecting diluted earnings per share on a GAAP basis, principally mark-to-market gains and losses on commodity and certain foreign currency derivative instruments we cannot reconcile fiscal year 2021 adjusted diluted earnings per share, a non-GAAP 5 UGI Corporation | Fiscal 2020 Results measure, to diluted earnings per share, the most directly comparable GAAP measure, in reliance on the “unreasonable efforts” exception set forth in SEC rules.

Commitment to Our Communities • In Fiscal 2020, our communities were impacted by critical issues, such as food insecurity, homelessness, and racial injustice • UGI’s leadership team, Board of Directors, and our employees stepped up to provide financial and volunteer support to food banks, emergency services organizations, and critical educational teams • Achieved record levels of support for our long-term partner, the United Way UGI Corporation | Fiscal 2020 Results 6

Key Accomplishments • Midstream and Marketing continued to see strong performance from UGI Appalachia; EBIT and cash flow exceeded expectations; throughput volumes were up 6% vs. prior year; completion of Bethlehem LNG storage and vaporization system supports peaking contracts which generate ~$90 million in EBIT annually from long-term or take-or-pay contracts • Utilities deployed near record level capital on infrastructure replacement and betterment; clear trend in reduced methane emissions and fewer leaks system- wide; added over 12,000 residential and commercial heating customers; increased base rates by $20 million; $10 million effective January 2021 and an additional $10 million effective July 2021 • AmeriGas delivered strong growth with ACE and National Accounts programs; ACE volumes up nearly 18% • UGI International delivered record EBIT of $259 million through effective margin management and operating efficiencies UGI Corporation | Fiscal 2020 Results 7
Fiscal Year Financial Review Ted J. Jastrzebski Chief Financial Officer, UGI

Drivers of Q4 Performance • New high tax legislation (GILTI) combined with the CARES Act provided larger than anticipated benefits, as UGI carried losses back fully five years • Resulted in $0.10 of additional tax benefit in the 4th quarter • Approximately $0.20 of tax benefits specific to Fiscal 2020 • Lower than anticipated COVID impacts and stronger performance at the businesses • Anticipate approximately $0.10 of COVID impact in our Fiscal 21 guidance; expect the majority of that negative impact to occur in our first quarter • Minimal tax benefits expected from new legislation in Fiscal 2021 Well positioned to deliver on our long-term annual growth commitment of 6% - 10% UGI Corporation | Fiscal 2020 Results 9 1Adjusted EPS is a non-GAAP measure. See slide 10 for reconciliation.

Adjusted Diluted Earnings Per Share FY 2019 FY 2020 AmeriGas Propane $0.38 $0.74 UGI International 0.80 0.82 Midstream & Marketing 0.43 0.44 UGI Utilities 0.74 0.65 Corporate & Other (a) (0.94) (0.11) Earnings per share – diluted 1.41 2.54 Net losses (gains) on commodity derivative instruments 0.82 (0.39) Unrealized (gains) losses on foreign currency derivative instruments (0.13) 0.12 Loss on extinguishments of debt 0.02 - AmeriGas Merger expenses 0.01 - CMG acquisition and integration expenses 0.06 0.01 LPG business transformation expenses 0.09 0.21 Loss on disposals of Conemaugh and HVAC - 0.18 Total Adjustments (a) (b) 0.87 0.13 Adjusted earnings per share – diluted (b) $2.28 $2.67 (a) Corporate & Other includes certain adjustments made to our reporting segments in arriving at net income attributable to UGI Corporation, including the impact of the tax benefits resulting from tax law changes for Fiscal 2020. These adjustments have been excluded from the segment results to align with the measure used by our CODM in assessing segment performance and allocating resources. (b) Earnings per share for Fiscal 2020 reflect 34.6 million incremental shares of UGI Common Stock issued in conjunction with the AmeriGas Merger. UGI Corporation | Fiscal 2020 Results 10

FY 2020 Results Recap • FY20 GAAP EPS of $2.54 compared to GAAP EPS of $1.41 in the prior-year Adjusted EPS1 Adjusted EPS1 $2.673 0.01 0.36 0.02 (0.09) 0.09 $2.282 UGI $0.65 Utilities $0.74 $0.44 Midstream $0.43 & Marketing $ 2.67 $0.82 $ 2.28 4.6% 6.7% 6.3% 5.8% $0.80 UGI Warmer Warmer Warmer Warmer International than prior year $0.74 AmeriGas $0.38 FY 2019 AmeriGas UGI Midstream UGI Corporate FY 2020 FY 2019 FY 2020 International& Marketing Utilities & Other 1Adjusted EPS is a non-GAAP measure. See slide 10 for reconciliation. UGI Corporation | Fiscal 2020 Results 2 Includes ($0.07) Corporate & Other. 11 3 Includes $0.02 Corporate & Other.

Transformation Project • In Fiscal 2020, UGI initiated a transformation project for its support functions, including Finance, Procurement, HR, and IT • Transformation project will review, redesign, and establish processes within each of these functions using a global lens to: • Standardize activities across our global platform • Incorporate best practices leveraging technology • Increase efficiency and connectivity between our businesses • Provide more employee development opportunities • Estimated cost of approximately $40 million over the next 2-3 years; approximately half attributable to opex • Anticipate ongoing annual savings of $15 million 12 UGI Corporation | Fiscal 2020 Results
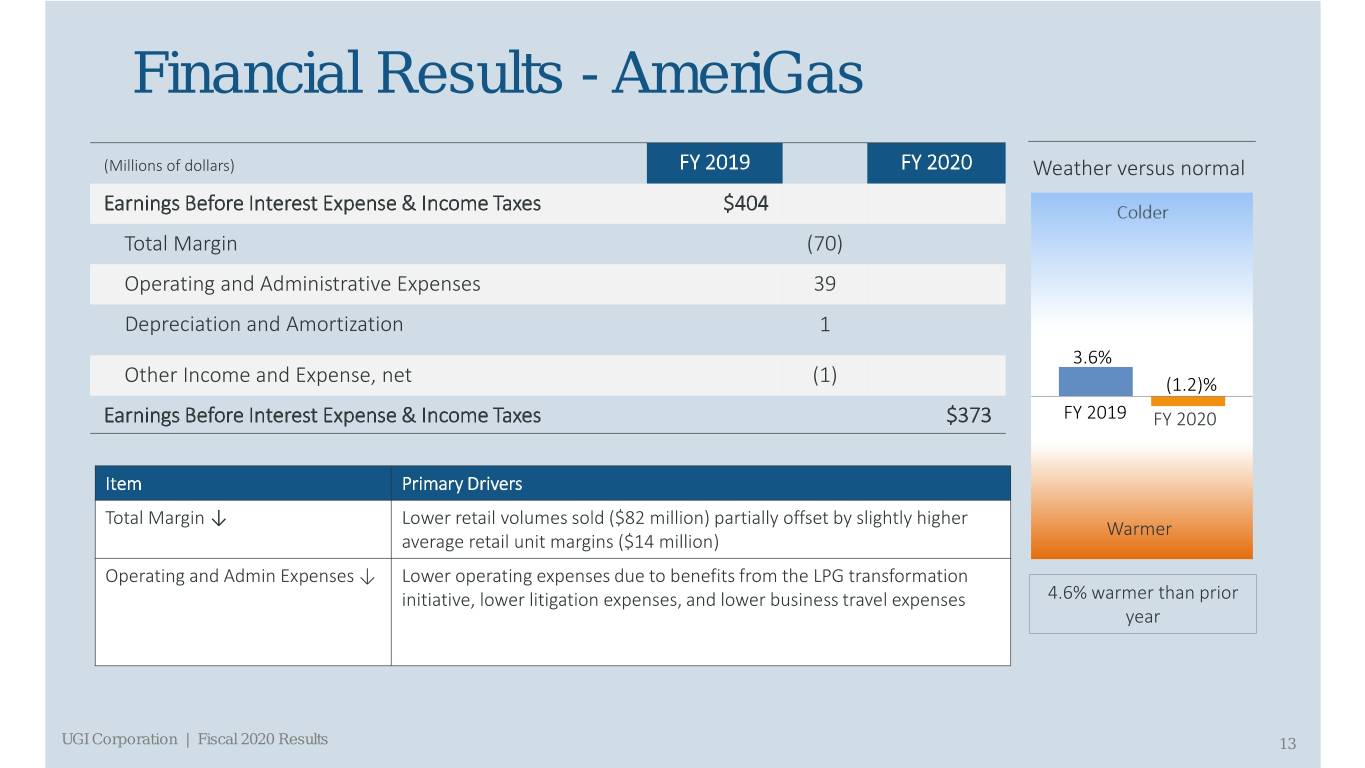
Financial Results - AmeriGas (Millions of dollars) FY 2019 FY 2020 Weather versus normal Earnings Before Interest Expense & Income Taxes $404 Total Margin (70) Operating and Administrative Expenses 39 Depreciation and Amortization 1 3.6% Other Income and Expense, net (1) (1.2)% Earnings Before Interest Expense & Income Taxes $373 FY 2019 FY 2020 Item Primary Drivers Total Margin ↓ Lower retail volumes sold ($82 million) partially offset by slightly higher Warmer average retail unit margins ($14 million) Operating and Admin Expenses ↓ Lower operating expenses due to benefits from the LPG transformation initiative, lower litigation expenses, and lower business travel expenses 4.6% warmer than prior year UGI Corporation | Fiscal 2020 Results 13

Financial Results – UGI International FY 2019 FY 2020 (Millions of dollars) Weather versus normal Earnings Before Interest Expense & Income Taxes $234 Total Margin (20) Colder Operating and Administrative Expenses 38 Depreciation and Amortization (1) Realized FX Gains 10 Other Income and Expense, net (2) (5.8)% (12.1)% Earnings Before Interest Expense & Income Taxes $259 Item Primary Drivers FY 2019 Total Margin ↓ Warm weather, COVID-19 and the translation effects of the weaker euro partially offset by higher average LPG unit margins including the FY 2020 effects of margin management efforts and lower LPG product costs. Warmer Operating and Admin Decreased distribution costs attributable to lower volumes sold, lower Expenses ↓ employee compensation, benefits-related costs and business travel 6.7% warmer than prior expenses, and the weaker euro ($8 million). year Realized FX Gains ↑ Realized gain of $10 million; in line with hedging program expectations. 14 UGI Corporation | Fiscal 2020 Results

Financial Results – Midstream & Marketing FY 2019 FY 2020 (Millions of dollars) Weather versus normal Earnings Before Interest Expense & Income Taxes $114 Colder Total Margin 80 Operating and Administrative Expenses (20) Depreciation and Amortization (24) Other Income and Expense, net 18 Earnings Before Interest Expense & Income Taxes $168 (1.6)% (7.9)% Item Primary Drivers FY 2019 Total Margin ↑ Higher natural gas gathering margin ($84 million) largely attributable to FY 2020 incremental margin from UGI Appalachia, and to a much lesser extent, increased peaking ($5 million) and capacity margins ($4 million). These increases were partially offset by lower retail commodity margin ($5 million), largely due to warmer weather, and decreased electric generation margin ($5 million). Warmer Operating and Admin Expenses ↑ Higher expense due to full year of UGI Appalachia 6.3% warmer than prior Depreciation and Amortization↑ Expansion of gathering assets, principally UGI Appalachia year Other Income↑ Equity income from Pennant acquired as part of UGI Appalachia 15 UGI Corporation | Fiscal 2020 Results

Financial Results – Utilities (Millions of dollars) FY 2019 FY 2020 Weather versus normal Earnings Before Interest Expense & Income Taxes $226 Colder Total Margin 14 Operating and Administrative Expenses 5 Depreciation (12) Other Income and Expense, net (4) (5.0)% (11.0)% Earnings Before Interest Expense & Income Taxes $229 FY 2019 Item Primary Drivers FY 2020 Total Margin ↑ Higher margin from Gas Utility core market customers ($16 million), partially offset by slightly lower Electric Utility margin ($2 million). The increase in total Gas Utility margin reflects higher core market margin including the effects of the increase in base rates, which became effective Warmer October 11, 2019, partially offset by the lower core market volumes. Operating and Admin Expenses ↓ Lower contractor costs and transportation expenses, partially offset by 5.8% warmer than prior higher IT maintenance and consulting expenses. year Depreciation ↑ Higher IT and distribution system capital expenditure activity. UGI Corporation | Fiscal 2020 Results 16

Liquidity Update • Continue to maintain strong balance sheet position • Total available liquidity was $1.5 billion as of 9/30/20 compared to $1.1 billion as of 9/30/19 • Reduction in consolidated leverage in Fiscal 2020; expect trend to continue in Fiscal 2021 and beyond UGI Corporation | Fiscal 2020 Results 17

Update on Natural Gas Business Robert F. Beard Executive Vice President Natural Gas, UGI
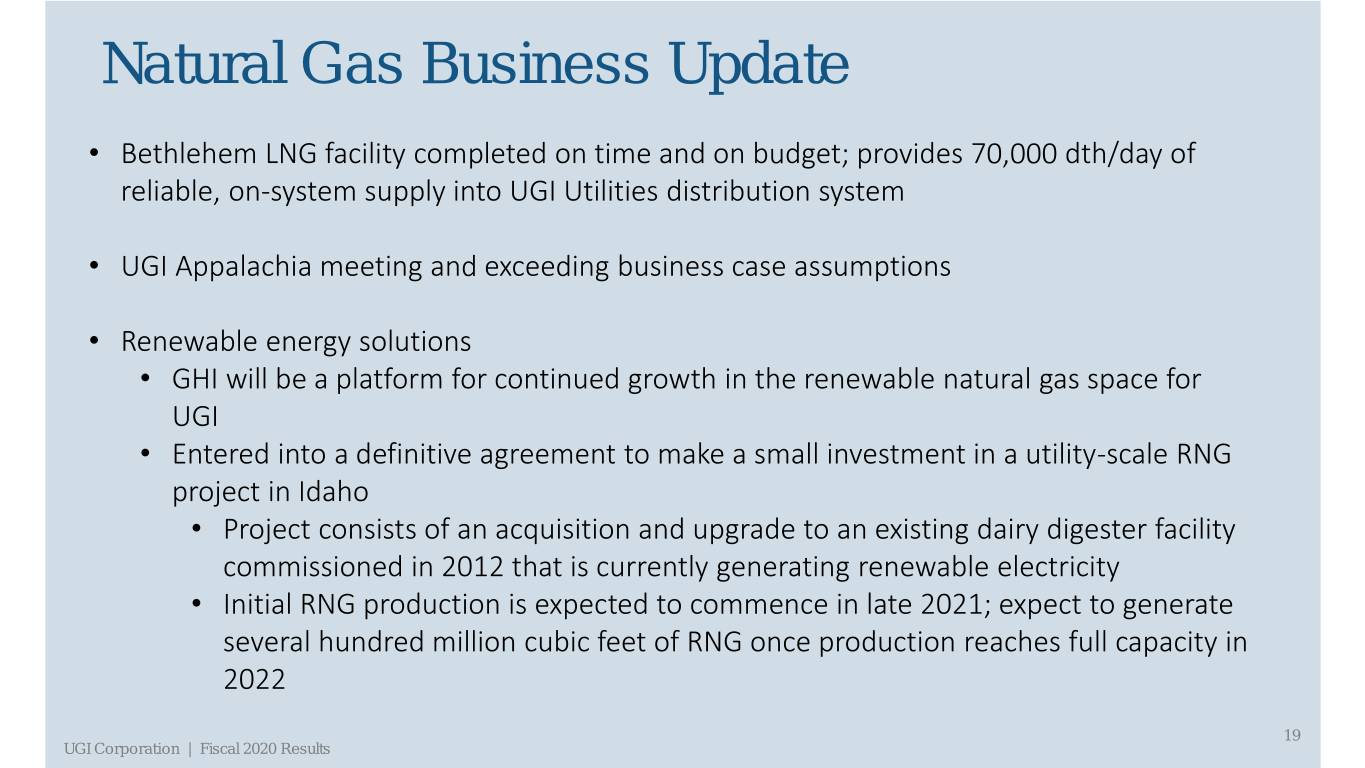
Natural Gas Business Update • Bethlehem LNG facility completed on time and on budget; provides 70,000 dth/day of reliable, on-system supply into UGI Utilities distribution system • UGI Appalachia meeting and exceeding business case assumptions • Renewable energy solutions • GHI will be a platform for continued growth in the renewable natural gas space for UGI • Entered into a definitive agreement to make a small investment in a utility-scale RNG project in Idaho • Project consists of an acquisition and upgrade to an existing dairy digester facility commissioned in 2012 that is currently generating renewable electricity • Initial RNG production is expected to commence in late 2021; expect to generate several hundred million cubic feet of RNG once production reaches full capacity in 2022 19 UGI Corporation | Fiscal 2020 Results

Natural Gas Business Update Continued • UGI Utilities retired nearly 72 miles of bare steel and cast iron mains; exceeded annual commitment to regulators; expect an approximately 35% reduction over the next ten years as a result of replacement program • Sale of Conemaugh will reduce UGI’s Scope 1 (direct) emissions by more than 30% • Auburn IV expansion increased system volume by 90%; FY20 annual margin of $34.6 million; nearly all margin is fixed fee • On October 8th, the PA PUC formally approved UGI Utilities gas rate case • Increased rates by $20 million; favorable bad debt provision mitigates P&L and cash flow risk due to the effects of COVID • PennEast is working cooperatively with all of the regulatory agencies UGI Corporation | Fiscal 2020 Results 20

Update on Global LPG Business Roger Perreault Executive Vice President Global LPG, UGI

Global LPG Business Update • Transformation Initiatives exceeded Fiscal 2020 commitments • AmeriGas realized over $40 million in annual benefits • UGI International realized over €7 million in annual benefits • AmeriGas business transformation program increased expected annual benefits to $140 million • Expect benefits to be fully realized by the end of FY22 • Allocating approximately one-third of the savings towards strategic initiatives to drive improved customer retention and growth in core business • Estimated cost to implement increased by $25 million; $200 million total investment 22 UGI Corporation | Fiscal 2020 Results
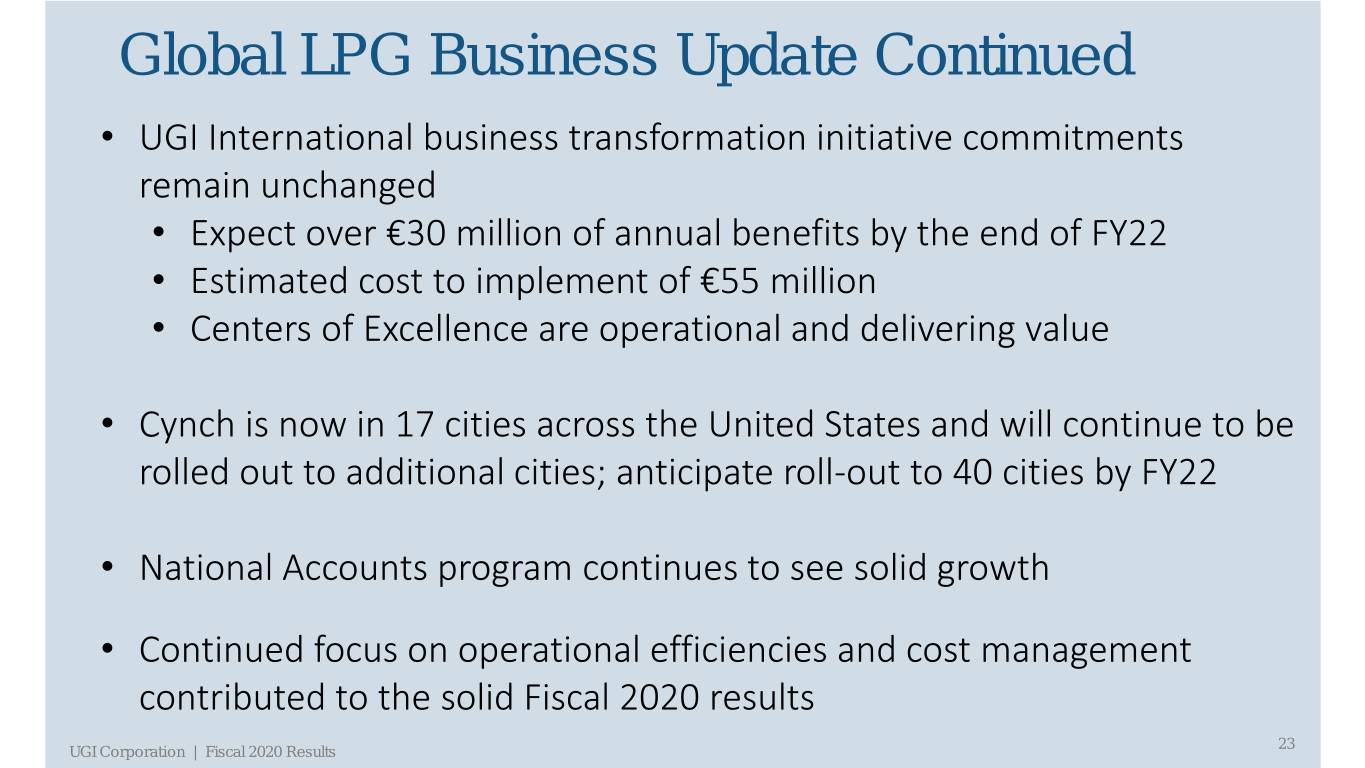
Global LPG Business Update Continued • UGI International business transformation initiative commitments remain unchanged • Expect over €30 million of annual benefits by the end of FY22 • Estimated cost to implement of €55 million • Centers of Excellence are operational and delivering value • Cynch is now in 17 cities across the United States and will continue to be rolled out to additional cities; anticipate roll-out to 40 cities by FY22 • National Accounts program continues to see solid growth • Continued focus on operational efficiencies and cost management contributed to the solid Fiscal 2020 results 23 UGI Corporation | Fiscal 2020 Results

Strategic Overview and Summary John L. Walsh President & CEO, UGI

Strategic Overview & Summary • Committed to reduce UGI’s carbon footprint • Investments in RNG and Bio-LPG • Acquisition of GHI, a renewable natural gas company • RNG feedstock project in Idaho • Exploring a number of additional RNG opportunities • Actively developing Bio-LPG sources to augment UGI’s existing Bio-LPG source in Sweden • Ability to utilize existing natural gas and LPG distribution infrastructure to deliver RNG and Bio-LPG to UGI’s ~ 3 million customers • Exploring opportunities around renewable hydrogen and battery storage • Renewable energy solutions enable UGI to achieve several key strategic objectives • Accelerate the rebalancing of UGI’s business mix; nearly all growth capital invested in natural gas and renewables • Create a new Renewable Solutions team to accelerate the development of new growth opportunities • Position UGI as a leader in sourcing and delivering carbon-free and negative carbon energy solutions to residential, commercial, industrial and transport customers across the US and Europe FY 2021 guidance: $2.65 – $2.951 assumes 10-year weather and COVID-19 volume impact in Q1 • Mid-point of FY21 guidance represents a 12% increase in EPS over UGI’s FY20 adjusted EPS of $2.67 excluding $0.17 of tax benefits specific to FY20 • Well-positioned to continue to meet our long-term annual EPS growth commitment of 6% - 10% 1Because we are unable to predict certain potentially material items affecting diluted earnings per share on a GAAP basis, principally mark-to-market gains and losses on commodity and certain foreign currency derivative instruments we cannot reconcile fiscal year 2021 adjusted diluted earnings per share, a non-GAAP measure, to diluted earnings per share, the most 25 UGI Corporation | Fiscal 2020 Results directly comparable GAAP measure, in reliance on the “unreasonable efforts” exception set forth in SEC rules.

Q&A 26

Appendix

UGI Adjusted Net Income (Dollars in millions) FY 2019 FY 2020 AmeriGas Propane $68 $156 UGI International 145 173 Midstream & Marketing 78 92 UGI Utilities 133 136 Corporate & Other (a) (168) (25) Net income attributable to UGI Corporation 256 532 Net losses (gains) on commodity derivative instruments 148 (82) Unrealized (gains) losses on foreign currency derivative instruments (23) 26 Loss on extinguishment of debt 4 - AmeriGas Merger expenses 1 - CMG acquisition and integration expenses 11 1 LPG business transformation expenses 16 45 Loss on disposals of Conemaugh and HVAC - 39 Total Adjustments (a) (b) 157 29 Adjusted net income attributable to UGI Corporation $413 $561 (a) Corporate & Other includes certain adjustments made to our reporting segments in arriving at net income attributable to UGI Corporation, including the impact of the tax benefits resulting from tax law changes for Fiscal 2020. These adjustments have been excluded from the segment results to align with the measure used by our CODM in assessing segment performance and allocating resources. (b) Income taxes associated with pre-tax adjustments determined using statutory business unit tax rates. UGI Corporation | Fiscal 2020 Results 28
UGI Supplemental Footnotes • Management uses “adjusted net income attributable to UGI Corporation” and “adjusted diluted earnings per share,” both of which are non-GAAP financial measures, when evaluating UGI’s overall performance. Management believes that these non-GAAP measures provide meaningful information to investors about UGI’s performance because they eliminate gains and losses on commodity and certain foreign currency derivative instruments not associated with current-period transactions and other significant discrete items that can affect the comparison of period-over-period results. • Management does not designate its commodity and certain foreign currency derivative instruments as hedges under GAAP. Volatility in net income attributable to UGI Corporation as determined in accordance with GAAP can occur as a result of gains and losses on commodity and certain foreign currency derivative instruments not associated with current-period transactions. These gains and losses result principally from recording changes in unrealized gains and losses on unsettled commodity and certain foreign currency derivative instruments and, to a much lesser extent, certain realized gains and losses on settled commodity derivative instruments that are not associated with current-period transactions. However, because these derivative instruments economically hedge anticipated future purchases or sales of energy commodities, or in the case of certain foreign currency derivatives reduce volatility in anticipated future earnings associated with our foreign operations, we expect that such gains or losses will be largely offset by gains or losses on anticipated future energy commodity transactions or mitigate volatility in anticipated future earnings. • Non-GAAP financial measures are not in accordance with, or an alternative to, GAAP and should be considered in addition to, and not as a substitute for, the comparable GAAP measures. • The table on slide 28 reconciles net income attributable to UGI Corporation, the most directly comparable GAAP measure, to adjusted net income attributable to UGI Corporation, and the table on slide 10 reconciles diluted earnings per share, the most comparable GAAP measure, to adjusted diluted earnings per share, to reflect the adjustments referred to above. UGI Corporation | Fiscal 2020 Results 29

Investor Relations: Brendan Heck Alanna Zahora 610-456-6608 610-337-1004 heckb@ugicorp.com zahoraa@ugicorp.com
