Attached files
| file | filename |
|---|---|
| 8-K - FORM 8-K - UFP TECHNOLOGIES INC | f8k_111720.htm |
Exhibit 99.1

Welcome Investors November 2020

Safe Harbor Statement This presentation contains forward - looking information that involves risks and uncertainties, including statements about the Company’s prospects, anticipated advantages the Company expects to realize from its acquisition strategies, the Company’s financial performance, targets, goals, and metrics, participation in multiple markets, its engineering and product development resources, the benefits of the Company’s product development business (including its margin and customer relationship), the Company’s business opportunities and competitive advantages, the Company’s growth potential and strategies for growth, and statements about customer and industry demand. Investors are cautioned that such forward - looking statements are not guarantees of future performance and involve risks and uncertainties, including without limitation risks associated with the identification of suitable acquisition candidates and the successful, efficient execution of acquisition transactions and integration of any such acquisition candidates, economic conditions that affect sales of the products of the Company’s customers, the ability of the Company to obtain new customers, the ability of the Company to fulfill its obligations on long - term contracts and to retain current customers, the ability of the Company to maintain and grow its current margins, the Company’s ability to adapt to changing market needs and other factors as well as other risks and uncertainties that are detailed in the documents filed by the Company with the SEC. Accordingly, actual results may differ materially. The risks and uncertainties included above are not exhaustive. Readers are referred to the documents filed by the Company with the SEC, specifically the last reports on Forms 10 - K and 10 - Q. This presentation is provided as part of an oral presentation and is qualified by such. The forward - looking statements contained herein speak only of the Company’s expectations as of the date of this presentation. The Company expressly disclaims any obligation or undertaking to release publicly any updates or revisions to any such statement to reflect any change in the Company’s expectations or any change in events, conditions or circumstances on which any such statement is based.

Who We Are UFP Technologies is an innovative designer and custom manufacturer of components, subassemblies, products and packaging primarily for the medical market. Key Stats: Headquarters: Newburyport, MA Ticker : UFPT Market Cap: $356 million 1 Share Count: 7.5 million 2019 Annual Revenue: $198.8 million Established: 1963 Public Since: 1993 1, 0 00 employees /Temps 9 Manufacturing Facilities (US) 2 Design Centers (US) 1. As of November 10, 2020

Shaping Innovation We help our customers develop, improve, manufacture, or safely transport their products through: Materials expertise Design engineering capabilities Precision manufacturing capabilities

Our Process Innovative process from design and engineering to manufacturing and delivery Customer Challenge Design & Development Prototype Tooling Custom Equipment Quality Systems Commercial Production Pilot Manufacturing Proprietary and Tested Technology Integration

Product Development Business High Margin Added Expertise Stronger Customer Relationships Long Term Manufacturing Benefits

Growth Strategy Two - Pronged 1. Internal Growth: Market To Our Sweet Spot 2. Strategic Acquisitions

65% 10% 9% 4% 5% 7% Primary Focus Areas Medical • Infection prevention • Minimally Invasive Surgery • Fluid & Air Management • Protective Packaging • Patient Comfort • Wound Care • Wearables Automotive • Interior Trim & Structural • Acoustic/Thermal Insulation Consumer • Foam and fiber packaging • Personal comfort & protection Electronics • Packaging • Protection Industrial • Filtration • Acoustic insulation Aerospace & Defense • Uniforms and tactical gear • Tools & equipment protection • Thermal insulation

MedTech $457 billion Global Medical Device Market with a 4.4% CAGR 1 • UFP expertise in component solutions for orthopedics, infection prevention, wound care, and minimally invasive surgery • Customers include 24 of the top 28 largest medical device manufacturers in the world 2 UFP Differentiation • Exclusive or semi - exclusive access to medical grade materials • Medical device engineering team • Clean room manufacturing • Medical platform • Customer relationships • FDA - approved plants • Multiple locations • Advanced quality systems • Design and manufacture of custom equipment 1. 2019 Medical Device Industry Revenue, CAGR 2015 - 2019 – The Business Research Company 2. Medical Product Outsourcing Magazine - 2018

MedTech Product Portfolio Implant Packaging Radial Compression Device Equipment Drapes MedSurg Bed Compression Device Negative Pressure Wound Therapy (NPWT) Needleless Injection Cap Cleaners Surgical Site Prep
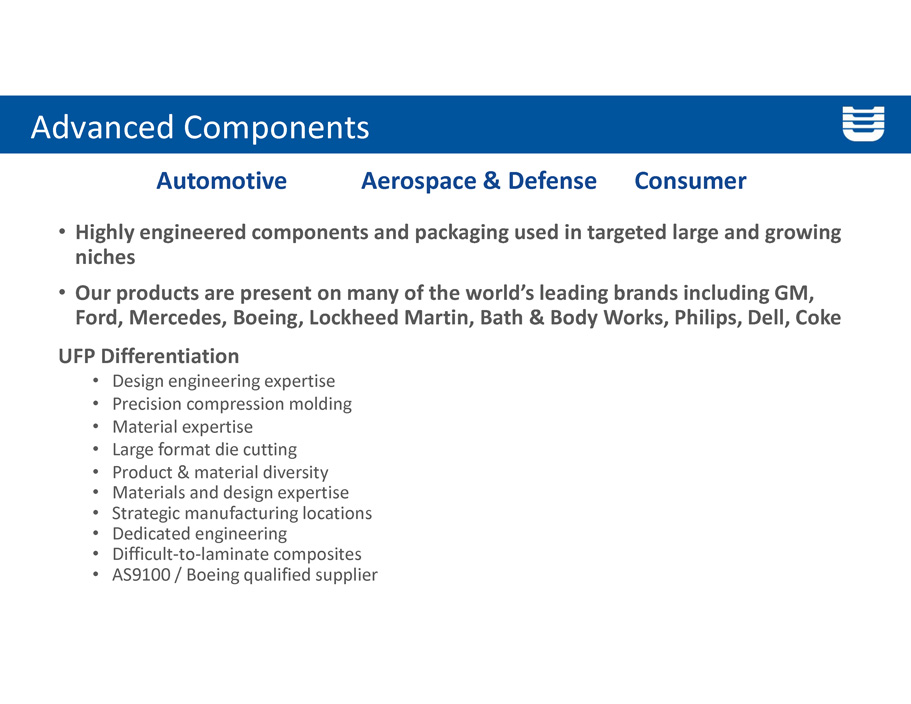
Advanced Components • Highly engineered components and packaging used in targeted large and growing niches • Our products are present on many of the world’s leading brands including GM, Ford, Mercedes, Boeing, Lockheed Martin, Bath & Body Works, Philips, Dell, Coke UFP Differentiation • Design engineering expertise • Precision compression molding • Material expertise • Large format die cutting • Product & material diversity • Materials and design expertise • Strategic manufacturing locations • Dedicated engineering • Difficult - to - laminate composites • AS9100 / Boeing qualified supplier Automotive Aerospace & Defense Consumer

Advanced Components Product Portfolio Military Uniform Gear Protective Cases SUV Load Floors Automotive Interior Trim Lacrosse Helmet Comfort Padding Candle Protective Packaging
Why Invest? • Significant market growth opportunities • Barriers to entry • Strong customer relationships • Experienced management team • Proven growth strategy • Attractive financial metrics

Why is UFP an Exciting Investment? Significant market growth opportunities • Addressable market is growing ▪ Medical device development ▪ Medical device manufacturing ▪ Medical components ▪ Medical packaging • Universe of specialty materials growing

Barriers To Entry Engineering Resources • Veteran engineering team for product design and development; more than 90 members of the engineering group Greater Access to Materials • Offers broad array of materials to meet customer needs • 50 + years in business and strong supplier relationships • Exclusive access to several specialty medical grade materials Scale • National footprint – competition is generally smaller companies that have limited resources and access to materials Systems • Advanced systems (extensive quality certifications) • In addition to existing equipment, engineers will design product specific innovations in order to meet customer needs Intellectual Property • 20 patents relating to foam, packaging, tool control, radio frequency welding, automotive super - forming processes, and other products Custom Equipment • In - house custom equipment manufacturing capabilities

National Footprint Gain Efficiencies Asset utilization Sharing best practices Sharing resources 9 Manufacturing Facilities Over 1 million square feet of space

R. Jeffrey Bailly – Chairman, CEO & President 31 - year history at the company, beginning as an operations manager in 1988; MBA, CPA. Ronald Lataille – CFO, Sr. VP & Treasurer 21 - year history at the company; CPA. Mitchell Rock – SVP, Sales & Marketing 21 - year history at the company. Chris Litterio – SVP, Human Resources & General Counsel Former Managing Partner and head of employment law at a major Boston law firm. Daniel Shaw – VP, R&D 30 - year history at the company . Management Team

Proven Growth Strategy Creating Shareholder Value

Organic Growth (Target of 5% - 7%) • Focus on higher growth markets (Medical – approximately 65% of revenue and growing) • Expand business with existing customers o Offer complementary products and services o Additional value - add services • Gain market share with competitive advantage o Engineering resources o Access to materials o Scale (footprint, clean room manufacturing) o Systems o Intellectual property Organic Growth Opportunity
Acquisition Growth (Target of 5% - 7%) Very fragmented market • No single company controls a large percentage of the market (UFP is one of the largest players) • 500 + companies (potential targets) • Many owner / operators at or near retirement age • Reputation for seamless integration Experienced and disciplined management team 11 acquisitions completed Acquisition Growth Opportunity

Continue to Focus on Higher - Growth, Higher - Margin Medical Opportunities that Create Value • Become more valuable to our customers • Strategic focus – new capability, geography, market penetration, materials, products • Add scale / market share • Look for synergistic opportunities Goal is for acquisitions to be accretive within the first year. Acquisitive Growth Opportunity

• Revenue $43 million • 100% medical • Single location in Chicopee, Massachusetts • Great cultural and strategic fit • Instantly accretive to earnings • Makes UFP more valuable to medical customers Dielectrics Acquisition

Financial Review Revenue Growth, Margin Expansion & Strong Financial Profile

10% - 14% Revenue Growth 12% - 14% Operating Margin 27% - 29% Gross Margin 3 to 5 Year Financial Targets Financial Targets

10% to 14% Targeted Revenue Growth Internal Growth + Acquisitions 0 20 40 60 80 100 120 140 160 180 200 2014 2015 2016 2017 2018 2019 $ Millions Revenue
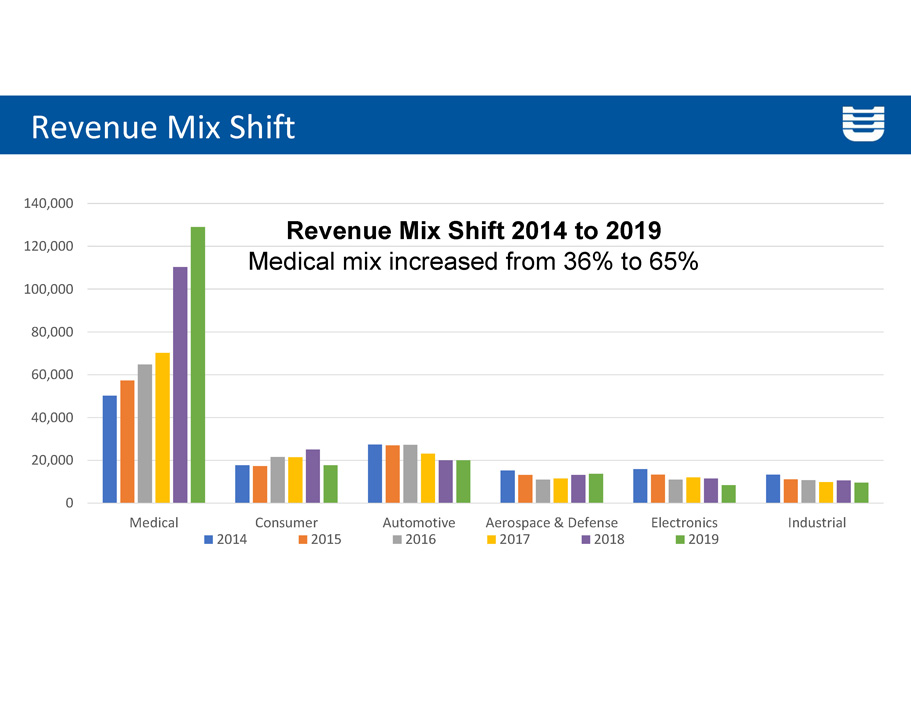
0 20,000 40,000 60,000 80,000 100,000 120,000 140,000 Medical Consumer Automotive Aerospace & Defense Electronics Industrial 2014 2015 2016 2017 2018 2019 Revenue Mix Shift Revenue Mix Shift 2014 to 2019 Medical mix increased from 36% to 65%

Gross Margin Target – 27% to 29% Operating Leverage from Mix Shift + Acquisition synergies + Efficiencies 27 - 29%Target 10.0% 15.0% 20.0% 25.0% 30.0% 2014 2015 2016 2017 2018 2019 Gross Profit Margin

Target: 12 - 14% Operating leverage from mix shift + acquisition synergies + efficiencies 0.0% 2.0% 4.0% 6.0% 8.0% 10.0% 12.0% 14.0% 2014 2015 2016 2017 2018 2019 * Adjusted Operating Income is a non - GAAP term. A reconciliation to GAAP is provided in the Appendix Adjusted* Operating Margin

Book Value EPS $1.59 $1.05 $1.05 $1.10 $1.26 $1.93 $2.63 $10.00 $12.00 $14.00 $16.00 $18.00 $20.00 $22.00 $24.00 2013 2014 2015 2016 2017 2018 2019 BV/ Share EPS Growing Book Value

R. Jeffrey Bailly Chairman, CEO & President Newburyport , Massachusetts Ronald Lataille CFO, Sr. VP & Treasurer Newburyport, Massachusetts UFP Technologies 100 Hale St. Newburyport, MA 01950 978 - 352 - 2200 www.ufpt.com

Reconciliation of Non - GAAP Results (in Millions) 2014 2015 2016 2017 2018 2019 Revenue, As Reported $ 139.3 $ 138.9 $ 146.1 $ 147.8 $ 190.5 $ 198.4 Operating Income, as reported 11.6 11.7 12.2 11.7 19.6 24.7 Add: Acquisition/ Restructuring related Costs 1.6 1.8 0.4 0.1 1.1 - Less: Material overcharge Settlement - - (2.1) (0.1) (0.1) - Less: Gain on Sale of fixed assets (0.1) - - - - - Adjusted Operating Income $ 13.1 $ 13.5 $ 10.5 $ 11.7 $ 20.6 $ 24.7 Adjusted Operating Margin 9.4% 9.7% 7.2% 7.9% 10.8% 12.4% Appendix