Attached files
| file | filename |
|---|---|
| 8-K - 8-K - Invitation Homes Inc. | invh-20201116.htm |

NAREIT REITworld Investor Conference November 17 – 18, 2020 Together with you, we make a house a home.

Disclaimer This presentation contains forward-looking statements within the meaning of Section 27A of the Securities Act of 1933, as amended, and Section 21E of the Securities Exchange Act of 1934, as amended (the “Exchange Act”), which include, but are not limited to, statements related to the Company's expectations regarding the performance of the Company's business, its financial results, its liquidity and capital resources, and other non-historical statements. In some cases, you can identify these forward-looking statements by the use of words such as “outlook,” “guidance,” “believes,” “expects,” “potential,” “continues,” “may,” “will,” “should,” “could,” “seeks,” “projects,” “predicts,” “intends,” “plans,” “estimates,” “anticipates,” or the negative version of these words or other comparable words. Such forward-looking statements are subject to various risks and uncertainties, including, among others, risks inherent to the single-family rental industry and the Company's business model, macroeconomic factors beyond the Company's control, competition in identifying and acquiring properties, competition in the leasing market for quality residents, increasing property taxes, homeowners’ association (“HOA”) and insurance costs, the Company's dependence on third parties for key services, risks related to the evaluation of properties, poor resident selection and defaults and non-renewals by the Company's residents, performance of the Company's information technology systems, risks related to the Company's indebtedness, and risks related to the potential negative impact of the ongoing COVID-19 pandemic, on the Company’s financial condition, results of operations, cash flows, business, associates, and residents. Accordingly, there are or will be important factors that could cause actual outcomes or results to differ materially from those indicated in these statements. Moreover, many of these factors have been heightened as a result of the ongoing and numerous adverse impacts of COVID-19. The Company believes these factors include, but are not limited to, those described under Part I. Item 1A. “Risk Factors” of the Annual Report on Form 10-K for the fiscal year ended December 31, 2019 and in the Company's Quarterly Report on Form 10-Q for the quarterly period ended September 30, 2020, filed with the Securities and Exchange Commission (the "SEC"), as such factors may be updated from time to time in the Company's periodic filings with the SEC, which are accessible on the SEC’s website at http://www.sec.gov. These factors should not be construed as exhaustive and should be read in conjunction with the other cautionary statements that are included in this presentation and in the Company's other periodic filings. The forward-looking statements speak only as of the date of this presentation, and the Company expressly disclaims any obligation or undertaking to publicly update or review any forward-looking statement, whether as a result of new information, future developments or otherwise, except to the extent otherwise required by law. 2

Key Takeaways and Updates Invitation Homes is positioned favorably for both near-term stability and long-term growth 1) Business continues to perform well Record-high Same Store average occupancy of 98.0% (+220 bps YoY) in October, up from 97.8% (+180 bps YoY) in 3Q20 Blended net effective rent growth of 4.7% in October (+90 bps YoY), with both new leases and renewals accelerating from 3Q20 Rent collections 97% of historical average in October ~$1.6B of liquidity as of September 30, 2020, with no debt maturities until 2022 2) Sourcing attractive acquisitions and pursuing strategic initiatives, with long-term growth story as strong as ever Ramping up acquisitions, with $175M closed in 3Q20, $169M closed in October (including 2 bulk deals - $75M) Rockpoint JV diversifies capital sources and adds ~$1B of dry powder for JV acquisitions alongside on-balance-sheet acquisitions Continuing to make progress on expansion of ancillary services and reinvestment in homes to enhance the resident experience Significant pipeline of demand in millennial generation likely to move toward single-family rental over the next decade 3) Invitation Homes enjoys unique competitive advantages Long-term high-growth market footprint with over 70% of revenues in the Western US and Florida Scale and market density of almost 5,000 homes per market is a key efficiency driver that is not easily replicable Local management, collaborating with central support, enhances control over asset quality and the resident experience 3

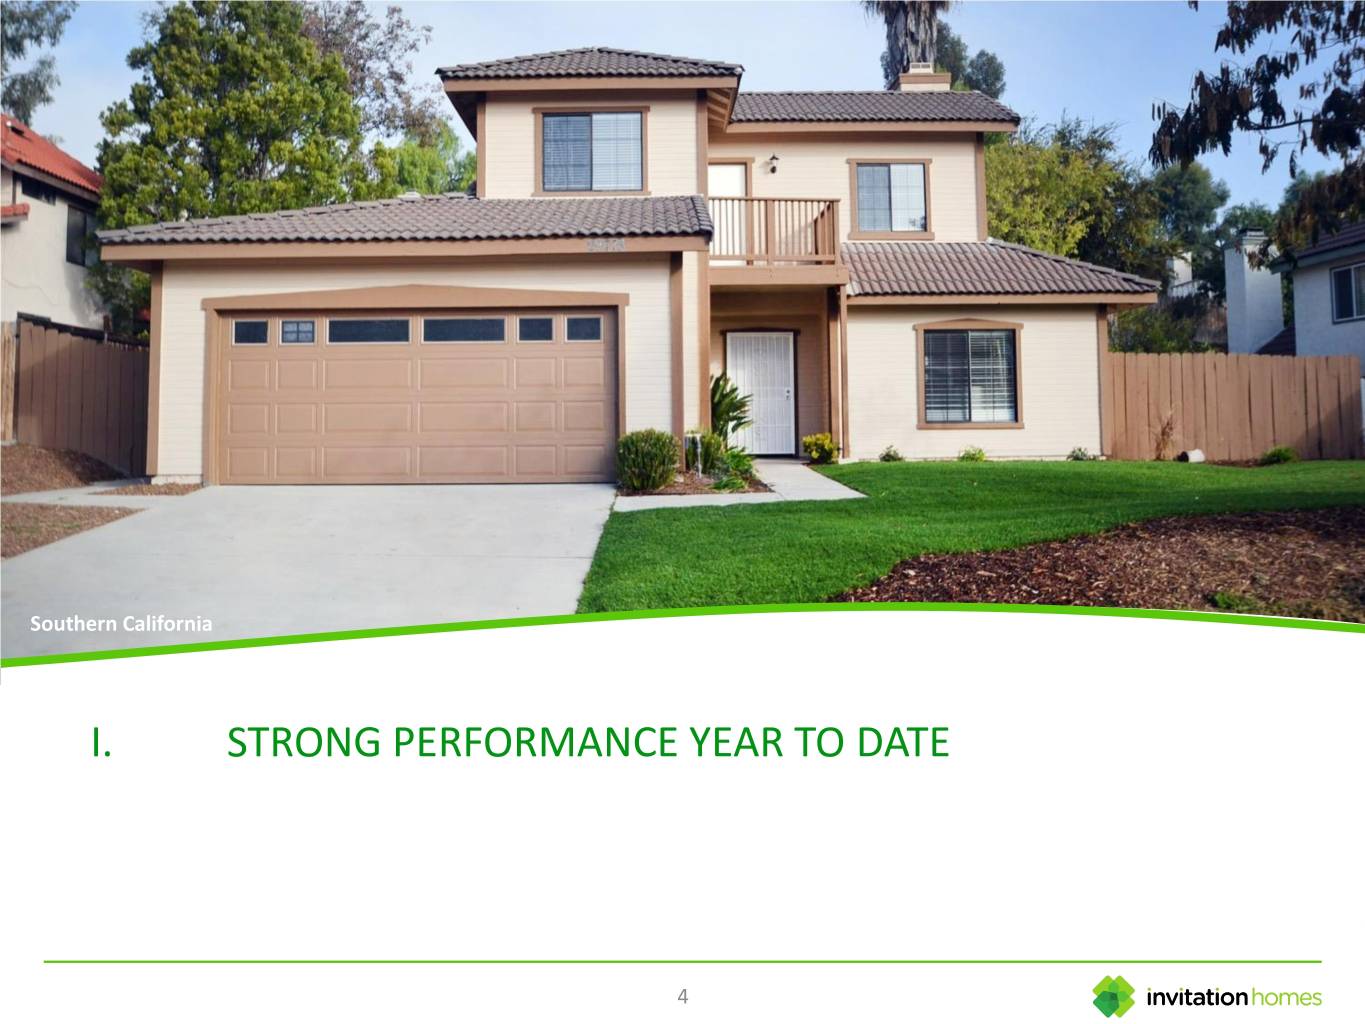
Southern California I. STRONG PERFORMANCE YEAR TO DATE 4

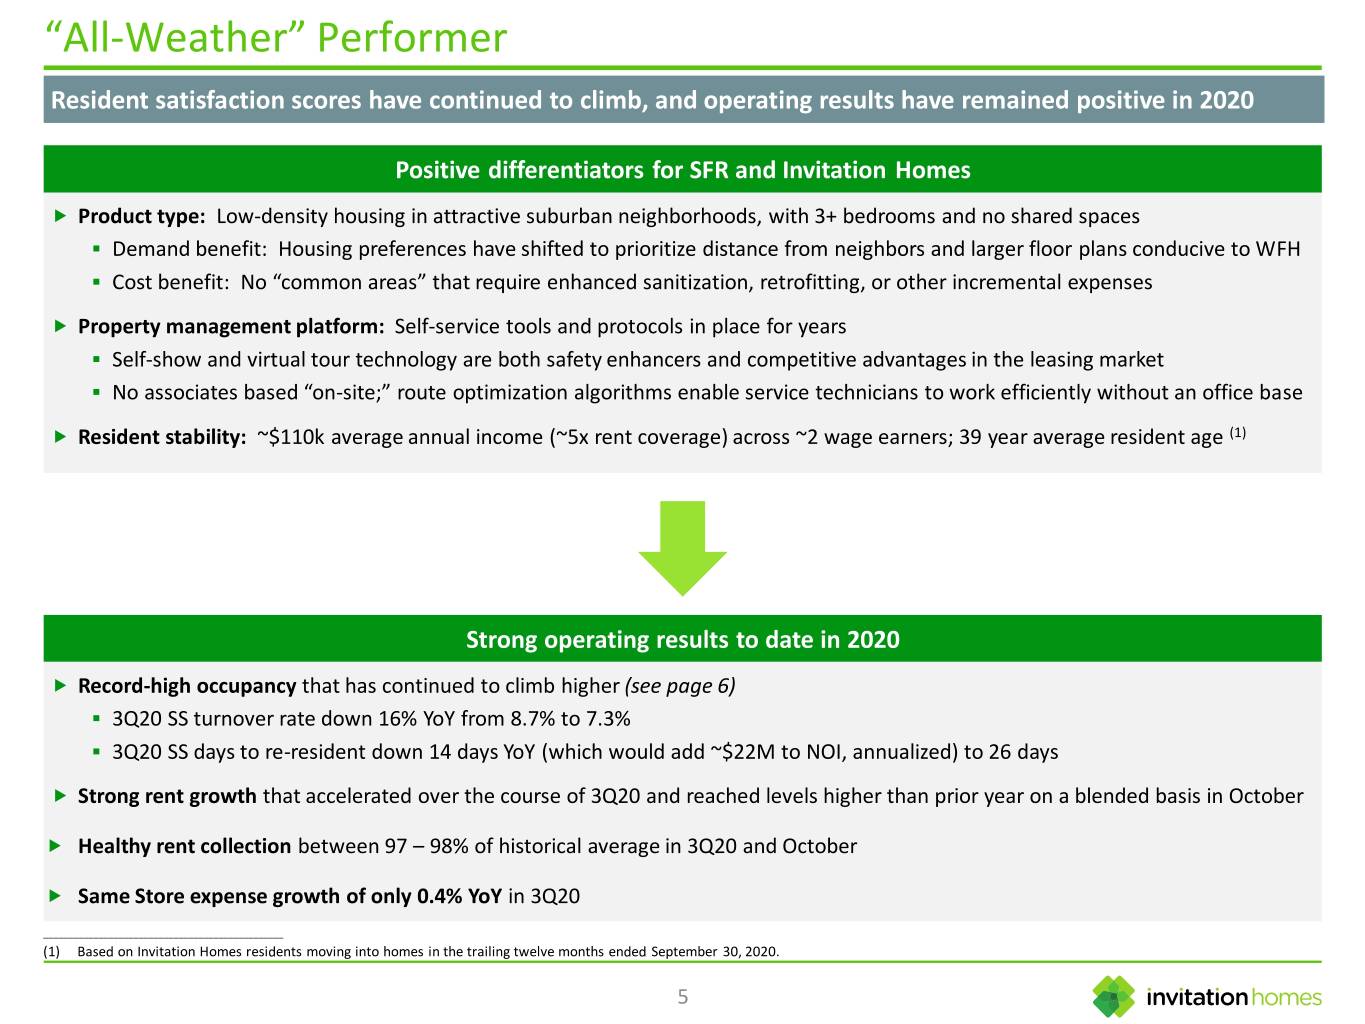
“All‐Weather” Performer Resident satisfaction scores have continued to climb, and operating results have remained positive in 2020 Positive differentiators for SFR and Invitation Homes Product type: Low-density housing in attractive suburban neighborhoods, with 3+ bedrooms and no shared spaces ▪ Demand benefit: Housing preferences have shifted to prioritize distance from neighbors and larger floor plans conducive to WFH ▪ Cost benefit: No “common areas” that require enhanced sanitization, retrofitting, or other incremental expenses Property management platform: Self-service tools and protocols in place for years ▪ Self-show and virtual tour technology are both safety enhancers and competitive advantages in the leasing market ▪ No associates based “on-site;” route optimization algorithms enable service technicians to work efficiently without an office base Resident stability: ~$110k average annual income (~5x rent coverage) across ~2 wage earners; 39 year average resident age (1) Strong operating results to date in 2020 Record-high occupancy that has continued to climb higher (see page 6) ▪ 3Q20 SS turnover rate down 16% YoY from 8.7% to 7.3% ▪ 3Q20 SS days to re-resident down 14 days YoY (which would add ~$22M to NOI, annualized) to 26 days Strong rent growth that accelerated over the course of 3Q20 and reached levels higher than prior year on a blended basis in October Healthy rent collection between 97 – 98% of historical average in 3Q20 and October Same Store expense growth of only 0.4% YoY in 3Q20 ________________________________________________ (1) Based on Invitation Homes residents moving into homes in the trailing twelve months ended September 30, 2020. 5

Record Occupancy and Accelerating Rent Growth Operating results have strengthened continuously throughout the year Same Store Average Occupancy Same Store New Lease Rent Rate Growth 2019 2020 98.0% 2019 2020 6.6% 97.8% 97.5% 5.5% 5.2% 4.2% 3.8% 96.7% 2.7% 2.5% 96.5% 96.5% 1.8% 95.9% 95.8% Q1 Q2 Q3 October 2020 Same Store Net Effective Rental Rate Growth: Q1 ‘20 Q2 ‘20 Q3 ‘20 Oct ‘20 Renewal 4.3% 3.5% 3.3% 3.7% New 1.8% 2.7% 5.5% 6.6% Q1 Q2 Q3 October Blended 3.5% 3.3% 4.0% 4.7% 6

Strong Balance Sheet & Liquidity; Delevering Alongside Acquisitions ~$1.6B of cash & revolver capacity (1), with no debt maturing prior to 2022; funding external growth with equity Strong balance sheet position as of September 30, 2020: $560M of cash and $1,000M of available capacity on revolving line of credit Significant cushion to credit facility covenants $156M of resident security deposits available if needed 51% of homes unencumbered Minimal financing needs and nimble investment platform: No debt reaching final maturity before 2022, and zero balance on revolving line of credit Currently funding on-balance-sheet acquisitions with 100% equity to reduce leverage concurrently with external growth ▪ Currently buying at a pace of ~$200M+ of acquisitions per quarter ▪ Ability to ramp acquisition pace up and down quickly to adapt to opportunity set Debt Maturity Schedule as of 9/30/2020 (Final maturities, $ in millions) $4,000 $2,844 $3,000 $2,000 $1,845 $924 $997 $1,000 $733 $614 $403 $- 2020 2021 2022 2023 2024 2025 2026 2027 2028 2029 2030 2031 ________________________________________________ (1) As of September 30, 2020. 7

Seattle II. HIGHLY COMPELLING LONG-TERM GROWTH STORY 8

Meeting an Underserved Need in the Housing Market IH provides a superior experience, but today serves only 0.5% of the growing demand for single-family rentals U.S. Housing Summary (1) Growing Single-Family Rental Demand (1) 126 Million Households Single-Family Rental Households Owned: 62% 17M (78M units) 13M Rented: 38% (48M units) 9M 5M 06 07 08 09 10 11 12 13 14 15 16 17 18 19 48 Million Rental Households Mobile Homes, Single-Family Boats, Etc.: 4% (1)(2) Rental: 35% (2M units) Single-Family Rental (SFR) Market Share (17M units) Home Count by Owner Type 10+ Unit "Mom & Pops" 16.2 million Apartments: 31% 2-9 Unit (15M units) Apartments: 29% Institutional (14M units) Owners 0.3 million ________________________________________________ (1) Source: John Burns Real Estate Consulting; data as of December 2019. (2) Source: Public company home counts from public filings as of 4Q19; Private company home counts estimated using HouseCanary data as of December 2019. 9

Demographics to Drive Household Formation John Burns Real Estate Consulting expects 12.5M net households to be formed over the next 10 years Significant pent-up demand in millennial generation likely to move toward single-family rental over the next decade Current Population by Age Cohort (1) Percentage of 30-Year-Olds Hitting ‘Adult’ Milestones (2) (millions of people) Future Delayed milestones = significant future demand Demand 1975 2015 24 56% Own a home 23 23.3 33% Avg. IH Resident Age: 39 22 76% 21.9 Live with a child 47% 21.4 21 21.3 20.8 Have ever 89% 20 20.3 married 57% 19.6 19 90% Live on their own 70% 18 15-19 20-24 25-29 30-34 35-39 40-44 45-49 ________________________________________________ (1) Source: U.S. Census Bureau, April 2020 (data as of 2019). (2) Source: U.S. Census Bureau, 2017. 10

Supply is Constrained Shortfall in single-family home construction is likely to continue Rising labor costs, materials costs, impact fees, and regulatory hurdles have been barriers to supply over the last decade Replacement cost increases for single-family housing have outpaced consumer inflation and household income growth Total Housing Permits (Single and Multifamily) as a % of Households in Invitation Homes’ Markets 4.0% Single-Family Multifamily 80-'19 Avg 3.0% 2.0% 1.0% 0.0% 1980 1983 1986 1989 1992 1995 1998 2001 2004 2007 2010 2013 2016 2019 ________________________________________________ Source: U.S. Census Bureau and John Burns Real Estate Consulting; data as of December 2019. 11

Best-in-Class Platform for External Growth IH’s multi-channel approach puts eyes on more opportunities and maximizes selectivity Channel agnostic, location specific Broker/MLS iBuyers Leverage AcquisitionIQ and Positioned to be “buyer broker network to maximize of choice” as the iBuyer deal flow market continues to grow Auction Investor Bulks Participate in municipal Active aggregation of 5+ and county auctions unit investor portfolios Builder Partnerships Sale Leaseback(1) Foster relationships to target Developing program targeting new-build supply in targeted supply owned by individuals interested neighborhoods In transitioning to leasing lifestyle ________________________________________________ (1) Channel currently in development. 12

Case Study – Dallas Bulk Transaction Closed a bulk transaction for $59M in Dallas in October at an attractive cap rate with potential NOI upside IH Portfolio Frisco - Plano The bulk transaction was comprised of 273 homes that overlap closely with Dallas Bulk Transaction the Company’s existing portfolio of Denton - 2,444(1) homes in Dallas Dallas NW Consistent with Invitation Homes’ buy Fort Worth North box targeting well-located, high-quality – Mid Cities homes at attractive values Rowlett - Dallas NE Portfolio was 95% occupied at closing Fort Worth with an average in place rent of $1,614 South & West Dallas South Arlington - Grand Prairie 5.7% going in cap rate with potential NOI upside by bringing the portfolio Average Property Characteristics onto Invitation Homes' platform Purchase price per home: $188K In-place rent: $1,614 Estimated renovation per home: $32.5K Size: 1,781 square ft ________________________________________________ (1) Home count as of September 30, 2020 13

Joint Venture Diversifies Capital Sources for External Growth Rockpoint JV adds $1B of reliable and cost-effective capital to acquire homes and add to economies of scale In October 2020, Invitation Homes and Rockpoint formed a joint venture to acquire and operate single-family rental homes ▪ $375M of committed equity: $75M (20%) from IH and $300M (80%) from Rockpoint ▪ Total buying power of ~$1B - $1.25B, including anticipated debt, expected to be deployed over 2 – 3 years ▪ Anticipated JV life of 5 – 8 years, with a ROFO structure in place at exit ▪ Rockpoint a great cultural fit and like-minded investor that views the SFR opportunity similarly to Invitation Homes Invitation Homes has the flexibility to continue buying on balance sheet concurrently with the JV ▪ IH investment directors source homes on an “entity blind” basis, with homes then allocated to IH or the JV based on prescribed target ratios in each market once acquisitions are ready to be closed ▪ IH plans to continue overequitizing on-balance-sheet acquisitions when accretive, reducing leverage alongside growth JV to invest and operate using an identical playbook to Invitation Homes ▪ IH in charge of all investment and operations within the JV, with freedom to buy the same kinds of homes and operate them the same way in the JV as in the wholly-owned IH portfolio ▪ Investment mechanics, flexibility, and control rights eliminate potential complication or conflict Attractive fee income stream ▪ IH will earn asset management and property management fees, with negligible incremental personnel required ▪ Opportunity to earn a promoted interest subject to certain performance thresholds 14

Growing Ancillary Services We remain on track with our multi-year plan to grow ancillary services to enhance the resident experience Smart Home Update: ▪ Base Smart Home package expanded for 2021 to include video doorbell along with smart lock and smart thermostat ▪ Upgraded Smart Home packages made available to residents who desire additional smart features ▪ New program structure increases profit margin to IH while enhancing benefits for residents HVAC Filter Program Update: ▪ Implemented program whereby HVAC filters are shipped by a 3rd party to all homes quarterly for a small fee to residents ▪ Reduces resident burden, improves energy efficiency, and reduces long-term HVAC maintenance costs ▪ Mandatory for all new leases beginning in 3Q20, and to become mandatory for all renewal leases beginning in 1Q21 We remain in the early innings of what the resident experience could look like ▪ We continue to see $15 – 30 million of run-rate annual ancillary income potential by the end of 2022 ▪ Future focus initiatives include pet programs, pest control, landscaping services, insurance suite, and energy optimization 15

Las Vegas III. UNIQUE IH COMPETITIVE ADVANTAGES 16

Differentiated Portfolio and Platform IH is strategically positioned around three pillars that enhance growth and the resident experience Outsized Growth and Unparalleled Resident Experience Location Scale Eyes in Markets • >70% of portfolio in • Almost 5,000 homes per • 17 in-house investment Western U.S. and Florida market on average professionals in markets (1) • In-fill neighborhoods • 800+ operations personnel • 96% of revenue from across 33 local home pods (1) • High barriers to markets with >2,000 homes homeownership • Proactive “ProCare” service visits by in-house techs • Outsized LT growth drivers • Density drives service efficiency and revenue • Local, in-house control of the • Insulation from new supply management intel resident experience ________________________________________________ (1) Personnel counts as of 9/30/2020. 17

Location: High-Growth Markets High-growth markets; In-fill neighborhoods with proximity to jobs, transportation, and schools >70% of revenue from Western Seattle U.S. and Florida 6% Minne- apolis 2x greater 2% Northern Chicago household formation in IH California 4% (1) 6% Denver markets versus U.S. avg 3% Las Vegas Southern 4% Carolinas California 5% 13% Phoenix 29% lower 8% Atlanta Dallas Jacksonville single-family supply growth 3% 13% 2% than LT avg in IH markets (1) Orlando Houston 7% 2% Tampa 10% South Florida 34% more 12% home price appreciation Percent of 3Q20 Core revenues than U.S. avg since 2012 (1) ________________________________________________ (1) Based on data for or through the year ended December 31, 2019; sources: John Burns Real Estate Consulting, S&P CoreLogic Case-Shiller home price indices. 18

Scale and Eyes in Markets: Atlanta Example Industry-leading scale enables Invitation Homes to operate efficiently with significant local presence in markets Atlanta - 12,510 Homes NW POD Team NE POD Team • 1 Vice President of Operations 3,424 Homes 3,320 Homes • 1 Director of Operations • 1 Rehab/Turn/R&M Director • 4 Portfolio Directors (POD) • 7 Portfolio Mgmt. Personnel • 12 Leasing Personnel • 22 Customer Care Reps • 69 Maintenance Techs/RTM Personnel SE POD Team Mack G., Maintenance Technician 2,931 Homes U.S. Army Veteran Resident Review: “I love Mack! He is a complete rock star! He is a courteous professional and gets the job done no matter what. He is the best maintenance person I've ever known and I have had many rental properties. He is a gem and IH is very lucky to have him as an SW POD Team employee. Mack is the best thing 2,835 Homes ever!” ________________________________________________ Note: Home counts and personnel counts as of 9/30/2020. 19
