Attached files
| file | filename |
|---|---|
| 8-K - FORM 8-K - Digital Media Solutions, Inc. | dms-20201116.htm |

Investor Presentation November 2020 Digital Media Solutions (NYSE: DMS) is a leading provider of technology and digital performance advertising solutions leveraging innovative, performance- driven brand-direct and marketplace solutions to connect consumers and advertisers.
Safe Harbor This presentation includes “forward‐looking statements” within the meaning of the “safe harbor” provisions of the Private Securities Litigation Reform Act of 1995. DMS’s actual results may differ from its expectations, estimates and projections and consequently, you should not rely on these forward‐looking statements as predictions of future events. Words such as “expect,” “estimate,” “project,” “budget,” “forecast,” “anticipate,” “intend,” “plan,” “may,” “will,” “could,” “should,” “believes,” “predicts,” “potential,” “continue,” and similar expressions are intended to identify such forward‐looking statements. These forward‐looking statements include, without limitation, DMS’s expectations with respect to its future performance and its ability to implement its strategy, including as they relate to the anticipated effects of the Business Combination. These forward‐looking statements involve significant risks and uncertainties that could cause the actual results to differ materially from the expected results. Most of these factors are outside DMS’s control and are difficult to predict. Factors that may cause such differences include, but are not limited to: (1) the inability to maintain the listing of DMS’s common stock or warrants on the New York Stock Exchange; (2) the risk that the transition to being a public company disrupts DMS’s plans and operations; (3) the ability to recognize the anticipated benefits of the Business Combination, which may be affected by, among other things, competition, the ability of the Company to grow and manage growth profitably and retain its key employees; (4) costs related to being a publicly‐traded company; (5) changes in applicable laws or regulations and the ability to maintain compliance with applicable laws or regulations; (6) the possibility that DMS may be adversely affected by other economic, business, and/or competitive factors, including: the ability to compete effectively for consumers and advertisers; the ability to successfully source and complete acquisitions and to integrate the operations of companies DMS acquires; the performance of DMS’s technology infrastructure; the ability to protect DMS’s intellectual property rights; the ability to maintain, grow and protect the data DMS obtains from consumers and advertisers; and the ability to maintain adequate internal controls over financial and management systems; and (7) other risks and uncertainties indicated from time to time in DMS’s filings with the SEC, including its registration statement, filed on August 7, 2020, including those under “Risk Factors”. Some of these risks and uncertainties may be amplified by the COVID‐19 pandemic and there may be additional risks that we consider immaterial or which are unknown. It is not possible to predict or identify all such risks. DMS cautions that the foregoing list of factors is not exclusive. DMS cautions readers not to place undue reliance upon any forward‐looking statements, which speak only as of the date made. DMS does not undertake or accept any obligation or undertaking to release publicly any updates or revisions to any forward‐looking statements to reflect any change in its expectations or any change in events, conditions or circumstances on which any such statement is based. Non-GAAP Financial Measures This presentation contains a discussion of certain non‐GAAP financial measures that the company uses to measure, analyze and compare its financial condition and results of operations in a meaningful and consistent manner. We use these measures to assess our operating performance and we believe that they provide useful information to investors regarding DMS’s operating performance. DMS believes that these measures are used by many investors, analysts and rating agencies as a measure of performance. Financial measures that are not U.S. GAAP should not be considered as alternatives to net income, reported revenue, operating income, or any other performance measures derived in accordance with GAAP as measures of operating performance. Non‐GAAP measures have limitations as analytical tools, and you should not consider them in isolation or as a substitute for analysis of our results as reported under GAAP. Because of these limitations, management relies primarily on its GAAP results and uses Adjusted Revenue, Adjusted EBITDA, Combined Adjusted EBITDA and other non‐GAAP measures only as a supplement. Where not included in the presentation directly, a reconciliation of these non‐GAAP financial measures to the most directly comparable GAAP measures can be found in the Appendix of this presentation (other than a reconciliation to net income on a forward‐looking basis, which cannot be forecast with reasonable certainty). 2

Digital Media Solutions (NYSE: DMS) is a leading provider of technology and digital performance advertising solutions leveraging innovative, performance-driven brand-direct and marketplace solutions to connect consumers and advertisers.
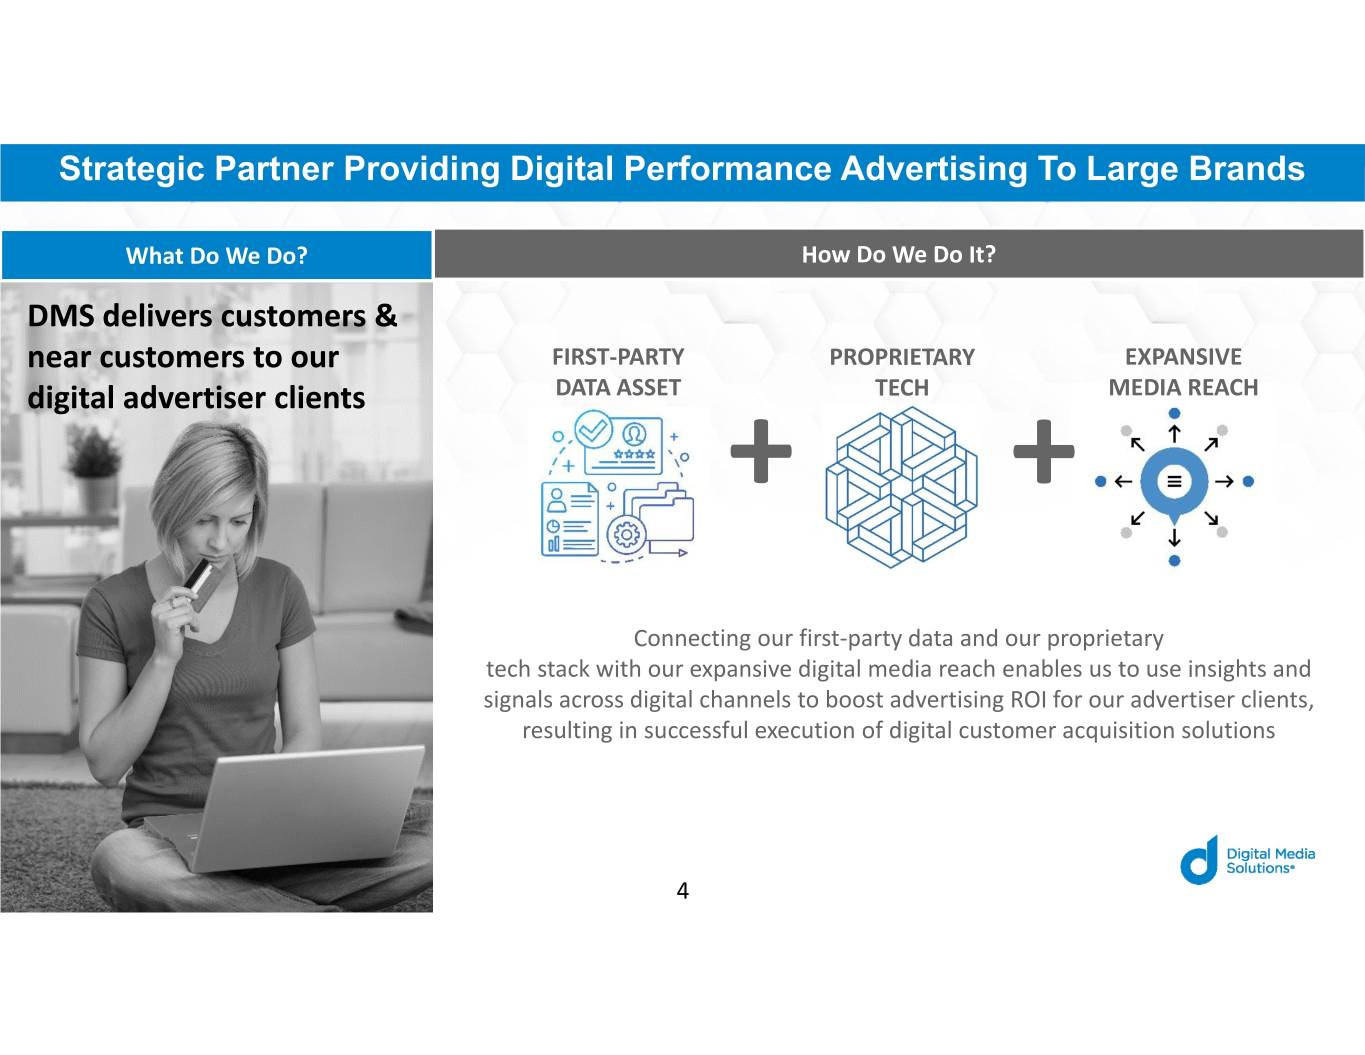
Strategic Partner Providing Digital Performance Advertising To Large Brands What Do We Do? How Do We Do It? DMS delivers customers & near customers to our FIRST‐PARTY PROPRIETARY EXPANSIVE digital advertiser clients DATA ASSET + TECH + MEDIA REACH Connecting our first‐party data and our proprietary tech stack with our expansive digital media reach enables us to use insights and signals across digital channels to boost advertising ROI for our advertiser clients, resulting in successful execution of digital customer acquisition solutions 4

Why DMS Stands Out 1. Continually updated first‐party data asset: • Built based on consumer actions, the result of $1B+ in advertising media spend since 2012; $439MM of the media spend has been since 2017, accelerating our database growth and value • Provides consumer intelligence and signals to understand audiences (where they are, what they want, when they engage, when they’re ready to buy) 2. Proprietary tech stack provides industry‐leading performance: • Agile, vertical‐ and channel‐agnostic platform positions DMS to service the $130B1 digital advertising market • Lets advertiser clients quickly launch and pivot campaigns based on brand and consumer needs (especially important when the world is changing quickly) • Delivers “the 4 Rs” (right person, right offer, right place, right time) 3. Single point of entry for digital customer acquisition solutions: • Solution portfolio inclusive of multiple advertising opportunities proven to be more effective when used together 4. De‐risks ad spend: • Pay‐for‐performance model; compensated for delivering customers and near customers 5. SaaS technology: • White‐label, self‐service software that allows brands to track marketing spend and consumer responses in real time 6. Sector‐agnostic model serving high‐value verticals with an emerging focus on insurance 5 1PwC estimate for 2021 internet ad spending in U.S.
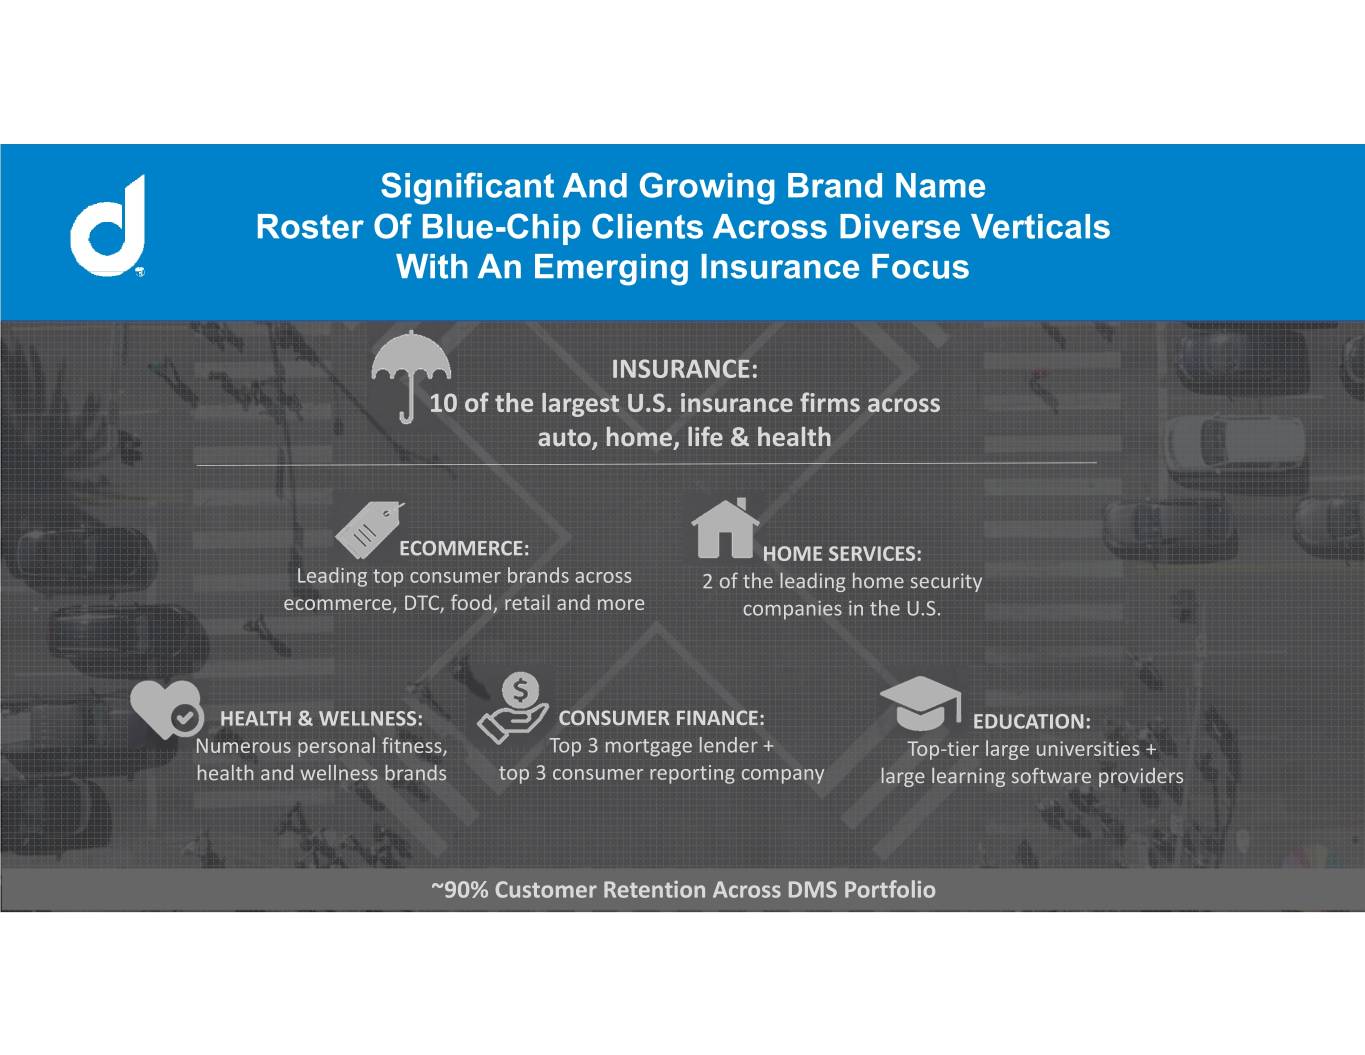
Significant And Growing Brand Name Roster Of Blue-Chip Clients Across Diverse Verticals With An Emerging Insurance Focus INSURANCE: 10 of the largest U.S. insurance firms across auto, home, life & health ECOMMERCE: HOME SERVICES: Leading top consumer brands across 2 of the leading home security ecommerce, DTC, food, retail and more companies in the U.S. HEALTH & WELLNESS: CONSUMER FINANCE: EDUCATION: Numerous personal fitness, Top 3 mortgage lender + Top‐tier large universities + health and wellness brands top 3 consumer reporting company large learning software providers ~90% Customer Retention Across DMS Portfolio
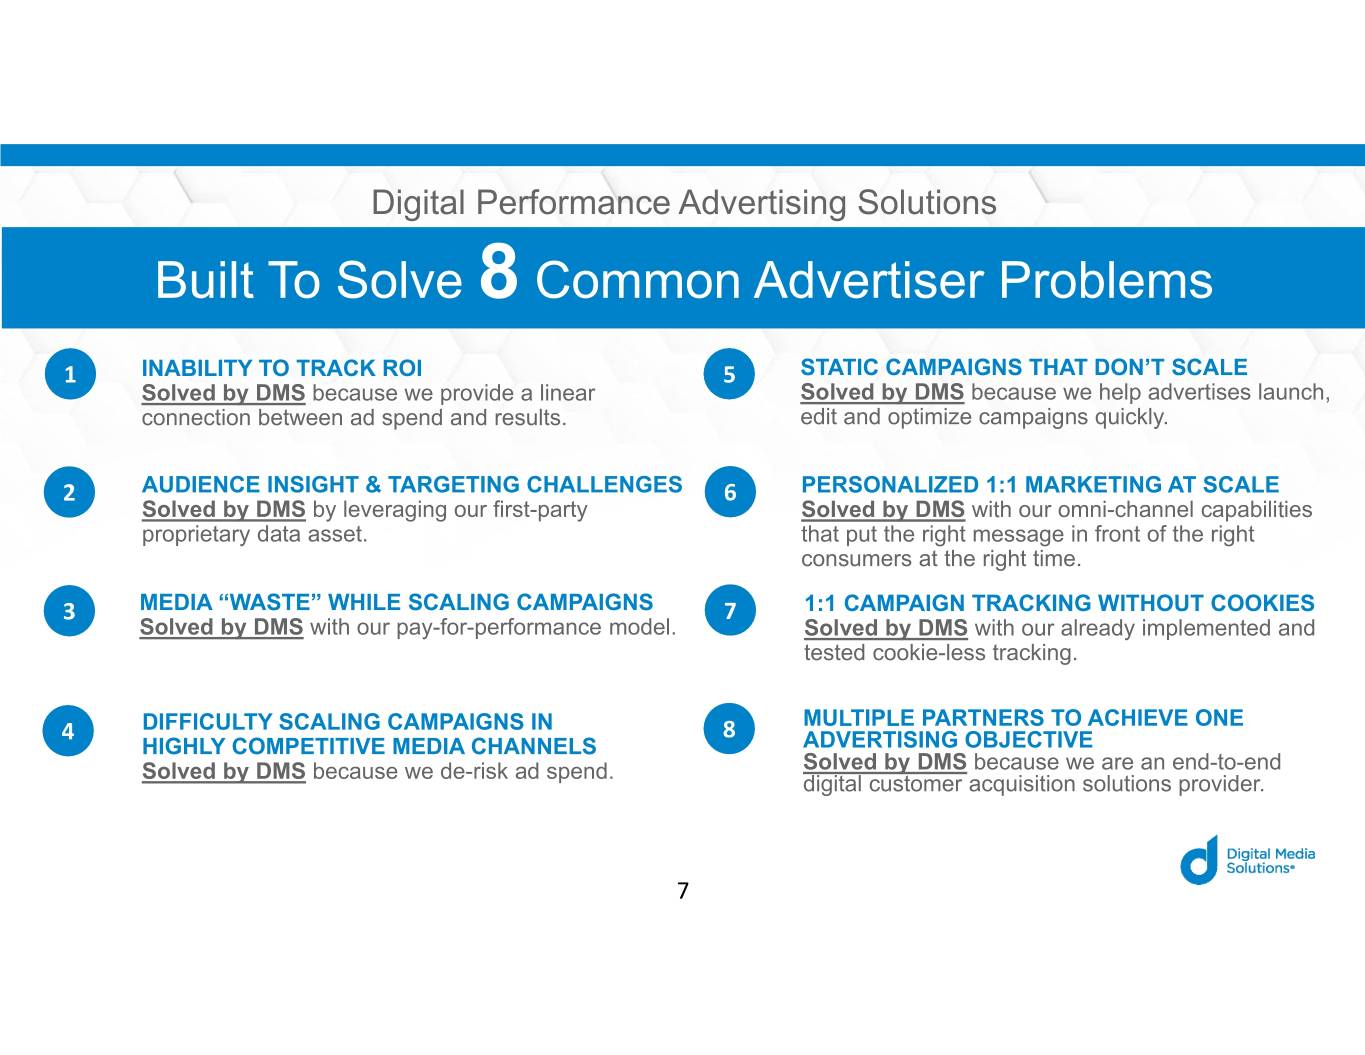
Digital Performance Advertising Solutions Built To Solve 8 Common Advertiser Problems 1 INABILITY TO TRACK ROI 5 STATIC CAMPAIGNS THAT DON’T SCALE Solved by DMS because we provide a linear Solved by DMS because we help advertises launch, connection between ad spend and results. edit and optimize campaigns quickly. 2 AUDIENCE INSIGHT & TARGETING CHALLENGES 6 PERSONALIZED 1:1 MARKETING AT SCALE Solved by DMS by leveraging our first-party Solved by DMS with our omni-channel capabilities proprietary data asset. that put the right message in front of the right consumers at the right time. 3 MEDIA “WASTE” WHILE SCALING CAMPAIGNS 7 1:1 CAMPAIGN TRACKING WITHOUT COOKIES Solved by DMS with our pay-for-performance model. Solved by DMS with our already implemented and tested cookie-less tracking. MULTIPLE PARTNERS TO ACHIEVE ONE 4 DIFFICULTY SCALING CAMPAIGNS IN 8 HIGHLY COMPETITIVE MEDIA CHANNELS ADVERTISING OBJECTIVE Solved by DMS because we de-risk ad spend. Solved by DMS because we are an end-to-end digital customer acquisition solutions provider. 7
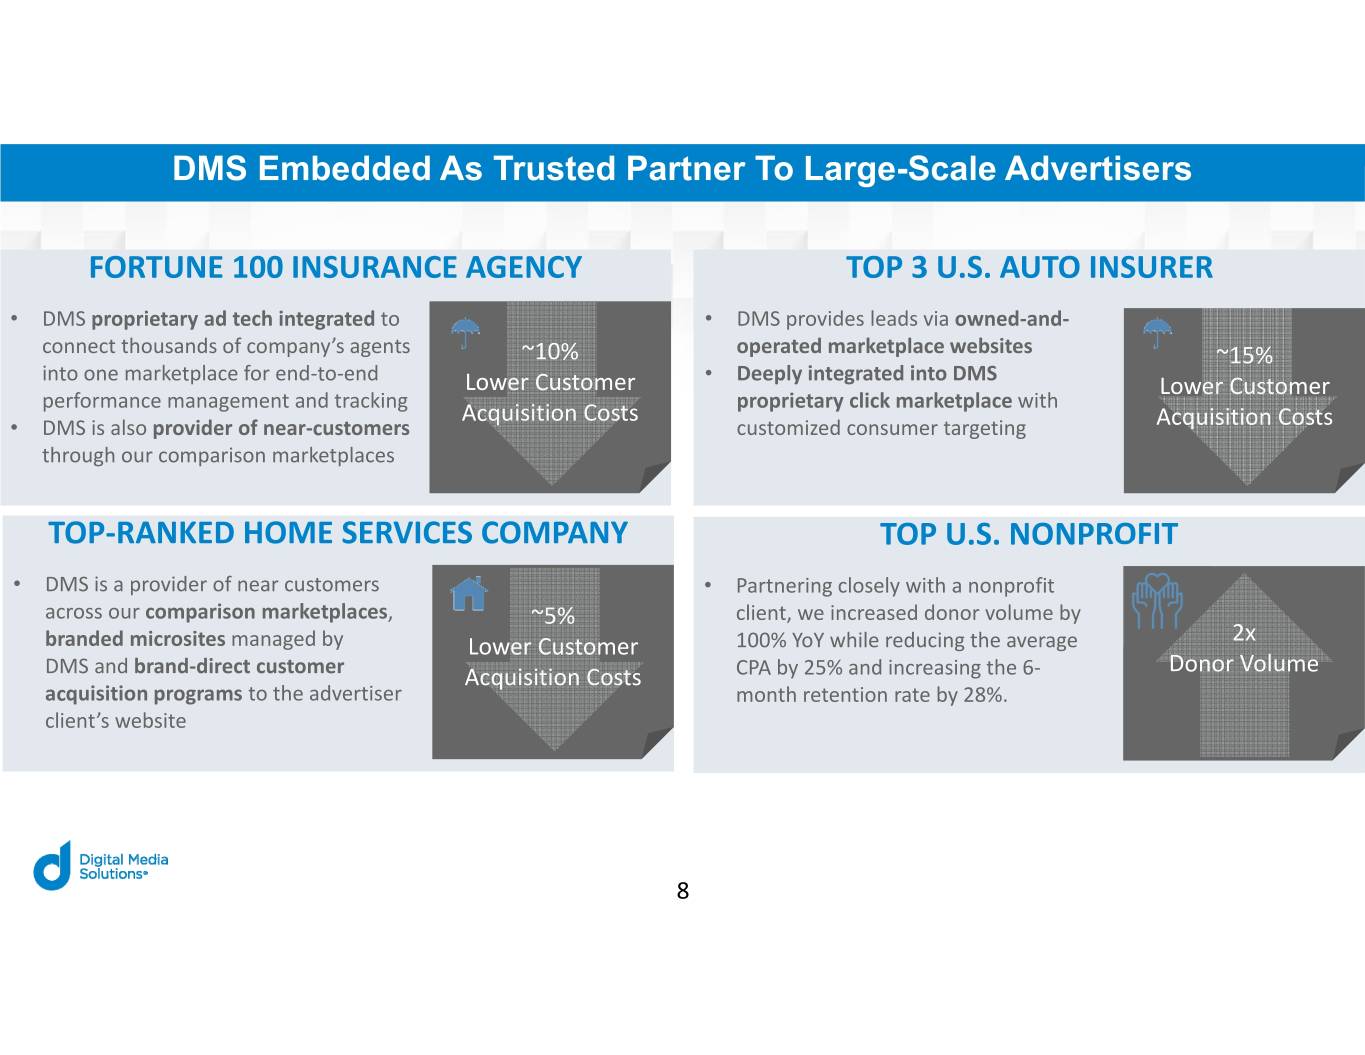
DMS Embedded As Trusted Partner To Large-Scale Advertisers FORTUNE 100 INSURANCE AGENCY TOP 3 U.S. AUTO INSURER • DMS proprietary ad tech integrated to • DMS provides leads via owned‐and‐ connect thousands of company’s agents ~10% operated marketplace websites ~15% into one marketplace for end‐to‐end • Deeply integrated into DMS Lower Customer Lower Customer performance management and tracking Acquisition Costs proprietary click marketplace with • DMS is also provider of near‐customers customized consumer targeting Acquisition Costs through our comparison marketplaces TOP‐RANKED HOME SERVICES COMPANY TOP U.S. NONPROFIT • DMS is a provider of near customers • Partnering closely with a nonprofit across our comparison marketplaces, ~5% client, we increased donor volume by 2x branded microsites managed by Lower Customer 100% YoY while reducing the average Donor Volume DMS and brand‐direct customer Acquisition Costs CPA by 25% and increasing the 6‐ acquisition programs to the advertiser month retention rate by 28%. client’s website 8

Diversified for Agility, With A Growing Focus On Insurance Vertical Diversity: Allows DMS to capture rising digital ad spend across verticals Insurance Focus: Consumer Finance: Allows DMS to leverage 11% efficiencies of scale Other Verticals: 14% to drive results Ecommerce / Brands: 19% 47% Education: 9% YTD Revenues through 9/30/2020. 9

Accelerating & Significant Growth In The Insurance Vertical Insurance is still in the early stages of digital transformation of ad spend, and we have seen this trend accelerate in 2020. Because of our strong value proposition to advertisers, our powerful proprietary technology solutions (DMS is the only digital performance advertiser to have a deep SaaS tech integration with a top U.S. insurance provider) and our first‐party data asset, we are seeing outpaced growth in the insurance vertical. 10

DMS Is Positioned To Grow With The Insurance Industry The nation’s top auto, home, health and life insurance carriers + their agents leverage our digital performance advertising solutions, including our: PROPRIETARY TECH ● FIRST‐PARTY DATA ● EXPANSIVE MEDIA REACH Vertical‐Agnostic Agent‐Centric Self‐Service, Vertical‐ Click Platform Self‐Service Platform Agnostic Lead Exchange 11
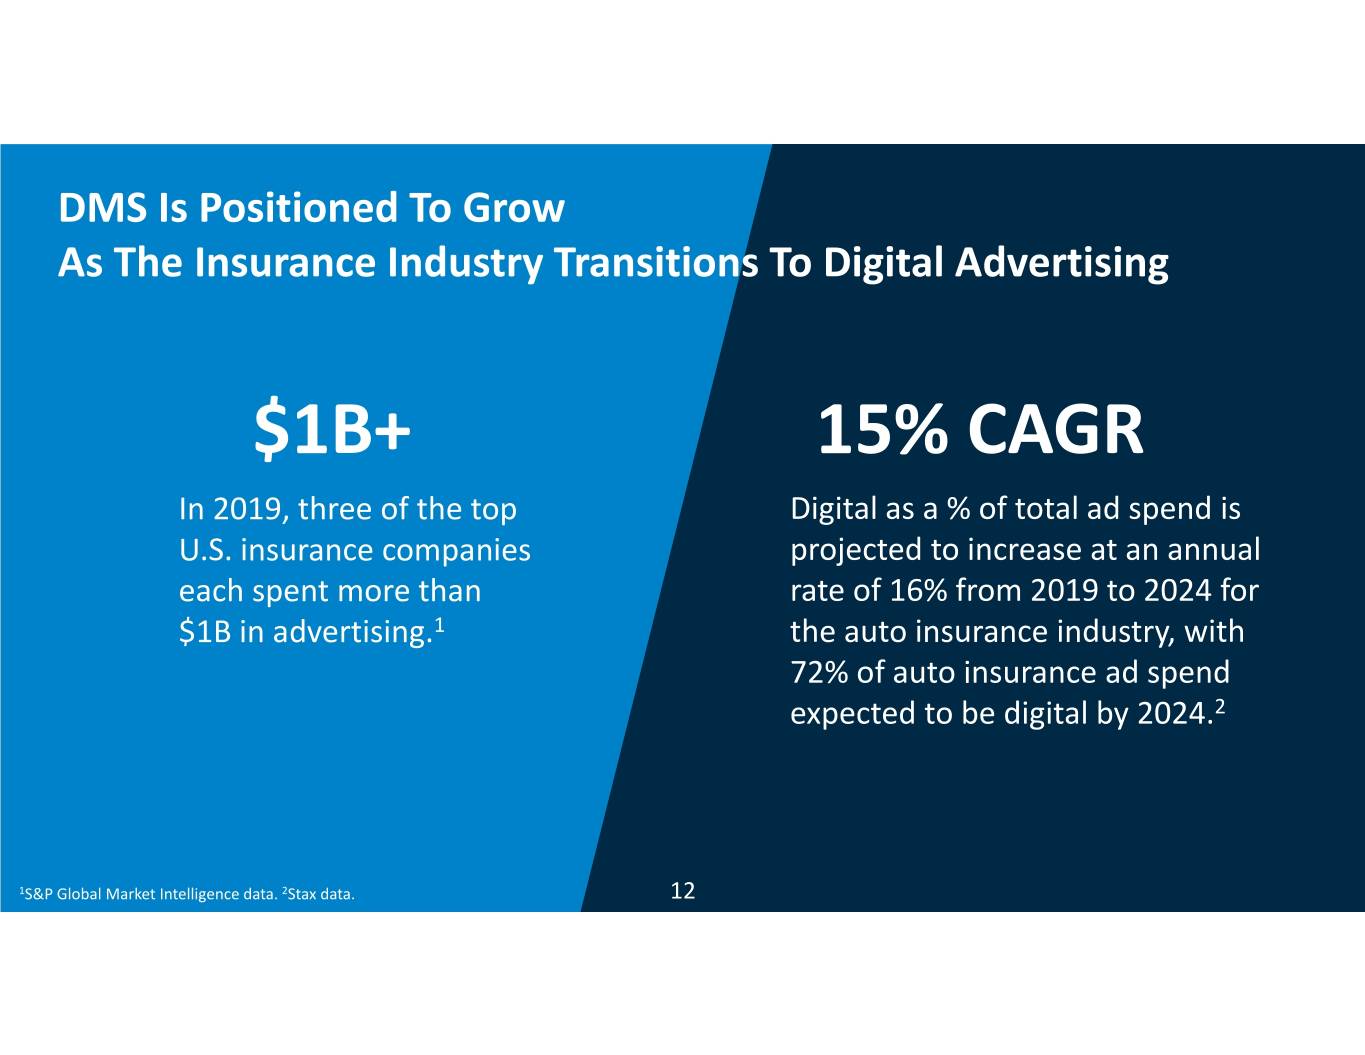
DMS Is Positioned To Grow As The Insurance Industry Transitions To Digital Advertising $1B+ 15% CAGR In 2019, three of the top Digital as a % of total ad spend is U.S. insurance companies projected to increase at an annual each spent more than rate of 16% from 2019 to 2024 for $1B in advertising.1 the auto insurance industry, with 72% of auto insurance ad spend expected to be digital by 2024.2 1S&P Global Market Intelligence data. 2Stax data. 12
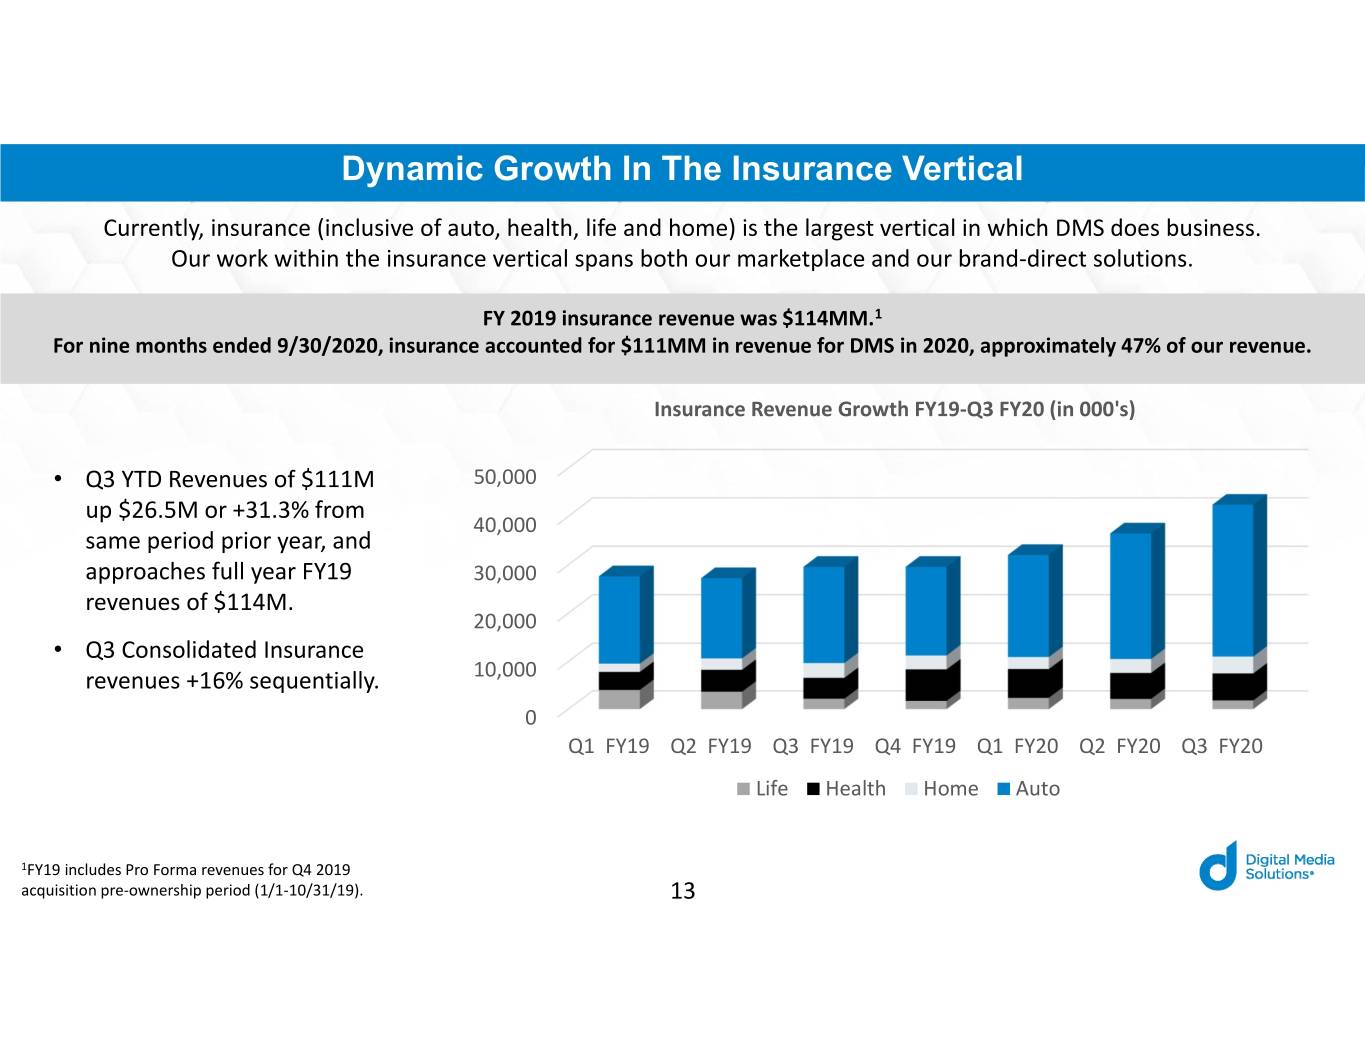
Dynamic Growth In The Insurance Vertical Currently, insurance (inclusive of auto, health, life and home) is the largest vertical in which DMS does business. Our work within the insurance vertical spans both our marketplace and our brand‐direct solutions. FY 2019 insurance revenue was $114MM.1 For nine months ended 9/30/2020, insurance accounted for $111MM in revenue for DMS in 2020, approximately 47% of our revenue. Insurance Revenue Growth FY19‐Q3 FY20 (in 000's) • Q3 YTD Revenues of $111M 50,000 up $26.5M or +31.3% from 40,000 same period prior year, and approaches full year FY19 30,000 revenues of $114M. 20,000 • Q3 Consolidated Insurance revenues +16% sequentially. 10,000 0 Q1 FY19 Q2 FY19 Q3 FY19 Q4 FY19 Q1 FY20 Q2 FY20 Q3 FY20 Life Health Home Auto 1FY19 includes Pro Forma revenues for Q4 2019 acquisition pre‐ownership period (1/1‐10/31/19). 13
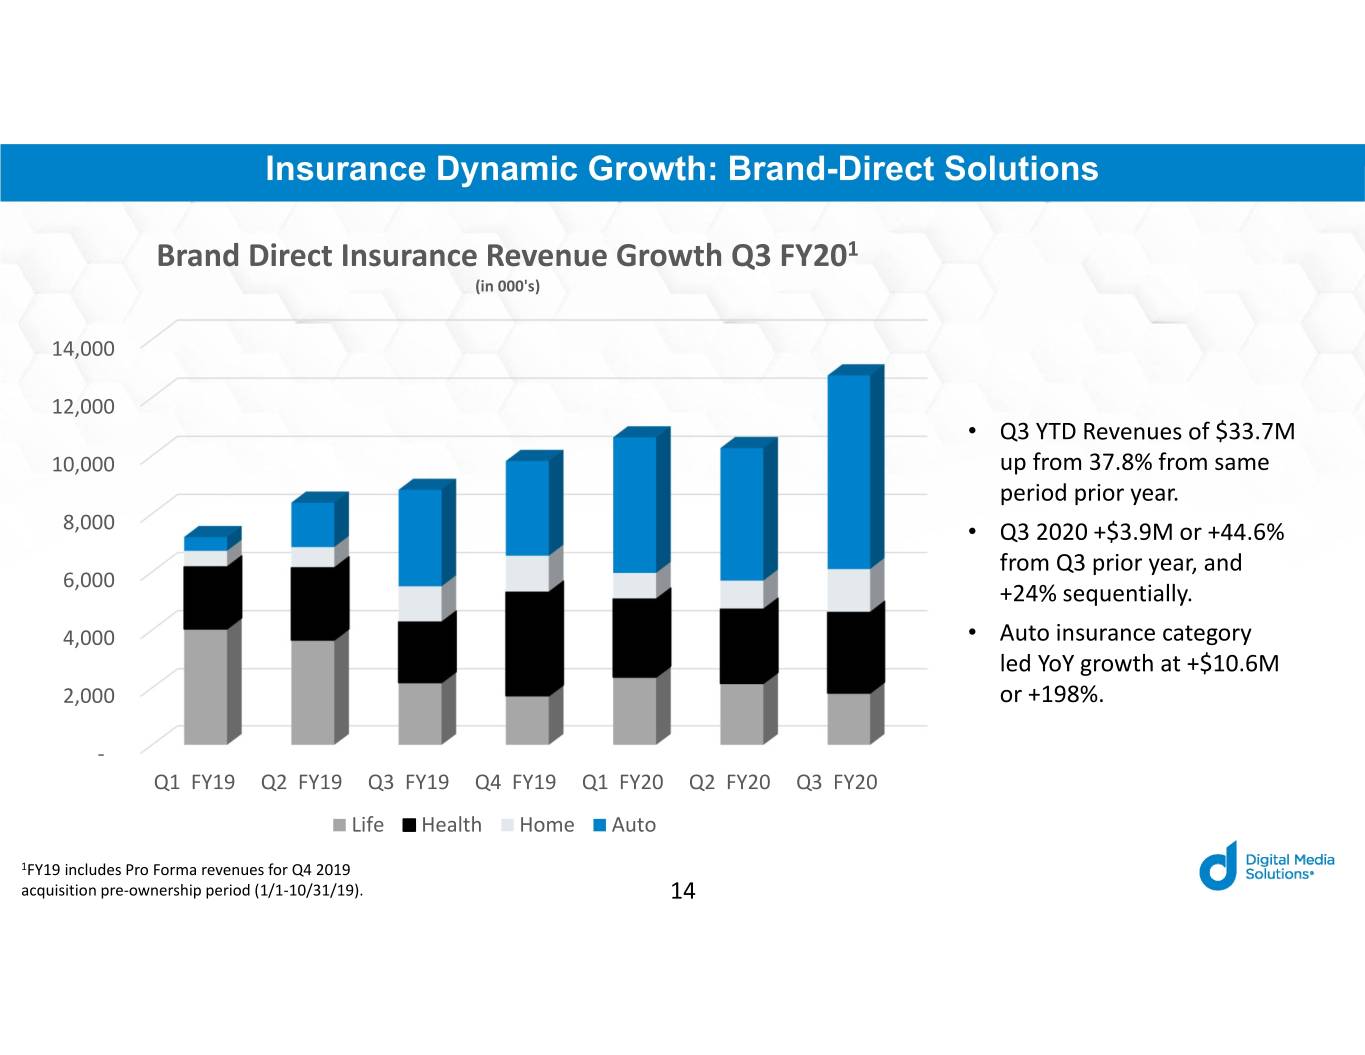
Insurance Dynamic Growth: Brand-Direct Solutions Brand Direct Insurance Revenue Growth Q3 FY201 (in 000's) 14,000 12,000 • Q3 YTD Revenues of $33.7M 10,000 up from 37.8% from same period prior year. 8,000 • Q3 2020 +$3.9M or +44.6% from Q3 prior year, and 6,000 +24% sequentially. 4,000 • Auto insurance category led YoY growth at +$10.6M 2,000 or +198%. ‐ Q1 FY19 Q2 FY19 Q3 FY19 Q4 FY19 Q1 FY20 Q2 FY20 Q3 FY20 Life Health Home Auto 1FY19 includes Pro Forma revenues for Q4 2019 acquisition pre‐ownership period (1/1‐10/31/19). 14

Insurance Dynamic Growth: Marketplace Solutions Marketplace Insurance Revenue Growth Q3 20 (in 000's) 30,000 20,000 10,000 0 Q1 FY191 Q2 FY1911 Q3 FY19 Q4 FY191 Q1 FY20 Q2 FY20 Q3 FY20 Life Health Home Auto • Q3 YTD Revenues of $77.3M • Q3 2020 +$8.9M or +43% • Auto and Health led YoY growth up $17.2M or +28.7% from from Q3 prior year, and at +$13.3M (+27%) and +$3.1M same period prior year. +13% sequentially. (+50.8%), respectively. 1FY19 includes Pro Forma revenues for Q4 2019 acquisition pre‐ownership period (1/1‐10/31/19). 15
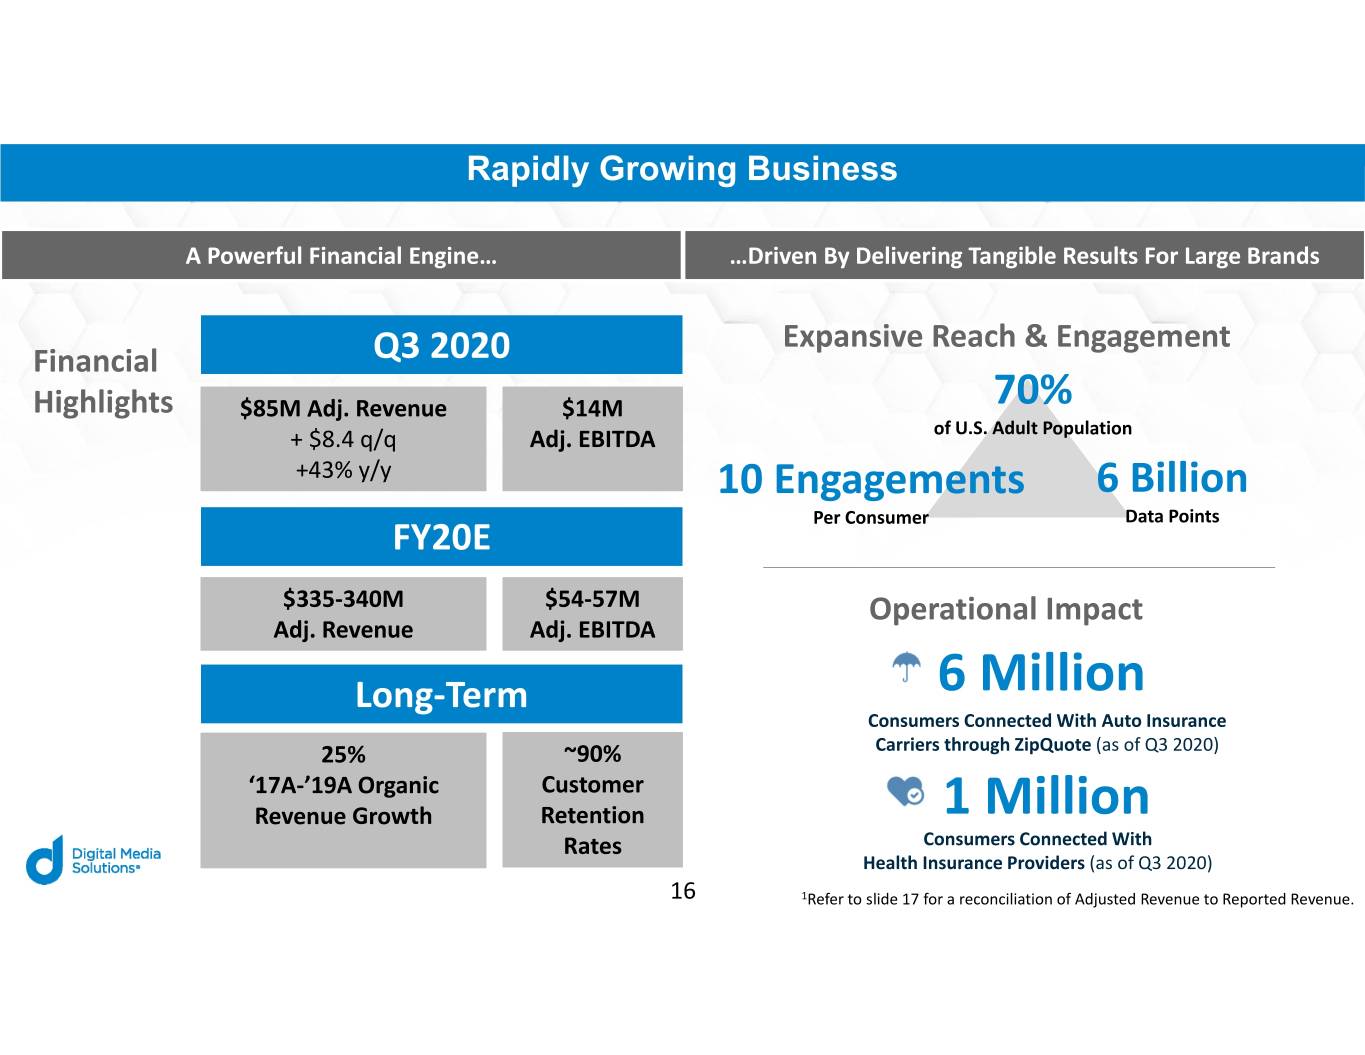
Rapidly Growing Business A Powerful Financial Engine… …Driven By Delivering Tangible Results For Large Brands Expansive Reach & Engagement Financial Q3 2020 Highlights $85M Adj. Revenue $14M 70% + $8.4 q/q Adj. EBITDA of U.S. Adult Population +43% y/y 10 Engagements 6 Billion Per Consumer Data Points FY20E $335‐340M $54‐57M Operational Impact Adj. Revenue Adj. EBITDA Long‐Term 6 Million Consumers Connected With Auto Insurance 25% ~90% Carriers through ZipQuote (as of Q3 2020) ‘17A‐’19A Organic Customer Revenue Growth Retention 1 Million Rates Consumers Connected With Health Insurance Providers (as of Q3 2020) 16 1Refer to slide 17 for a reconciliation of Adjusted Revenue to Reported Revenue.
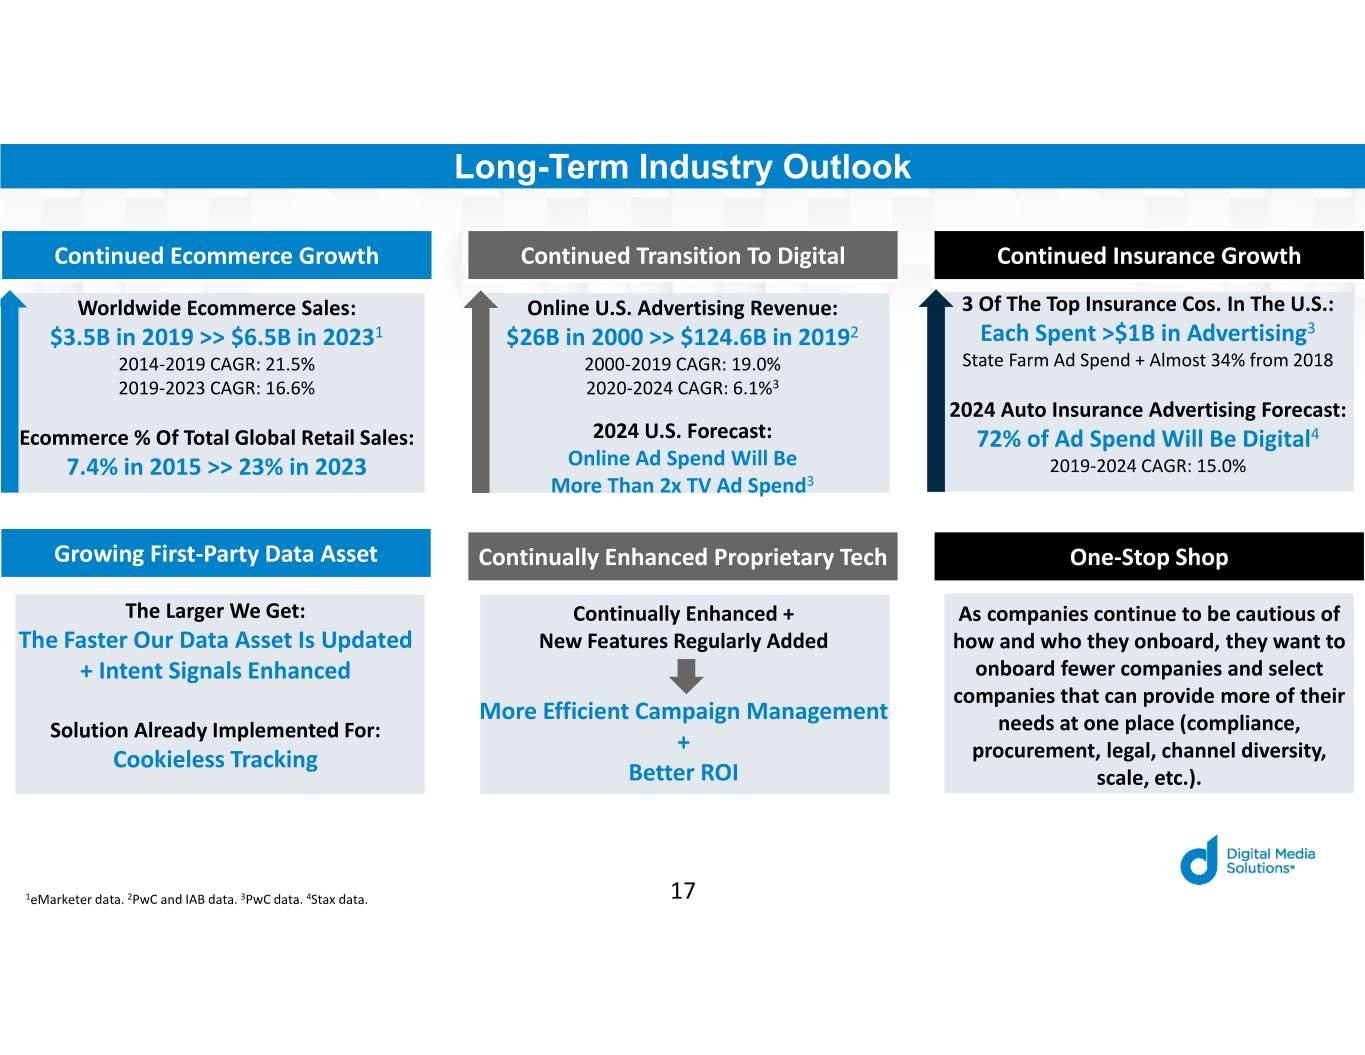
Long-Term Industry Outlook Continued Ecommerce Growth Continued Transition To Digital Continued Insurance Growth Worldwide Ecommerce Sales: Online U.S. Advertising Revenue: 3 Of The Top Insurance Cos. In The U.S.: $3.5B in 2019 >> $6.5B in 20231 $26B in 2000 >> $124.6B in 20192 Each Spent >$1B in Advertising3 2014‐2019 CAGR: 21.5% 2000‐2019 CAGR: 19.0% State Farm Ad Spend + Almost 34% from 2018 2019‐2023 CAGR: 16.6% 2020‐2024 CAGR: 6.1%3 2024 Auto Insurance Advertising Forecast: Ecommerce % Of Total Global Retail Sales: 2024 U.S. Forecast: 72% of Ad Spend Will Be Digital4 7.4% in 2015 >> 23% in 2023 Online Ad Spend Will Be 2019‐2024 CAGR: 15.0% More Than 2x TV Ad Spend3 Growing First‐Party Data Asset Continually Enhanced Proprietary Tech One‐Stop Shop The Larger We Get: Continually Enhanced + As companies continue to be cautious of The Faster Our Data Asset Is Updated New Features Regularly Added how and who they onboard, they want to + Intent Signals Enhanced onboard fewer companies and select companies that can provide more of their More Efficient Campaign Management needs at one place (compliance, Solution Already Implemented For: + Cookieless Tracking procurement, legal, channel diversity, Better ROI scale, etc.). 1eMarketer data. 2PwC and IAB data. 3PwC data. 4Stax data. 17

A Look Ahead: Marketplace Growth Premium Marketplace For Consumers To Shop, Save And Compare Products & Services That Protect Their Lives 18
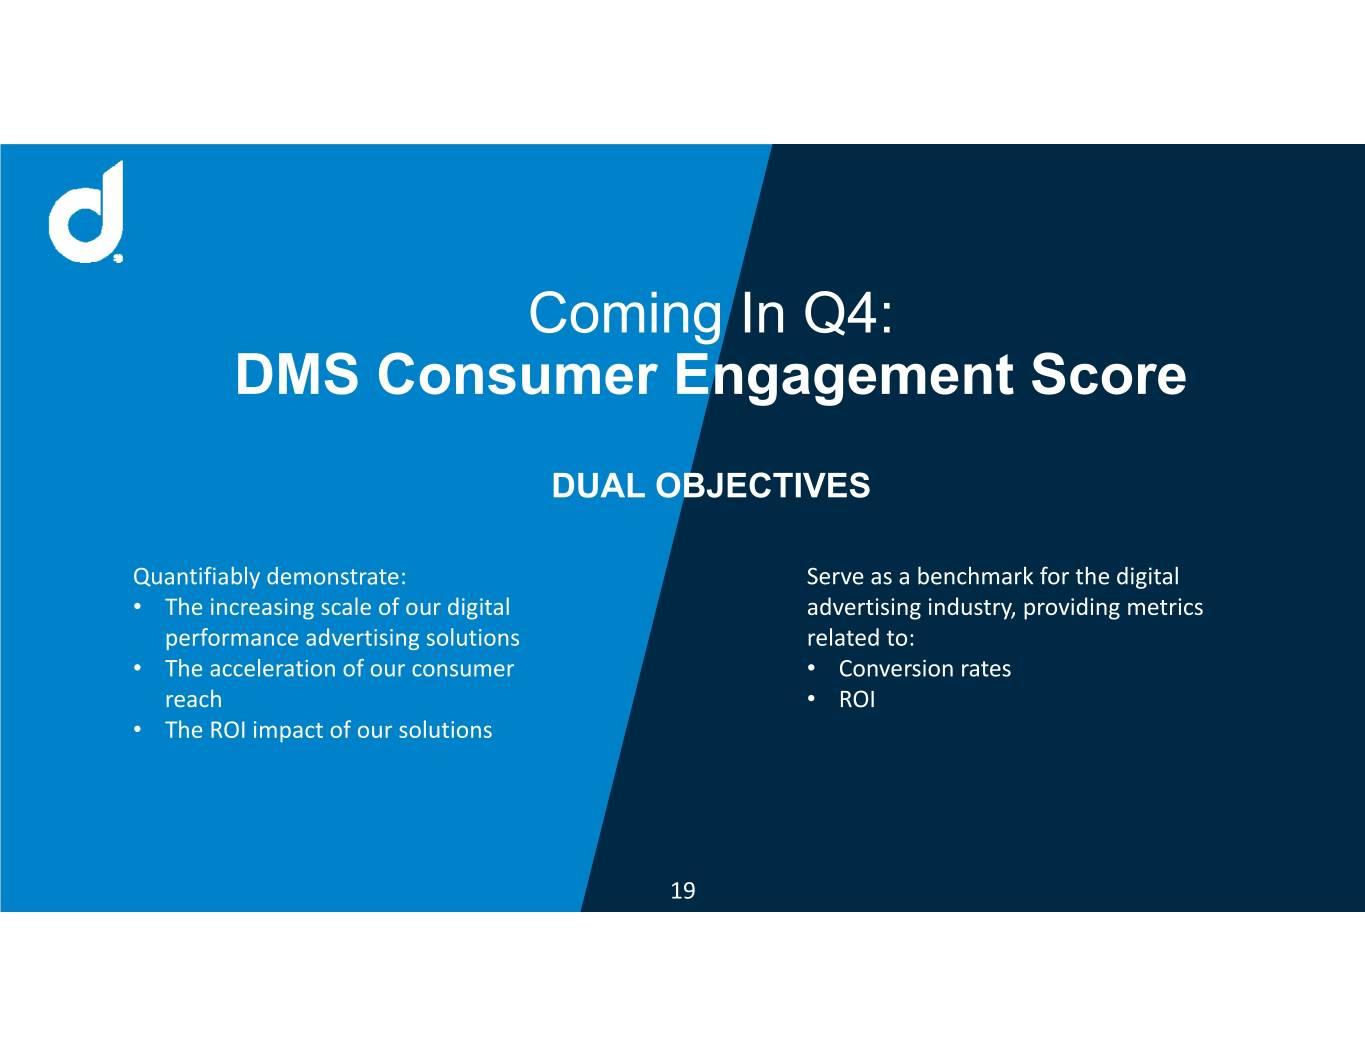
Coming In Q4: DMS Consumer Engagement Score DUAL OBJECTIVES Quantifiably demonstrate: Serve as a benchmark for the digital • The increasing scale of our digital advertising industry, providing metrics performance advertising solutions related to: • The acceleration of our consumer • Conversion rates reach • ROI • The ROI impact of our solutions 19
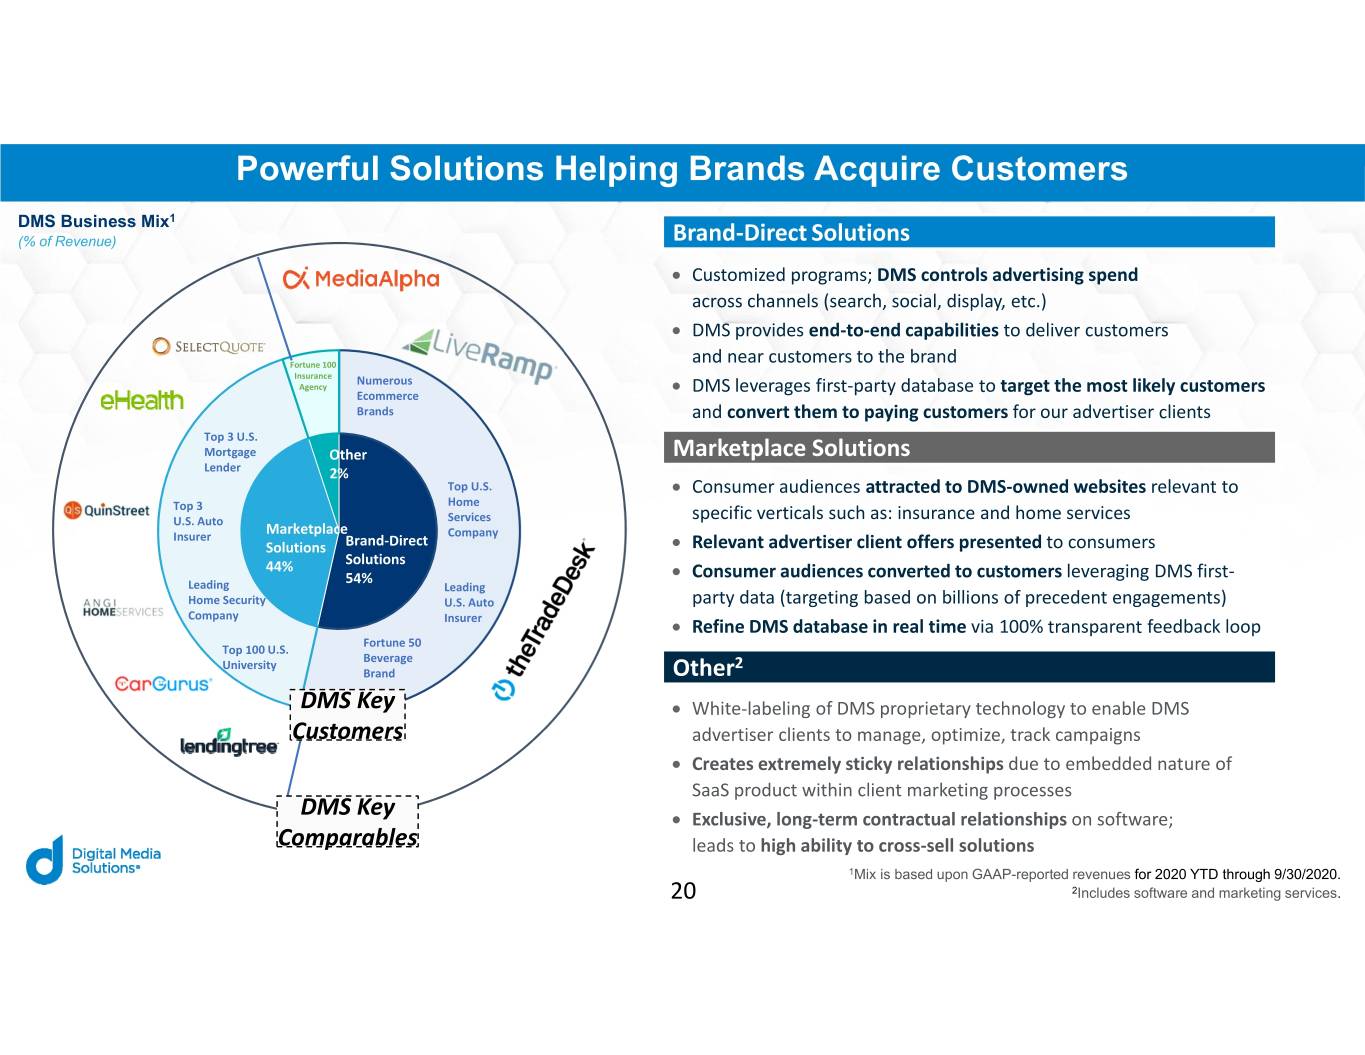
Powerful Solutions Helping Brands Acquire Customers DMS Business Mix1 (% of Revenue) Brand‐Direct Solutions Customized programs; DMS controls advertising spend across channels (search, social, display, etc.) DMS provides end‐to‐end capabilities to deliver customers Fortune 100 and near customers to the brand Insurance Numerous Agency Ecommerce DMS leverages first‐party database to target the most likely customers Brands and convert them to paying customers for our advertiser clients Top 3 U.S. Mortgage Other Marketplace Solutions Lender 2% Top U.S. Consumer audiences attracted to DMS‐owned websites relevant to Top 3 Home U.S. Auto Services specific verticals such as: insurance and home services Insurer Marketplace Company Solutions Brand‐Direct Relevant advertiser client offers presented to consumers 44% Solutions 54% Consumer audiences converted to customers leveraging DMS first‐ Leading Leading Home Security U.S. Auto party data (targeting based on billions of precedent engagements) Company Insurer Refine DMS database in real time via 100% transparent feedback loop Fortune 50 Top 100 U.S. Beverage University 2 Brand Other DMS Key White‐labeling of DMS proprietary technology to enable DMS Customers advertiser clients to manage, optimize, track campaigns Creates extremely sticky relationships due to embedded nature of SaaS product within client marketing processes DMS Key Exclusive, long‐term contractual relationships on software; Comparables leads to high ability to cross‐sell solutions 1Mix is based upon GAAP-reported revenues for 2020 YTD through 9/30/2020. 20 2Includes software and marketing services.
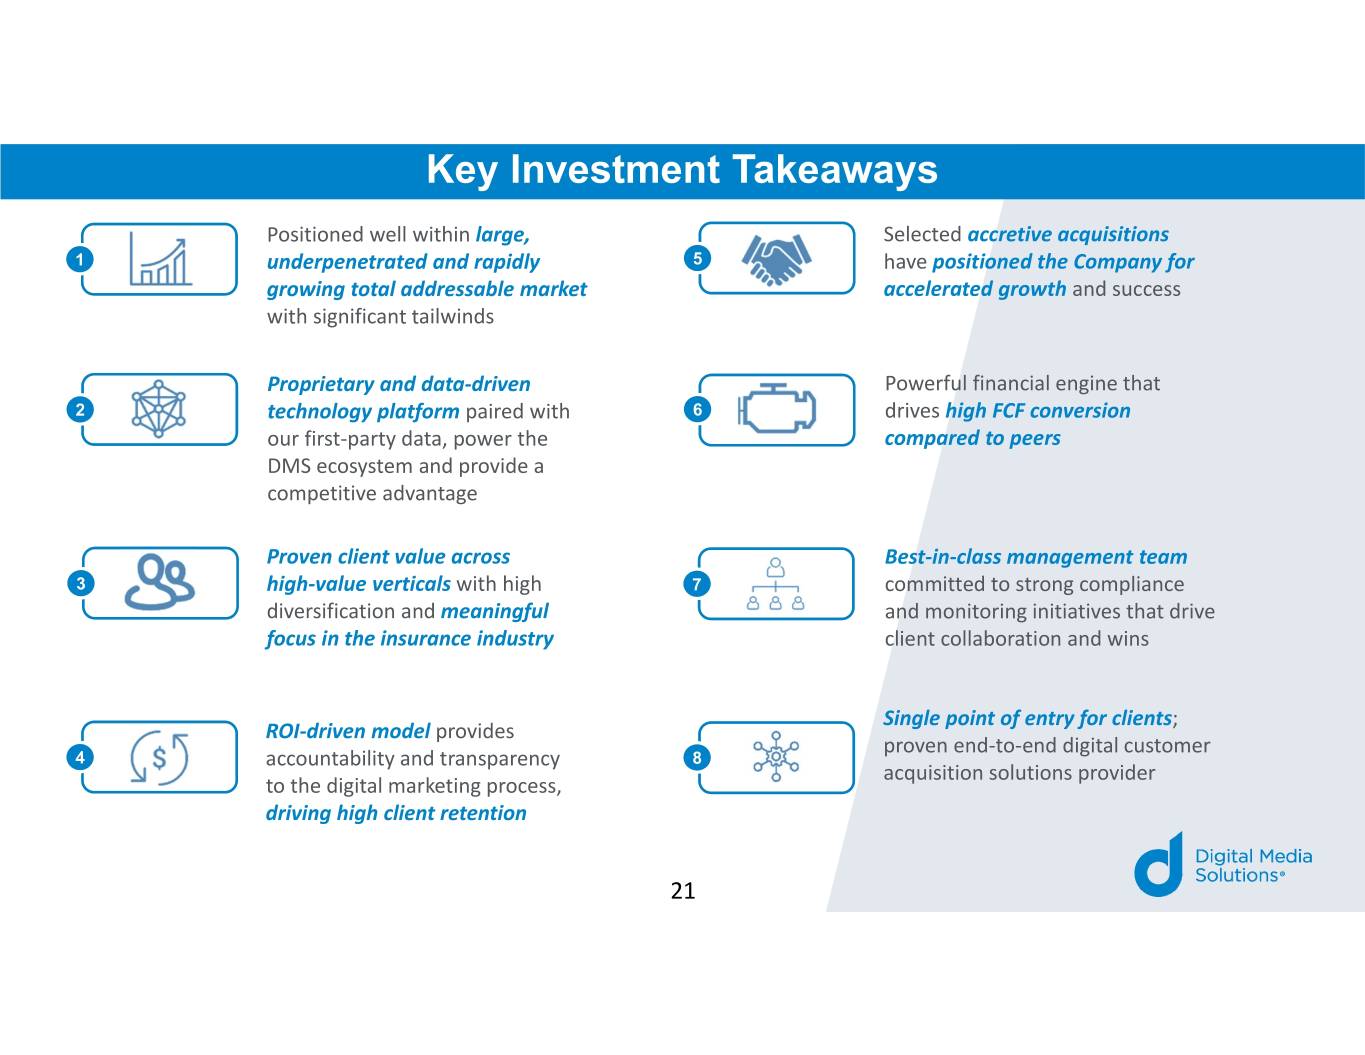
Key Investment Takeaways Positioned well within large, Selected accretive acquisitions 1 underpenetrated and rapidly 5 have positioned the Company for growing total addressable market accelerated growth and success with significant tailwinds Proprietary and data‐driven Powerful financial engine that 2 technology platform paired with 6 drives high FCF conversion our first‐party data, power the compared to peers DMS ecosystem and provide a competitive advantage Proven client value across Best‐in‐class management team 3 high‐value verticals with high 7 committed to strong compliance diversification and meaningful and monitoring initiatives that drive focus in the insurance industry client collaboration and wins Single point of entry for clients; ROI‐driven model provides proven end‐to‐end digital customer 4 accountability and transparency 8 acquisition solutions provider to the digital marketing process, driving high client retention 21
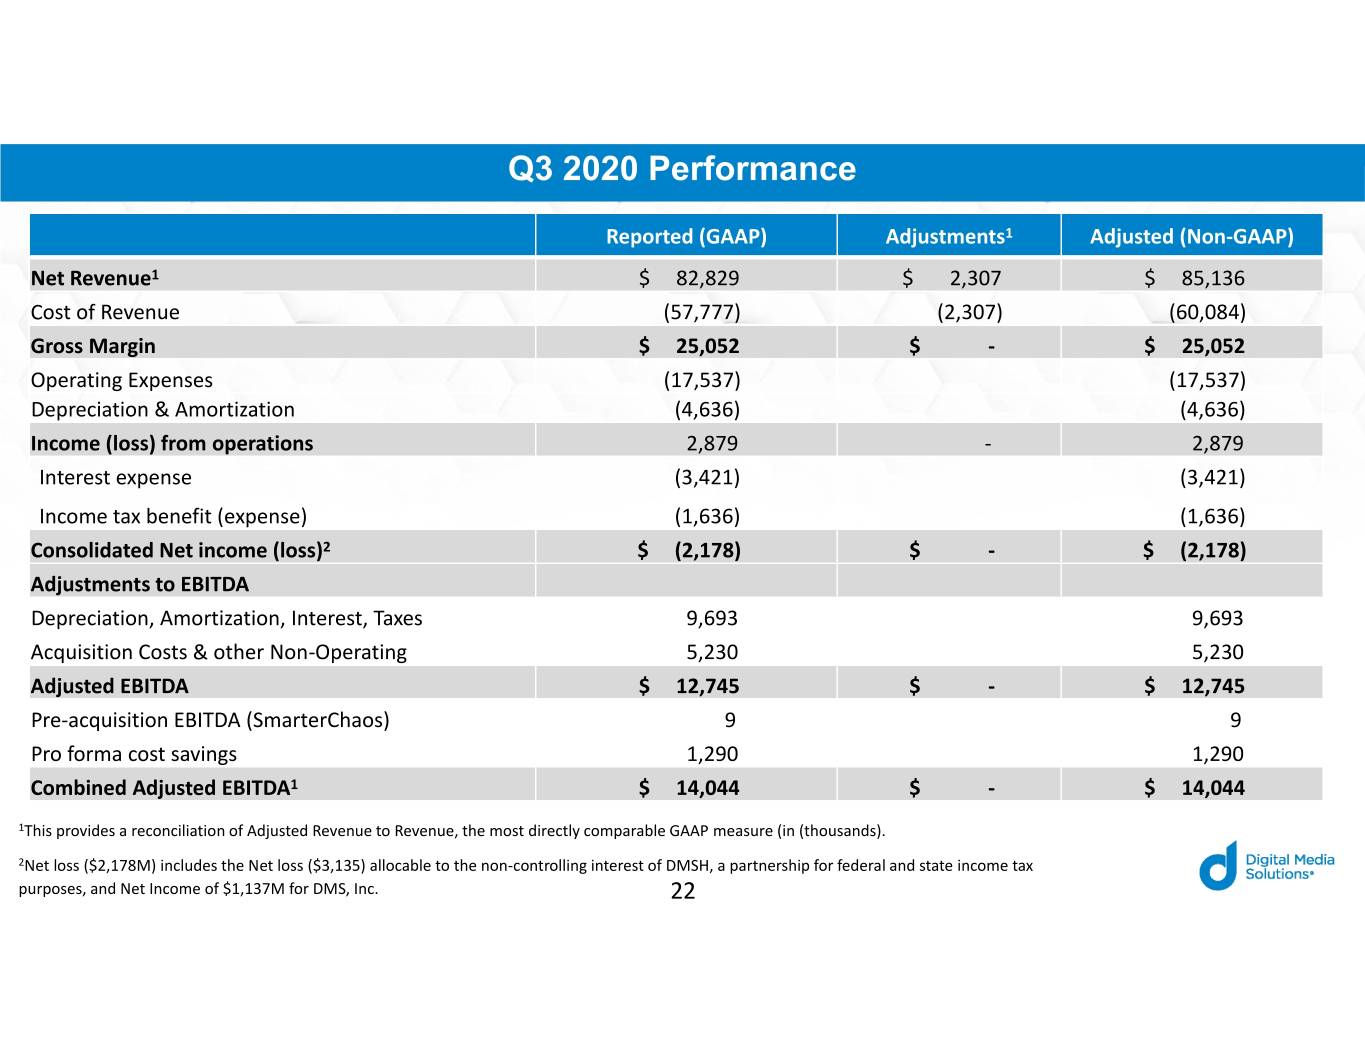
Q3 2020 Performance Reported (GAAP) Adjustments1 Adjusted (Non‐GAAP) Net Revenue1 $ 82,829 $ 2,307 $ 85,136 Cost of Revenue (57,777) (2,307) (60,084) Gross Margin $ 25,052 $ ‐ $ 25,052 Operating Expenses (17,537) (17,537) Depreciation & Amortization (4,636) (4,636) Income (loss) from operations 2,879 ‐2,879 Interest expense (3,421) (3,421) Income tax benefit (expense) (1,636) (1,636) Consolidated Net income (loss)2 $ (2,178) $ ‐ $ (2,178) Adjustments to EBITDA Depreciation, Amortization, Interest, Taxes 9,693 9,693 Acquisition Costs & other Non‐Operating 5,230 5,230 Adjusted EBITDA $ 12,745 $ ‐ $ 12,745 Pre‐acquisition EBITDA (SmarterChaos) 9 9 Pro forma cost savings 1,290 1,290 Combined Adjusted EBITDA1 $ 14,044 $ ‐ $ 14,044 1This provides a reconciliation of Adjusted Revenue to Revenue, the most directly comparable GAAP measure (in (thousands). 2Net loss ($2,178M) includes the Net loss ($3,135) allocable to the non‐controlling interest of DMSH, a partnership for federal and state income tax purposes, and Net Income of $1,137M for DMS, Inc. 22
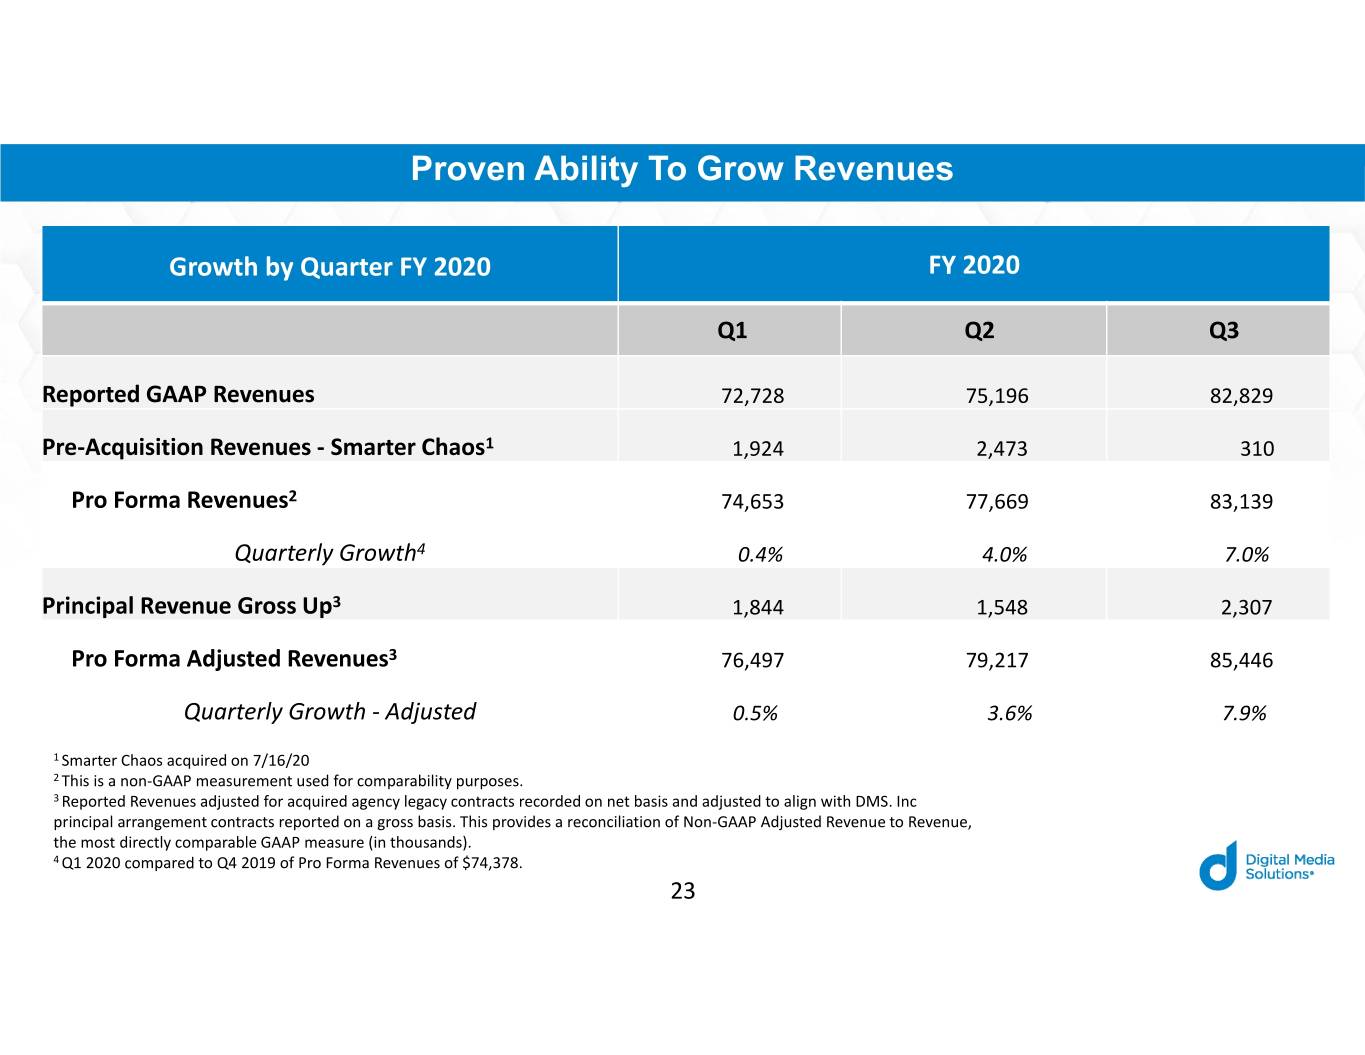
Proven Ability To Grow Revenues Growth by Quarter FY 2020 FY 2020 Q1 Q2 Q3 Reported GAAP Revenues 72,728 75,196 82,829 Pre‐Acquisition Revenues ‐ Smarter Chaos1 1,924 2,473 310 Pro Forma Revenues2 74,653 77,669 83,139 Quarterly Growth4 0.4% 4.0% 7.0% Principal Revenue Gross Up3 1,844 1,548 2,307 Pro Forma Adjusted Revenues3 76,497 79,217 85,446 Quarterly Growth ‐ Adjusted 0.5% 3.6% 7.9% 1 Smarter Chaos acquired on 7/16/20 2 This is a non‐GAAP measurement used for comparability purposes. 3 Reported Revenues adjusted for acquired agency legacy contracts recorded on net basis and adjusted to align with DMS. Inc principal arrangement contracts reported on a gross basis. This provides a reconciliation of Non‐GAAP Adjusted Revenue to Revenue, the most directly comparable GAAP measure (in thousands). 4 Q1 2020 compared to Q4 2019 of Pro Forma Revenues of $74,378. 23
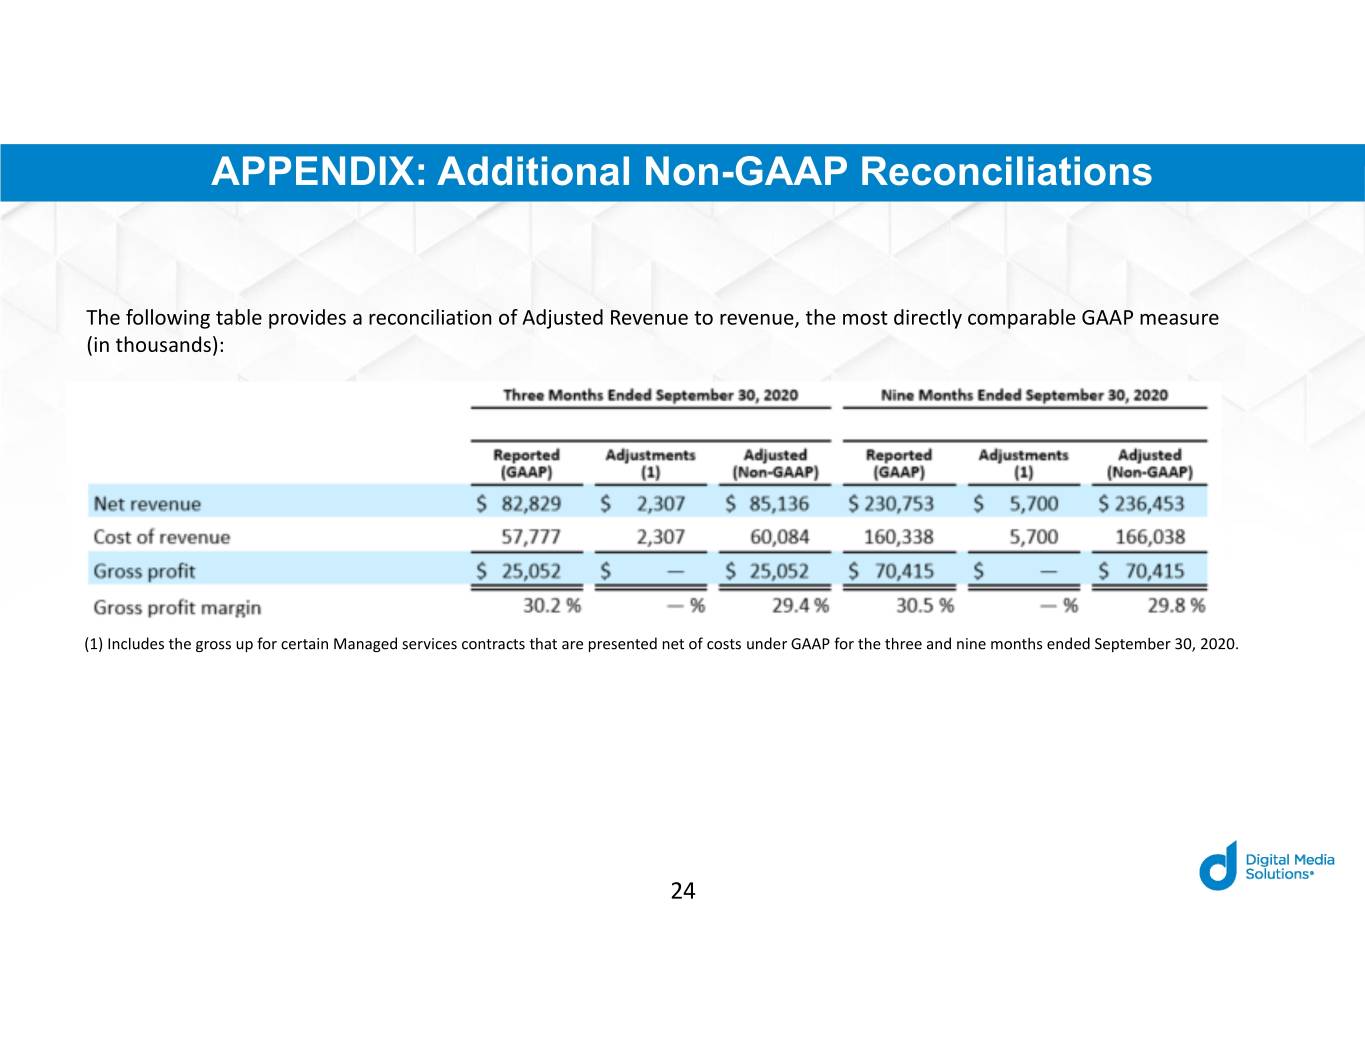
APPENDIX: Additional Non-GAAP Reconciliations The following table provides a reconciliation of Adjusted Revenue to revenue, the most directly comparable GAAP measure (in thousands): (1) Includes the gross up for certain Managed services contracts that are presented net of costs under GAAP for the three and nine months ended September 30, 2020. 24
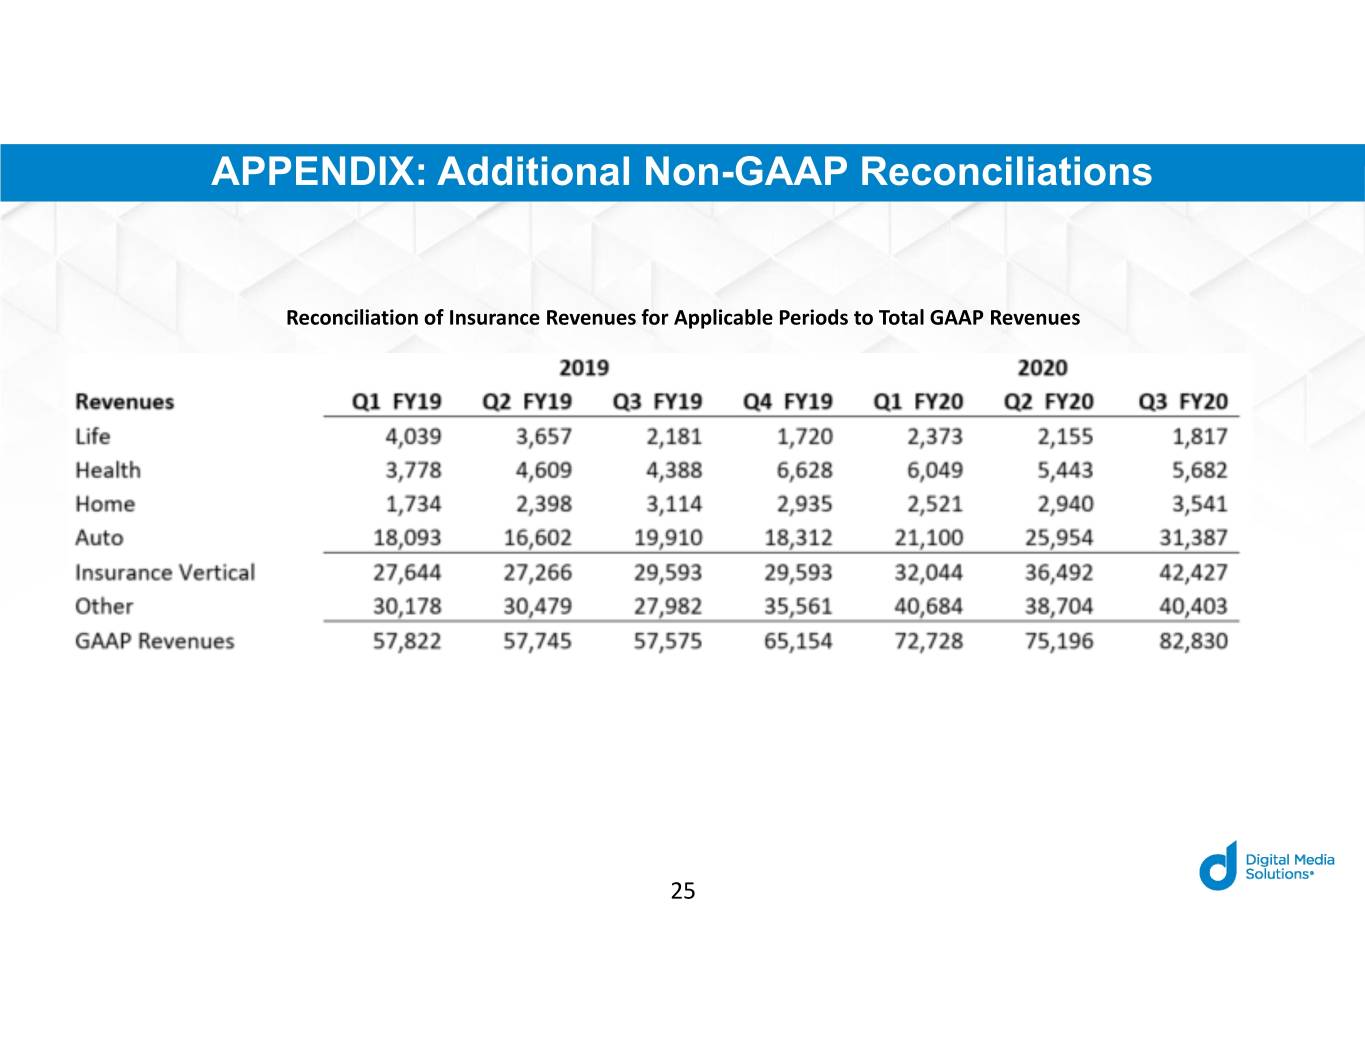
APPENDIX: Additional Non-GAAP Reconciliations Reconciliation of Insurance Revenues for Applicable Periods to Total GAAP Revenues 25
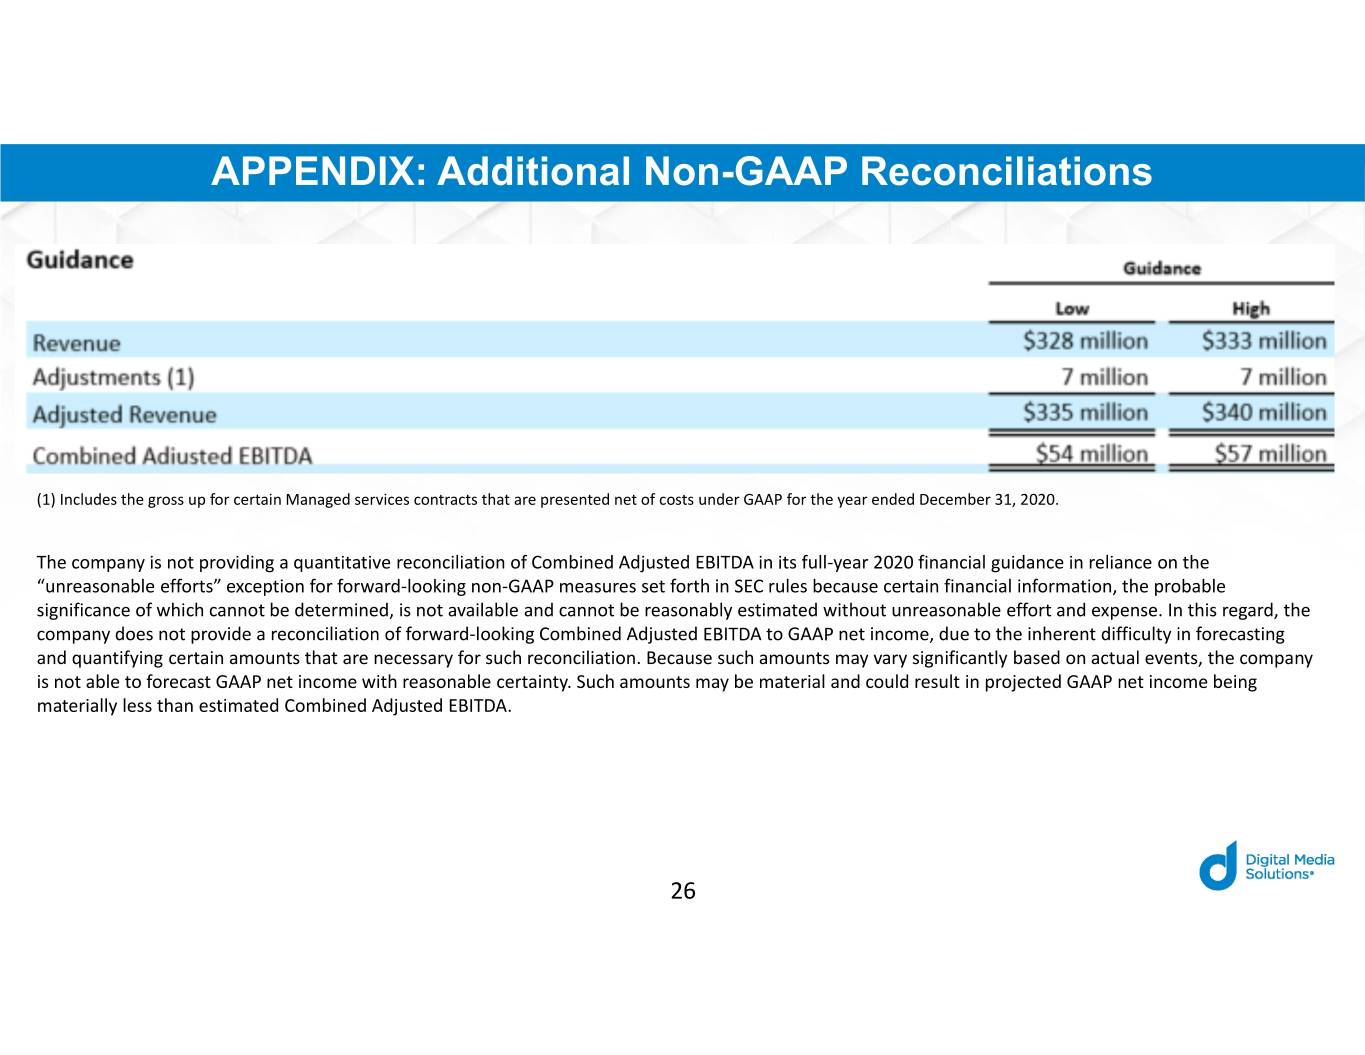
APPENDIX: Additional Non-GAAP Reconciliations (1) Includes the gross up for certain Managed services contracts that are presented net of costs under GAAP for the year ended December 31, 2020. The company is not providing a quantitative reconciliation of Combined Adjusted EBITDA in its full‐year 2020 financial guidance in reliance on the “unreasonable efforts” exception for forward‐looking non‐GAAP measures set forth in SEC rules because certain financial information, the probable significance of which cannot be determined, is not available and cannot be reasonably estimated without unreasonable effort and expense. In this regard, the company does not provide a reconciliation of forward‐looking Combined Adjusted EBITDA to GAAP net income, due to the inherent difficulty in forecasting and quantifying certain amounts that are necessary for such reconciliation. Because such amounts may vary significantly based on actual events, the company is not able to forecast GAAP net income with reasonable certainty. Such amounts may be material and could result in projected GAAP net income being materially less than estimated Combined Adjusted EBITDA. 26
