Attached files
| file | filename |
|---|---|
| EX-99.1 - EX-99.1 - OCEANFIRST FINANCIAL CORP | ex991-earningsreleases.htm |
| 8-K - 8-K - OCEANFIRST FINANCIAL CORP | ocfc-20201029.htm |

. . . OceanFirst Financial Corp. Supplement to Q3 2020 Financial Results October 29, 2020 . . .

SUPPLEMENT TO Q3 2020 EARNINGS .PRESS . . RELEASE Forward Looking Statements In addition to historical information, this presentation contains certain forward-looking statements within the meaning of the Private Securities Litigation Reform Act of 1995 which are based on certain assumptions and describe future plans, strategies and expectations of the Company. These forward-looking statements are generally identified by use of the words “believe,” “expect,” “intend,” “anticipate,” “estimate,” “project,” “will,” “should,” “may,” “view,” “opportunity,” “potential,” or similar expressions or expressions of confidence. The Company’s ability to predict results or the actual effect of future plans or strategies is inherently uncertain. Factors which could have a material adverse effect on the operations of the Company and its subsidiaries include, but are not limited to the following: changes in interest rates, general economic conditions, public health crises (such as the governmental, social and economic effects of the novel coronavirus), levels of unemployment in the Bank’s lending area, real estate market values in the Bank’s lending area, future natural disasters and increases to flood insurance premiums, the level of prepayments on loans and mortgage-backed securities, legislative/regulatory changes, monetary and fiscal policies of the U.S. Government including policies of the U.S. Treasury and the Board of Governors of the Federal Reserve System, the quality or composition of the loan or investment portfolios, demand for loan products, deposit flows, competition, demand for financial services in the Company’s market area, accounting principles and guidelines, the Bank’s ability to successfully integrate acquired operations and the other risks described in the Company’s filings with the Securities and Exchange Commission. These risks and uncertainties should be considered in evaluating forward-looking statements and undue reliance should not be placed on such statements. The Company does not undertake, and specifically disclaims any obligation, to publicly release the result of any revisions which may be made to any forward-looking statements to reflect events or circumstances after the date of such statements or to reflect the occurrence of anticipated or unanticipated events. Annualized, pro forma, projected and estimated numbers are used for illustrative purpose only, are not forecasts and may not reflect actual results. This presentation is not an offer to sell securities, nor is it a solicitation of an offer to buy securities in any locality, state, country or other jurisdiction where such distribution, publication, availability or use would be contrary to law or regulation or which would require any registration or licensing within such jurisdiction. Neither the Securities and Exchange Commission nor any other regulatory body has approved or disapproved of the securities of the Company or passed upon the accuracy or adequacy of the presentation. Any representation to the contrary is a criminal offense. Except as otherwise indicated, this . . . presentation speaks as of the date hereof. The delivery of this presentation shall not, under any circumstances, create any OCTOBER | 2020 implication that there has been no change in the affairs of the Company after the date hereof. 2

SUPPLEMENT TO Q3 2020 EARNINGS PRESS RELEASE . . . Credit Metrics – At A Glance Current Forbearances (October 23, 2020) Commercial (Full 1) $88M 1.1% of portfolio Consumer $122M 1.5% of portfolio Total $210M 2.6% of portfolio The forbearance portfolios are expected to be negligible as of December 31, 2020. Going forward, credit metrics will be traditional (Delinquent, TDR, Non-Accrual, etc.) Highest Risk Loans Liquidated: NY $30M, settled October 15, 2020: 85% recovery NJ/PA $51M, projected mid to late November: 82% recovery Non-Accruals (loans held for investment): Delinquencies: $14M, 0.17% of portfolio $30M, 0.37% of portfolio 2 Reserves for Loan Credit Losses ACL $56.4M 188% of non-accrual loans held for investment Loan Credit Mark $31.6M Total $88.0M . . . 110 basis points of loans held for investment 1Full forbearance excludes $118M making Interest Only (I/O) payments. We expect $65M of commercial clients to be on I/O status past December 31, 2020, and $35M, or 54%, of OCTOBER | 2020 these loans have already posted 6 months of payments in advance 3 2Excludes non-accrual loans held-for-sale of $67.5M

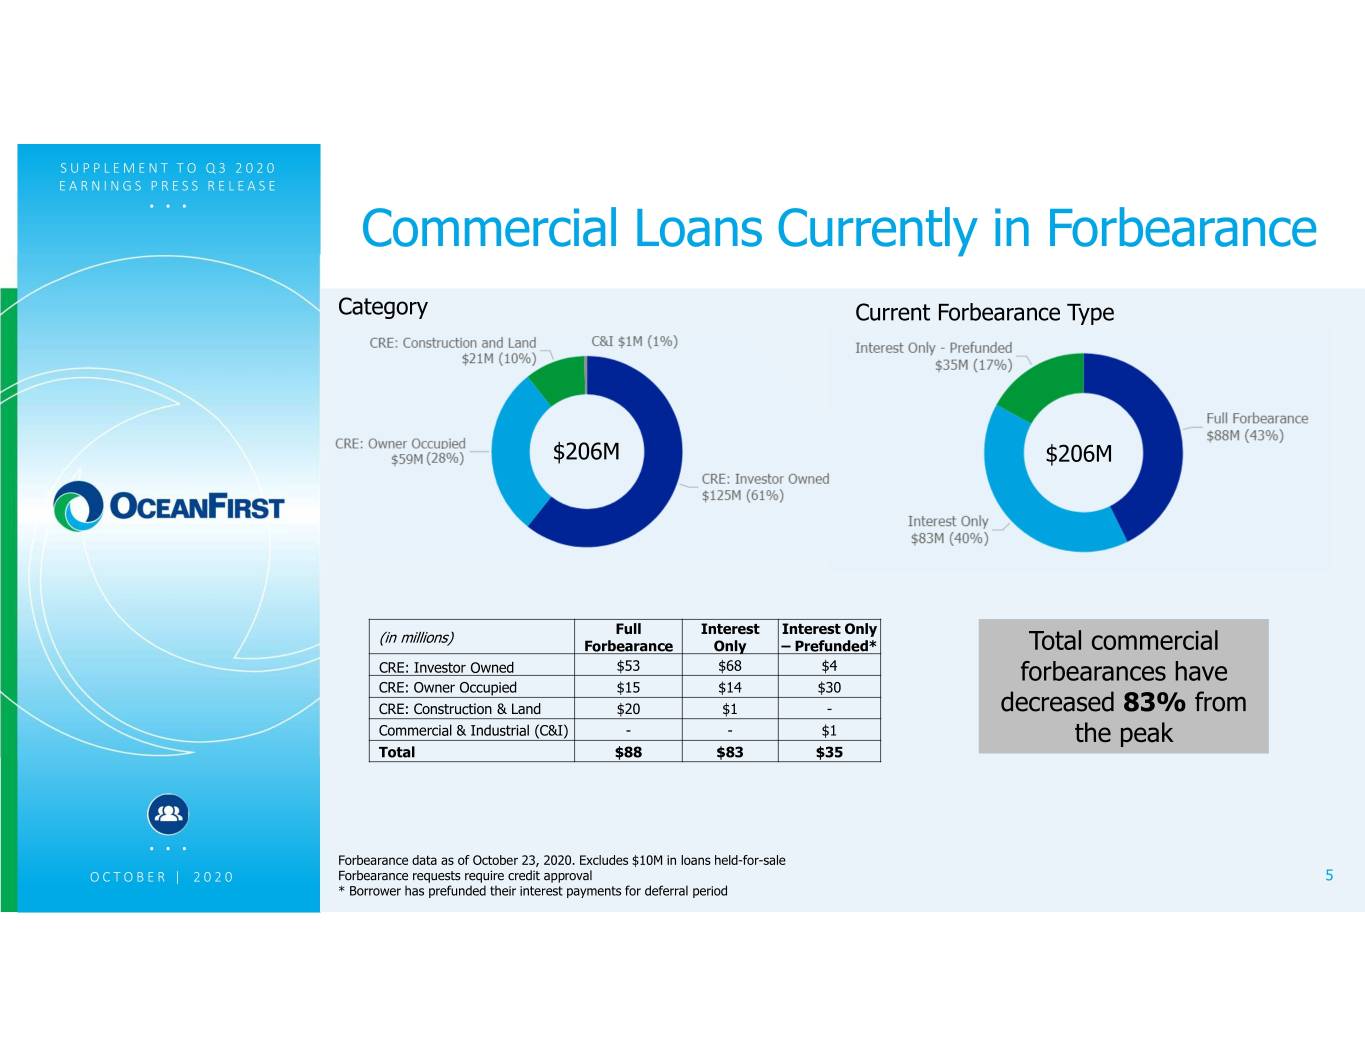
SUPPLEMENT TO Q3 2020 EARNINGS .PRESS . . RELEASE Commercial Forbearance Portfolio $894M in forbearances cured from peak of $1.1B Commercial forbearances at October 23, 2020 total $206M of which only $88M is full payment forbearance Commercial full payment forbearance projected to reduce to $20M by November 30, 2020 By December 31, 2020 full payment forbearance projected to be negligible The second 90-day forbearance period began in late June . . . OCTOBER | 2020 Data based on the date of execution of a forbearance agreement 4 Forbearance data as of October 23, 2020

SUPPLEMENT TO Q3 2020 EARNINGS .PRESS . . RELEASE Commercial Loans Currently in Forbearance Category Current Forbearance Type $206M $206M Full Interest Interest Only (in millions) Forbearance Only – Prefunded* Total commercial CRE: Investor Owned $53 $68 $4 forbearances have CRE: Owner Occupied $15 $14 $30 CRE: Construction & Land $20 $1 - decreased 83% from Commercial & Industrial (C&I) - - $1 the peak Total $88 $83 $35 . . . Forbearance data as of October 23, 2020. Excludes $10M in loans held-for-sale OCTOBER | 2020 Forbearance requests require credit approval 5 * Borrower has prefunded their interest payments for deferral period

SUPPLEMENT TO Q3 2020 EARNINGS .PRESS . . RELEASE Commercial Loans Currently in Full Forbearance $88M $88M $88M $88M . . . 6 OCTOBER | 2020 Forbearance data as of October 23, 2020

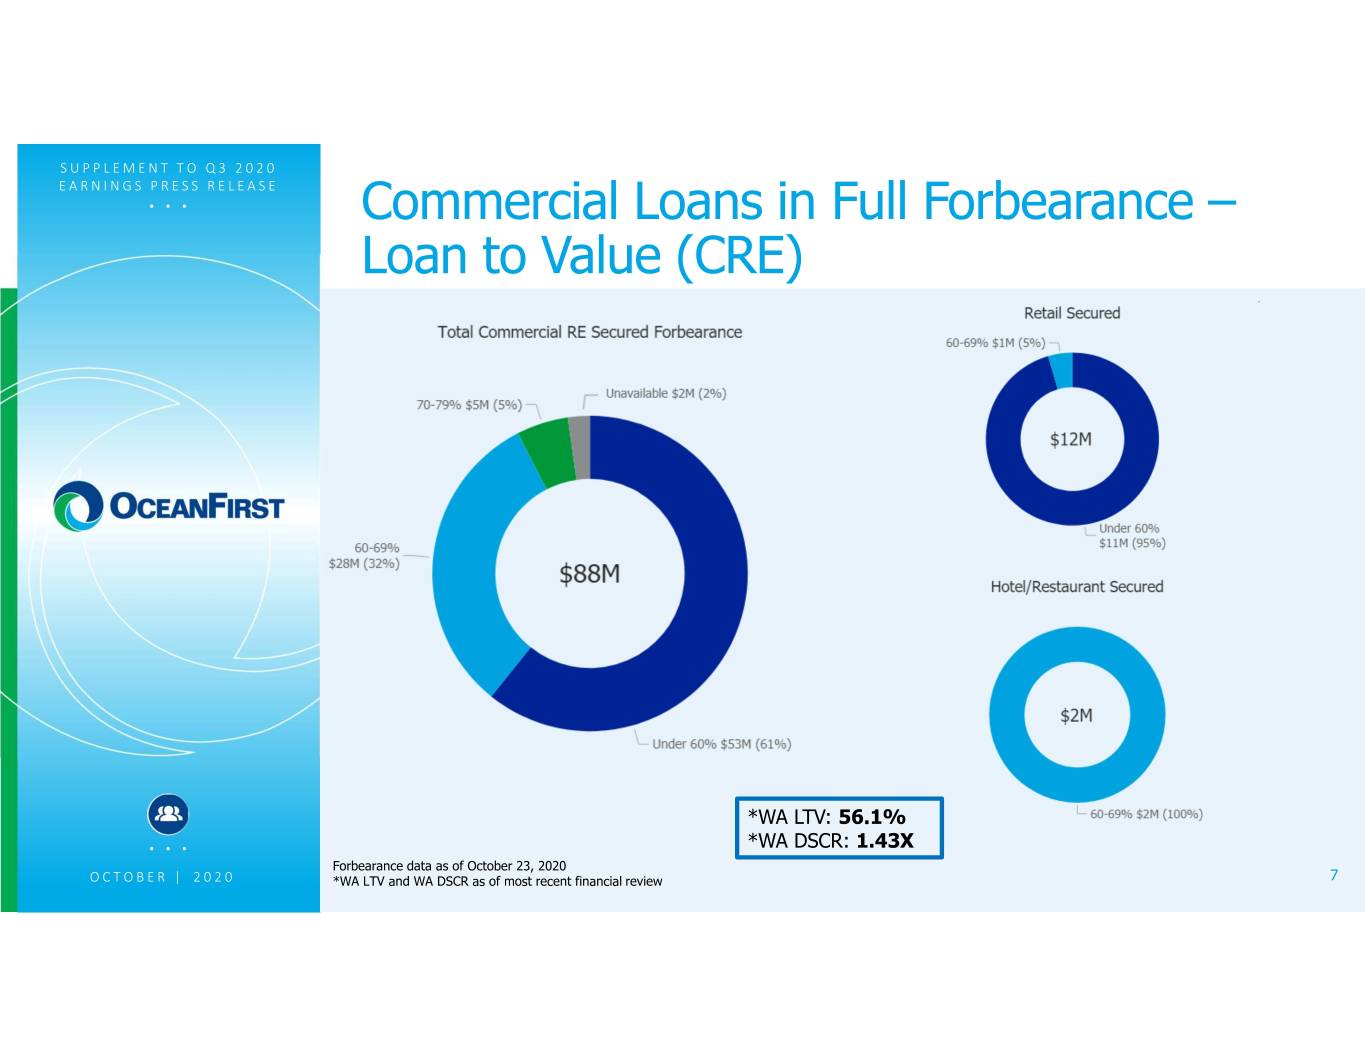
SUPPLEMENT TO Q3 2020 EARNINGS .PRESS . . RELEASE Commercial Loans in Full Forbearance – Loan to Value (CRE) *WA LTV: 56.1% . . . *WA DSCR: 1.43X Forbearance data as of October 23, 2020 OCTOBER | 2020 *WA LTV and WA DSCR as of most recent financial review 7

SUPPLEMENT TO Q3 2020 EARNINGS .PRESS . . RELEASE Commercial Loans Currently in Interest Only Forbearance $118M $118M $118M $118M . . . OCTOBER | 2020 Forbearance data as of October 23, 2020 8

SUPPLEMENT TO Q3 2020 EARNINGS .PRESS . . RELEASE Commercial Loan Interest Only Forbearance – Loan to Value (CRE) *WA LTV: 48.3% *WA DSCR: 1.80X . . . Forbearance Data as of October 23, 2020 OCTOBER | 2020 *WA LTV and WA DSCR as of most recent financial review 9

SUPPLEMENT TO Q3 2020 EARNINGS .PRESS . . RELEASE Consumer Forbearance Portfolio 1st Forbearance Peak $329M 2nd Forbearance Peak $187M Consumer forbearances (1st and 2 nd ) at October 26, 2020 total $122M, down 63% from peak of $329M . . . The second 90-day forbearance period began in early June OCTOBER | 2020 Data based on the date of execution of a forbearance agreement 10 Forbearance data as of October 26, 2020

SUPPLEMENT TO Q3 2020 EARNINGS .PRESS . . RELEASE Consumer Loan Forbearance Profile Consumer forbearances peaked at $329M on June 13, 2020 Consumer Portfolio 90 Day Forbearance 180 Day Forbearance Portfolio Portfolio Total Outstanding Balance: $2.9B Total Outstanding Balance: $9M Total Outstanding Balance: WA LTV: 65% WA LTV: 61% $113M WA FICO Score: 767 WA FICO Score: 724 WA LTV: 68% WA FICO Score: 741 In forbearance $122M (4%) $2.9B Not in forbearance $2.9bn (96%) Consumer loan forbearance portfolio has decreased 63% from peak in June 2020 and represents 4% of the total consumer loans . . . 32 borrowers totaling $13.4M have requested additional forbearance relief OCTOBER | 2020 Forbearance and loan data as of October 26, 2020 11 Excludes loans with no FICO score; FICO scores as of August 31, 2020

SUPPLEMENT TO Q3 2020 EARNINGS .PRESS . . RELEASE Consumer Loan Forbearance Credit Metrics Each forbearance period is 90 days, or a total of up to 180 days 90 90 Day Initial Initial Forbearance 180 180 Day . . . OCTOBER | 2020 Continuing Forbearance 12 Forbearance data as of October 26, 2020

SUPPLEMENT TO Q3 2020 EARNINGS .PRESS . . RELEASE Consumer Loan Forbearance Credit Metrics Total Portfolio Forbearance Portfolio LTV <= 80% LTV > 80% LTV <= 80% LTV > 80% $2.7B (92%) $217M (8%) $109M (89%) $13M (11%) Only $3 million of loans exhibit an LTV > 80% and a current FICO < 650; FICO < 650 FICO >= 650 FICO < 650 FICO >= 650 a decrease from $6.4 $608M (21%) $2.3B (79%) $29M (24%) $93M (76%) million reported at August 31, 2020 . . . OCTOBER | 2020 Forbearance data as of October 26, 2020 13 Excludes loans with no FICO score; FICO scores as of August 31, 2020

SUPPLEMENT TO Q3 2020 EARNINGS .PRESS . . RELEASE Consumer Loan Forbearance by County $2.1B Sharply increasing real estate values should protect against credit losses Annual County Median Price Increase * Monmouth 14% Ocean 12% Atlantic 10% Cape May 20% . . . OCTOBER | 2020 Forbearance data as of October 26, 2020 14 *2019-2020 Single family home valuation change source is from NJ Realtors median scale price September 2019 to September 2020

SUPPLEMENT TO Q3 2020 EARNINGS PRESS RELEASE . . . SBA Paycheck Protection Program Update Total PPP Portfolio: $480.6 million Held for Sale: $298.1 million Retained PPP Portfolio: $182.5 million Submitted In Underwriting to SBA 8% (Pending Decision) 45% Applications to be Reviewed Retained by Bank 21% 38% Forgiveness Application Submitted to SBA (Decision Received) Classified as Held for Sale Not Received 2% 62% 24% Decision made to sell 62% of the outstanding loans. Transaction accelerates approximately $8.7M of fee income, incurs a cost of selling the loans at a $3.4M discount, netting an approximate $5.3M gain in 4 th quarter . . . OCTOBER | 2020 15 PPP outstanding balances as of September 30, 2020; retained application statuses as of October 23, 2020

SUPPLEMENT TO Q3 2020 EARNINGS PRESS RELEASE . . . Loan Portfolio Activity 418 57 8,400 371 8,390 ($'millions) June 30, 2020 Loan Originations Loan Sales Payoffs / Paydowns September 30, 2020 . . . OCTOBER | 2020 16 Loan balances include loans held for sale.

SUPPLEMENT TO Q3 2020 EARNINGS PRESS RELEASE . . . Q3-20 NIM Contraction 3.24% 0.13% 0.06% 0.06% 0.02% 2.97% (%) Q2-20 NIM Excess balance sheet Lower rate Purchase accounting Prepayment fee Q3-20 NIM liquidity environment impact impact Headwinds Tailwinds • The sale of PPP loans will increase short-term • Further opportunity to lower deposit costs liquidity and temporarily pressure earning asset yields • Strong loan-to-deposit position • Competitive market environment as peers with • Plan to steadily invest excess liquidity – $149 similarly levels of liquidity compete on rate for million of investment purchases in Q3, $350 million . . . quality credit expected in Q4 • Purchase accounting accretion will decline by 5 bps • Deploy excess liquidity into new loans over the OCTOBER | 2020 in Q4, and 1 bps to 2 bps each quarter in 2021 next few quarters 17
