Attached files
| file | filename |
|---|---|
| 8-K/A - 8-K/A - Fastly, Inc. | fsly-20201028.htm |
| EX-99.2 - EX-99.2 - Fastly, Inc. | exhibit992pressrelease.htm |
Exhibit 99.1

Exhibit 99.1
Strong Business Fundamentals Drive
Continued Demand for Fastly’s Platform
Q3 2020 Key Highlights
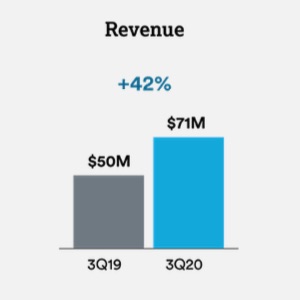
•Continued top-line growth with revenue of $71 million, up 42% year-over-year
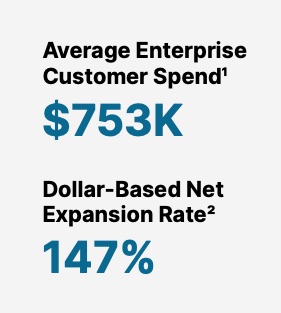
•Dollar-Based Net Expansion Rate (DBNER) of 147%, up from 137% in Q2 20201
•Net Retention Rate (NRR) of 122%, compared to 138% in Q2 20202
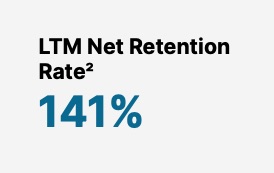
◦Last-twelve-month (LTM) NRR of 141%, up from 136% in Q2 20203
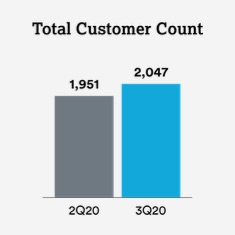
•Total customer count increased to 2,047 up from 1,951 in Q2 2020
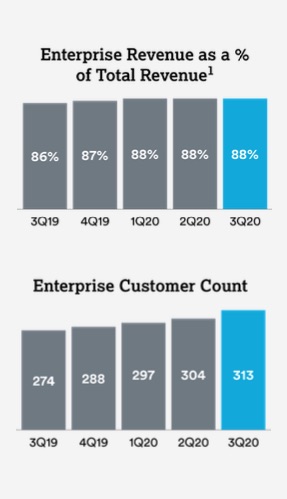
◦Total enterprise customer count of 313, up from 304 in Q2 2020
•Average enterprise customer spend of approximately $753,000, up from $716,000 in Q2 20204
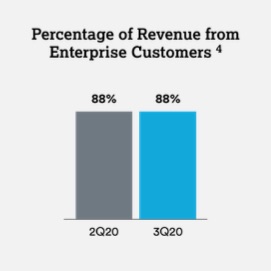
•Enterprise customers generated 88% of our trailing twelve-month total revenue, consistent with Q2 2020
•GAAP gross margin of 58.5%, up from 55.2% in Q3 2019; non-GAAP gross margin, which excludes stock-based compensation, of 59.8% up from 56.1% in Q3 20195
•GAAP operating loss of $23 million, compared to GAAP operating loss of $13 million for Q3 2019; non-GAAP operating loss of $4 million, which excludes acquisition-related costs, compared to non-GAAP operating loss of $9 million in Q3 20195
•GAAP basic and diluted net loss per share of $0.22, compared to GAAP basic and diluted net loss per share of $0.13 in Q3 2019; non-GAAP basic and diluted net loss per share of $0.04, compared to non-GAAP basic and diluted net loss per share of $0.09 in Q3 20195
•Adjusted EBITDA of $0.8 million, compared to ($5) million for Q3 20195
•Capital expenditures of $14 million, or 20% of revenue6
_________
1 We calculate Dollar-Based Net Expansion Rate by dividing the revenue for a given period from customers who remained customers as of the last day of the given period (the “current” period) by the revenue from the same customers for the same period measured one year prior (the “base” period). The revenue included in the current period excludes revenue from (i) customers that churned after the end of the base period and (ii) new customers that entered into a customer agreement after the end of the base period.
2Net Retention Rate measures the net change in monthly revenue from existing customers in the last month of the period (the “current" period month) compared to the last month of the same period one year prior (the “prior" period month). The revenue included in the current period month includes revenue from (i) revenue contraction due to billing decreases or customer churn, (ii) revenue expansion due to billing increases, but excludes revenue from new customers. We calculate Net Retention Rate by dividing the revenue from the current period month by the revenue in the prior period month.
3Our LTM Net Retention Rate, intended to be supplemental to our Net Retention Rate, was 141% for the period ended September 30, 2020. We calculate LTM Net Retention Rate by dividing the total customer revenue for the prior twelve-month period (“prior 12-month period”) ending at the beginning of the last twelve-month period (“LTM period”) minus revenue contraction due to billing decreases or customer churn, plus revenue expansion due to billing increases during the LTM period from the same customers by the total prior 12-month period revenue. We believe the LTM Net Retention Rate is supplemental as it removes some of the volatility that is inherent in a usage-based business model.
4Calculated based on trailing twelve-months.
5For the definition and a reconciliation of non-GAAP financial measures to their corresponding GAAP measures, please refer to the reconciliation table at the end of this letter.
6Capital Expenditures are defined as cash used for purchases of property and equipment and capitalized internal-use software, as reflected in our statement of cash flows.
Exhibit 99.1
To Our Shareholders
As we shared two weeks ago, our third-quarter results were impacted by customer-specific factors that we had not foreseen when we reported our second-quarter results. However, despite these challenges, which are detailed below, we generated 42% year-over-year top-line growth in the third quarter, proving that our underlying business remains strong. Supporting this growth was demand from customers, with the second-highest quarter of new customers additions in our history as a public company. We are also continuing to expand our customer relationships, as demonstrated by our strong Dollar-Based Net Expansion Rate of 147%1 and Net Retention Rate on a last-twelve-month basis of 141%2, up from 137% and 136% last quarter, respectively. In the third quarter, we saw our highest quarterly new booking attainment this year, which reaffirms our confidence in our future growth and ability to serve our customers. Beyond this strong demand, we continued to expand our offerings this quarter. We closed our acquisition of Signal Sciences to further bolster our world-class security offering at a time when security at the edge has never been more critical. And today, as promised, we launched Compute@Edge to production, both of which are addressed in more detail below.
Certain macro trends over the past two quarters have created extraordinary — and we think, lasting — demand for our platform. Our usage-based business model is sensitive to the variation in our customers’ businesses, which drives us to be customer-centric and focused on constantly delivering value to help drive increased usage on the platform. At the same time, in Q3, we did not meet our original third-quarter forecast due to two distinct challenges that impacted our revenue from a few key customers:
•Regulatory Uncertainty: Our previously disclosed largest customer, which accounts for 10.8% of our revenue for the nine months ended on September 30, 2020, removed a majority of their U.S. and non-U.S. traffic from our platform by the end of the quarter. Based on publicly available information, we believe this global traffic reduction was in response to the potential of a prohibition of U.S. companies being able to work with this customer. This clearly impacted Q3, and based on the continued turbulence of the situation, we anticipate the traffic reduction to continue into Q4, as reflected in our guidance. Customer-centricity is one of our core values, so we intend to fully support this customer unless and until we are prohibited from doing so. We are prepared to accept additional traffic from this customer if conditions enable it to return. However, if it becomes clear that we should no longer support this customer, we believe the reserved capacity for this customer can be reallocated over the medium- and long-term with a traffic mix that is consistent with our gross margin objectives.
•Existing customer timing: In the latter part of Q3, our forecast for the timing of new traffic coming onto our network from a few existing customers did not meet our expectations. A majority of these timing issues have been resolved and we have now seen this traffic come onto the network. There have been instances, however, where isolated timing issues have persisted due to factors, including our evolving understanding of both Covid-19-related travel and datacenter restrictions in South Asia that delayed buildouts beyond our expectations and the timing of customer code freezes. We anticipate this traffic to come onto the network and not have a negative impact beyond Q4.
Aside from these few customers, the business performed as we had forecasted. In addition to these two factors, our Q4 guidance now includes the revenue contribution from Signal Sciences. Looking ahead, we remain confident in Fastly’s future — both in the short and long term — while also accounting for the unique uncertainties we face in supporting our largest customer. The quality of our services and products, as well as our team’s ability to execute, will continue to propel us on our path to profitability.
__________
1 We calculate Dollar-Based Net Expansion Rate by dividing the revenue for a given period from customers who remained customers as of the last day of the given period (the “current” period) by the revenue from the same customers for the same period measured one year prior (the “base” period). The revenue included in the current period excludes revenue from (i) customers that churned after the end of the base period and (ii) new customers that entered into a customer agreement after the end of the base period.
2Our LTM Net Retention Rate, intended to be supplemental to our Net Retention Rate, was 141% for the period ended September 30, 2020. We calculate LTM Net Retention Rate by dividing the total customer revenue for the prior twelve-month period (“prior 12-month period”) ending at the beginning of the last twelve-month period (“LTM period”) minus revenue contraction due to billing decreases or customer churn, plus revenue expansion due to billing increases during the LTM period from the same customers by the total prior 12-month period revenue. We believe the LTM Net Retention Rate is supplemental as it removes some of the volatility that is inherent in a usage-based business model.
Exhibit 99.1
Vision Becoming Reality
We are very excited to be delivering two essential elements of our long-term vision.
Compute@Edge is now in the market running production traffic and opening up new use cases and market segments for us. Our acquisition of Signal Sciences is complete and integration of their powerful security products into our platform is underway. With these two key pillars in place flanking our successful delivery business, we are able to supply enterprise builders of all kinds, from developers up through CIOs and CISOs, with the speed and confidence they need to continue expanding and differentiating.
As enterprises complete the shift to the cost-saving measures provided by the central cloud, their next frontier is to move logic, compute power, and security to the edge in order to more effectively meet their customers in the digital-first way that consumers have come to expect and rely on. We believe we are exceptionally well-positioned in the current enterprise technology environment, delivering multiple powerful solutions, tuned for the evolving DevOps workflow at the edge, opening up much broader enterprise customer opportunities.
Signal Sciences Integration/ Secure@Edge
•We are well underway on integrating the application security capabilities from Signal Sciences into a unified new product offering called Secure@Edge. This will allow us to fulfill our mission of giving developers more power over the security of their applications and APIs, at the edge of the network.
•We are very optimistic about the immediate opportunities for cross-sell and upsell to both of our customer bases. There is great enthusiasm for the Signal Sciences solutions set from our customers, with an immediate interest in bot protection use cases. We are also seeing great interest from Signal Science customers to use the Fastly platform to ease and speed deployment of security solutions.
•We are thrilled that on the heels of our acquisition, Gartner recognized Signal Sciences as a Visionary for the second consecutive year in its Magic Quadrant for Web Application Firewalls.
Compute@Edge Update
•Today we announced that Compute@Edge has moved out of beta into limited availability, with customers now running production traffic on the environment. With Compute@Edge, they are creating new and innovative applications ranging from waiting room tokens, dynamic personalization, authentication at the edge, full serverless applications, and more.
•Feedback from customers, including Vox Media, HashiCorp, and loveholidays, is that Fastly’s deep investments in Compute@Edge are delivering on the promise of serverless with rock-solid performance and features, allowing developers to create with enhanced speed, agility, and security.
•We also announced important enhancements to the solution including support for Terraform APIs, Command Line Interface support, extended language support including AssemblyScript (in beta), and new observability features.
Exhibit 99.1
Robust Customer Growth Across Multiple Verticals
We grew our total customer count to 2,047 in Q3 2020, up from 1,951 in the previous quarter, demonstrating the continued demand for Fastly’s platform. Companies are increasingly understanding the importance of the digital transformation, both as a result of the global pandemic, but more importantly, as we all move into a new normal, with new trends that we expect to continue long into the future. This quarter we saw usage expansion and new business wins across multiple verticals including ecommerce, media (live streaming and VOD), and high technology sectors such as Fintech and Edtech.
Key customer highlights include:
•Ecommerce – As brick-and-mortar companies accelerate their investment in ecommerce, one of the largest sportswear and footwear retailers in the U.S. migrated to Fastly during the third-quarter, leveraging our security portfolio to enhance ecommerce security for its customers, as well as our Image Optimization. They're also utilizing the ability to build complex application logic at the edge using VCL and deploy in real-time with no support or PS engagements required. Additionally, a large North American automotive parts retail chain is accelerating their digital transformation by adopting our edge application logic to easily accommodate their existing architecture while adding advanced capabilities, security, and performance enhancement like Image Optimization and Web Application Firewall at the edge to their online experience. Fastly is also helping with initiatives including a cloud migration and gaining more granular control over delivery and security policies.
•Media – We continue to grow in the media and entertainment vertical, both domestically and internationally. We are winning meaningful commitments from large, U.S. media conglomerates, producing higher profit renewals, and continuing to win new business in Europe. Our media delivery continues to differentiate by providing consistent, exceptional performance at large scale.
•High Tech – Our momentum in the high-tech vertical continues, especially in FinTech and EdTech. Our edge-cloud platform continues to demonstrate significant value to a wide array of customers, ranging from securing and accelerating the delivery of one of the world’s largest payment processors to a multinational corporate learning platform.
Additionally, as we announced last September, we joined the Google Cloud Marketplace as its first partner edge cloud-based CDN solution. Under a single billing arrangement and using Google Cloud committed spend, Google Cloud customers can now purchase our edge offerings as part of their modern tech stack. We are excited to build upon our six-year partnership with Google Cloud, as well as open up an important new route to market for our edge cloud solutions.
Heading into the fourth quarter, we are encouraged by continued momentum and broad-based demand with several significant customer wins, including a global leader in telecommunications, media and entertainment; a leading EdTech software and solutions company widely used by higher education, K-12, business, and government clients around the world; and one of the largest American multinational retail companies.
Exhibit 99.1
Delivering Strong Enterprise Customer Growth
In addition to growing our core customer base, we also saw increased engagement and further expansion of our enterprise customer base (defined as spending $100,000 or more in a twelve-month period). We increased our enterprise customer count to 313 from 304 in the previous quarter. This expansion was driven by the further adoption of our platform by both new and existing large customers.
We continued to capture additional business from our customers. This is evidenced by our increased average enterprise customer spend of $753,000, up from $716,0001 in the previous quarter, as well as our increased Dollar-Based Net Expansion Rate (DBNER) to 147%2, which measures the change in revenue from existing customers over a twelve-month period. The increase in spend and DBNER expansion highlights the continued strength of our platform and relationships with our enterprise customers, which represented 88% of our trailing twelve-month total revenue.
We’ve continued to execute upon our land and expand strategy across multiple verticals. Our customers continue to find additional value in our solutions and products. They are discovering additional use cases in traditional and innovative scenarios across all of their digital properties. In the third quarter, we saw meaningful customer expansion from some of the best of the Web, including one of the largest U.S. general merchandise retailers, one of the largest American multinational consumer-to-consumer and business-to-consumer online marketplaces, and one of the most popular international ad-technology providers.
__________
1Calculated based on trailing twelve-months.
2We calculate Dollar-Based Net Expansion Rate by dividing the revenue for a given period from customers who remained customers as of the last day of the given period (the “current” period) by the revenue from the same customers for the same period measured one year prior (the “base” period). The revenue included in the current period excludes revenue from (i) customers that churned after the end of the base period and (ii) new customers that entered into a customer agreement after the end of the base period.
Exhibit 99.1
Delivering Strong Enterprise Customer Growth
Further demonstrating the stickiness of our edge cloud platform and the loyalty of our customers, we delivered a Net Retention Rate1 (NRR) of 122% in Q3 2020, and 141% on a last-twelve-month (LTM) basis2 – we believe the LTM NRR removes some of the volatility that is inherent in a usage-based business model. NRR measures the net change in monthly revenue from existing customers in the last month of the period compared to the last month of the same period one year prior. It includes revenue contraction due to billing decreases or customer churn and revenue expansion due to billing increases, but excludes revenue from net new customers. We measure NRR in addition to DBNER in an effort to provide insight into our customer base in a similar fashion to what is commonly found with traditional SaaS companies. DBNER is a mutually exclusive calculation and differs from NRR in that DBNER only includes existing customers that have been on the platform at least 13 months and excludes churn.
__________
1Net Retention Rate measures the net change in monthly revenue from existing customers in the last month of the period (the “current" period month) compared to the last month of the same period one year prior (the “prior" period month). The revenue included in the current period month includes revenue from (i) revenue contraction due to billing decreases or customer churn, (ii) revenue expansion due to billing increases, but excludes revenue from new customers. We calculate Net Retention Rate by dividing the revenue from the current period month by the revenue in the prior period month.
2Our LTM Net Retention Rate, intended to be supplemental to our Net Retention Rate, was 141% for the period ended September 30, 2020. We calculate LTM Net Retention Rate by dividing the total customer revenue for the prior twelve-month period (“prior 12-month period”) ending at the beginning of the last twelve-month period (“LTM period”) minus revenue contraction due to billing decreases or customer churn, plus revenue expansion due to billing increases during the LTM period from the same customers by the total prior 12-month period revenue. We believe the LTM Net Retention Rate is supplemental as it removes some of the volatility that is inherent in a usage-based business model.
Exhibit 99.1
Innovating and Scaling our Global Platform
Unlike legacy CDNs that focus only on basic functions, content, and network volume, Fastly’s modern architecture allows us to continually evolve to meet the compute and performance demands of today’s data-rich applications and the agile developers who build them.
We are innovating and scaling our platform efficiently and continue to build capacity to meet market demand, even in these uncertain times. As of Q3 2020, we were in 55 markets, providing access to 106 Tb/sec. of global network capacity. To ensure the safety of our employees, adhere to travel restrictions, and to minimize operational constraints, we focused on augmenting our capacity in established markets in the third quarter. While we did not experience any negative supply chain impacts during the quarter, we will continue to closely monitor and are prepared to make any necessary adjustments should today’s macro challenges continue for an extended period.
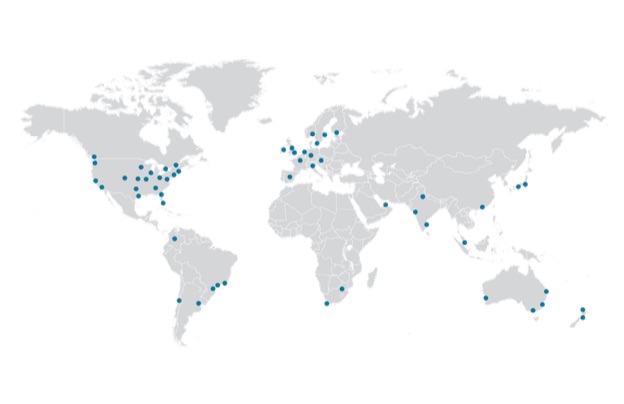
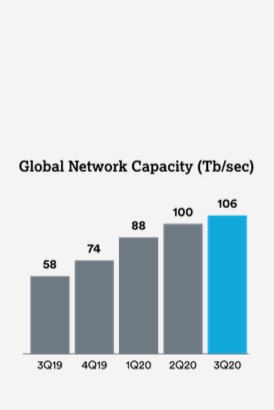
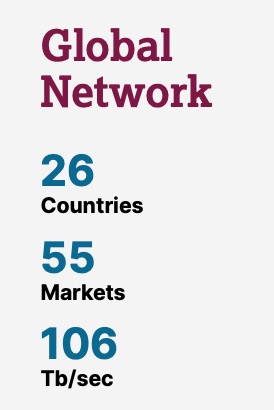
Exhibit 99.1
Executing on Operating Leverage
We remain confident in our path to profitability over time despite the uncertainties we presently face in the macro-environment. In Q3 2020, we generated $0.8 million of adjusted EBITDA1, compared to ($5) million in Q3 2019. This incremental leverage is due to the efficiency of our platform, modern technology, and delayed spending due to Covid-19 impacts.
As we highlighted last quarter, we remain extremely focused on innovation, system efficiency, and system design to further improve our network. We expect these improvements to reduce computing requirements for common workloads, increase overall POP capacity, and ultimately increase the amount of revenue per server.
__________
1For the definition and a reconciliation of non-GAAP financial measures to their corresponding GAAP measures, please refer to the reconciliation table at the end of this letter.
Exhibit 99.1
Financial Discussion
Revenue
Total revenue for Q3 2020 increased 42% year-over-year to $71 million and was primarily driven by further adoption of our modern edge platform and products by new and existing enterprise organizations across multiple geographies and verticals.
Customer Count
As of Q3 2020, total customer count increased to 2,047 from 1,951 in Q2 2020. Total enterprise customer count also increased to 313 from 304 in Q2 2020 and accounts for 88% of our trailing twelve-month total revenue.
Gross Margin
GAAP gross margin was 58.5% for Q3 2020, up from 55.2% in Q3 2019. Excluding stock-based compensation, non-GAAP gross margin in Q3 2020 was 59.8%, up 370 basis points from 56.1% in Q3 2019.
Expenses
Research and development expenses were $18 million in Q3 2020, or 26% of revenue, up from $12 million, or 24% of revenue in Q3 2019. The increase was primarily driven by an increase in headcount and personnel-related investments geared toward innovating new products and features to produce next-generation edge computing solutions.
Sales and marketing expenses were $23 million in Q3 2020, representing 32% of revenue, up from $18 million, or 35% of revenue in Q3 2019. The increase was primarily driven by an increase in headcount and personnel-related costs to drive future enterprise customer acquisition growth, as well as to encourage further use of our platform by existing customers.
General and administrative expenses were $24 million in Q3 2020, or 34% of revenue, up from $11 million, or 21% of revenue in Q3 2019. The higher expense was primarily driven by an increase in headcount and personnel-related costs to support the growth of our operations as a public company, as well as $7 million of acquisition-related expenses.
In total, our operating expenses for Q3 2020 were $65 million, or 92% of revenue, compared to $40 million, or 81% of revenue in Q3 2019. When excluding $7 million of acquisition-related expenses, our operating expenses remain relatively consistent at 82% of revenue.
We generated a GAAP operating loss for Q3 2020 of $23 million, or 33% of revenue, compared to GAAP operating loss of $13 million, or 26% of revenue in Q3 2019. Excluding stock-based compensation in both quarters and acquisition-related expenses in Q3 2020, non-GAAP operating loss for Q3 2020 was $4 million, or 6% of revenue, compared to non-GAAP operating loss of $9 million, or 18% of revenue in Q3 2019. The increase in stock-based compensation is primarily due to the impact of grants from transitioning the company to an annual focal cycle.
Exhibit 99.1
Net Loss
GAAP net loss for Q3 2020 was $24 million, or $0.22 loss per basic and diluted shares, compared to net loss of $12 million and $0.13 loss per basic and diluted shares in Q3 2019. Non-GAAP net loss for Q3 2020 was $4 million, or $0.04 loss per basic and diluted shares, compared to non-GAAP net loss of $8 million, or $0.09 loss per basic and diluted shares in Q3 2019. For a reconciliation of non-GAAP financial measures to their corresponding GAAP measures, please refer to the reconciliation table at the end of this letter.
Balance Sheet, Capital Expenditures, and Cash Flow
We ended Q3 2020 with $472 million in cash, restricted cash, and investments in marketable securities. Cash provided by operations was $27 million in the quarter, which was primarily driven by a decrease in accounts receivable and timing of vendor payments. Capital expenditures, or cash used for purchases of property and equipment and capitalized internal-use software, were $14 million in Q3 2020, representing 20% of total revenue, up from $3 million or 4% of total revenue last quarter. Free Cash Flow was $13 million in Q3 2020. For additional context, please refer to the free cash flow table at the end of this letter.
Exhibit 99.1
Q4 and Full-Year 2020 Guidance
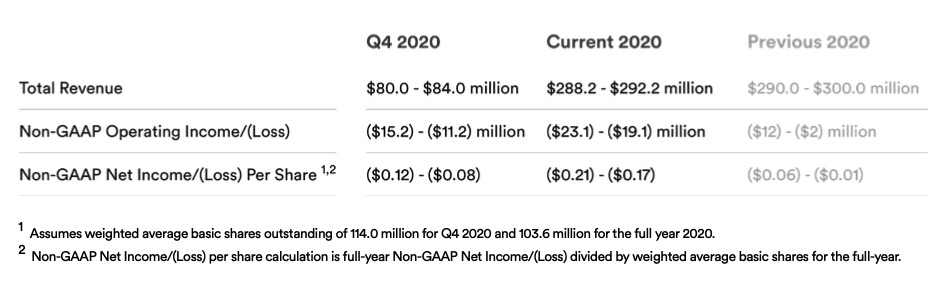
Despite the current global economic uncertainty, as well as the challenges we experienced in the third quarter, we remain optimistic about the demand for our services and the underlying growth of our business. However, as mentioned earlier, we expect to see an impact in the fourth quarter from the issues outlined above and have factored this into Q4 and FY 2020 guidance. Our assumptions include:
•Regulatory Uncertainty: As discussed at the outset of our shareholder letter, our previously disclosed largest customer’s traffic on our network has been reduced. Due to the ongoing fluidity and regulatory uncertainty related to this customer, we only assumed revenue from this customer that we expect to bill in October 2020 in the low end of Q4 and FY2020 guidance ranges. While we have no additional insight beyond what is in the public domain, for the high end of our Q4 and FY2020 guidance ranges we forecasted that the current reduced traffic levels that we have observed will remain only through early November.
•Existing customer timing: Additionally, for those few customers that have brought on additional traffic to our network since the third quarter, we only assumed the currently observed traffic levels at the low end of our guidance. At the high end of our range, we forecasted increased traffic levels from these customers based on our previous seasonal experience in Q4.
•UPDATE 10/30/2020: With the successfully completed acquisition of Signal Sciences on October 1, 2020, our Q4 and FY2020 guidance includes an $8 million revenue contribution from Signal Sciences. This represents the deferred revenue that Signal Sciences expected to recognize in the fourth quarter, but does not reflect purchase price accounting adjustments from the acquisition. These adjustments could materially reduce the amount of Signal Sciences’ deferred revenue that will be recognized in the fourth quarter.
•Non-GAAP Operating Loss and Non-GAAP Loss Per Share reflect the impacts of the customer-specific factors previously outlined, as well as, former Signal Sciences and current Fastly hiring plans.
Exhibit 99.1
Q4 and Full-Year 2020 Guidance
Gross margin will continue to be affected by the timing of personnel and infrastructure investments, along with the seasonal fluctuations of platform usage by our customers. Despite the uncertain economic environment, we remain confident in our ability to deliver incremental annual gross margin expansion as we continue to scale and deliver innovative security and edge computing solutions.
As we continue to invest in the business in 2020 through global network expansion, we continue to expect annual capital expenditures as a percentage of revenue to be approximately 13% to 14% of revenue ⏤ similar to full-year 2018. Long-term, we expect capital expenditures to approach 10% of revenue on a calendar year basis.
A reconciliation of non-GAAP guidance measures to corresponding GAAP measures for our Q4 and Full Year 2020 Business Outlook is not available on a forward-looking basis without unreasonable effort due to the uncertainty regarding, and the potential variability of, many of these costs and expenses that may be incurred in the future. We have provided a reconciliation of GAAP to non-GAAP financial measures for Q3 2020 in the reconciliation table at the end of this letter.
Exhibit 99.1
Quarterly Conference Call
We will host a live Q&A session at 2:00 p.m. PT / 5:00 p.m. ET on Wednesday, October 28, 2020, to discuss these financial results. To participate in the live call, please dial (833) 968-2077 (U.S. / Canada) or (236) 714-2139 (International) and provide conference ID 2491525. A live webcast of the call will be available at https://investors.fastly.com and will be archived on our site following the call.
In closing, I want to thank all of our stakeholders — specifically our investors, customers and employees — for being on this journey with us. I think we all share a common belief in the power of digital transformation to inspire, connect and propel us into the future. Fastly is proud of the role we play as a trusted partner in this transformation, and that is what excites me about this company and gives me confidence in our path forward.
Thank you for reading our letter, and we look forward to your questions on our call this afternoon.
Sincerely,
Joshua Bixby
CEO
Exhibit 99.1
Forward-Looking Statements
This letter to shareholders contains forward-looking statements within the meaning of Section 27A of the Securities Act of 1933, as amended (the "Securities Act"), and Section 21E of the Securities Exchange Act of 1934, as amended, about us and our industry that involve substantial risks and uncertainties. Forward-looking statements generally relate to future events or Fastly's future financial or operating performance. In some cases, you can identify forward-looking statements because they contain words such as "may," "will," "should," "expects," "plans," "anticipates,” “going to,” "could," "intends," "target," "projects," "contemplates," "believes," "estimates," "predicts," "potential," or "continue," or the negative of these words or other similar terms or expressions that concern Fastly's expectations, strategy, priorities, plans, or intentions. Forward-looking statements in this letter to shareholders include, but are not limited to, statements regarding Fastly’s future financial and operating performance, including its outlook and guidance; Fastly's strategies, product, and business plans, including its ability to scale and assist its customers and platform partners to grow; Fastly’s investment in future product offerings, such as security products; statements regarding Fastly's investments in revenue, marketing and demand generation, and the impact of such investments on its business; statements regarding the performance of Fastly's platform; statements regarding Fastly’s projections for achieving profitability; Fastly's expectations regarding the expansion of its customer base, including the growth and usage of its customers; statements regarding regulatory uncertainty; statements regarding existing customer timing; the expected impact of the Signal Sciences acquisition, including the impact of purchase price accounting with respect to the acquisition; and the effects of the COVID-19 pandemic. Fastly's expectations and beliefs regarding these matters may not materialize, and actual results in future periods are subject to risks and uncertainties that could cause actual results to differ materially from those projected. These risks include the possibility that: Fastly is unable to attract and retain customers; Fastly's existing customers and partners do not maintain or increase usage of Fastly's platform; Fastly's platform and product features do not meet expectations, including due to interruptions, security breaches, delays in performance or other similar problems; Fastly is unable to adapt to meet evolving market and customer demands and rapid technological change; Fastly is unable to comply with modified or new industry standards, laws and regulations; Fastly is unable to generate sufficient revenues to achieve or sustain profitability; Fastly is unable to integrate the business and operations of Signal Sciences; Fastly’s limited operating history makes it difficult to evaluate its prospects and future operating results; Fastly is unable to effectively manage its growth; and Fastly is unable to compete effectively. The forward-looking statements contained in this shareholder letter are also subject to other risks and uncertainties, including those more fully described in Fastly's Annual Report on Form 10-K for the year ended December 31, 2019, our Quarterly Reports on Form 10-Q, and other filings and reports that we may file from time to time with the SEC. The forward-looking statements in this letter to shareholders are based on information available to Fastly as of the date hereof and Fastly disclaims any obligation to update any forward-looking statements, except as required by law.
Exhibit 99.1
Non-GAAP Financial Measures
To supplement our condensed consolidated financial statements, which are prepared and presented in accordance with accounting principles generally accepted in the United States ("GAAP"), the Company uses the following non-GAAP measures of financial performance: non-GAAP gross profit, non-GAAP gross margin, non-GAAP net loss, non-GAAP basic and diluted net loss per common share, non-GAAP research and development, non-GAAP sales and marketing, non-GAAP general and administrative, free cash flow and adjusted EBITDA. The presentation of this additional financial information is not intended to be considered in isolation from, as a substitute for, or superior to, the financial information prepared and presented in accordance with GAAP. These non-GAAP measures have limitations in that they do not reflect all of the amounts associated with our results of operations as determined in accordance with GAAP. In addition, these non-GAAP financial measures may be different from the non-GAAP financial measures used by other companies. These non-GAAP measures should only be used to evaluate our results of operations in conjunction with the corresponding GAAP measures. Management compensates for these limitations by reconciling these non-GAAP financial measures to the most comparable GAAP financial measures within our earnings releases.
Non-GAAP gross profit, non-GAAP gross margin, non-GAAP research and development, non-GAAP sales and marketing, and non-GAAP general and administrative differ from GAAP in that they exclude stock-based compensation expense and acquisition-related expenses. Non-GAAP net loss and non-GAAP basic and diluted net loss per common share differ from GAAP in that they exclude stock-based compensation expense, acquisition-related expenses, interest expense related to the acceleration of deferred debt issuance costs due to the early repayment of debt, and other expense related to the mark-to-market of our convertible preferred warrant liability immediately prior to our initial public offering ("IPO") .
Adjusted EBITDA: Adjusted EBITDA excludes acquisition-related and other expenses, stock-based compensation expense, depreciation and amortization expense, interest income, interest expense, other expense, net, and income taxes.
Capital Expenditures: cash used for purchases of property and equipment and capitalized internal-use software, as reflected in our statement of cash flows.
Depreciation and Amortization Expense: consists of non-cash charges that can be affected by the timing and magnitude of asset purchases. Depreciation and amortization expense is included in the following cost and expense line items of our GAAP presentation: cost of revenue, research and development, sales and marketing, and general and administrative. Management considers its operating results without amortization expense when evaluating its ongoing non-GAAP performance and without depreciation and amortization expense when evaluating its ongoing adjusted EBITDA performance because these charges are non-cash expenses that can be affected by the timing and magnitude of asset purchases and may not be reflective of our core business, ongoing operating results, or future outlook.
Free Cash Flow: calculated as net cash used in operating activities less capital expenditures.
Exhibit 99.1
Interest Expense: consists primarily of interest expense related to our debt instruments. Management considers its operating results without interest expense associated with the acceleration of deferred debt issuance costs associated with early repayment of debt when evaluating its ongoing non-GAAP performance and without total interest expense when evaluating its ongoing adjusted EBITDA performance because it is not believed by management to be reflective of our core business, ongoing operating results or future outlook.
Interest Income: consists primarily of interest income related to our marketable securities. Management considers its adjusted EBITDA results without this activity when evaluating its ongoing performance because it is not believed by management to be reflective of our core business, ongoing operating results or future outlook.
Income Taxes: consists of expenses recognized related to state and foreign income taxes. Management considers its adjusted EBITDA results without these charges when evaluating its ongoing performance because it is not believed by management to be reflective of our core business, ongoing operating results or future outlook.
Non-GAAP Operating Loss: calculated as GAAP revenue less non-GAAP cost of revenue and non-GAAP operating expenses.
Other Income (Expense), Net: consists primarily of other income (expenses) related to mark-to-market adjustments of our convertible preferred stock warrant liabilities. Upon the closing of the IPO, the warrants to purchase shares of preferred stock were converted into warrants to purchase shares of our common stock. As a result, the warrant liability was remeasured a final time immediately prior to the IPO and reclassified to additional paid in capital within stockholders' deficit. Management considers its operating results without other expense associated with the mark-to-market adjustments included in other expense, net, when evaluating its ongoing non-GAAP performance and without total other expense, net when evaluating its ongoing adjusted EBITDA performance because it is not believed by management to be reflective of our core business, ongoing operating results or future outlook.
Stock-based Compensation Expense: consists of expenses for stock options, restricted stock units, and Employee Stock Purchase Plan ("ESPP") under our equity incentive plans. Stock-based compensation is included in the following cost and expense line items of our GAAP presentation: cost of revenue, research and development, sales and marketing, and general and administrative.
Although stock-based compensation is an expense for the Company and is viewed as a form of compensation, management excludes stock-based compensation from our non-GAAP measures and adjusted EBITDA results for purposes of evaluating our continuing operating performance primarily because it is a non-cash expense not believed by management to be reflective of our core business, ongoing operating results, or future outlook. In addition, the value of stock-based instruments is determined using formulas that incorporate variables, such as market volatility, that are beyond our control.
Management believes these non-GAAP financial measures and adjusted EBITDA serve as useful metrics for our management and investors because they enable a better understanding of the long-term performance of our core business and facilitate comparisons of our operating results over multiple periods and to those of peer companies,
Exhibit 99.1
and when taken together with the corresponding GAAP financial measures and our reconciliations, enhance investors' overall understanding of our current financial performance.
In the financial tables below, the Company provides a reconciliation of the most comparable GAAP financial measure to the historical non-GAAP financial measures used in this shareholder letter.
Exhibit 99.1
Condensed Consolidated Statements of Operations
(in thousands, except per share amounts, unaudited)
| Three months ended September 30, | Nine months ended September 30, | |||||||||||||||||||||||||
| 2020 | 2019 | 2020 | 2019 | |||||||||||||||||||||||
| Revenue | $ | 70,638 | $ | 49,797 | $ | 208,225 | $ | 141,526 | ||||||||||||||||||
Cost of revenue(1) | 29,292 | 22,292 | 86,254 | 62,794 | ||||||||||||||||||||||
| Gross profit | 41,346 | 27,505 | 121,971 | 78,732 | ||||||||||||||||||||||
| Operating expenses: | ||||||||||||||||||||||||||
Research and development(1) | 18,271 | 12,121 | 49,224 | 33,541 | ||||||||||||||||||||||
Sales and marketing(1) | 22,568 | 17,560 | 66,416 | 49,505 | ||||||||||||||||||||||
General and administrative(1) | 23,961 | 10,583 | 56,199 | 28,203 | ||||||||||||||||||||||
| Total operating expenses | 64,800 | 40,264 | 171,839 | 111,249 | ||||||||||||||||||||||
| Loss from operations | (23,454) | (12,759) | (49,868) | (32,517) | ||||||||||||||||||||||
| Interest income | 353 | 1,154 | 1,450 | 2,431 | ||||||||||||||||||||||
| Interest expense | (410) | (621) | (1,097) | (4,845) | ||||||||||||||||||||||
| Other income (expense), net | 69 | 109 | 418 | (2,363) | ||||||||||||||||||||||
| Loss before income taxes | (23,442) | (12,117) | (49,097) | (37,294) | ||||||||||||||||||||||
| Income taxes | 336 | 46 | 1,131 | 183 | ||||||||||||||||||||||
| Net loss | $ | (23,778) | $ | (12,163) | $ | (50,228) | $ | (37,477) | ||||||||||||||||||
| Net loss per share attributable to common stockholders, basic and diluted | $ | (0.22) | $ | (0.13) | $ | (0.50) | $ | (0.63) | ||||||||||||||||||
| Weighted-average shares used in computing net loss per share attributable to common stockholders, basic and diluted | 105,942 | 93,240 | 100,413 | 59,679 | ||||||||||||||||||||||
__________
(1)Includes stock-based compensation expense as follows:
| Three months ended September 30, | Nine months ended September 30, | |||||||||||||||||||||||||
| 2020 | 2019 | 2020 | 2019 | |||||||||||||||||||||||
| Cost of revenue | $ | 929 | $ | 438 | $ | 2,634 | $ | 875 | ||||||||||||||||||
| Research and development | 4,371 | 968 | 10,095 | 2,114 | ||||||||||||||||||||||
| Sales and marketing | 3,194 | 929 | 11,753 | 1,894 | ||||||||||||||||||||||
| General and administrative | 3,648 | 1,505 | 10,270 | 2,667 | ||||||||||||||||||||||
| Total | $ | 12,142 | $ | 3,840 | $ | 34,752 | $ | 7,550 | ||||||||||||||||||
Exhibit 99.1
Condensed Consolidated Balance Sheets
(in thousands)
| As of September 30, 2020 | As of December 31, 2019 | |||||||||||||
| (unaudited) | (audited) | |||||||||||||
| Assets | ||||||||||||||
| Current assets: | ||||||||||||||
| Cash and cash equivalents | $ | 309,968 | $ | 16,142 | ||||||||||
| Marketable securities | 92,302 | 114,967 | ||||||||||||
| Accounts receivable, net | 42,593 | 37,136 | ||||||||||||
| Restricted cash | 70,087 | 70,087 | ||||||||||||
| Prepaid expenses and other current assets | 14,769 | 10,991 | ||||||||||||
| Total current assets | 529,719 | 249,323 | ||||||||||||
| Property and equipment, net | 83,498 | 60,037 | ||||||||||||
| Goodwill | 362 | 372 | ||||||||||||
| Intangible assets, net | 2,792 | 1,125 | ||||||||||||
| Other assets | 15,147 | 10,112 | ||||||||||||
| Total assets | $ | 631,518 | $ | 320,969 | ||||||||||
| Liabilities and Stockholders’ Equity | ||||||||||||||
| Current liabilities: | ||||||||||||||
| Accounts payable | $ | 12,273 | $ | 4,602 | ||||||||||
| Accrued expenses | 38,559 | 19,878 | ||||||||||||
| Current portion of long-term debt | 6,060 | 4,472 | ||||||||||||
| Other current liabilities | 9,555 | 8,169 | ||||||||||||
| Total current liabilities | 66,447 | 37,121 | ||||||||||||
| Long-term debt, less current portion | 26,007 | 25,158 | ||||||||||||
| Other long-term liabilities | 3,944 | 1,038 | ||||||||||||
| Total liabilities | 96,398 | 63,317 | ||||||||||||
| Stockholders’ equity: | ||||||||||||||
| Class A and Class B common stock | 2 | 2 | ||||||||||||
| Additional paid-in capital | 777,231 | 449,463 | ||||||||||||
| Accumulated other comprehensive income | 124 | 196 | ||||||||||||
| Accumulated deficit | (242,237) | (192,009) | ||||||||||||
| Total stockholders’ equity | 535,120 | 257,652 | ||||||||||||
| Total liabilities and stockholders’ equity | $ | 631,518 | $ | 320,969 | ||||||||||
Exhibit 99.1
Condensed Consolidated Statements of Cash Flows
(in thousands, unaudited)
| Three months ended September 30, | Nine months ended September 30, | |||||||||||||||||||||||||
| 2020 | 2019 | 2020 | 2019 | |||||||||||||||||||||||
| Cash flows from operating activities: | ||||||||||||||||||||||||||
| Net loss | $ | (23,778) | $ | (12,163) | $ | (50,228) | $ | (37,477) | ||||||||||||||||||
| Adjustments to reconcile net loss to net cash used in operating activities: | ||||||||||||||||||||||||||
| Depreciation and amortization | 4,967 | 4,069 | 14,411 | 11,693 | ||||||||||||||||||||||
| Amortization of deferred rent | 1,450 | 1,196 | 2,941 | 5,181 | ||||||||||||||||||||||
| Amortization of debt issuance costs | 20 | 68 | 58 | 1,884 | ||||||||||||||||||||||
| Amortization of prepaid commissions | 894 | 567 | 2,375 | 1,690 | ||||||||||||||||||||||
| Stock-based compensation | 12,142 | 3,840 | 34,752 | 7,550 | ||||||||||||||||||||||
| Provision for doubtful accounts | 196 | 275 | 1,212 | 344 | ||||||||||||||||||||||
| Change in fair value of preferred stock warrant liabilities | — | — | — | 2,404 | ||||||||||||||||||||||
| Other adjustments | 227 | (102) | 207 | (502) | ||||||||||||||||||||||
| Interest paid on capital leases | (186) | (98) | (454) | (269) | ||||||||||||||||||||||
| Loss (gain) on disposal of property and equipment | (133) | 4 | (133) | 43 | ||||||||||||||||||||||
| Changes in operating assets and liabilities: | ||||||||||||||||||||||||||
| Accounts receivable | 15,542 | (5,638) | (6,669) | (9,520) | ||||||||||||||||||||||
| Prepaid expenses and other current assets | (1,795) | (2,031) | (3,778) | (5,811) | ||||||||||||||||||||||
| Other assets | (2,641) | (950) | (7,410) | (6,468) | ||||||||||||||||||||||
| Accounts payable | 5,682 | 1,309 | 7,046 | 4,579 | ||||||||||||||||||||||
| Accrued expenses | 14,598 | (2,990) | 17,224 | (2,703) | ||||||||||||||||||||||
| Other liabilities | 15 | 49 | (321) | (861) | ||||||||||||||||||||||
| Net cash provided by (used in) operating activities | 27,200 | (12,595) | 11,233 | (28,243) | ||||||||||||||||||||||
| Cash flows from investing activities: | ||||||||||||||||||||||||||
| Purchase of marketable securities | (148,174) | (144,863) | (204,361) | (177,525) | ||||||||||||||||||||||
| Sale of marketable securities | 143,241 | — | 143,241 | 3,578 | ||||||||||||||||||||||
| Maturities of marketable securities | 38,817 | 23,988 | 83,718 | 68,044 | ||||||||||||||||||||||
| Proceeds from sale of property and equipment | 150 | — | 150 | — | ||||||||||||||||||||||
| Purchases of property and equipment | (11,893) | (2,878) | (24,443) | (10,400) | ||||||||||||||||||||||
| Capitalized internal-use software | (1,901) | (1,511) | (4,082) | (3,218) | ||||||||||||||||||||||
| Purchase of intangible assets | — | — | (1,811) | (636) | ||||||||||||||||||||||
| Net cash provided by (used in) investing activities | 20,240 | (125,264) | (7,588) | (120,157) | ||||||||||||||||||||||
| Cash flows from financing activities: | ||||||||||||||||||||||||||
| Proceeds from initial public offering, net of underwriting fees | — | — | — | 192,510 | ||||||||||||||||||||||
| Payments of costs related to initial public offering | — | (799) | — | (4,452) | ||||||||||||||||||||||
| Proceeds from follow-on public offering, net of underwriting fees | — | — | 274,896 | — | ||||||||||||||||||||||
| Payments of costs related to follow-on public offering | (502) | — | (675) | — | ||||||||||||||||||||||
| Repayments of notes payable | — | (22,500) | — | (27,488) | ||||||||||||||||||||||
| Repayments of capital leases | (469) | (229) | (3,060) | (905) | ||||||||||||||||||||||
| Proceeds from employee stock purchase plan | 2,042 | 2,321 | 6,206 | 3,131 | ||||||||||||||||||||||
| Proceeds from exercise of vested stock options | 4,122 | 298 | 12,953 | 2,828 | ||||||||||||||||||||||
| Proceeds from early exercise of stock options | — | — | — | 520 | ||||||||||||||||||||||
| Proceeds from payment of stockholder note | — | — | — | 74 | ||||||||||||||||||||||
| Net cash provided by (used in) financing activities | 5,193 | (20,909) | 290,320 | 166,218 | ||||||||||||||||||||||
| Effects of exchange rate changes on cash, cash equivalents, and restricted cash | (83) | 11 | (139) | 12 | ||||||||||||||||||||||
| Net increase (decrease) in cash, cash equivalents, and restricted cash | 52,550 | (158,757) | 293,826 | 17,830 | ||||||||||||||||||||||
| Cash, cash equivalents, and restricted cash at beginning of period | 327,505 | 213,550 | 86,229 | 36,963 | ||||||||||||||||||||||
| Cash, cash equivalents, and restricted cash at end of period | $ | 380,055 | $ | 54,793 | $ | 380,055 | $ | 54,793 | ||||||||||||||||||
| Reconciliation of cash, cash equivalents, and restricted cash as shown in the statements of cash flows | ||||||||||||||||||||||||||
| Cash and cash equivalents | $ | 309,968 | $ | 54,706 | $ | 309,968 | $ | 54,706 | ||||||||||||||||||
| Restricted cash included in prepaid and other current assets line item of Condensed Consolidated Balance Sheets | $ | 70,087 | $ | 87 | $ | 70,087 | $ | 87 | ||||||||||||||||||
| Total cash, cash equivalents, and restricted cash | $ | 380,055 | $ | 54,793 | $ | 380,055 | $ | 54,793 | ||||||||||||||||||
Exhibit 99.1
Free Cash Flow
(in thousands, unaudited)
| Quarter ended | Year ended | Quarter ended | ||||||||||||||||||||||||||||||||||||||||||||||||
| Q1 2019 | Q2 2019 | Q3 2019 | Q4 2019 | Q4 2019 | Q1 2020 | Q2 2020 | Q3 2020 | |||||||||||||||||||||||||||||||||||||||||||
| Cash flow provided by (used in) operations | $ | (10,083) | $ | (5,565) | $ | (12,595) | $ | (3,060) | $ | (31,303) | $ | (7,186) | $ | (8,781) | $ | 27,200 | ||||||||||||||||||||||||||||||||||
Capital expenditures(1) | (4,784) | (4,445) | (4,389) | (5,847) | (19,465) | (11,658) | (3,073) | (13,794) | ||||||||||||||||||||||||||||||||||||||||||
Free Cash Flow(2) | $ | (14,867) | $ | (10,010) | $ | (16,984) | $ | (8,907) | $ | (50,768) | $ | (18,844) | $ | (11,854) | $ | 13,406 | ||||||||||||||||||||||||||||||||||
__________
(1)Capital Expenditures are defined as cash used for purchases of property and equipment and capitalized internal-use software, as reflected in our statement of cash flows.
(2)As of Q3 2019, we started disclosing Free Cash Flow, which is defined as cash flow from operating activities less capital expenditures.
Exhibit 99.1
Reconciliation of GAAP to Non-GAAP Financial Measures
(in thousands, unaudited)
| Three months ended September 30, | Nine months ended September 30, | ||||||||||||||||||||||||||||
| 2020 | 2019 | 2020 | 2019 | ||||||||||||||||||||||||||
| Gross Profit | |||||||||||||||||||||||||||||
| GAAP gross profit | $ | 41,346 | $ | 27,505 | $ | 121,971 | $ | 78,732 | |||||||||||||||||||||
| Stock-based compensation—Cost of revenue | 929 | 438 | 2,634 | 875 | |||||||||||||||||||||||||
| Non-GAAP gross profit | $ | 42,275 | $ | 27,943 | $ | 124,605 | $ | 79,607 | |||||||||||||||||||||
| Non-GAAP gross margin | 59.8 | % | 56.1 | % | 59.8 | % | 56.2 | % | |||||||||||||||||||||
| Research and development | |||||||||||||||||||||||||||||
| GAAP research and development | $ | 18,271 | $ | 12,121 | $ | 49,224 | $ | 33,541 | |||||||||||||||||||||
| Stock-based compensation | (4,371) | (968) | (10,095) | (2,114) | |||||||||||||||||||||||||
| Non-GAAP research and development | $ | 13,900 | $ | 11,153 | $ | 39,129 | $ | 31,427 | |||||||||||||||||||||
| Sales and marketing | |||||||||||||||||||||||||||||
| GAAP sales and marketing | $ | 22,568 | $ | 17,560 | $ | 66,416 | $ | 49,505 | |||||||||||||||||||||
| Stock-based compensation | (3,194) | (929) | (11,753) | (1,894) | |||||||||||||||||||||||||
| Non-GAAP sales and marketing | $ | 19,374 | $ | 16,631 | $ | 54,663 | $ | 47,611 | |||||||||||||||||||||
| General and administrative | |||||||||||||||||||||||||||||
| GAAP general and administrative | $ | 23,961 | $ | 10,583 | $ | 56,199 | $ | 28,203 | |||||||||||||||||||||
| Stock-based compensation | (3,648) | (1,505) | (10,270) | (2,667) | |||||||||||||||||||||||||
| Acquisition-related expenses | (7,158) | — | (7,158) | — | |||||||||||||||||||||||||
| Non-GAAP general and administrative | $ | 13,155 | $ | 9,078 | $ | 38,771 | $ | 25,536 | |||||||||||||||||||||
| Operating income (loss) | |||||||||||||||||||||||||||||
| GAAP operating loss | $ | (23,454) | $ | (12,759) | $ | (49,868) | $ | (32,517) | |||||||||||||||||||||
| Stock-based compensation | 12,142 | 3,840 | 34,752 | 7,550 | |||||||||||||||||||||||||
| Acquisition-related expenses | 7,158 | — | 7,158 | — | |||||||||||||||||||||||||
| Non-GAAP operating loss | $ | (4,154) | $ | (8,919) | $ | (7,958) | $ | (24,967) | |||||||||||||||||||||
| Net income (loss) | |||||||||||||||||||||||||||||
| GAAP net loss | $ | (23,778) | $ | (12,163) | $ | (50,228) | $ | (37,477) | |||||||||||||||||||||
| Stock-based compensation | 12,142 | 3,840 | 34,752 | 7,550 | |||||||||||||||||||||||||
| Acquisition-related expenses | 7,158 | — | 7,158 | — | |||||||||||||||||||||||||
| Interest expense—acceleration of deferred debt costs due to early repayment | — | — | — | 1,785 | |||||||||||||||||||||||||
| Other expense—mark-to-market warrant liability | — | — | — | 2,404 | |||||||||||||||||||||||||
| Non-GAAP net loss | $ | (4,478) | $ | (8,323) | $ | (8,318) | $ | (25,738) | |||||||||||||||||||||
| Non-GAAP net income (loss) per common share—basic and diluted | $ | (0.04) | $ | (0.09) | $ | (0.08) | $ | (0.43) | |||||||||||||||||||||
| Weighted average basic and diluted common shares | 105,942 | 93,240 | 100,413 | 59,679 | |||||||||||||||||||||||||
Exhibit 99.1
| Three months ended September 30, | Nine months ended September 30, | |||||||||||||||||||||||||
| 2020 | 2019 | 2020 | 2019 | |||||||||||||||||||||||
| Adjusted EBITDA | ||||||||||||||||||||||||||
| GAAP net loss | $ | (23,778) | $ | (12,163) | $ | (50,228) | $ | (37,477) | ||||||||||||||||||
| Stock-based compensation | 12,142 | 3,840 | 34,752 | 7,550 | ||||||||||||||||||||||
| Depreciation and amortization | 4,967 | 4,069 | 14,411 | 11,693 | ||||||||||||||||||||||
| Interest income | (353) | (1,154) | (1,450) | (2,431) | ||||||||||||||||||||||
| Interest expense | 410 | 621 | 1,097 | 4,845 | ||||||||||||||||||||||
| Other (income) expense, net | (69) | (109) | (418) | 2,363 | ||||||||||||||||||||||
| Income taxes | 336 | 46 | 1,131 | 183 | ||||||||||||||||||||||
| Acquisition-related expenses | 7,158 | — | 7,158 | — | ||||||||||||||||||||||
| Adjusted EBITDA | $ | 813 | $ | (4,850) | $ | 6,453 | $ | (13,274) | ||||||||||||||||||