Attached files
| file | filename |
|---|---|
| EX-99.1 - EXHIBIT 99.1 - FIRST BANCORP /PR/ | a52317376ex99_1.htm |
| 8-K - FIRST BANCORP. 8-K - FIRST BANCORP /PR/ | a52317376.htm |
Exhibit 99.2

Financial Results 3Q 2020

Forward-Looking Statement This presentation may contain “forward-looking statements” concerning the
Corporation’s future economic, operational and financial performance. The words or phrases “expect,” “anticipate,” “intend,” “should,” “would,” “believe” and similar expressions are meant to identify “forward-looking statements” within the
meaning of Section 27A of the Securities Act of 1933, as amended, and Section 21E of the Securities Exchange Act of 1934, as amended, and are subject to the safe harbor created by such sections. The Corporation cautions readers not to place
undue reliance on any such forward-looking statements, which speak only as of the date made, and advises readers that various factors, including, but not limited to, the following could cause actual results to differ materially from those
expressed in, or implied by, such forward-looking statements: uncertainties relating to the impact of the COVID-19 pandemic, including recent increases in, and any additional waves of, COVID-19 cases and the development and availability of a
vaccine and treatments for the disease, on the Corporation’s business, operations, employees, credit quality, financial condition and net income, including because of uncertainties as to the extent and duration of the pandemic and the impact
of the pandemic on consumer spending, borrowing and saving habits, the underemployment and unemployment rates, which can adversely affect repayment patterns, the Puerto Rico economy and the global economy, as well as the risk that COVID-19
may exacerbate any other factor that could cause our actual results to differ materially from those expressed in or implied by any forward-looking statements; the success of our preventative actions to protect the Corporation’s information
and that of its customers in response to the cyber incident that we recently experienced, including the integrity of our data and data security systems, increased mitigation costs or an adverse effect to our reputation; risks related to the
effect on the Corporation and its customers of governmental, regulatory, or central bank responses to COVID-19 and the Corporation’s participation in any such responses or programs, such as the Paycheck Protection Program established by the
CARES Act of 2020, including any judgments, claims, damages, penalties, fines or reputational damage resulting from claims or challenges against the Corporation by governments, regulators, customers or otherwise, relating to the Corporation’s
participation in any such responses or programs; the risk that costs, expenses, and resources associated with the Corporation’s recent acquisition of BSPR may be higher than expected; the ability to successfully complete the integration of
systems, procedures, and personnel of BSPR into FirstBank that are necessary to make the transaction economically successful; the risk that the Corporation may not be able to effectively integrate BSPR into the Corporation’s internal control
over financial reporting; the risk that the cost savings and any other synergies from the acquisition may not be fully realized or may take longer to realize than expected, such as the risk that deposit attrition, customer loss and/or revenue
loss following the acquisition may exceed expectations, including because of the impact of the COVID-19 pandemic on customers; uncertainty as to the ultimate outcomes of actions taken, or those that may be taken, by the Puerto Rico
government, or the oversight board established by the Puerto Rico Oversight, Management, and Economic Stability Act (“PROMESA”) to address the Commonwealth of Puerto Rico’s financial problems, including a court-supervised debt restructuring
process similar to U.S. bankruptcy protection undertaken pursuant to Title III of PROMESA, the designation by the PROMESA oversight board of Puerto Rico municipalities as instrumentalities covered under PROMESA, the effects of measures
included in the Puerto Rico government fiscal plan, or any revisions to it, on our clients and loan portfolios, and any potential impact from future economic or political developments in Puerto Rico; changes in economic and business
conditions, including those caused by the COVID-19 pandemic, including recent increases in, and any additional waves of, COVID-19 cases, or other global or regional health crises as well as past or future natural disasters, such as the
earthquakes affecting Puerto Rico’s southern coast, that directly or indirectly affect the financial health of the Corporation’s customer base in the geographic areas we serve and may result in increased costs or losses of property and
equipment and other assets; the impact that a slowing economy and increased unemployment or underemployment may have on the performance of our loan and lease portfolio, the market price of our investment securities, the availability of
sources of funding and the demand for our products; a decrease in demand for the Corporation’s products and services, resulting in lower revenues and earnings because of the continued economic recession in Puerto Rico; uncertainty as to the
availability of certain funding sources, such as brokered CDs; the deteriorating weakness of the real estate markets and of the consumer and commercial sectors, which may be exacerbated by unemployment and underemployment and government
restrictions imposed as a result of the COVID-19 pandemic, including recent increases in, and any additional waves of, COVID-19 cases, and their impact on the credit quality of the Corporation’s loans and other assets, which have contributed
and may continue to contribute to, among other things, higher than targeted levels of non-performing assets, charge-offs and provisions for credit losses, and may subject the Corporation to further risk from loan defaults and foreclosures;
the impact of changes in accounting standards or assumptions in applying those standards, including the impact of the COVID-19 pandemic on the determination of the allowance for credit losses required by the new CECL accounting standard
effective since January 1, 2020; the ability of FirstBank to realize the benefits of its net deferred tax assets; the ability of FirstBank to generate sufficient cash flow to make dividend payments to the Corporation; adverse changes in
general economic conditions in Puerto Rico, the U.S., the U.S. Virgin Islands, and the British Virgin Islands, including the interest rate environment, market liquidity, housing absorption rates, real estate prices, and disruptions in the
U.S. capital markets, including as a result of the COVID-19 pandemic and recent increases in, and any additional waves of, COVID-19 cases, which may further reduce interest margins, affect funding sources and demand for all of the
Corporation’s products and services, and reduce the Corporation’s revenues and earnings and the value of the Corporation’s assets; uncertainty related to the effect of the discontinuation of the London Interbank Offered Rate at the end of
2021; an adverse change in the Corporation’s ability to attract new clients and retain existing ones; the risk that additional portions of the unrealized losses in the Corporation’s investment portfolio are determined to be credit-related,
including additional charges to the provision for credit losses on the Corporation’s remaining $8.0 million exposure to the Puerto Rico government’s debt securities held as part of the available-for-sale securities portfolio; uncertainty
about legislative, tax or regulatory changes that affect financial services companies in Puerto Rico, the U.S., and the U.S. and British Virgin Islands, which could affect the Corporation’s financial condition or performance and could cause
the Corporation’s actual results for future periods to differ materially from prior results and anticipated or projected results; changes in the fiscal and monetary policies and regulations of the U.S. federal government and the Puerto Rico
and other governments, including those determined by the Federal Reserve Board, the New York FED, the FDIC, government-sponsored housing agencies, and regulators in Puerto Rico and the U.S. and British Virgin Islands; the risk of possible
failure or circumvention of the Corporation’s internal controls and procedures and the risk that the Corporation’s risk management policies may not be adequate; the Corporation’s ability to identify and prevent cyber-security incidents, such
as data security breaches, malware, “denial of service” attacks, “hacking” and identity theft, a failure of which most recently caused a cyber incident, and which may result in misuse or misappropriation of confidential or proprietary
information, and could result in the disruption or damage to our systems, increased costs and losses or an adverse effect to our reputation; the risk that the FDIC may increase the deposit insurance premium and/or require special assessments
to replenish its insurance fund, causing an additional increase in the Corporation’s non-interest expenses; the impact on the Corporation’s results of operations and financial condition of business acquisitions, such as the recent acquisition
of BSPR, and dispositions; a need to recognize impairments on the Corporation’s financial instruments, goodwill and other intangible assets relating to business acquisitions, including as a result of the COVID-19 pandemic; the effect of
changes in the interest rate environment, including as a result of the impact of the COVID-19 pandemic, including recent increases in, and any additional waves of, COVID-19 cases, on the global economy, on the Corporation’s businesses,
business practices and results of operations; the risk that the impact of the occurrence of any of these uncertainties on the Corporation’s capital would preclude further growth of the Bank and preclude the Corporation’s Board of Directors
from declaring dividends; uncertainty as to whether FirstBank will be able to continue to satisfy its regulators regarding, among other things, its asset quality, liquidity plans, maintenance of capital levels and compliance with applicable
laws, regulations, and related requirements; and general competitive factors and industry consolidation. The Corporation does not undertake, and specifically disclaims any obligation, to update any “forward-looking statements” to reflect
occurrences or unanticipated events or circumstances after the date of such statements, except as required by the federal securities laws.

Agenda Third Quarter 2020 Highlights Aurelio Alemán, President & Chief Executive OfficerThird
Quarter 2020 Results of Operations Orlando Berges, Executive Vice President & Chief Financial OfficerQuestions & Answers 3

Third Quarter 2020 Highlights

Third Quarter Highlights Improved Strategic Positioning Successful acquisition of Banco Santander
Puerto Rico on September 1, 2020, securing FBP’s position as the 2nd largest banking institution in a consolidated market Fortress Balance Sheet Liquidity, reserve coverage and capital levels remain among the highest in the banking industry
with ample coverage to weather the impact of disruptions caused by the pandemic Economic Recovery Underway Unprecedented local and federal stimulus programs (~$15 billion) have bolstered liquidity in the system, in addition to over $60
billion of estimated remaining hurricane relief funding Strong Capital Position Capital ratios remain among the highest in the banking sector. Capital actions remain a top priority as the economic environment stabilizes Strong Core
Operating Performance Pre-tax, pre-provision income over $77 million in 3Q20, up over 14% compared to 2Q 2020. Total loans grew $2.5 billion, or 26%, and deposits increased $4.5 billion, or 42%, compared to 2Q20 5

Improved Strategic Positioning Source: S&P Global Market Intelligence, Company Filings. Market
share data as of or for the quarter ending June 30, 2020, Commissioner of Financial Institutions of Puerto Rico. Creates a stronger competitor with greater customer penetration in Puerto Rico with 73 branches and over $12bn in deposits in
Puerto Rico and the scale and breadth to better serve retail and commercial customers FBP AcquiredOperation Transaction Highlights Earnings Per Share (EPS) Accretion Tang Book Val Per Share (TBVPS) Dilution Cost
Savings Transaction Structure Goodwill & Intangibles Restructuring Expenses At Announcement At Closing 35% to Consensus 2020 7% dilutive to TBVPS2.5-year earnback $48 million (pre-tax)50% 2021; 100% thereafter No NPL ($171mm) or
OREO ($46mm) acquired CDI 1.5% amortized over 7 years SYD $76 million (pre-tax)50% Close; 50% 2021 4% dilutive to TBVPSLess than 2-year earnback Same; $2 mm to date; 100% over next 4 quarters Same; $76 million (pre-tax)$25mm as of Sept;
remaining over next 4 quarters 6 Same; additional $29mm reserves delivered at close CDI 1.1% amortized over 6 years straight line Loans $3.1 billion $2.6 billion Deposits $5.0 billion $4.1 billion Pro Forma Market Share / Ranking
(2Q 2020) Same
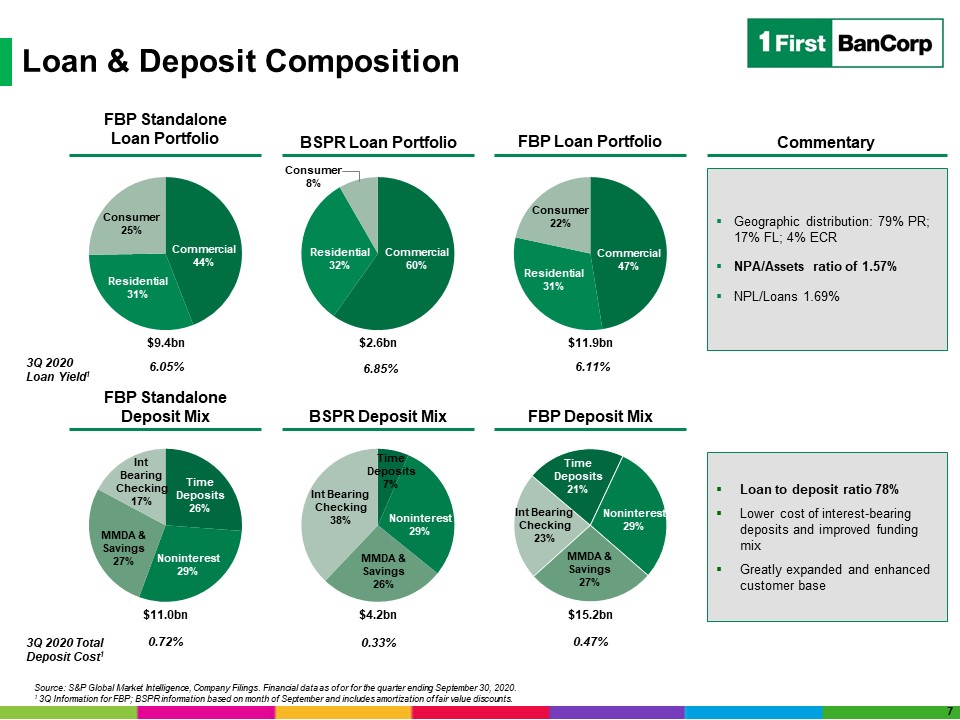
Loan & Deposit Composition FBP Standalone Loan Portfolio BSPR Loan Portfolio FBP Loan
Portfolio Commentary FBP Standalone Deposit Mix BSPR Deposit Mix FBP Deposit Mix Geographic distribution: 79% PR; 17% FL; 4% ECRNPA/Assets ratio of 1.57%NPL/Loans 1.69% Loan to deposit ratio 78%Lower cost of interest-bearing deposits
and improved funding mixGreatly expanded and enhanced customer base $9.4bn $2.6bn $11.9bn $11.0bn $4.2bn $15.2bn Source: S&P Global Market Intelligence, Company Filings. Financial data as of or for the quarter ending September 30,
2020.1 3Q Information for FBP; BSPR information based on month of September and includes amortization of fair value discounts. 7 3Q 2020 Loan Yield1 3Q 2020 Total Deposit Cost1 6.05% 6.11% 6.85% 0.72% 0.47% 0.33%

Economic Recovery Underway 1 Source: Fiscal Plan for Commonwealth of Puerto Rico May 27, 20202 United
States Department of Labor. Bureau of Labor Statistics, Establishment Survey Government stimulus continues to play and important role in mitigating impact to businessesUnprecedented local and federal stimulus programs bolstering liquidity;
core deposits increased $3.7 billion, or 42% in 3Q 2020Over $60 billion of hurricane & COVID relief funding Relief Funds and Reopening Trends August 2020 Payroll Employment2 figures at 92% of 2019 average 100% FBP corporate banking and
99% FBP business banking clients reopened FBP Puerto Rico hotels portfolio at 25-45% occupancy rate as of Sept 30th SJU passenger movement is increasing; 300k in September from 42K in April; still down 48% vs. Sept 2019 FBP Hospital
portfolio occupancy ranging at 53-76% as of Sept 30th FBP Puerto Rico Merchant/POS weekly sales up 237% during last week of Sept vs. last week March 2020; June-Sept 2020 outpacing same period in 2019 Retail Lending Activity near
pre-pandemic levels:Originations reactivated in late-May after full lockdown in PR$69MM in auto loan originations in September, 12% above the 2019 average$45MM in mortgage loan originations in September, 36% above 2019 average Small/personal
loans application still lagging 2019 performance 8

Payment Deferral Programs Relief Program Monitoring 9 ($ in
millions) Jul Oct Jun May Mar Aug Apr Sep $85.1 $470.5 $1,311.2 $1,574.9 $1,467.5 $818.0 $556.8 $48.0 Puerto
Rico $1.2 $45.9 $30.4 $54.3 $43.9 $48.4 $53.9 $14.9 ECR $0.0 $26.3 $94.8 $178.0 $220.8 $92.7 $224.1 $0.0 Florida #: 11k | $: 3,982 #: 821 | $: 186.1 #: 1,477 | $: 1,447 1% 8% 0% Commercial
Portfolio Aug $217.8 May $852.5 Jun Jul Mar Oct $198.1 Sep $946.0 Apr $773.2 $232.9 $165.8 $2.0 Puerto
Rico1 $10.0 $10.3 $0.0 $0.0 $2.6 $16.4 $2.5 $2.7 ECR2 $8.0 $1.2 $2.6 $0.8 $2.2 $0.3 $5.8 $0.2 Florida3 #: 347k | $: 2,491 #: 5,978 | $: 51.1 #: 2,296 | $: 30.1 0.1% 0.1% 1% Consumer
Portfolios May Mar Jun Apr Jul Aug Oct Sep $202.9 $532.1 $813.8 $752.9 $514.7 $536.4 $414.6 $11.6 Puerto
Rico $67.5 $82.2 $33.1 $49.0 $88.8 $1.2 $85.6 $86.1 ECR $7.9 $82.5 $5.6 $103.1 $10.1 $22.7 $40.1 $29.8 Florida #: 35.6K | $: 2,931 #: 1,892 | $: 218.8 #: 2,420 | $: 545.1 0.4% 0.6% 1% Residential Mortgage Notes:
October Relief as of 10-21 | Counts and Balances as of 9-30 (RI) 1Auto, Leases, Personal Loans, Small Loans, Credit Cards, Boats | 2Auto, Personal Loans | 3Auto Active moratoriums reduced to 0.8% of the loan portfolio as of Oct 21 98.9% of
commercial borrowers and 94.3% of retail borrowers remain current after relief expiration, and are back to pre-pandemic payment pattern as of Oct 21As a result of the effects that COVID-19, certain borrowers in industries with expected longer
recovery time, mostly in the Hospitality, Retail & Entertainment, could need additional relief during the stabilization period considering terms provided under Section 4013 of CARES ActExposures being evaluated for potential
modifications Hotels Retail Entertainment Other Real Estate $205.2 $80.7 $31.4 $33.5
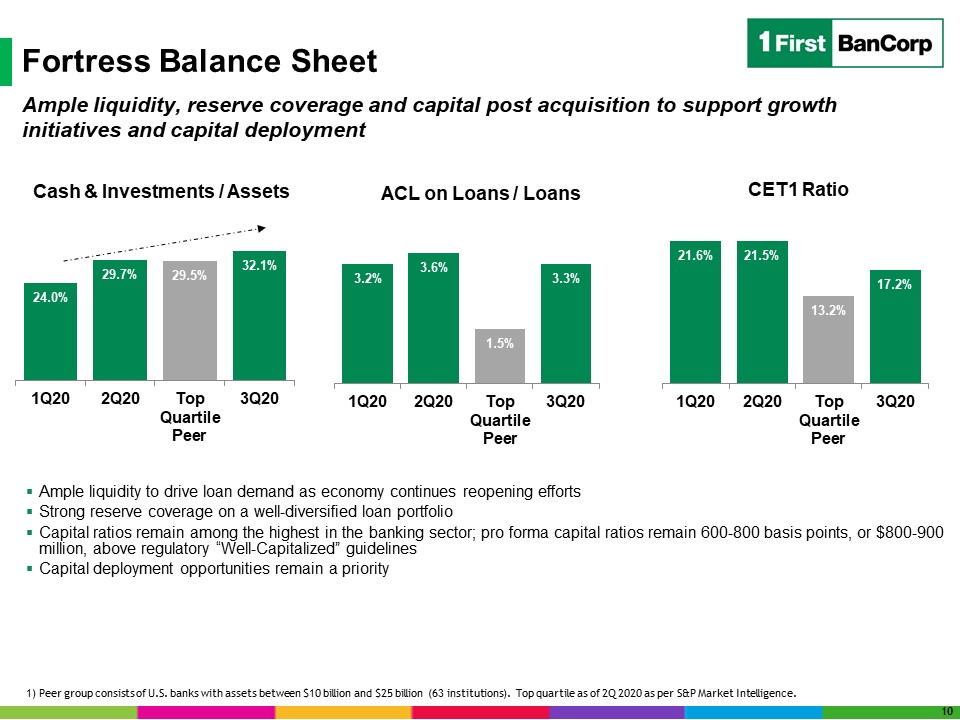
Fortress Balance Sheet Ample liquidity to drive loan demand as economy continues reopening
effortsStrong reserve coverage on a well-diversified loan portfolioCapital ratios remain among the highest in the banking sector; pro forma capital ratios remain 600-800 basis points, or $800-900 million, above regulatory “Well-Capitalized”
guidelinesCapital deployment opportunities remain a priority Ample liquidity, reserve coverage and capital post acquisition to support growth initiatives and capital deployment 1) Peer group consists of U.S. banks with assets between $10
billion and $25 billion (63 institutions). Top quartile as of 2Q 2020 as per S&P Market Intelligence. 10

Strong Operating Metrics During Pandemic $9,052 $9,405 $9,345 $2,551 $11,896 Loan Portfolio ($ in
millions) Loan Originations($ in millions) Core Deposits($ in millions) $8,887 $10,086 $10,531 $4,117 $14,648 $887 $962 $1,053 Net Interest Income($ in millions) Pre-tax Pre-provision Income($ in millions) Net Income($ in
millions) 11

Results of Operations
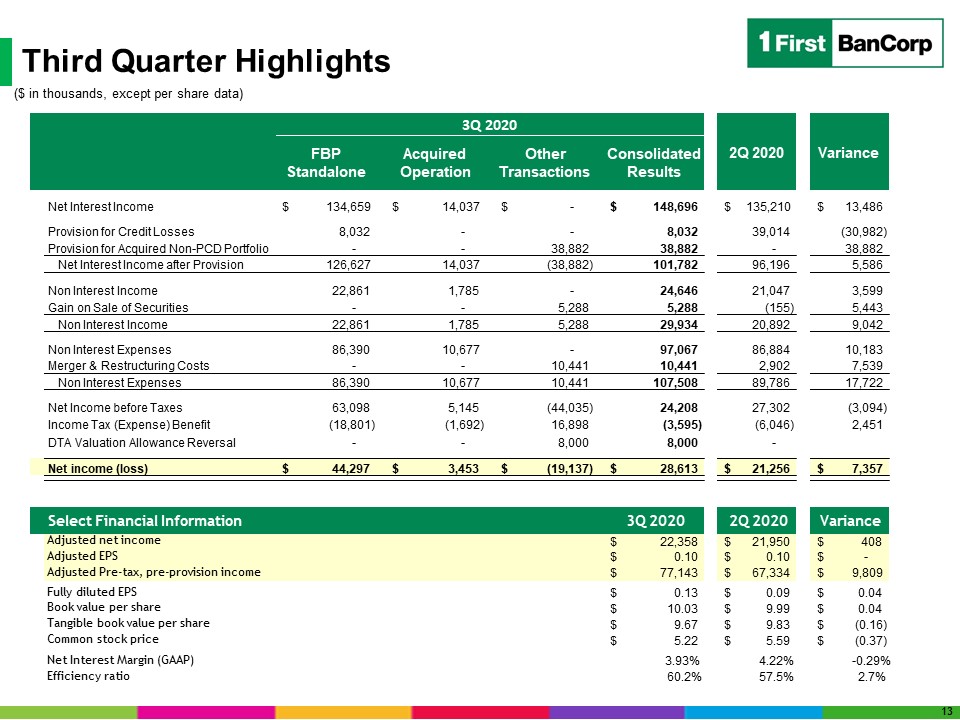
Third Quarter Highlights ($ in thousands, except per share
data) 13 FBP Standalone Acquired Operation Other Transactions Consolidated Results Net Interest Income 134,659 $ 14,037 $ - $ 148,696 $ 135,210 $
13,486 $ Provision for Credit Losses 8,032 - - 8,032 39,014 (30,982) Provision for Acquired Non-PCD Portfolio - - 38,882 38,882 - 38,882 Net
Interest Income after Provision 126,627 14,037 (38,882) 101,782 96,196 5,586 Non Interest Income 22,861 1,785 - 24,646 21,047 3,599 Gain on Sale of
Securities - - 5,288 5,288 (155) 5,443 Non Interest Income 22,861 1,785 5,288 29,934 20,892 9,042 Non Interest Expenses 86,390 10,677 -
97,067 86,884 10,183 Merger & Restructuring Costs - - 10,441 10,441 2,902 7,539 Non Interest Expenses 86,390 10,677 10,441 107,508 89,786
17,722 Net Income before Taxes 63,098 5,145 (44,035) 24,208 27,302 (3,094) Income Tax (Expense) Benefit (18,801) (1,692) 16,898 (3,595) (6,046) 2,451
DTA Valuation Allowance Reversal - - 8,000 8,000 - Net income (loss) 44,297 $ 3,453 $ (19,137) $ 28,613 $ 21,256 $ 7,357 $ Select Financial Information 3Q 2020 2Q
2020 Variance Adjusted net income 22,358 $ 21,950 $ 408 $ Adjusted EPS 0.10 $ 0.10 $ - $ Adjusted Pre-tax, pre-provision income 77,143 $ 67,334 $ 9,809 $ Fully diluted EPS 0.13 $
0.09 $ 0.04 $ Book value per share 10.03 $ 9.99 $ 0.04 $ Tangible book value per share 9.67 $ 9.83 $ (0.16) $ Common stock price 5.22 $ 5.59 $ (0.37) $ Net Interest Margin
(GAAP) 3.93% 4.22% -0.29% Efficiency ratio 60.2% 57.5% 2.7% 3Q 2020 2Q 2020 Variance
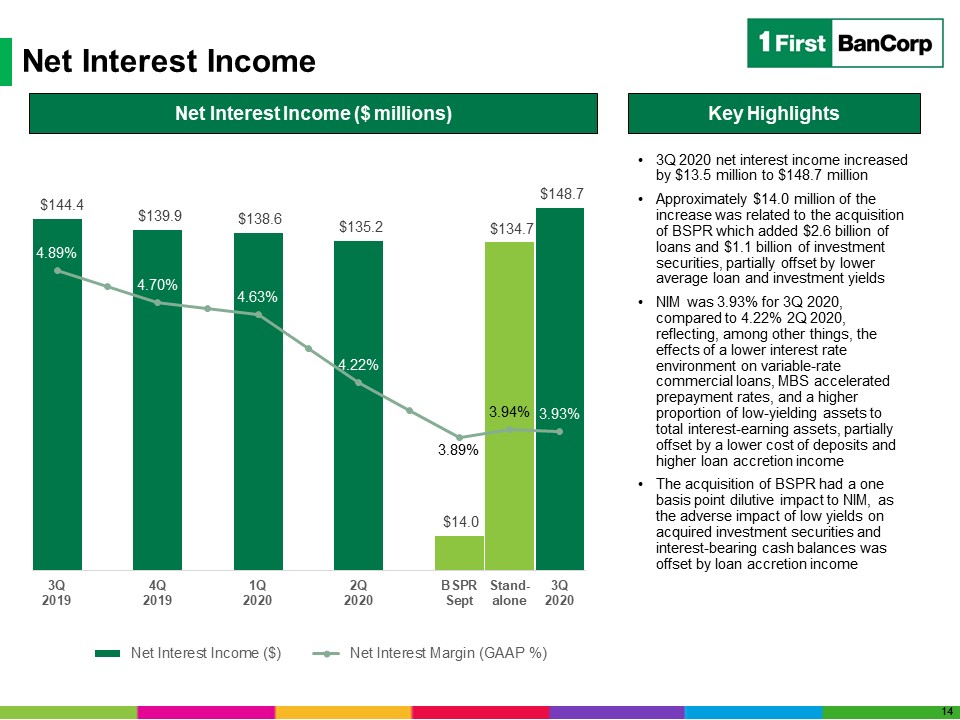
Net Interest Income Key Highlights Net Interest Income ($ millions) 3Q 2020 net interest income
increased by $13.5 million to $148.7 millionApproximately $14.0 million of the increase was related to the acquisition of BSPR which added $2.6 billion of loans and $1.1 billion of investment securities, partially offset by lower average loan
and investment yieldsNIM was 3.93% for 3Q 2020, compared to 4.22% 2Q 2020, reflecting, among other things, the effects of a lower interest rate environment on variable-rate commercial loans, MBS accelerated prepayment rates, and a higher
proportion of low-yielding assets to total interest-earning assets, partially offset by a lower cost of deposits and higher loan accretion income The acquisition of BSPR had a one basis point dilutive impact to NIM, as the adverse impact of
low yields on acquired investment securities and interest-bearing cash balances was offset by loan accretion income 14

Non-Interest Income Non-interest income for 3Q 2020 amounted to $29.9 million, compared to $20.9
million for 2Q 2020. The $9.0 million increase was primarily due to: A $5.3 million gain on sales of approximately $116.6 million of available-for-sale U.S. agencies MBS and $803.3 million of available-for-sale U.S. Treasury NotesA $3.4
million increase in revenues from mortgage banking activities, driven by a $4.5 million increase in realized gains on sales of residential mortgage loans in the secondary marketA $2.8 million increase in transactional fee income from credit
and debit cards activity, primarily reflecting higher volume associated with the gradual reopening of businesses and resumption of economic activityA $1.4 million increase in service charges on deposits, including an increase of $1.1 million
related to deposit accounts acquired from BSPRPartially offset by the $5.0 million benefit recorded in the second quarter of 2020 resulting from the final settlement of the Corporation’s business interruption insurance claim related to lost
profits caused by Hurricanes Irma and Maria in 2017 Non-Interest Income ($ millions) $20.9 $24.4 $30.2 $28.0 $21.4 Key Highlights $2.0 $29.9 15

Non-Interest Expense Non-interest expenses amounted to $107.5 million in 3Q 2020, an increase of $17.7
million from $89.8 million in 2Q 2020Merger and restructuring costs associated with the acquisition of BSPR of $10.4 million for 3Q 2020, compared to $2.9 million for 2Q 2020 COVID-19 pandemic-related expenses of $1.0 million for 3Q 2020,
compared to $3.0 million for 2Q 2020 Credit Related expenses (OREO & Collections, Appraisals and Other) amounted to $2.3 million in 3Q 2020 compared to $2.2 million in 2Q 2020On a non-GAAP basis, adjusted non-interest expenses, excluding
the effect of the items mentioned above, amounted to $93.8 million for 3Q 2020, compared to $81.7 million for 2Q 2020. The $12.1 million increase in adjusted non-interest expenses reflects a $10.7 million increase resulting from the
acquisition of BSPR and volume-related expense increases related to the reopening of business activities Non-Interest Expense ($ millions) $107.5 $92.2 $89.8 $92.8 $102.3 Key Highlights 16 $96.8

Significant ACL Levels Evolution of ACL ($ in millions) & ACL on Loans to Total Loans (%) The
allowance for credit losses (ACL) on loans increased by $65 million during 3Q 2020 to $385 million$66 million of this increase was related to the CECL impact of the BSPR acquisition. $29 million impact was related to the gross-up of the
credit discount on the purchase credit deteriorated (PCD) loans, while $37 million was related to the non-PCD day-1 CECL impactThe ratio of the ACL for loans and finance leases to total loans held for investment was 3.25% as of September 30,
2020, compared to 3.41% as of June 30, 2020. Excluding PPP loans the ACL to loans was 3.38%The ratio of the allowance to NPLs held for investment was 191.2% as of 3Q 2020 compared to 156.5% as of 2Q 2020 Key Highlights 17
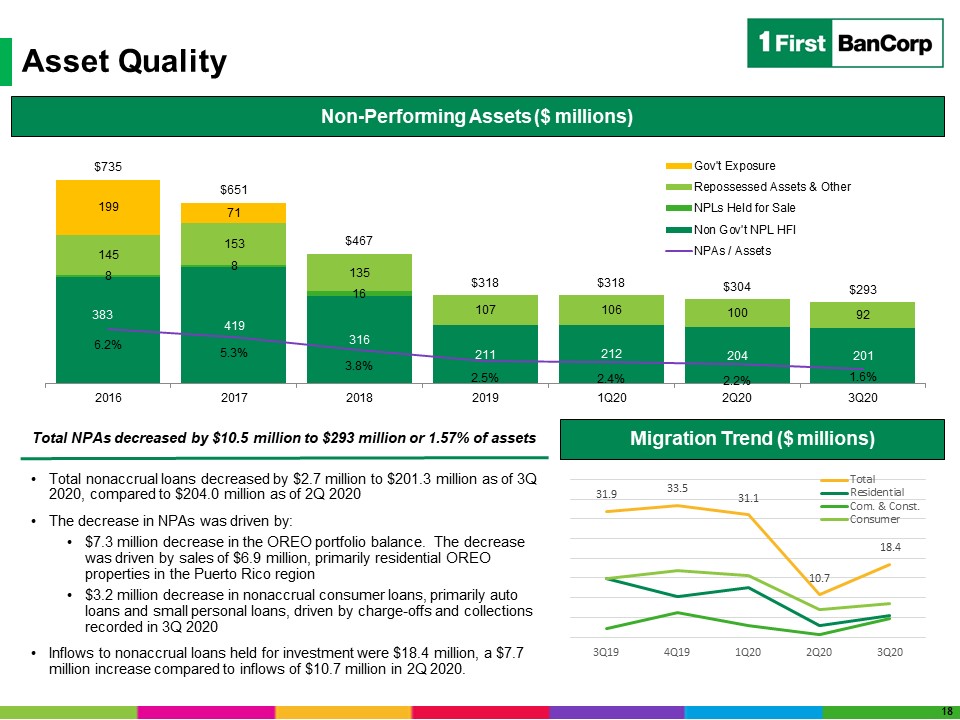
Asset Quality Non-Performing Assets ($ millions) Total nonaccrual loans decreased by $2.7 million to
$201.3 million as of 3Q 2020, compared to $204.0 million as of 2Q 2020The decrease in NPAs was driven by:$7.3 million decrease in the OREO portfolio balance. The decrease was driven by sales of $6.9 million, primarily residential OREO
properties in the Puerto Rico region$3.2 million decrease in nonaccrual consumer loans, primarily auto loans and small personal loans, driven by charge-offs and collections recorded in 3Q 2020Inflows to nonaccrual loans held for investment
were $18.4 million, a $7.7 million increase compared to inflows of $10.7 million in 2Q 2020. Total NPAs decreased by $10.5 million to $293 million or 1.57% of assets Migration Trend ($ millions) 18
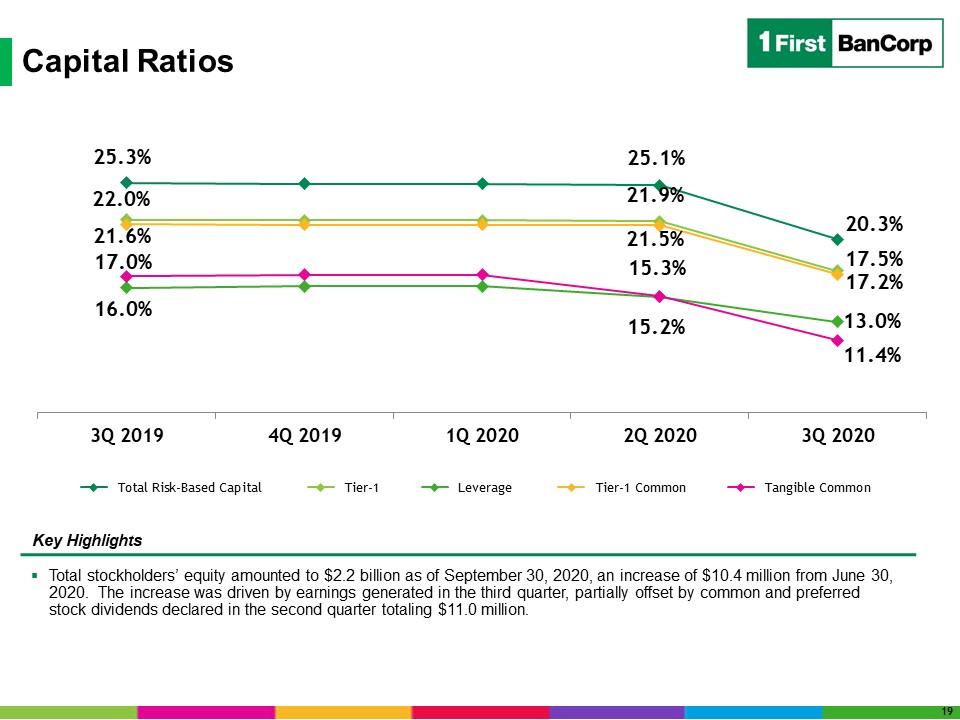
Capital Ratios Total stockholders’ equity amounted to $2.2 billion as of September 30, 2020, an
increase of $10.4 million from June 30, 2020. The increase was driven by earnings generated in the third quarter, partially offset by common and preferred stock dividends declared in the second quarter totaling $11.0 million. Key
Highlights 19

Exhibits

Third Quarter 2020 Highlights: PR Government Exposure ($ in millions) As of September 30, 2020,
the Corporation had $400.3 million of direct exposure to the Puerto Rico Government, its municipalities and public corporations, compared to $203.5 million as of June 30, 202084% of direct government exposure is to municipalities, which are
supported by assigned property tax revenuesAs of September 30, 2020, the Corporation had $1,702.9 million of public sector deposits in Puerto Rico, compared to $920.1 million as of June 30, 2020Approximately 25% is from municipalities in
Puerto Rico and 75% is from public corporations and the central government and agencies in Puerto Rico 21

($ in 000) Third Quarter 2020 Highlights: NPL Migration 22

Use of Non-GAAP Financial Measures Basis of PresentationUse of Non-GAAP Financial Measures This
presentation contains non-GAAP financial measures. Non-GAAP financial measures are used when management believes they will be helpful to an understanding of the Corporation’s results of operations or financial position. Where non-GAAP
financial measures are used, the comparable GAAP financial measure, as well as the reconciliation of the non-GAAP financial measure to the comparable GAAP financial measure, can be found in the text or in the attached tables to this earnings
release. Any analysis of these non-GAAP financial measures should be used only in conjunction with results presented in accordance with GAAP. Tangible Common Equity Ratio and Tangible Book Value per Common Share The tangible common equity
ratio and tangible book value per common share are non-GAAP financial measures generally used by the financial community to evaluate capital adequacy. Tangible common equity is total equity less preferred equity, goodwill, core deposit
intangibles, and other intangibles, such as the purchased credit card relationship intangible and the insurance customer relationship intangible. Tangible assets are total assets less goodwill, core deposit intangibles, and other intangibles,
such as the purchased credit card relationship intangible and the insurance customer relationship intangible. Management and many stock analysts use the tangible common equity ratio and tangible book value per common share in conjunction with
more traditional bank capital ratios to compare the capital adequacy of banking organizations with significant amounts of goodwill or other intangible assets, typically stemming from the use of the purchase method of accounting for mergers
and acquisitions. Accordingly, the Corporation believes that disclosures of these financial measures may be useful also to investors. Neither tangible common equity nor tangible assets, or the related measures should be considered in
isolation or as a substitute for stockholders’ equity, total assets, or any other measure calculated in accordance with GAAP. Moreover, the manner in which the Corporation calculates its tangible common equity, tangible assets, and any other
related measures may differ from that of other companies reporting measures with similar names. 23
Use of Non-GAAP Financial Measures Basis of PresentationUse of Non-GAAP Financial Measures This
presentation contains non-GAAP financial measures. Non-GAAP financial measures are used when management believes they will be helpful to an understanding of the Corporation’s results of operations or financial position. Where non-GAAP
financial measures are used, the comparable GAAP financial measure, as well as the reconciliation of the non-GAAP financial measure to the comparable GAAP financial measure, can be found in the text or in the attached tables to this earnings
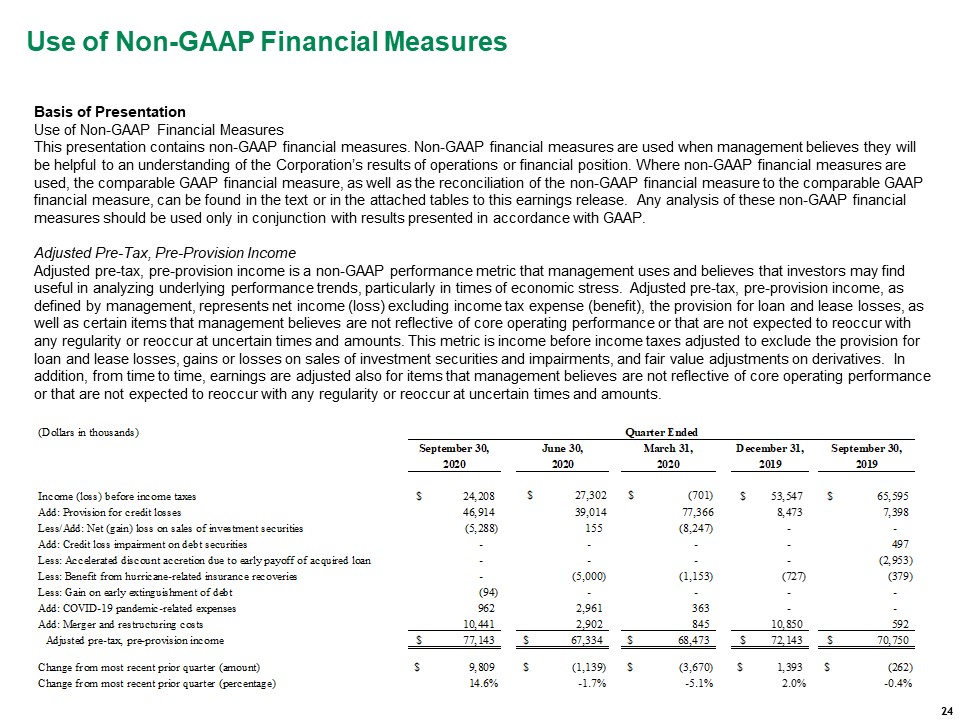
release. Any analysis of these non-GAAP financial measures should be used only in conjunction with results presented in accordance with GAAP. Adjusted Pre-Tax, Pre-Provision IncomeAdjusted pre-tax, pre-provision income is a non-GAAP
performance metric that management uses and believes that investors may find useful in analyzing underlying performance trends, particularly in times of economic stress. Adjusted pre-tax, pre-provision income, as defined by management,
represents net income (loss) excluding income tax expense (benefit), the provision for loan and lease losses, as well as certain items that management believes are not reflective of core operating performance or that are not expected to
reoccur with any regularity or reoccur at uncertain times and amounts. This metric is income before income taxes adjusted to exclude the provision for loan and lease losses, gains or losses on sales of investment securities and impairments,
and fair value adjustments on derivatives. In addition, from time to time, earnings are adjusted also for items that management believes are not reflective of core operating performance or that are not expected to reoccur with any regularity
or reoccur at uncertain times and amounts. 24
Use of Non-GAAP Financial Measures Basis of PresentationUse of Non-GAAP Financial Measures This
presentation contains non-GAAP financial measures. Non-GAAP financial measures are used when management believes they will be helpful to an understanding of the Corporation’s results of operations or financial position. Where non-GAAP
financial measures are used, the comparable GAAP financial measure, as well as the reconciliation of the non-GAAP financial measure to the comparable GAAP financial measure, can be found in the text or in the attached tables to this earnings
release. Any analysis of these non-GAAP financial measures should be used only in conjunction with results presented in accordance with GAAP. The financial results include the following significant items that management believes are not
reflective of core operating performance, are not expected to reoccur with any regularity or may reoccur at uncertain times and in uncertain amounts (the “Special Items”):Quarter ended September 30, 2020Merger and restructuring costs of $10.4
million ($6.5 million after-tax) in connection with the acquisition of BSPR and related restructuring initiatives. Merger and restructuring costs in the third quarter of 2020 primarily included consulting, legal, system conversions and other
integration related efforts.An $8.0 million tax benefit related to a partial reversal of the deferred tax asset valuation allowance.A $5.3 million aggregate gain on sales of approximately $116.6 million of U.S. agencies MBS and $803.3 million
of U.S. Treasury Notes executed in the latter part of September. The gain on tax-exempt securities or realized at the tax-exempt international banking entity subsidiary level had no effect in the income tax expense recorded in the third
quarter of 2020. Costs of $1.0 million ($0.6 million after-tax) related to the COVID-19 pandemic response efforts, primarily costs related to additional cleaning, safety materials, and security matters. 25

Use of Non-GAAP Financial Measures Basis of PresentationUse of Non-GAAP Financial Measures This
presentation contains non-GAAP financial measures. Non-GAAP financial measures are used when management believes they will be helpful to an understanding of the Corporation’s results of operations or financial position. Where non-GAAP
financial measures are used, the comparable GAAP financial measure, as well as the reconciliation of the non-GAAP financial measure to the comparable GAAP financial measure, can be found in the text or in the attached tables to this earnings
release. Any analysis of these non-GAAP financial measures should be used only in conjunction with results presented in accordance with GAAP. The financial results include the following significant items that management believes are not
reflective of core operating performance, are not expected to reoccur with any regularity or may reoccur at uncertain times and in uncertain amounts (the “Special Items”):Quarter ended June 30, 2020A $5.0 million ($3.1 million after-tax)
benefit resulting from the final settlement of the Corporation’s business interruption insurance claim related to lost profits caused by Hurricanes Irma and Maria in 2017.Merger and restructuring costs of $2.9 million ($1.8 million after-tax)
in connection with the previously announced stock purchase agreement with Santander Holdings USA, Inc. relating to the Corporation’s acquisition of BSPR and related restructuring initiatives. Merger and restructuring costs in the second
quarter of 2020 primarily included consulting, legal, and other pre-conversion related efforts associated with the pending acquisition of BSPR.Costs of $3.0 million ($1.9 million after-tax) related to the COVID-19 pandemic response efforts,
including approximately $1.7 million in bonuses paid to branch personnel and other essential employees for working during the pandemic, as well as other employee-related expenses such as expenses for the administration of COVID-19 tests and
purchases of personal protective equipment.A $0.2 million loss realized on sales of U.S. agencies MBS. The loss, realized at the tax-exempt international banking entity subsidiary, had no effect on the income tax expense recorded in the
second quarter of 2020.Quarter ended September 30, 2019A $3.0 million ($1.8 million after-tax) positive effect in earnings related to the acceleration of the discount accretion from the payoff of an acquired commercial mortgage loan. A $0.4
million ($0.2 million after-tax) benefit resulting from hurricane-related insurance recoveries related to repairs and maintenance costs incurred on facilities in the U.S. Virgin Islands. 26
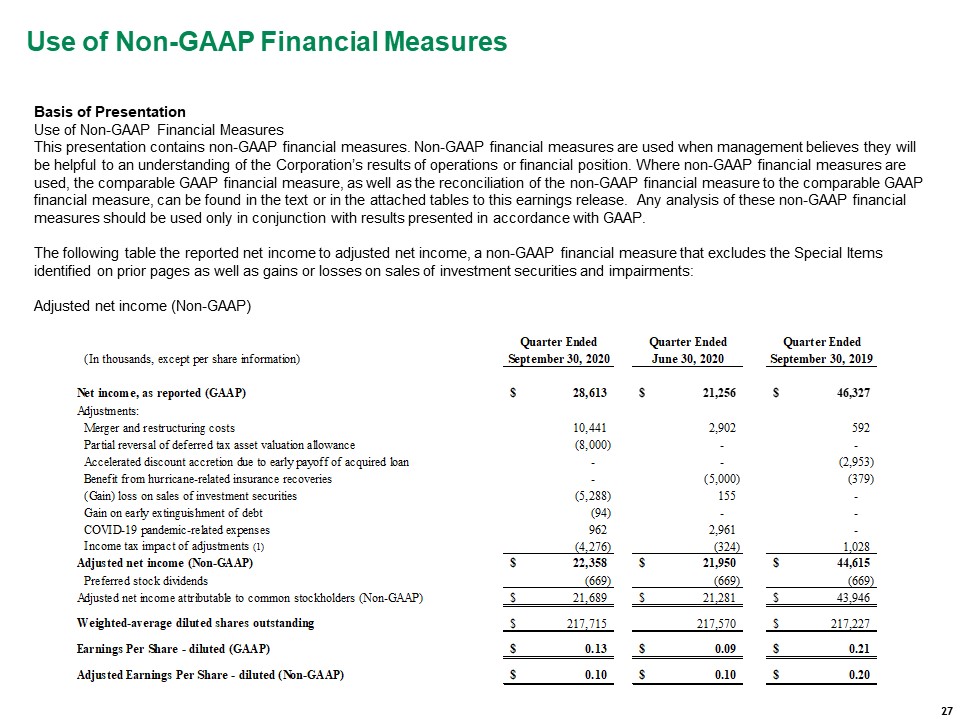
Use of Non-GAAP Financial Measures Basis of PresentationUse of Non-GAAP Financial Measures This
presentation contains non-GAAP financial measures. Non-GAAP financial measures are used when management believes they will be helpful to an understanding of the Corporation’s results of operations or financial position. Where non-GAAP
financial measures are used, the comparable GAAP financial measure, as well as the reconciliation of the non-GAAP financial measure to the comparable GAAP financial measure, can be found in the text or in the attached tables to this earnings
release. Any analysis of these non-GAAP financial measures should be used only in conjunction with results presented in accordance with GAAP. The following table the reported net income to adjusted net income, a non-GAAP financial measure
that excludes the Special Items identified on prior pages as well as gains or losses on sales of investment securities and impairments:Adjusted net income (Non-GAAP) 27