Attached files
| file | filename |
|---|---|
| EX-99.1 - EX-99.1 - Western Union CO | wu-20201029xex99d1.htm |
| 8-K - 8-K - Western Union CO | wu-20201029x8k.htm |
Exhibit 99.2
| Third Quarter 2020 1 Earnings Webcast and Conference Call October 29, 2020 Exhibit 99.2 |

| 2 Brendan Metrano Vice President of Investor Relations |

| This presentation contains certain statements that are forward-looking within the meaning of the Private Securities Litigation Reform Act of 1995. These statements are not guarantees of future performance and involve certain risks, uncertainties, and assumptions that are difficult to predict. Actual outcomes and results may differ materially from those expressed in, or implied by, our forward-looking statements. Words such as "expects," "intends," "targets," "anticipates," "believes," "estimates," "guides," "provides guidance," "provides outlook," and other similar expressions or future or conditional verbs such as "may," "will," "should," "would," "could," and "might" are intended to identify such forward-looking statements. Readers of this presentation of The Western Union Company (the "Company," "Western Union," "we," "our," or "us") should not rely solely on the forward-looking statements and should consider all uncertainties and risks discussed in the Risk Factors section and throughout the Annual Report on Form 10-K for the year ended December 31, 2019. The statements are only as of the date they are made, and the Company undertakes no obligation to update any forward-looking statement. Possible events or factors that could cause results or performance to differ materially from those expressed in our forward-looking statements include the following: (i) events related to our business and industry, such as: changes in general economic conditions and economic conditions in the regions and industries in which we operate, including global economic downturns and trade disruptions, or significantly slower growth or declines in the money transfer, payment service, and other markets in which we operate, including downturns or declines related to interruptions in migration patterns or other events, such as public health emergencies, epidemics, or pandemics such as COVID-19, civil unrest, war, terrorism, or natural disasters, or non-performance by our banks, lenders, insurers, or other financial services providers; failure to compete effectively in the money transfer and payment service industry, including among other things, with respect to price, with global and niche or corridor money transfer providers, banks and other money transfer and payment service providers, including electronic, mobile and internet-based services, card associations, and card-based payment providers, and with digital currencies and related protocols, and other innovations in technology and business models; political conditions and related actions, including trade restrictions and government sanctions, in the United States and abroad, which may adversely affect our business and economic conditions as a whole, including interruptions of United States or other government relations with countries in which we have or are implementing significant business relationships with agents or clients; deterioration in customer confidence in our business, or in money transfer and payment service providers generally; our ability to adopt new technology and develop and gain market acceptance of new and enhanced services in response to changing industry and consumer needs or trends; changes in, and failure to manage effectively, exposure to foreign exchange rates, including the impact of the regulation of foreign exchange spreads on money transfers and payment transactions; any material breach of security, including cybersecurity, or safeguards of or interruptions in any of our systems or those of our vendors or other third parties; cessation of or defects in various services provided to us by third-party vendors; mergers, acquisitions, and the integration of acquired businesses and technologies into our Company, divestitures, and the failure to realize anticipated financial benefits from these transactions, and events requiring us to write down our goodwill; decisions to change our business mix; our ability to realize the anticipated benefits from restructuring-related initiatives, which may include decisions to downsize or to transition operating activities from one location to another, and to minimize any disruptions in our workforce that may result from those initiatives; failure to manage credit and fraud risks presented by our agents, clients, and consumers; failure to maintain our agent network and business relationships under terms consistent with or more advantageous to us than those currently in place, including due to increased costs or loss of business as a result of increased compliance requirements or difficulty for us, our agents, or their subagents in establishing or maintaining relationships with banks needed to conduct our services; changes in tax laws or their interpretation, any subsequent regulation, and potential related state income tax impacts, and unfavorable resolution of tax contingencies; adverse rating actions by credit rating agencies; our ability to protect our brands and our other intellectual property rights and to defend ourselves against potential intellectual property infringement claims; our ability to attract and retain qualified key employees and to manage our workforce successfully; material changes in the market value or liquidity of securities that we hold; restrictions imposed by our debt obligations; (ii) events related to our regulatory and litigation environment, such as: liabilities or loss of business resulting from a failure by us, our agents, or their subagents to comply with laws and regulations and regulatory or judicial interpretations thereof, including laws and regulations designed to protect consumers, or detect and prevent money laundering, terrorist financing, fraud, and other illicit activity; increased costs or loss of business due to regulatory initiatives and changes in laws, regulations and industry practices and standards, including changes in interpretations, in the United States and abroad, affecting us, our agents, or their subagents, or the banks with which we or our agents maintain bank accounts needed to provide our services, including related to anti-money laundering regulations, anti-fraud measures, our licensing arrangements, customer due diligence, agent and subagent due diligence, registration and monitoring requirements, consumer protection requirements, remittances, and immigration; liabilities, increased costs or loss of business and unanticipated developments resulting from governmental investigations and consent agreements with or enforcement actions by regulators; liabilities resulting from litigation, including class-action lawsuits and similar matters, and regulatory enforcement actions, including costs, expenses, settlements, and judgments; failure to comply with regulations and evolving industry standards regarding consumer privacy, data use, and transfer of personal data between jurisdictions and information security with respect to the General Data Protection Regulation in the European Union and the California Consumer Privacy Act; failure to comply with the Dodd-Frank Wall Street Reform and Consumer Protection Act, as well as regulations issued pursuant to it and the actions of the Consumer Financial Protection Bureau and similar legislation and regulations enacted by other governmental authorities in the United States and abroad related to consumer protection and derivative transactions; effects of unclaimed property laws or their interpretation or the enforcement thereof; failure to maintain sufficient amounts or types of regulatory capital or other restrictions on the use of our working capital to meet the changing requirements of our regulators worldwide; changes in accounting standards, rules and interpretations, or industry standards affecting our business; and (iii) other events such as: catastrophic events; and management’s ability to identify and manage these and other risks. Safe Harbor 3 |

| Hikmet Ersek Chief Executive Officer 4 |

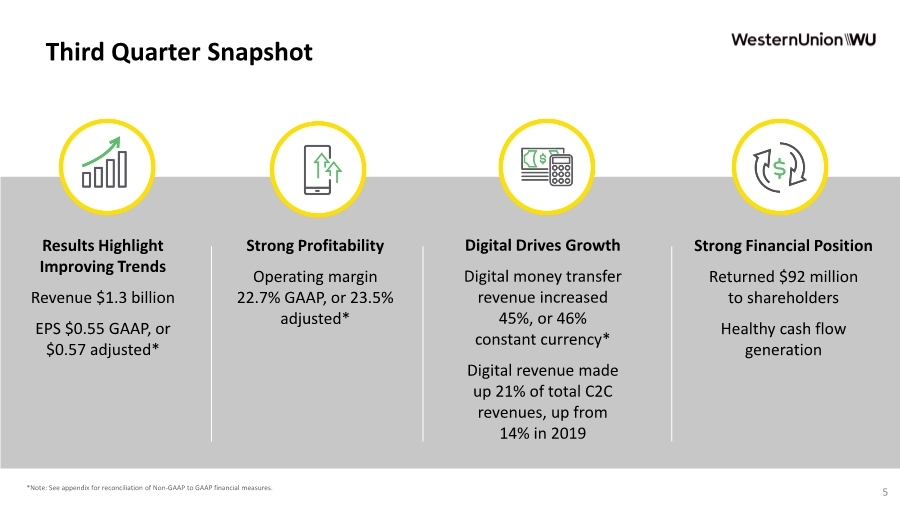
| 5 Strong Profitability Operating margin 22.7% GAAP, or 23.5% adjusted* Digital Drives Growth Digital money transfer revenue increased 45%, or 46% constant currency* Digital revenue made up 21% of total C2C revenues, up from 14% in 2019 Strong Financial Position Returned $92 million to shareholders Healthy cash flow generation Third Quarter Snapshot *Note: See appendix for reconciliation of Non-GAAP to GAAP financial measures. Results Highlight Improving Trends Revenue $1.3 billion EPS $0.55 GAAP, or $0.57 adjusted* |
| 6 15% 45% 47% Q1 2020 Q2 2020 Q3 2020 WU.com Average Monthly Active Customer Growth* Source: Western Union business research Source: SensorTower App Install Market Share Report *A monthly active customer is defined as a unique westernunion.com customer that transacted in the month. A Market Leader: westernunion.com Western Union Peer 1 Peer 2 Peer 3 Peer 4 Peer 5 Peer 6 Peer 7 Q3 2020 Total App Downloads (In millions of downloads) Customers turn to westernunion.com in their time of need |

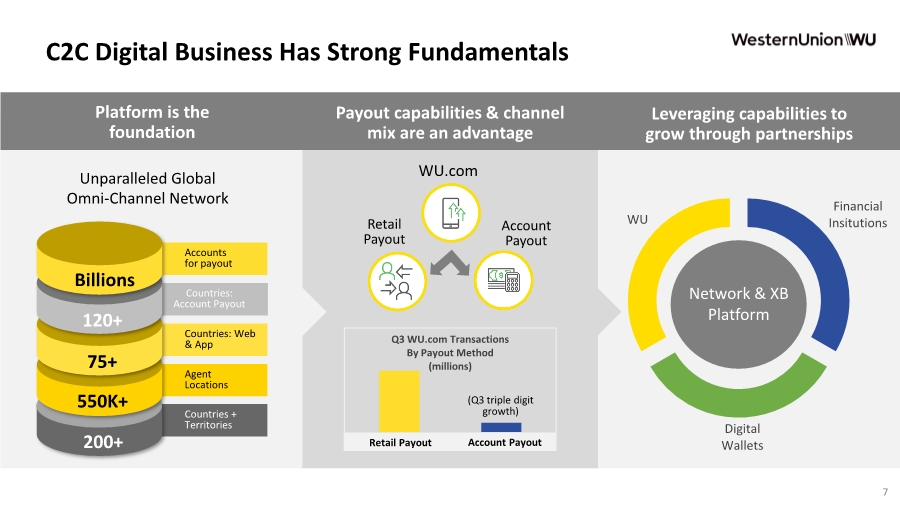
| 7 C2C Digital Business Has Strong Fundamentals Countries + Territories Agent Locations Countries: Web & App Countries: Account Payout Accounts for payout 550K+ 75+ 120+ Billions 200+ Unparalleled Global Omni-Channel Network WU.com Payout capabilities & channel mix are an advantage Leveraging capabilities to grow through partnerships Platform is the foundation Q3 WU.com Transactions By Payout Method (millions) Retail Payout Account Payout Financial Insitutions Digital Wallets WU Account Payout Retail Payout (Q3 triple digit growth) Network & XB Platform |
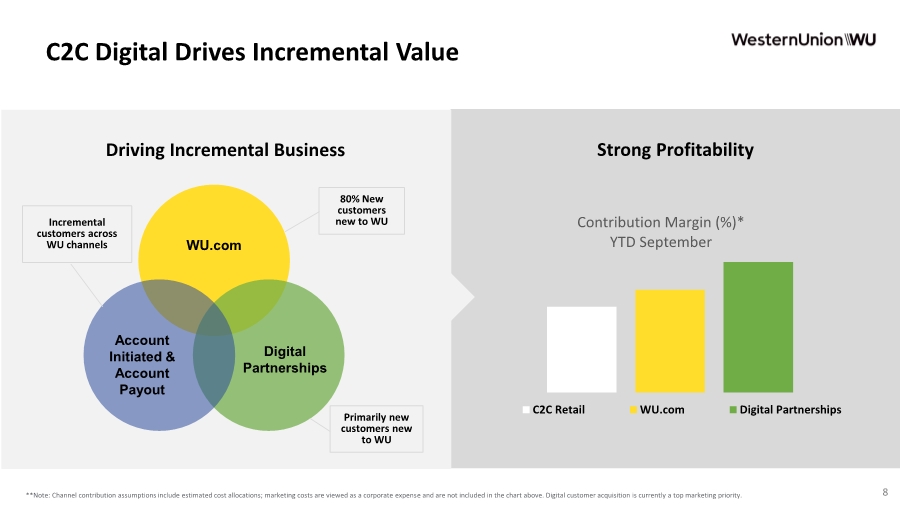
| 8 C2C Digital Drives Incremental Value Driving Incremental Business Contribution Margin (%)* YTD September C2C Retail WU.com Digital Partnerships Strong Profitability Primarily new customers new to WU 80% New customers new to WU Incremental customers across WU channels Digital Partnerships Account Initiated & Account Payout WU.com **Note: Channel contribution assumptions include estimated cost allocations; marketing costs are viewed as a corporate expense and are not included in the chart above. Digital customer acquisition is currently a top marketing priority. |
| 9 2020 Strategic Agenda Our Strategy is focused on serving our customers, enhancing our competitive position, and supporting financial strength Driving Digital Growth Enhancing the Global Network Optimizing the Organization • Over $230 million in digital revenue during Q3 • Digital business provides incremental growth and attractive economics • Opening our platform to new use cases • Continue to improve the cost, coverage, and quality of our network • Best-in-class compliance program • A leaner, more agile organization • On track to deliver at least $50 million in annual cost savings in 2020 and $150 million in cost savings by 2022 |

| Raj Agrawal Chief Financial Officer 10 |

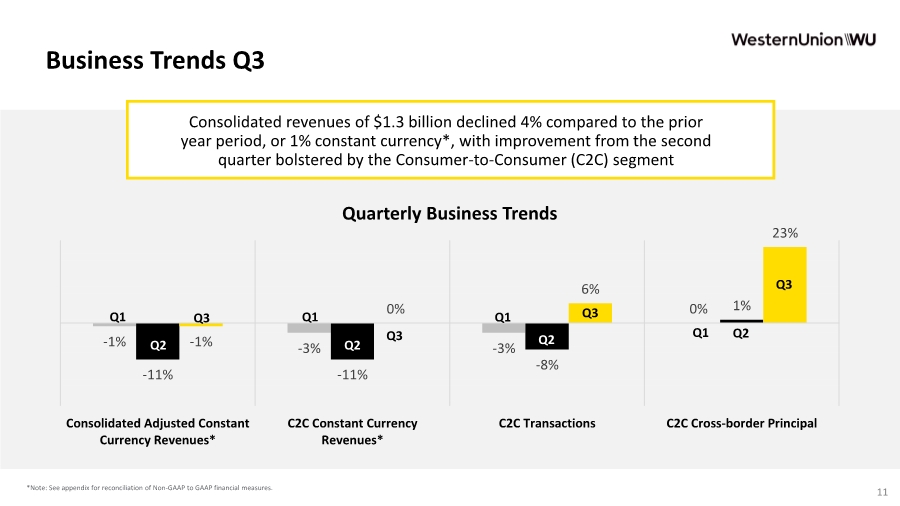
| 11 *Note: See appendix for reconciliation of Non-GAAP to GAAP financial measures. -1% -3% -3% 0% -11% -11% -8% 1% -1% 0% 6% 23% Consolidated Adjusted Constant Currency Revenues* C2C Constant Currency Revenues* C2C Transactions C2C Cross-border Principal Quarterly Business Trends Q2 Q3 Q1 Q1 Q1 Q1 Consolidated revenues of $1.3 billion declined 4% compared to the prior year period, or 1% constant currency*, with improvement from the second quarter bolstered by the Consumer-to-Consumer (C2C) segment Business Trends Q3 Q2 Q3 Q3 Q3 Q2 Q2 |
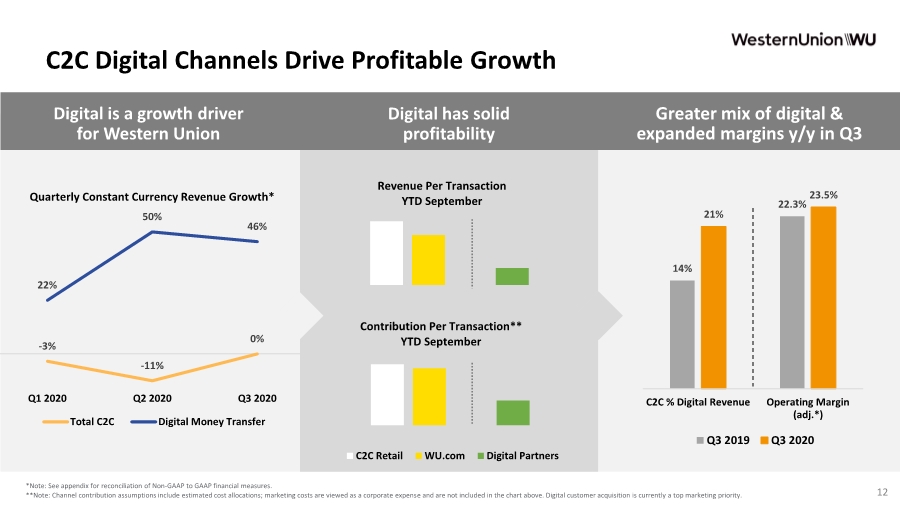
| 12 14% 22.3% 21% 23.5% C2C % Digital Revenue Operating Margin (adj.*) Q3 2019 Q3 2020 Revenue Per Transaction YTD September Contribution Per Transaction** YTD September C2C Retail WU.com Digital Partners C2C Digital Channels Drive Profitable Growth Digital is a growth driver for Western Union Greater mix of digital & expanded margins y/y in Q3 Digital has solid profitability -3% -11% 0% 22% 50% 46% Q1 2020 Q2 2020 Q3 2020 Quarterly Constant Currency Revenue Growth* Total C2C Digital Money Transfer **Note: Channel contribution assumptions include estimated cost allocations; marketing costs are viewed as a corporate expense and are not included in the chart above. Digital customer acquisition is currently a top marketing priority. *Note: See appendix for reconciliation of Non-GAAP to GAAP financial measures. |
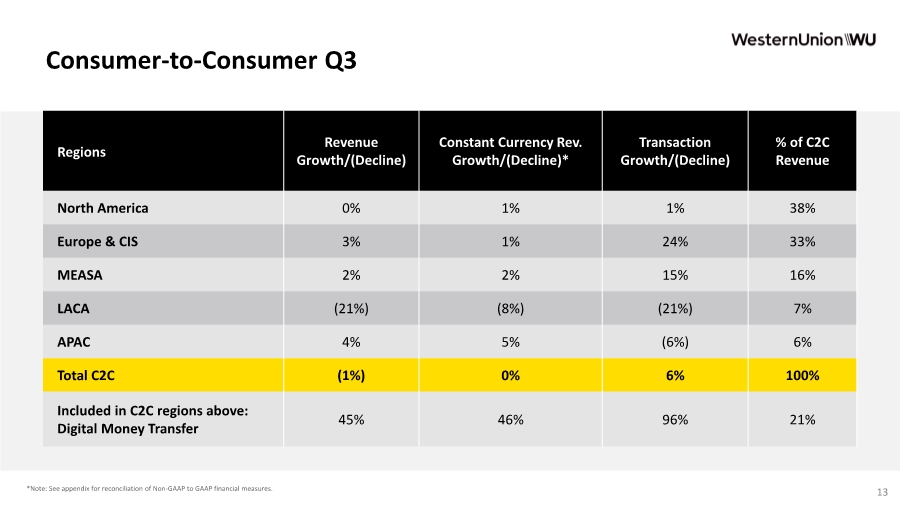
| 13 Consumer-to-Consumer Q3 *Note: See appendix for reconciliation of Non-GAAP to GAAP financial measures. Regions Revenue Growth/(Decline) Constant Currency Rev. Growth/(Decline)* Transaction Growth/(Decline) % of C2C Revenue North America 0% 1% 1% 38% Europe & CIS 3% 1% 24% 33% MEASA 2% 2% 15% 16% LACA (21%) (8%) (21%) 7% APAC 4% 5% (6%) 6% Total C2C (1%) 0% 6% 100% Included in C2C regions above: Digital Money Transfer 45% 46% 96% 21% |
| Business Solutions 14 • 7% of Company revenue • Revenue decreased 11%, or 13% constant currency* Other (primarily retail bill payments businesses in Argentina & the U.S. as well as money orders) • 5% of Company revenue • Revenue decreased 33% *Note: See appendix for reconciliation of Non-GAAP to GAAP financial measures. Business Solutions and Other Q3 |

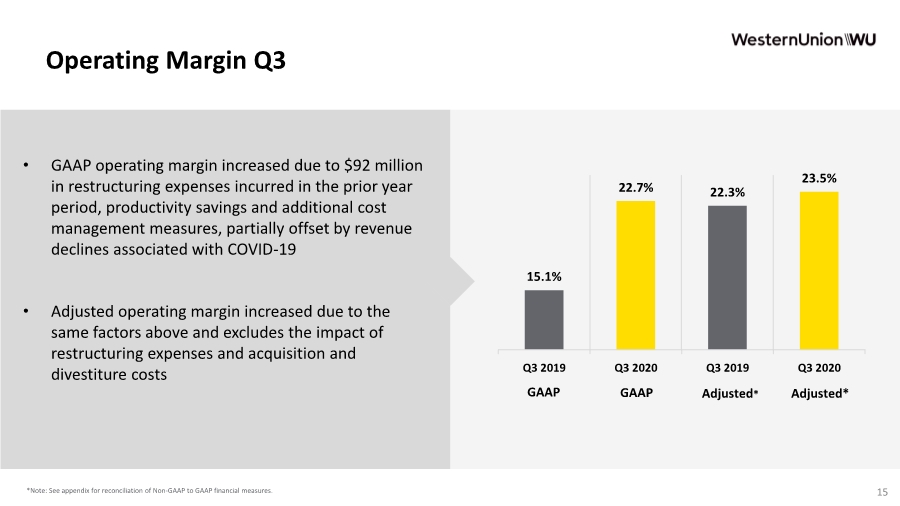
| 15 • GAAP operating margin increased due to $92 million in restructuring expenses incurred in the prior year period, productivity savings and additional cost management measures, partially offset by revenue declines associated with COVID-19 • Adjusted operating margin increased due to the same factors above and excludes the impact of restructuring expenses and acquisition and divestiture costs *Note: See appendix for reconciliation of Non-GAAP to GAAP financial measures. Operating Margin Q3 15.1% 22.7% 22.3% 23.5% Q3 2019 Q3 2020 Q3 2019 Q3 2020 Adjusted* GAAP Adjusted* GAAP |
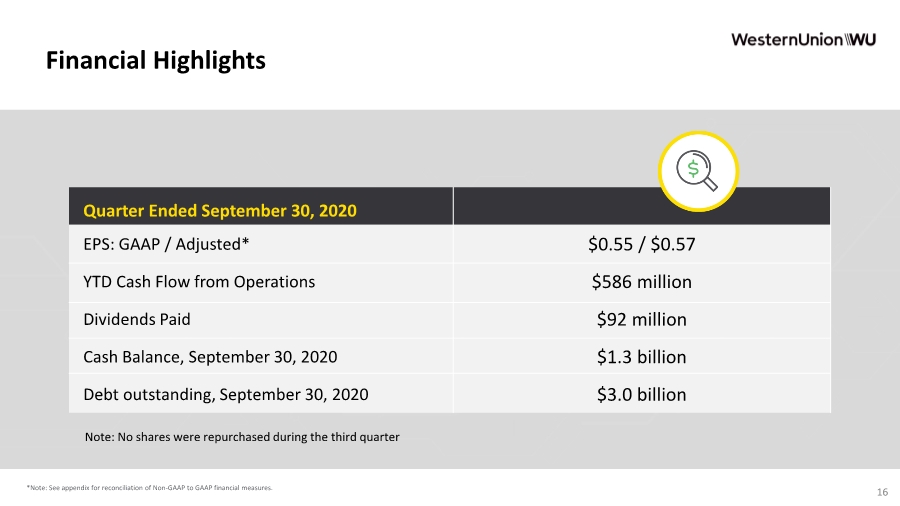
| 16 Financial Highlights Quarter Ended September 30, 2020 EPS: GAAP / Adjusted* $0.55 / $0.57 YTD Cash Flow from Operations $586 million Dividends Paid $92 million Cash Balance, September 30, 2020 $1.3 billion Debt outstanding, September 30, 2020 $3.0 billion *Note: See appendix for reconciliation of Non-GAAP to GAAP financial measures. Note: No shares were repurchased during the third quarter |
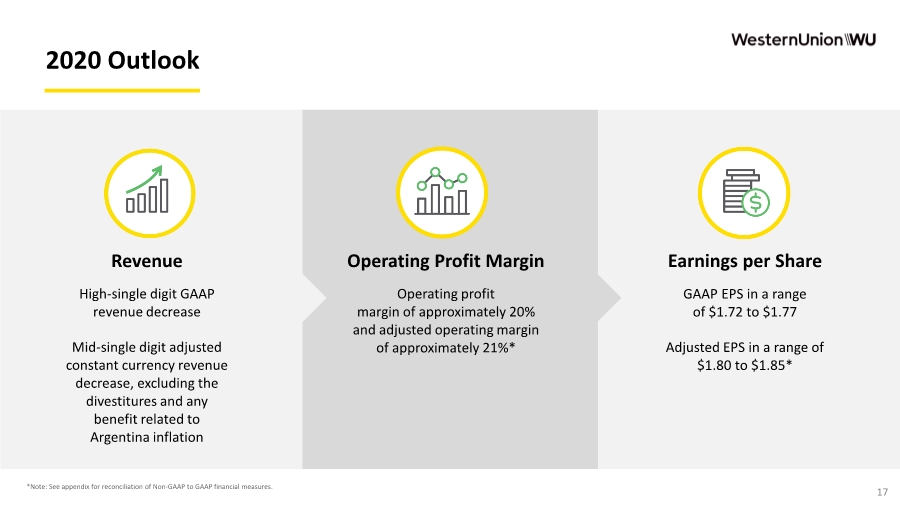
| Revenue High-single digit GAAP revenue decrease Mid-single digit adjusted constant currency revenue decrease, excluding the divestitures and any benefit related to Argentina inflation Operating Profit Margin Operating profit margin of approximately 20% and adjusted operating margin of approximately 21%* Earnings per Share GAAP EPS in a range of $1.72 to $1.77 Adjusted EPS in a range of $1.80 to $1.85* 2020 Outlook 17 *Note: See appendix for reconciliation of Non-GAAP to GAAP financial measures. |
| Questions and Answers 18 |

| Appendix Third Quarter 2020 Earnings Webcast and Conference Call 19 |

| Western Union presents a number of non-GAAP financial measures because management believes that these metrics provide meaningful supplemental information in addition to the GAAP metrics and provide comparability and consistency to prior periods. Constant currency results assume foreign revenues are translated from foreign currencies to the U.S. dollar, net of the effect of foreign currency hedges, at rates consistent with those in the prior year. We have also included non-GAAP revenues below that remove the impacts of Speedpay and Paymap, in order to provide a more meaningful comparison of results from continuing operations. A non-GAAP financial measure should not be considered in isolation or as a substitute for the most comparable GAAP financial measure.A non-GAAP financial measure reflects an additional way of viewing aspects of our operations that, when viewed with our GAAP results and the reconciliation to the corresponding GAAP financial measure, provide a more complete understanding of our business. Users of the financial statements are encouraged to review our financial statements and publicly-filed reports in their entirety and not to rely on any single financial measure.A reconciliation of non-GAAP financial measures to the most directly comparable GAAP financial measures is included below. Amounts included below are in millions, unless indicated otherwise. 20 Key Statistics and Reconciliation of Non-GAAP Measures |
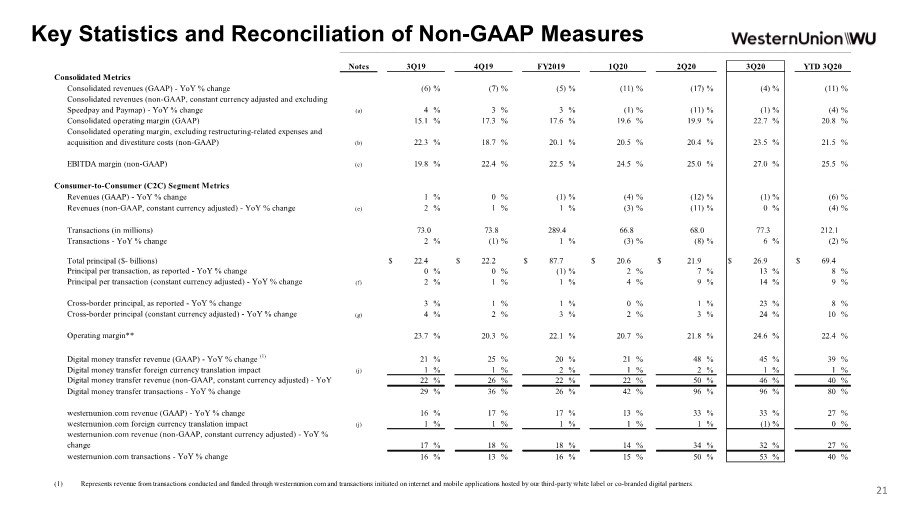
| Key Statistics and Reconciliation of Non-GAAP Measures Consolidated Metrics Consolidated revenues (GAAP) - YoY % change (6) % (7) % (5) % (11) % (17) % (4) % (11) % Consolidated revenues (non-GAAP, constant currency adjusted and excluding Speedpay and Paymap) - YoY % change (a) 4 % 3 % 3 % (1) % (11) % (1) % (4) % Consolidated operating margin (GAAP) 15.1 % 17.3 % 17.6 % 19.6 % 19.9 % 22.7 % 20.8 % Consolidated operating margin, excluding restructuring-related expenses and acquisition and divestiture costs (non-GAAP) (b) 22.3 % 18.7 % 20.1 % 20.5 % 20.4 % 23.5 % 21.5 % EBITDA margin (non-GAAP) (c) 19.8 % 22.4 % 22.5 % 24.5 % 25.0 % 27.0 % 25.5 % Consumer-to-Consumer (C2C) Segment Metrics Revenues (GAAP) - YoY % change 1 % 0 % (1) % (4) % (12) % (1) % (6) % Revenues (non-GAAP, constant currency adjusted) - YoY % change (e) 2 % 1 % 1 % (3) % (11) % 0 % (4) % Transactions (in millions) 73.0 73.8 289.4 66.8 68.0 77.3 212.1 Transactions - YoY % change 2 % (1) % 1 % (3) % (8) % 6 % (2) % Total principal ($- billions) $ 22.4 $ 22.2 $ 87.7 $ 20.6 $ 21.9 $ 26.9 $ 69.4 Principal per transaction, as reported - YoY % change 0 % 0 % (1) % 2 % 7 % 13 % 8 % Principal per transaction (constant currency adjusted) - YoY % change (f) 2 % 1 % 1 % 4 % 9 % 14 % 9 % Cross-border principal, as reported - YoY % change 3 % 1 % 1 % 0 % 1 % 23 % 8 % Cross-border principal (constant currency adjusted) - YoY % change (g) 4 % 2 % 3 % 2 % 3 % 24 % 10 % Operating margin** 23.7 % 20.3 % 22.1 % 20.7 % 21.8 % 24.6 % 22.4 % Digital money transfer revenue (GAAP) - YoY % change (1) 21 % 25 % 20 % 21 % 48 % 45 % 39 % Digital money transfer foreign currency translation impact (j) 1 % 1 % 2 % 1 % 2 % 1 % 1 % Digital money transfer revenue (non-GAAP, constant currency adjusted) - YoY 22 % 26 % 22 % 22 % 50 % 46 % 40 % Digital money transfer transactions - YoY % change 29 % 36 % 26 % 42 % 96 % 96 % 80 % westernunion.com revenue (GAAP) - YoY % change 16 % 17 % 17 % 13 % 33 % 33 % 27 % westernunion.com foreign currency translation impact (j) 1 % 1 % 1 % 1 % 1 % (1) % 0 % westernunion.com revenue (non-GAAP, constant currency adjusted) - YoY % change 17 % 18 % 18 % 14 % 34 % 32 % 27 % westernunion.com transactions - YoY % change 16 % 13 % 16 % 15 % 50 % 53 % 40 % (1) Represents revenue from transactions conducted and funded through westernunion.com and transactions initiated on internet and mobile applications hosted by our third-party white label or co-branded digital partners. YTD 3Q20 Notes 3Q20 FY2019 3Q19 4Q19 1Q20 2Q20 21 |
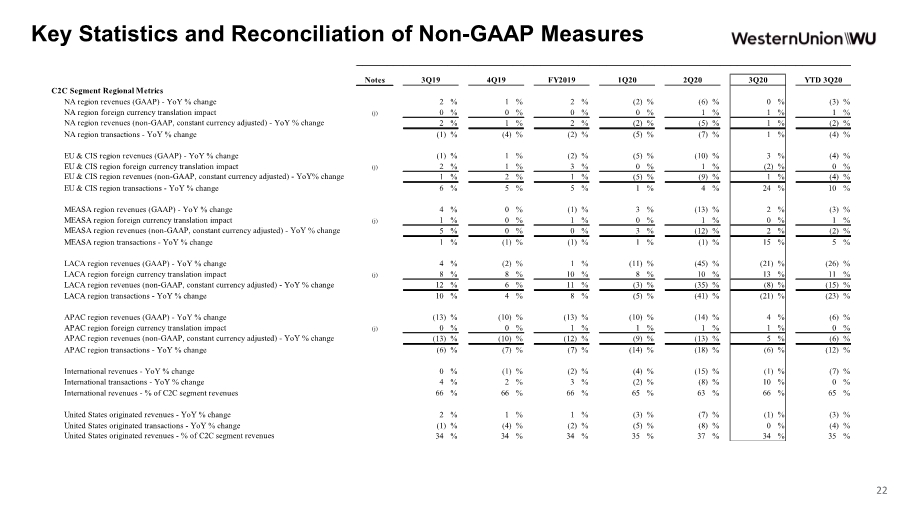
| Key Statistics and Reconciliation of Non-GAAP Measures C2C Segment Regional Metrics NA region revenues (GAAP) - YoY % change 2 % 1 % 2 %(2) %(6) % 0 %(3) % NA region foreign currency translation impact (j) 0 % 0 % 0 % 0 % 1 % 1 % 1 % NA region revenues (non-GAAP, constant currency adjusted) - YoY % change 2 % 1 % 2 %(2) %(5) % 1 %(2) % NA region transactions - YoY % change (1) % (4) % (2) %(5) %(7) % 1 %(4) % EU & CIS region revenues (GAAP) - YoY % change (1) % 1 % (2) %(5) %(10) % 3 %(4) % EU & CIS region foreign currency translation impact (j) 2 % 1 % 3 % 0 % 1 % (2) % 0 % EU & CIS region revenues (non-GAAP, constant currency adjusted) - YoY% change 1 % 2 % 1 %(5) %(9) % 1 %(4) % EU & CIS region transactions - YoY % change 6 % 5 % 5 % 1 % 4 % 24 % 10 % MEASA region revenues (GAAP) - YoY % change 4 % 0 % (1) % 3 %(13) % 2 %(3) % MEASA region foreign currency translation impact (j) 1 % 0 % 1 % 0 % 1 % 0 % 1 % MEASA region revenues (non-GAAP, constant currency adjusted) - YoY % change 5 % 0 % 0 % 3 %(12) % 2 %(2) % MEASA region transactions - YoY % change 1 % (1) % (1) % 1 %(1) % 15 % 5 % LACA region revenues (GAAP) - YoY % change 4 % (2) % 1 %(11) %(45) % (21) %(26) % LACA region foreign currency translation impact (j) 8 % 8 % 10 % 8 % 10 % 13 % 11 % LACA region revenues (non-GAAP, constant currency adjusted) - YoY % change 12 % 6 % 11 %(3) %(35) % (8) %(15) % LACA region transactions - YoY % change 10 % 4 % 8 %(5) %(41) % (21) %(23) % APAC region revenues (GAAP) - YoY % change (13) % (10) % (13) %(10) %(14) % 4 %(6) % APAC region foreign currency translation impact (j) 0 % 0 % 1 % 1 % 1 % 1 % 0 % APAC region revenues (non-GAAP, constant currency adjusted) - YoY % change (13) % (10) % (12) %(9) %(13) % 5 %(6) % APAC region transactions - YoY % change (6) % (7) % (7) %(14) %(18) % (6) %(12) % International revenues - YoY % change 0 % (1) % (2) %(4) %(15) % (1) %(7) % International transactions - YoY % change 4 % 2 % 3 %(2) %(8) % 10 % 0 % International revenues - % of C2C segment revenues 66 % 66 % 66 % 65 % 63 % 66 % 65 % United States originated revenues - YoY % change 2 % 1 % 1 %(3) %(7) % (1) %(3) % United States originated transactions - YoY % change (1) % (4) % (2) %(5) %(8) % 0 %(4) % United States originated revenues - % of C2C segment revenues 34 % 34 % 34 % 35 % 37 % 34 % 35 % YTD 3Q20 Notes 3Q20 FY2019 3Q19 4Q19 1Q20 2Q20 22 |
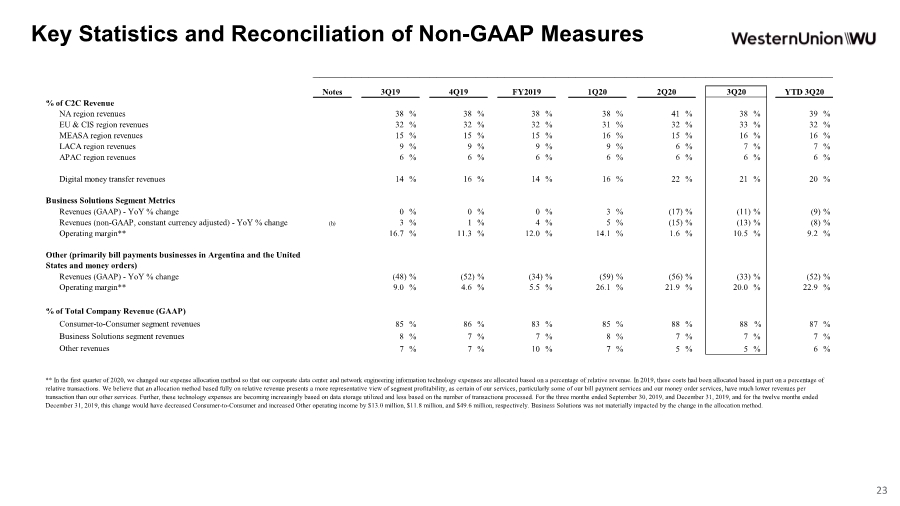
| Key Statistics and Reconciliation of Non-GAAP Measures 23 % of C2C Revenue NA region revenues 38 % 38 % 38 % 38 % 41 % 38 % 39 % EU & CIS region revenues 32 % 32 % 32 % 31 % 32 % 33 % 32 % MEASA region revenues 15 % 15 % 15 % 16 % 15 % 16 % 16 % LACA region revenues 9 % 9 % 9 % 9 % 6 % 7 % 7 % APAC region revenues 6 % 6 % 6 % 6 % 6 % 6 % 6 % Digital money transfer revenues 14 % 16 % 14 % 16 % 22 % 21 % 20 % Business Solutions Segment Metrics Revenues (GAAP) - YoY % change 0 % 0 % 0 % 3 % (17) % (11) % (9) % Revenues (non-GAAP, constant currency adjusted) - YoY % change (h) 3 % 1 % 4 % 5 %(15) %(13) % (8) % Operating margin** 16.7 % 11.3 % 12.0 % 14.1 % 1.6 % 10.5 % 9.2 % Other (primarily bill payments businesses in Argentina and the United States and money orders) Revenues (GAAP) - YoY % change (48) % (52) % (34) % (59) % (56) % (33) % (52) % Operating margin** 9.0 % 4.6 % 5.5 % 26.1 % 21.9 % 20.0 % 22.9 % % of Total Company Revenue (GAAP) Consumer-to-Consumer segment revenues 85 % 86 % 83 % 85 % 88 % 88 % 87 % Business Solutions segment revenues 8 % 7 % 7 % 8 % 7 % 7 % 7 % Other revenues 7 % 7 % 10 % 7 % 5 % 5 % 6 % ** In the first quarter of 2020, we changed our expense allocation method so that our corporate data center and network engineering information technology expenses are allocated based on a percentage of relative revenue. In 2019, these costs had been allocated based in part on a percentage of relative transactions. We believe that an allocation method based fully on relative revenue presents a more representative view of segment profitability, as certain of our services, particularly some of our bill payment services and our money order services, have much lower revenues per transaction than our other services. Further, these technology expenses are becoming increasingly based on data storage utilized and less based on the number of transactions processed. For the three months ended September 30, 2019, and December 31, 2019, and for the twelve months ended December 31, 2019, this change would have decreased Consumer-to-Consumer and increased Other operating income by $13.0 million, $11.8 million, and $49.6 million, respectively. Business Solutions was not materially impacted by the change in the allocation method. YTD 3Q20 Notes FY2019 3Q20 3Q19 4Q19 1Q20 2Q20 |
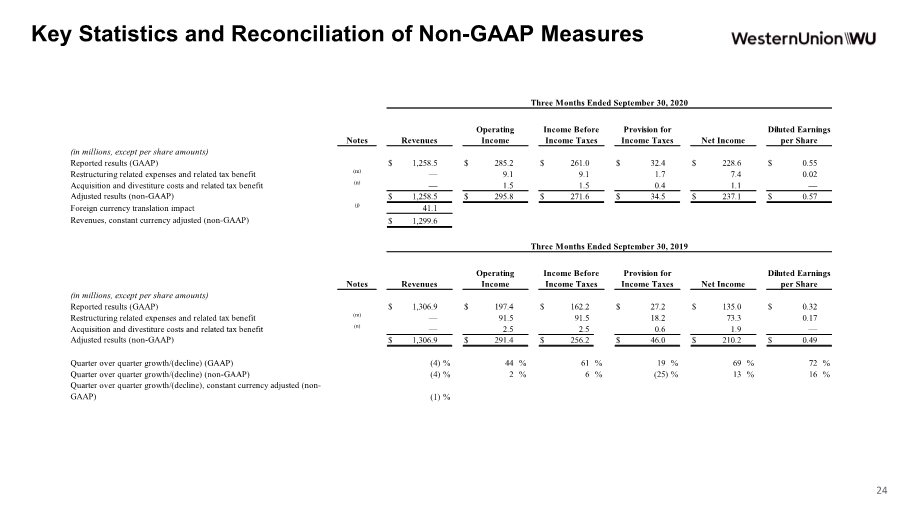
| Key Statistics and Reconciliation of Non-GAAP Measures (in millions, except per share amounts) Reported results (GAAP) $ 1,258.5 $ 285.2 $ 261.0 $ 32.4 $ 228.6 $ 0.55 Restructuring related expenses and related tax benefit (m) — 9.1 9.1 1.7 7.4 0.02 Acquisition and divestiture costs and related tax benefit (n) — 1.5 1.5 0.4 1.1 — Adjusted results (non-GAAP) $ 1,258.5 $ 295.8 $ 271.6 $ 34.5 $ 237.1 $ 0.57 Foreign currency translation impact (j) 41.1 Revenues, constant currency adjusted (non-GAAP) $ 1,299.6 (in millions, except per share amounts) Reported results (GAAP) $ 1,306.9 $ 197.4 $ 162.2 $ 27.2 $ 135.0 $ 0.32 Restructuring related expenses and related tax benefit (m) — 91.5 91.5 18.2 73.3 0.17 Acquisition and divestiture costs and related tax benefit (n) — 2.5 2.5 0.6 1.9 — Adjusted results (non-GAAP) $ 1,306.9 $ 291.4 $ 256.2 $ 46.0 $ 210.2 $ 0.49 Quarter over quarter growth/(decline) (GAAP) (4) % 44 % 61 % 19 % 69 % 72 % Quarter over quarter growth/(decline) (non-GAAP) (4) % 2 % 6 %(25) % 13 % 16 % Quarter over quarter growth/(decline), constant currency adjusted (non- GAAP) (1) % Three Months Ended September 30, 2019 Notes Revenues Operating Income Income Before Income Taxes Provision for Income Taxes Net Income Diluted Earnings per Share Three Months Ended September 30, 2020 Notes Revenues Operating Income Income Before Income Taxes Provision for Income Taxes Net Income Diluted Earnings per Share 24 |
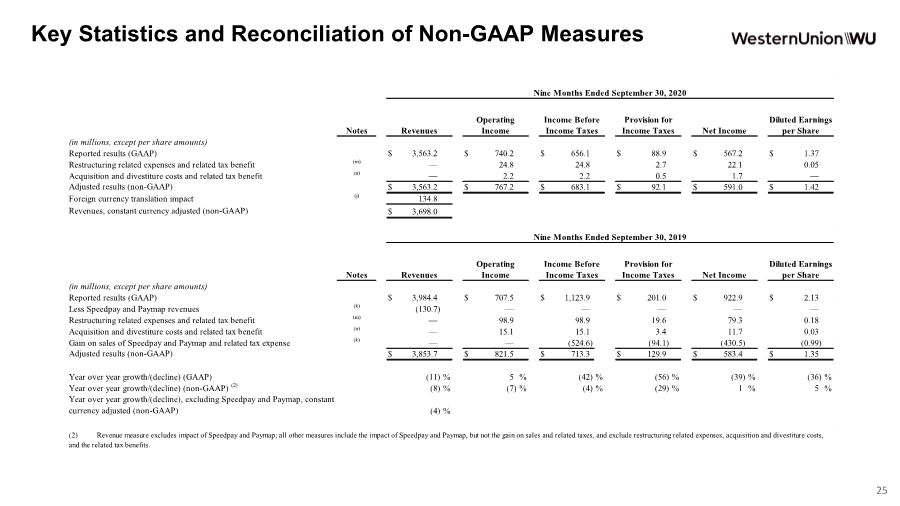
| Key Statistics and Reconciliation of Non-GAAP Measures (in millions, except per share amounts) Reported results (GAAP) $ 3,563.2 $ 740.2 $ 656.1 $ 88.9 $ 567.2 $ 1.37 Restructuring related expenses and related tax benefit (m) — 24.8 24.8 2.7 22.1 0.05 Acquisition and divestiture costs and related tax benefit (n) — 2.2 2.2 0.5 1.7 — Adjusted results (non-GAAP) $ 3,563.2 $ 767.2 $ 683.1 $ 92.1 $ 591.0 $ 1.42 Foreign currency translation impact (j) 134.8 Revenues, constant currency adjusted (non-GAAP) $ 3,698.0 (in millions, except per share amounts) Reported results (GAAP) $ 3,984.4 $ 707.5 $ 1,123.9 $ 201.0 $ 922.9 $ 2.13 Less Speedpay and Paymap revenues (k) (130.7) — — — — — Restructuring related expenses and related tax benefit (m) — 98.9 98.9 19.6 79.3 0.18 Acquisition and divestiture costs and related tax benefit (n) — 15.1 15.1 3.4 11.7 0.03 Gain on sales of Speedpay and Paymap and related tax expense (k) — — (524.6) (94.1) (430.5) (0.99) Adjusted results (non-GAAP) $ 3,853.7 $ 821.5 $ 713.3 $ 129.9 $ 583.4 $ 1.35 Year over year growth/(decline) (GAAP) (11) % 5 %(42) %(56) %(39) %(36) % Year over year growth/(decline) (non-GAAP) (2) (8) %(7) %(4) %(29) % 1 % 5 % Year over year growth/(decline), excluding Speedpay and Paymap, constant currency adjusted (non-GAAP) (4) % (2) Revenue measure excludes impact of Speedpay and Paymap; all other measures include the impact of Speedpay and Paymap, but not the gain on sales and related taxes, and exclude restructuring related expenses, acquisition and divestiture costs, and the related tax benefits. Nine Months Ended September 30, 2019 Notes Revenues Operating Income Income Before Income Taxes Provision for Income Taxes Net Income Diluted Earnings per Share Nine Months Ended September 30, 2020 Notes Revenues Operating Income Income Before Income Taxes Provision for Income Taxes Net Income Diluted Earnings per Share 25 |
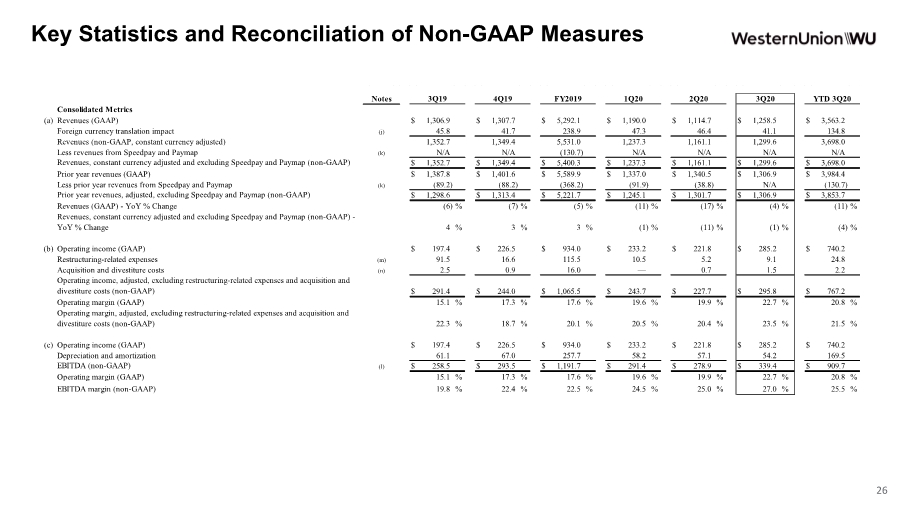
| Key Statistics and Reconciliation of Non-GAAP Measures Consolidated Metrics (a) Revenues (GAAP) $ 1,306.9 $ 1,307.7 $ 5,292.1 $ 1,190.0 $ 1,114.7 $ 1,258.5 $ 3,563.2 Foreign currency translation impact (j) 45.8 41.7 238.9 47.3 46.4 41.1 134.8 Revenues (non-GAAP, constant currency adjusted) 1,352.7 1,349.4 5,531.0 1,237.3 1,161.1 1,299.6 3,698.0 Less revenues from Speedpay and Paymap (k) N/A N/A (130.7) N/A N/A N/A N/A Revenues, constant currency adjusted and excluding Speedpay and Paymap (non-GAAP) $ 1,352.7 $ 1,349.4 $ 5,400.3 $ 1,237.3 $ 1,161.1 $ 1,299.6 $ 3,698.0 Prior year revenues (GAAP) $ 1,387.8 $ 1,401.6 $ 5,589.9 $ 1,337.0 $ 1,340.5 $ 1,306.9 $ 3,984.4 Less prior year revenues from Speedpay and Paymap (k) (89.2) (88.2) (368.2) (91.9) (38.8) N/A (130.7) Prior year revenues, adjusted, excluding Speedpay and Paymap (non-GAAP) $ 1,298.6 $ 1,313.4 $ 5,221.7 $ 1,245.1 $ 1,301.7 $ 1,306.9 $ 3,853.7 Revenues (GAAP) - YoY % Change (6) % (7) % (5) % (11) % (17) % (4) % (11) % Revenues, constant currency adjusted and excluding Speedpay and Paymap (non-GAAP) - YoY % Change 4 % 3 % 3 %(1) % (11) % (1) % (4) % (b) Operating income (GAAP) $ 197.4 $ 226.5 $ 934.0 $ 233.2 $ 221.8 $ 285.2 $ 740.2 Restructuring-related expenses (m) 91.5 16.6 115.5 10.5 5.2 9.1 24.8 Acquisition and divestiture costs (n) 2.5 0.9 16.0 — 0.7 1.5 2.2 Operating income, adjusted, excluding restructuring-related expenses and acquisition and divestiture costs (non-GAAP) $ 291.4 $ 244.0 $ 1,065.5 $ 243.7 $ 227.7 $ 295.8 $ 767.2 Operating margin (GAAP) 15.1 % 17.3 % 17.6 % 19.6 % 19.9 % 22.7 % 20.8 % Operating margin, adjusted, excluding restructuring-related expenses and acquisition and divestiture costs (non-GAAP) 22.3 % 18.7 % 20.1 % 20.5 % 20.4 % 23.5 % 21.5 % (c) Operating income (GAAP) $ 197.4 $ 226.5 $ 934.0 $ 233.2 $ 221.8 $ 285.2 $ 740.2 Depreciation and amortization 61.1 67.0 257.7 58.2 57.1 54.2 169.5 EBITDA (non-GAAP) (l) $ 258.5 $ 293.5 $ 1,191.7 $ 291.4 $ 278.9 $ 339.4 $ 909.7 Operating margin (GAAP) 15.1 % 17.3 % 17.6 % 19.6 % 19.9 % 22.7 % 20.8 % EBITDA margin (non-GAAP) 19.8 % 22.4 % 22.5 % 24.5 % 25.0 % 27.0 % 25.5 % YTD 3Q20 Notes 3Q20 FY2019 3Q19 4Q19 1Q20 2Q20 26 |
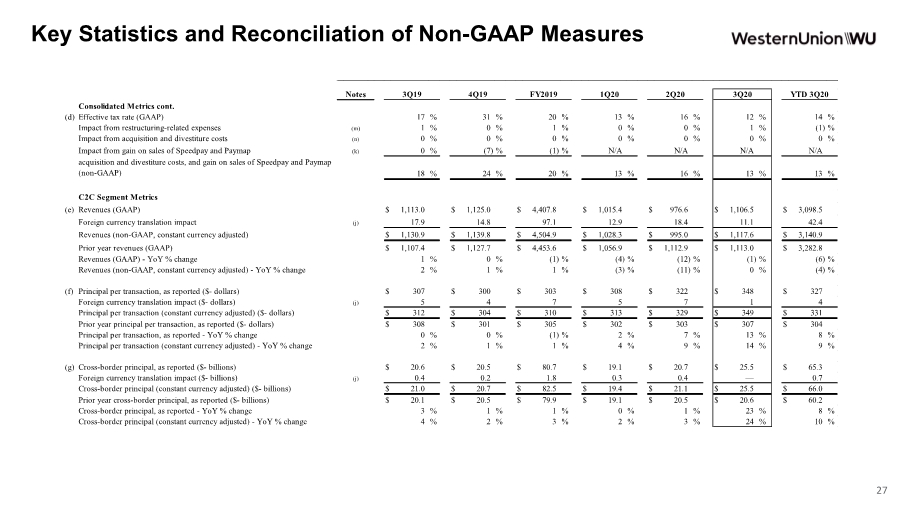
| Key Statistics and Reconciliation of Non-GAAP Measures Consolidated Metrics cont. (d) Effective tax rate (GAAP) 17 % 31 % 20 % 13 % 16 % 12 % 14 % Impact from restructuring-related expenses (m) 1 % 0 % 1 % 0 % 0 % 1 %(1) % Impact from acquisition and divestiture costs (n) 0 % 0 % 0 % 0 % 0 % 0 % 0 % Impact from gain on sales of Speedpay and Paymap (k) 0 %(7) %(1) % N/A N/A N/A N/A Effective tax rate, adjusted, excluding restructuring-related expenses, acquisition and divestiture costs, and gain on sales of Speedpay and Paymap (non-GAAP) 18 % 24 % 20 % 13 % 16 % 13 % 13 % C2C Segment Metrics (e) Revenues (GAAP) $ 1,113.0 $ 1,125.0 $ 4,407.8 $ 1,015.4 $ 976.6 $ 1,106.5 $ 3,098.5 Foreign currency translation impact (j) 17.9 14.8 97.1 12.9 18.4 11.1 42.4 Revenues (non-GAAP, constant currency adjusted) $ 1,130.9 $ 1,139.8 $ 4,504.9 $ 1,028.3 $ 995.0 $ 1,117.6 $ 3,140.9 Prior year revenues (GAAP) $ 1,107.4 $ 1,127.7 $ 4,453.6 $ 1,056.9 $ 1,112.9 $ 1,113.0 $ 3,282.8 Revenues (GAAP) - YoY % change 1 % 0 % (1) % (4) % (12) % (1) % (6) % Revenues (non-GAAP, constant currency adjusted) - YoY % change 2 % 1 % 1 % (3) % (11) % 0 % (4) % (f) Principal per transaction, as reported ($- dollars) $ 307 $ 300 $ 303 $ 308 $ 322 $ 348 $ 327 Foreign currency translation impact ($- dollars) (j) 5 4 7 5 7 1 4 Principal per transaction (constant currency adjusted) ($- dollars) $ 312 $ 304 $ 310 $ 313 $ 329 $ 349 $ 331 Prior year principal per transaction, as reported ($- dollars) $ 308 $ 301 $ 305 $ 302 $ 303 $ 307 $ 304 Principal per transaction, as reported - YoY % change 0 % 0 % (1) % 2 % 7 % 13 % 8 % Principal per transaction (constant currency adjusted) - YoY % change 2 % 1 % 1 % 4 % 9 % 14 % 9 % (g) Cross-border principal, as reported ($- billions) $ 20.6 $ 20.5 $ 80.7 $ 19.1 $ 20.7 $ 25.5 $ 65.3 Foreign currency translation impact ($- billions) (j) 0.4 0.2 1.8 0.3 0.4 — 0.7 Cross-border principal (constant currency adjusted) ($- billions) $ 21.0 $ 20.7 $ 82.5 $ 19.4 $ 21.1 $ 25.5 $ 66.0 Prior year cross-border principal, as reported ($- billions) $ 20.1 $ 20.5 $ 79.9 $ 19.1 $ 20.5 $ 20.6 $ 60.2 Cross-border principal, as reported - YoY % change 3 % 1 % 1 % 0 % 1 % 23 % 8 % Cross-border principal (constant currency adjusted) - YoY % change 4 % 2 % 3 % 2 % 3 % 24 % 10 % YTD 3Q20 Notes FY2019 3Q20 3Q19 4Q19 1Q20 2Q20 27 |
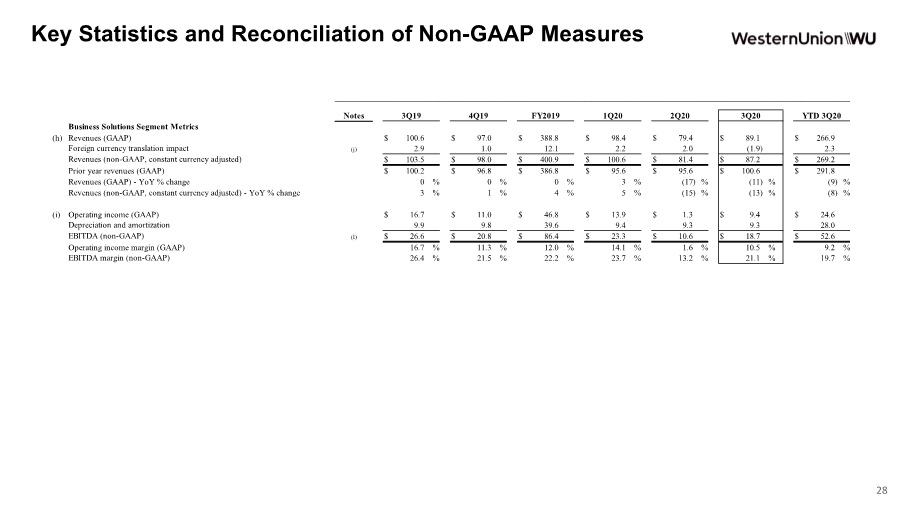
| Key Statistics and Reconciliation of Non-GAAP Measures Business Solutions Segment Metrics (h) Revenues (GAAP) $ 100.6 $ 97.0 $ 388.8 $ 98.4 $ 79.4 $ 89.1 $ 266.9 Foreign currency translation impact (j) 2.9 1.0 12.1 2.2 2.0 (1.9) 2.3 Revenues (non-GAAP, constant currency adjusted) $ 103.5 $ 98.0 $ 400.9 $ 100.6 $ 81.4 $ 87.2 $ 269.2 Prior year revenues (GAAP) $ 100.2 $ 96.8 $ 386.8 $ 95.6 $ 95.6 $ 100.6 $ 291.8 Revenues (GAAP) - YoY % change 0 % 0 % 0 % 3 % (17) % (11) % (9) % Revenues (non-GAAP, constant currency adjusted) - YoY % change 3 % 1 % 4 % 5 % (15) % (13) % (8) % (i) Operating income (GAAP) $ 16.7 $ 11.0 $ 46.8 $ 13.9 $ 1.3 $ 9.4 $ 24.6 Depreciation and amortization 9.9 9.8 39.6 9.4 9.3 9.3 28.0 EBITDA (non-GAAP) (l) $ 26.6 $ 20.8 $ 86.4 $ 23.3 $ 10.6 $ 18.7 $ 52.6 Operating income margin (GAAP) 16.7 % 11.3 % 12.0 % 14.1 % 1.6 % 10.5 % 9.2 % EBITDA margin (non-GAAP) 26.4 % 21.5 % 22.2 % 23.7 % 13.2 % 21.1 % 19.7 % YTD 3Q20 Notes 3Q20 FY2019 3Q19 4Q19 1Q20 2Q20 28 |
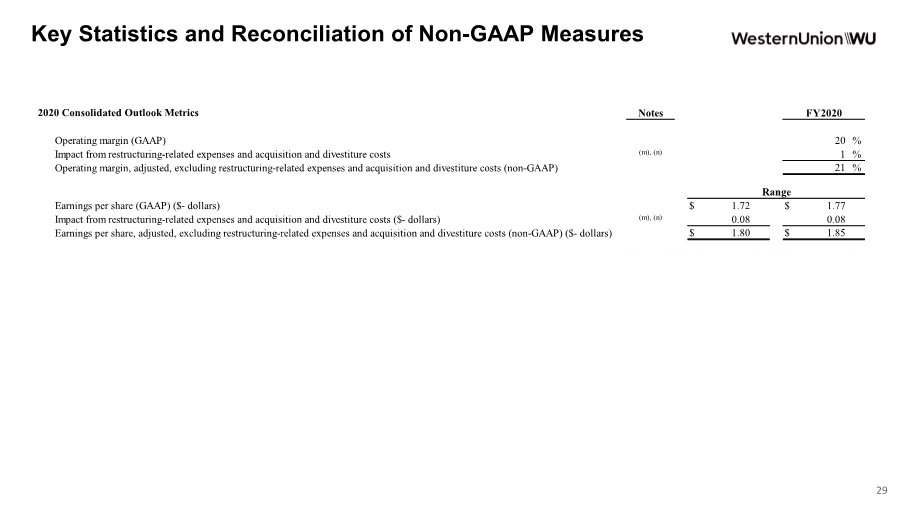
| Key Statistics and Reconciliation of Non-GAAP Measures 2020 Consolidated Outlook Metrics Operating margin (GAAP) 20 % Impact from restructuring-related expenses and acquisition and divestiture costs (m), (n) 1 % Operating margin, adjusted, excluding restructuring-related expenses and acquisition and divestiture costs (non-GAAP) 21 % Earnings per share (GAAP) ($- dollars) $ 1.72 $ 1.77 Impact from restructuring-related expenses and acquisition and divestiture costs ($- dollars) (m), (n) 0.08 0.08 Earnings per share, adjusted, excluding restructuring-related expenses and acquisition and divestiture costs (non-GAAP) ($- dollars) $ 1.80 $ 1.85 FY2020 Notes Range 29 |
| Key Statistics and Reconciliation of Non-GAAP Measures (j) (k) (l) (m) (n) Non-GAAP related notes: Represents the impact from the fluctuation in exchange rates between all foreign currency denominated amounts and the United States dollar. Constant currency results exclude any benefit or loss caused by foreign exchange fluctuations between foreign currencies and the United States dollar, net of foreign currency hedges, which would not have occurred if there had been a constant exchange rate. We believe that this measure provides management and investors with information about revenue results and trends that eliminates currency volatility while increasing the comparability of our underlying results and trends. On May 9, 2019, we completed the sale of our United States electronic bill payments business known as “Speedpay” to ACI Worldwide Corp. and ACW Worldwide, Inc. ("ACI") for approximately $750 million in cash. In addition, on May 6, 2019, we completed the sale of Paymap Inc. ("Paymap"), which provides electronic mortgage bill payment services, for contingent consideration and immaterial cash proceeds received at closing. Both Speedpay and Paymap were included as a component of "Other" in our segment reporting. Revenue has been adjusted to exclude the carved out financial information for Speedpay and Paymap and the gain on the sales and the income taxes on the gain, including the elimination of previously forecasted annual base- erosion anti-abuse taxes, has been removed from adjusted effective tax rate. These financial measures are non-GAAP measures and should not be considered a substitute for the GAAP measures. We have included this information because management believes that presenting these measures as adjusted to exclude divestitures will provide investors with a more meaningful comparison of results within the periods presented. Additionally, Speedpay and Paymap contributions to operating income exclude corporate overhead allocations. Earnings before Interest, Taxes, Depreciation, and Amortization (“EBITDA”) results from taking operating income and adjusting for depreciation and amortization expenses. EBITDA results provide an additional performance measurement calculation which helps neutralize the operating income effect of assets acquired in prior periods. Represents impact from expenses incurred in connection with an overall restructuring plan, approved by the Board of Directors on August 1, 2019, to improve our business processes and cost structure by reducing headcount and consolidating various facilities. While certain of these expenses are identifiable to our business segments, primarily to our Consumer-to-Consumer segment, they have been excluded from the measurement of segment operating income provided to the Chief Operating Decision Maker for purposes of assessing segment performance and decision making with respect to resource allocation. These expenses are therefore excluded from the Company's segment operating income results. While these expenses are specific to this initiative, the types of expenses related to this initiative are similar to expenses that we have previously incurred and can reasonably be expected to incur in the future. We believe that, by excluding the effects of these charges that can impact operating trends, management and investors are provided with a measure that increases the comparability of our underlying operating results. Represents the impact from expenses incurred in connection with our acquisition and divestiture activity, including the Speedpay and Paymap divestitures. We believe that, by excluding the effects of these charges that can impact operating trends, management and investors are provided with a measure that increases the comparability of our underlying operating results. 30 |