Attached files
| file | filename |
|---|---|
| 8-K - FORM 8-K - WILLIS TOWERS WATSON PLC | f8k_102920.htm |
| EX-99.1 - PRESS RELEASE - WILLIS TOWERS WATSON PLC | exh_991.htm |
EXHIBIT 99.2
willistowerswatson.com willistowerswatson.com Willis Towers Watson Earnings Release Supplemental Materials 2020 Third Quarter Financial Results October 29, 2020 © 2020 Willis Towers Watson. All rights reserved.
willistowerswatson.com Willis Towers Watson Forward Looking Statements © 2020 Willis Towers Watson. All rights reserved. This document contains “forward - looking statements” within the meaning of the Private Securities Litigation Reform Act of 1995. You can identify these statements and other forward - looking statements in this document by words such as “may”, “will”, “would”, “expect”, “anticipate”, “believe”, “estimate”, “plan”, “intend”, “cont inu e”, or similar words, expressions or the negative of such terms or other comparable terminology. These statements include, but are not limited to, such things as our outlook, the impact of the COVID - 19 pandemic on our business, our pending business combination with Aon plc, future capital expenditures, ongoing working capital efforts, future share repurchases, growth in revenue, the impact of ch anges to tax laws on our financial results, existing and evolving business strategies and acquisitions and dispositions, demand for our services and competitive strengths, goals, the benefits of new i nit iatives, growth of our business and operations, our ability to successfully manage ongoing organizational and technology changes, including investments in improving systems and processes, and plans and re ferences to future successes, including our future financial and operating results, plans, objectives, expectations and intentions and other statements that are not historical facts. Such st ate ments are based upon the current beliefs and expectations of Willis Towers Watson’s management and are subject to significant risks and uncertainties. Actual results may differ from those set forth in th e forward - looking statements. All forward - looking disclosure is speculative by its nature. There are important risks, uncertainties, events and factors that could cause our actual results or performance to differ mat eri ally from those in the forward - looking statements contained herein, including the following: the ability of the company to successfully establish, execute and achieve its global business strategy as it e vol ves; changes in demand for our services, including any decline in consulting services, defined benefit pension plans or the purchasing of insurance; changes in general economic, business and political c ond itions, including changes in the financial markets; the risk that the COVID - 19 pandemic substantially and negatively impacts the demand for our products and services and cash flows, and/or continues to ma terially impact our business operations, including increased demand on our information technology resources and systems and related risks of cybersecurity breaches or incidents; the risks relating to or arising from our pending business combination with Aon plc announced in March 2020, including, among others, our ability to consummate the transaction, including on the terms of the business com bin ation agreement, on the anticipated timeline, and/or with the required regulatory approvals; significant competition that the company faces and the potential for loss of market share and/or profit abi lity; the impact of seasonality and differences in timing of renewals; the failure to protect client data or breaches of information systems or insufficient safeguards against cybersecurity breaches or incide nts ; the risk of increased liability or new legal claims arising from our new and existing products and services, and expectations, intentions and outcomes relating to outstanding litigation; the risk the St anf ord litigation settlement approval will be overturned on appeal, the risk that the Stanford bar order may be challenged in other jurisdictions, and the risk that the charge related to the Stanford settlement may not be deductible; the risk of substantial negative outcomes on existing litigation or investigation matters; changes in the regulatory environment in which the company operates, including, among ot her risks, the impact of pending competition law and regulatory investigations; various claims, government inquiries or investigations or the potential for regulatory action; the company’s ability to make div estitures or acquisitions and its ability to integrate or manage such acquired businesses (including the recently - completed acquisition in Latin America); our ability to successfully hedge against fluctuatio ns in foreign currency rates; our ability to integrate direct - to - consumer sales and marketing solutions with our existing offerings and solutions; the ability to comply with complex and evolving regulation s r elated to data privacy and cyber security; the ability to successfully manage ongoing organizational changes, including investments in improving systems and processes; disasters or business continuity pr obl ems; the impact of Brexit; risks relating to the U.S. 2020 election, including a potential increase in the corporate tax rate; our ability to successfully enhance our billing, collection and other working capital efforts, and thereby increase our free cash fl ow; the potential impact of the anticipated replacement of LIBOR; the ability of the company to properly identify and manage conflicts of inter est ; reputational damage, including from association with third parties; reliance on third - party services; the loss of key employees; doing business internationally, including the impact of exchange rates; comp liance with extensive government regulation; the risk of sanctions imposed by governments, or changes to associated sanction regulations; our ability to effectively apply technology, data and analytic s c hanges for internal operations, maintaining industry standards and meeting client preferences; changes and developments in the insurance industry or the United States healthcare system, including thos e r elated to Medicare; the inability to protect the company’s intellectual property rights, or the potential infringement upon the intellectual property rights of others; fluctuations in the company’s pe nsion assets and liabilities; the company’s capital structure, including indebtedness amounts, the limitations imposed by the covenants in the documents governing such indebtedness and the maintenan ce of the financial and disclosure controls and procedures of each; the ability of the company to obtain financing on favorable terms or at all; adverse changes in the credit ratings of the company ; t he impact of recent changes to U.S. tax laws, including on our effective tax rate, and the enactment of additional, or the revision of existing, state, federal, and/or foreign regulatory and tax laws an d r egulations; U.S. federal income tax consequences to U.S. persons owning at least 10% of the company’s shares; changes in accounting principles, estimates or assumptions; fluctuation in revenue against th e company’s relatively fixed or higher than expected expenses; the laws of Ireland being different from the laws of the United States and potentially affording less protections to the holders of ou r s ecurities; and the company's holding company structure potentially preventing it from being able to receive dividends or other distributions in needed amounts from our subsidiaries. These factors also inclu de those described under “Risk Factors” in the company’s most recent 10 - K and 10 - Q filings and subsequent filings filed with the SEC, including definitive additional materials, the merger proxy statemen t and other filings generally applicable to significant transactions and related integrations that are or will be filed with the SEC. Copies are available online at http://www.sec.gov or www.willistowerswatson .com. Although we believe that the assumptions underlying our forward - looking statements are reasonable, any of these assumptions, and therefore also the forward - looking statements based on these assumptions, could themselves prove to be inaccurate. In light of the significant uncertainties inherent in the forward - looking statements included in this document, our inclusion of this information is not a representation or guarantee by us that our objectives and plans will be achieved. Our forward - looking statements speak only as of the date made and we will not update these forward - looking statements unless the securities laws require us to do so. In light of these risks, uncertainties and assumptions, the forward - looking events discussed in this document may not occur, and we caution you against relying on thes e forward - looking statements. 1
willistowerswatson.com Willis Towers Watson Non - GAAP Measures © 2020 Willis Towers Watson. All rights reserved. In order to assist readers of our consolidated financial statements in understanding the core operating results that Willis T owe rs Watson’s management uses to evaluate the business and for financial planning, we present the following non - GAAP measures: (1) Constant Currency Change, (2) Organic Change, (3) Adjusted O perating Income/Margin, (4) Adjusted EBITDA/Margin, (5) Adjusted Net Income, (6) Adjusted Diluted Earnings Per Share, (7) Adjusted Income Before Taxes, (8) Adjusted Income Taxes/Tax Ra te and (9) Free Cash Flow. The Company believes that these measures are relevant and provide useful information widely used by analysts, investors and o the r interested parties in our industry to provide a baseline for evaluating and comparing our operating performance, and in the case of free cash flow, our liquidity results. Reconciliations of these measures are included in the accompanying appendix of these earning release supplemental materials. The Company does not reconcile its forward - looking non - GAAP financial measures to the corresponding U.S. GAAP measures, due to v ariability and difficulty in making accurate forecasts and projections and/or certain information not being ascertainable or accessible; and because not all of the information, such as fo reign currency impacts necessary for a quantitative reconciliation of these forward - looking non - GAAP financial measures to the most directly comparable U.S. GAAP financial measure, is available to t he Company without unreasonable efforts. For the same reasons, the Company is unable to address the probable significance of the unavailable information. The Company provides non - GAA P financial measures that it believes will be achieved, however it cannot accurately predict all of the components of the adjusted calculations and the U.S. GAAP measures may be mat eri ally different than the non - GAAP measures. 2
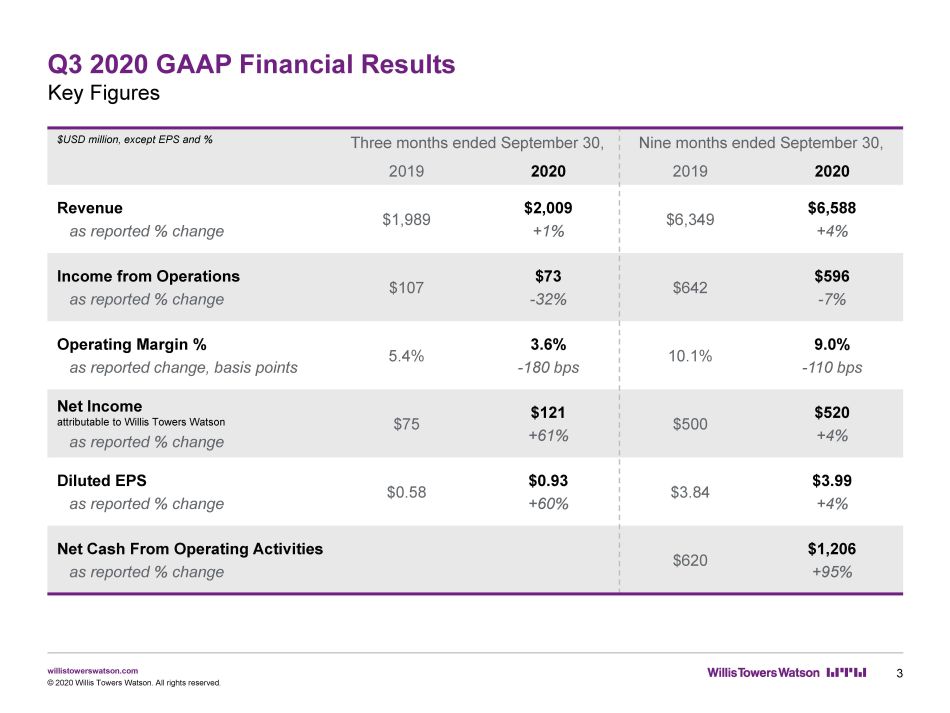
willistowerswatson.com Q3 2020 GAAP Financial Results Key Figures © 2020 Willis Towers Watson. All rights reserved. 3 $USD million, except EPS and % Three months ended September 30, Nine months ended September 30, 2019 2020 2019 2020 Revenue as reported % change $1,989 $2,009 +1% $6,349 $6,588 +4% Income from Operations as reported % change $107 $73 - 32% $642 $596 - 7% Operating Margin % as reported change, basis points 5.4% 3.6% - 180 bps 10.1% 9.0% - 110 bps Net Income attributable to Willis Towers Watson as reported % change $75 $121 +61% $500 $520 +4% Diluted EPS as reported % change $0.58 $0.93 +60% $3.84 $3.99 +4% Net Cash From Operating Activities as reported % change $620 $1,206 +95%
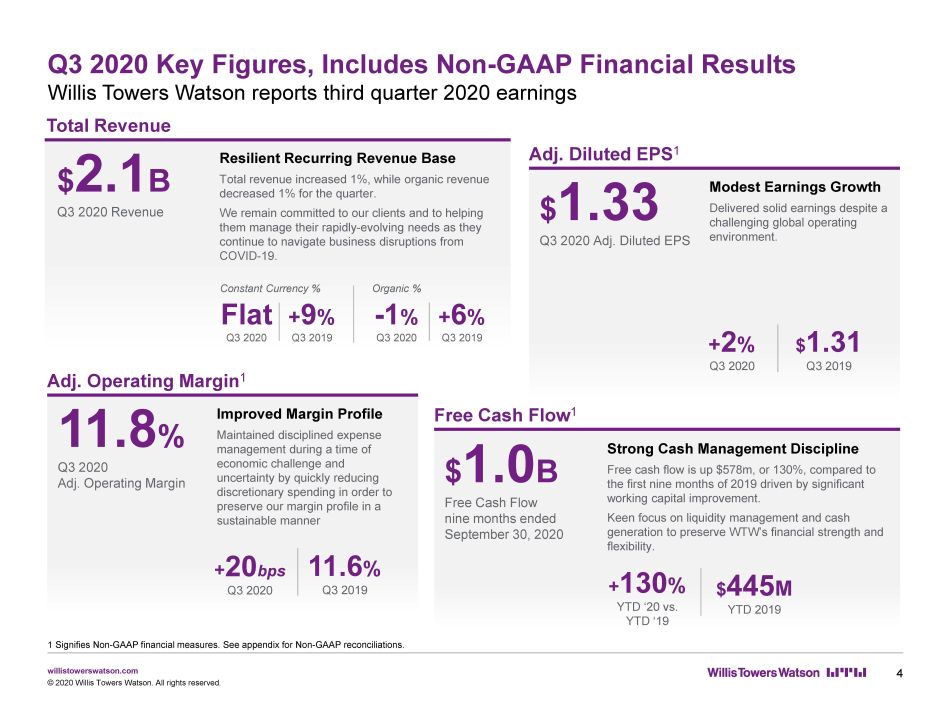
willistowerswatson.com Q3 2020 Key Figures, Includes Non - GAAP Financial Results Willis Towers Watson reports third quarter 2020 earnings © 2020 Willis Towers Watson. All rights reserved. $ 2.1 B Q3 2020 Revenue Total Revenue Resilient Recurring Revenue Base Total revenue increased 1%, while organic revenue decreased 1% for the quarter. We remain committed to our clients and to helping them manage their rapidly - evolving needs as they continue to navigate business disruptions from COVID - 19. $ 1.0 B Free Cash Flow nine months ended September 30, 2020 Free Cash Flow 1 + 130 % YTD ‘20 vs. YTD ‘19 Strong Cash Management Discipline Free cash flow is up $578m, or 130%, compared to the first nine months of 2019 driven by significant working capital improvement. Keen focus on liquidity management and cash generation to preserve WTW’s financial strength and flexibility. $ 1.33 Q3 2020 Adj. Diluted EPS Adj. Diluted EPS 1 Modest Earnings Growth Delivered solid earnings despite a challenging global operating environment. 11.8 % Q3 2020 Adj. Operating Margin Adj. Operating Margin 1 Improved Margin Profile Maintained disciplined expense management during a time of economic challenge and uncertainty by quickly reducing discretionary spending in order to preserve our margin profile in a sustainable manner + 2 % Q3 2020 $ 1.31 Q3 2019 11.6 % Q3 2019 4 $ 445 M YTD 2019 1 Signifies Non - GAAP financial measures. See appendix for Non - GAAP reconciliations. + 20 bps Q3 2020 Flat Q3 2020 + 9 % Q3 2019 Constant Currency % - 1 % Q3 2020 + 6 % Q3 2019 Organic %
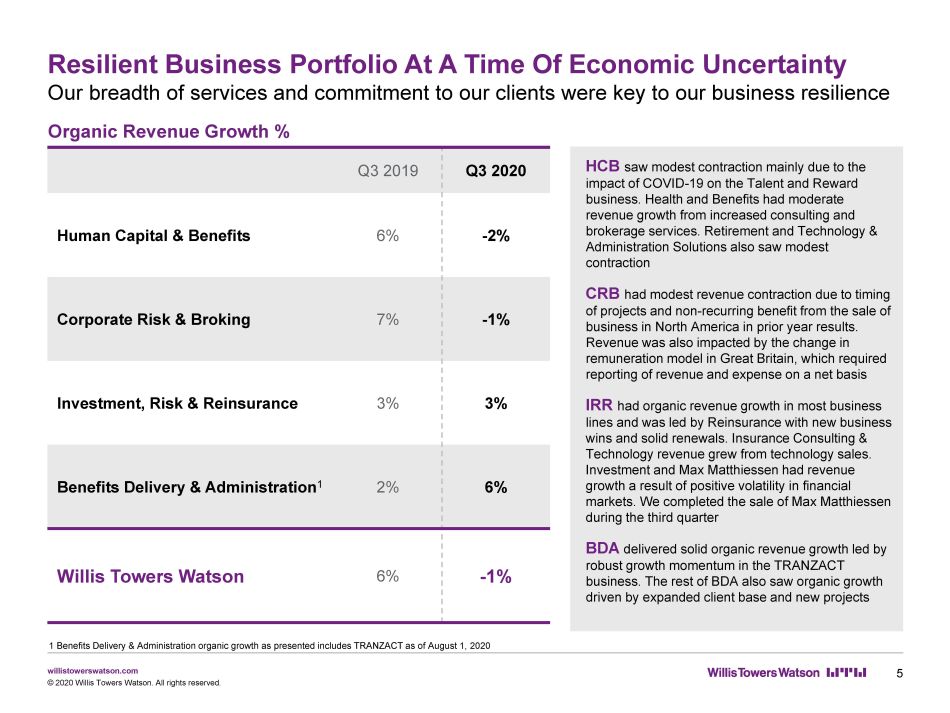
willistowerswatson.com Organic Revenue Growth % Resilient Business Portfolio At A Time Of Economic Uncertainty Our breadth of services and commitment to our clients were key to our business resilience © 2020 Willis Towers Watson. All rights reserved. 5 HCB saw modest contraction mainly due to the impact of COVID - 19 on the Talent and Reward business. Health and Benefits had moderate revenue growth from increased consulting and brokerage services. Retirement and Technology & Administration Solutions also saw modest contraction CRB had modest revenue contraction due to timing of projects and non - recurring benefit from the sale of business in North America in prior year results. Revenue was also impacted by the change in remuneration model in Great Britain, which required reporting of revenue and expense on a net basis IRR had organic revenue growth in most business lines and was led by Reinsurance with new business wins and solid renewals . Insurance Consulting & Technology revenue grew from technology sales. Investment and Max Matthiessen had revenue growth a result of positive volatility in financial markets . We completed the sale of Max Matthiessen during the third quarter BDA delivered solid organic revenue growth le d by robust growth momentum in the TRANZACT business. The rest of BDA also saw organic growth driven by expanded client base and new projects Q3 2019 Q3 2020 Human Capital & Benefits 6% - 2% Corporate Risk & Broking 7% - 1% Investment, Risk & Reinsurance 3% 3% Benefits Delivery & Administration 1 2% 6% Willis Towers Watson 6% - 1% 1 Benefits Delivery & Administration organic growth as presented includes TRANZACT as of August 1, 2020
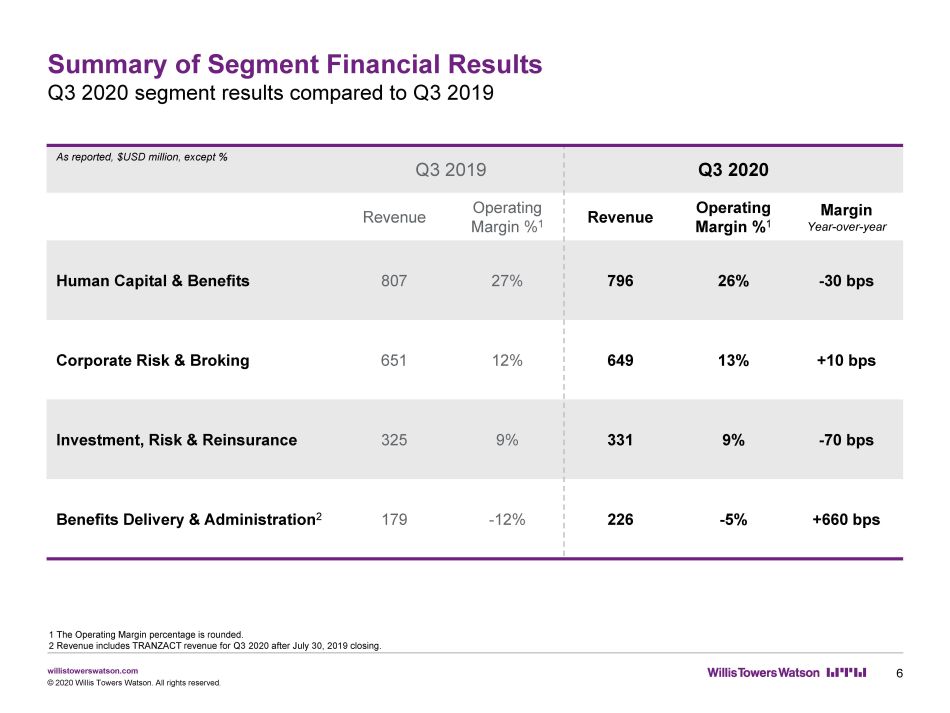
willistowerswatson.com Summary of Segment Financial Results Q3 2020 segment results compared to Q3 2019 © 2020 Willis Towers Watson. All rights reserved. 6 1 The Operating Margin percentage is rounded. 2 Revenue includes TRANZACT revenue for Q3 2020 after July 30, 2019 closing. As reported, $USD million, except % Q3 2019 Q3 2020 Revenue Operating Margin % 1 Revenue Operating Margin % 1 Margin Year - over - year Human Capital & Benefits 807 27% 796 26% - 30 bps Corporate Risk & Broking 651 12% 649 13% +10 bps Investment, Risk & Reinsurance 325 9% 331 9% - 70 bps Benefits Delivery & Administration 2 179 - 12% 226 - 5% +660 bps
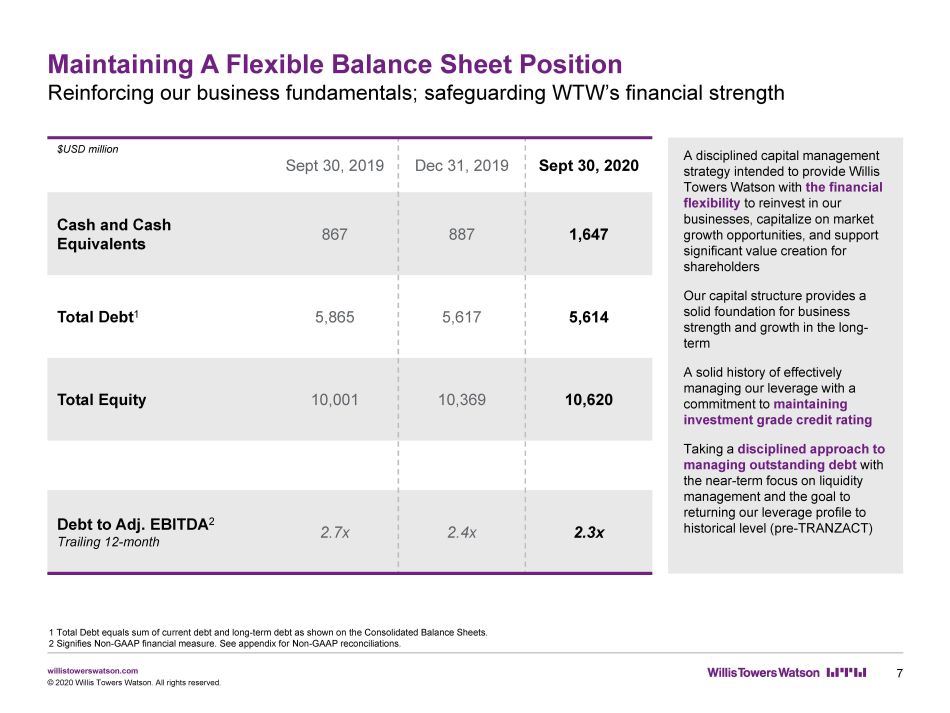
willistowerswatson.com Maintaining A Flexible Balance Sheet Position Reinforcing our business fundamentals; safeguarding WTW’s financial strength 7 © 2020 Willis Towers Watson. All rights reserved. A disciplined capital management strategy intended to provide Willis Towers Watson with the financial flexibility to reinvest in our businesses, capitalize on market growth opportunities, and support significant value creation for shareholders Our capital structure provides a solid foundation for business strength and growth in the long - term A solid history of effectively managing our leverage with a commitment to maintaining investment grade credit rating Taking a disciplined approach to managing outstanding debt with the near - term focus on liquidity management and the goal to returning our leverage profile to historical level (pre - TRANZACT) 1 Total Debt equals sum of current debt and long - term debt as shown on the Consolidated Balance Sheets. 2 Signifies Non - GAAP financial measure. See appendix for Non - GAAP reconciliations. $USD million Sept 30, 2019 Dec 31, 2019 Sept 30, 2020 Cash and Cash Equivalents 867 887 1,647 Total Debt 1 5,865 5,617 5,614 Total Equity 10,001 10,369 10,620 Debt to Adj. EBITDA 2 Trailing 12 - month 2.7x 2.4x 2.3x
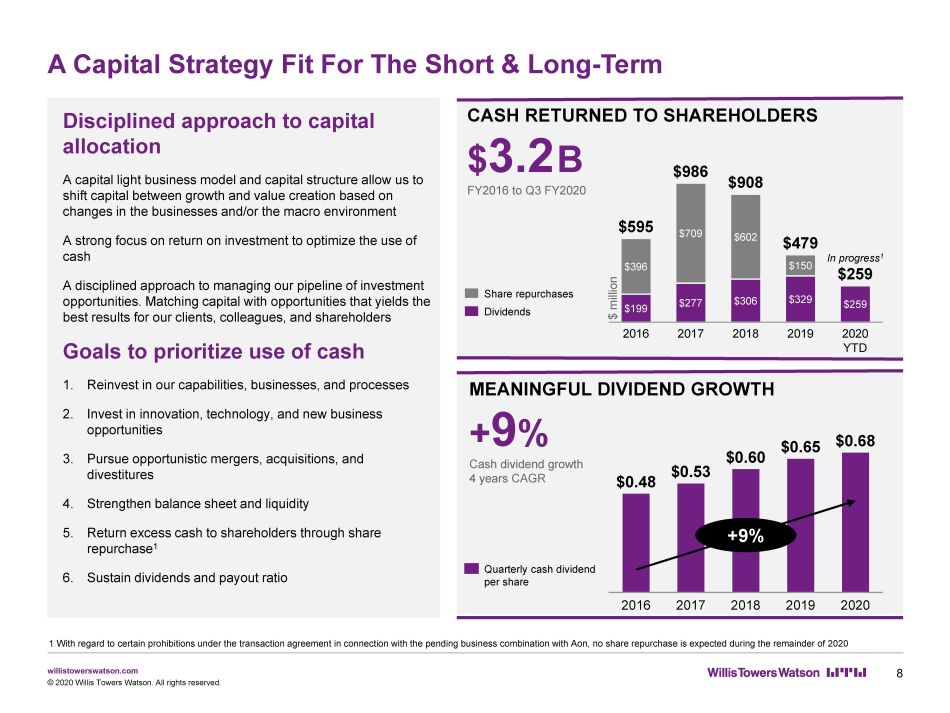
willistowerswatson.com A Capital Strategy Fit For The Short & Long - Term 8 © 2020 Willis Towers Watson. All rights reserved. CASH RETURNED TO SHAREHOLDERS $ 3.2 B FY2016 to Q3 FY2020 $ 396 $ 908 $ 602 $ 199 $ 595 $ 306 2017 2019 2016 $ 709 $ 277 2018 $ 150 $ 329 $ 259 2020 YTD $ 986 $ 479 In progress 1 $ 259 MEANINGFUL DIVIDEND GROWTH + 9 % Cash dividend growth 4 years CAGR $ 0.53 2020 2016 2017 2018 $ 0.60 2019 $ 0.68 $ 0.48 $ 0.65 Dividends Share repurchases Quarterly cash dividend per share +9% $ million Disciplined approach to capital allocation A capital light business model and capital structure allow us to shift capital between growth and value creation based on changes in the businesses and/or the macro environment A strong focus on return on investment to optimize the use of cash A disciplined approach to managing our pipeline of investment opportunities. Matching capital with opportunities that yields the best results for our clients, colleagues, and shareholders Goals to prioritize use of cash 1. Reinvest in our capabilities, businesses, and processes 2. Invest in innovation, technology, and new business opportunities 3. Pursue opportunistic mergers, acquisitions, and divestitures 4. Strengthen balance sheet and liquidity 5. Return excess cash to shareholders through share repurchase 1 6. Sustain dividends and payout ratio 1 With regard to certain prohibitions under the transaction agreement in connection with the pending business combination with Aon , no share repurchase is expected during the remainder of 2020
willistowerswatson.com © 2020 Willis Towers Watson. All rights reserved. 9 Client Winning Solutions Safeguard Our Business Our primary focus during this crisis has been and continues to be 1 Client Winning Solutions Willis Towers Watson is rising to meet our clients’ evolving needs during this extraordinary time. We are creating leading content and providing innovative solutions to help our clients address COVID - 19 related issues such as health and wellbeing program access, remote workforce management, complex claims and heightened risk exposures, and navigating the capital and liquidity uncertainty. 2 Colleague Health & Wellbeing The health and wellbeing of our colleagues, their families, and the communities we serve around the world continue to be our utmost priority and continue to be an important part of every decision we make. Despite the challenges, our colleagues around the world continue to acclimate to the new remote working environment, while simultaneously delivering the high quality services and solutions for our clients. 3 Safeguard Our Business We have a dedicated team with broad scope to reinforce our business fundamentals and safeguard the financial strength of Willis Towers Watson. The pandemic had a manageable impact on Willis Towers Watson’s demand and cash flow so far, but economic future developments remain difficult to predict. We continue to take a proactive approach to manage expenses, reinforce cash and liquidity, and monitor and plan for different scenarios to safeguard the future of Willis Towers Watson. Colleague Health & Wellbeing
willistowerswatson.com © 2020 Willis Towers Watson. All rights reserved. 10 Economic Outlook Remains Challenging & Unpredictable Proactively reinforcing financial management discipline Comprehensive Contingency Planning The pandemic has slowed growth in the short - term, especially for services that are considered discretionary for our clients, but we believe our business model remains resilient. Nevertheless, we are actively evaluating and planning. We are prepared to take swift actions, as necessary, to help mitigate adverse consequences and preserve cash and our margins in the event that we might sustain a prolonged negative impact to our operations Protecting Balance Sheet And Strengthening Liquidity The global nature of the pandemic had a profound impact on our clients and broadly reduced liquidity around the world. While the impact on Willis Towers Watson has been manageable, we are actively shifting our short - term financial management strategies to focus on protecting our balance sheet, maximizing financial flexibility, and securing access to capital Cash Discipline Across Opex , Capex, and Working Capital Willis Towers Watson’s effort to tightly manage discretionary spending and working capital is helping to limit COVID - 19’s financial impact so far. To that effect, we will continue to be disciplined and thoughtful about managing cost and capital to safeguard the future for Willis Towers Watson and our stakeholders
willistowerswatson.com willistowerswatson.com Appendix: Reconciliation of Non - GAAP Measures 11 © 2020 Willis Towers Watson. All rights reserved.
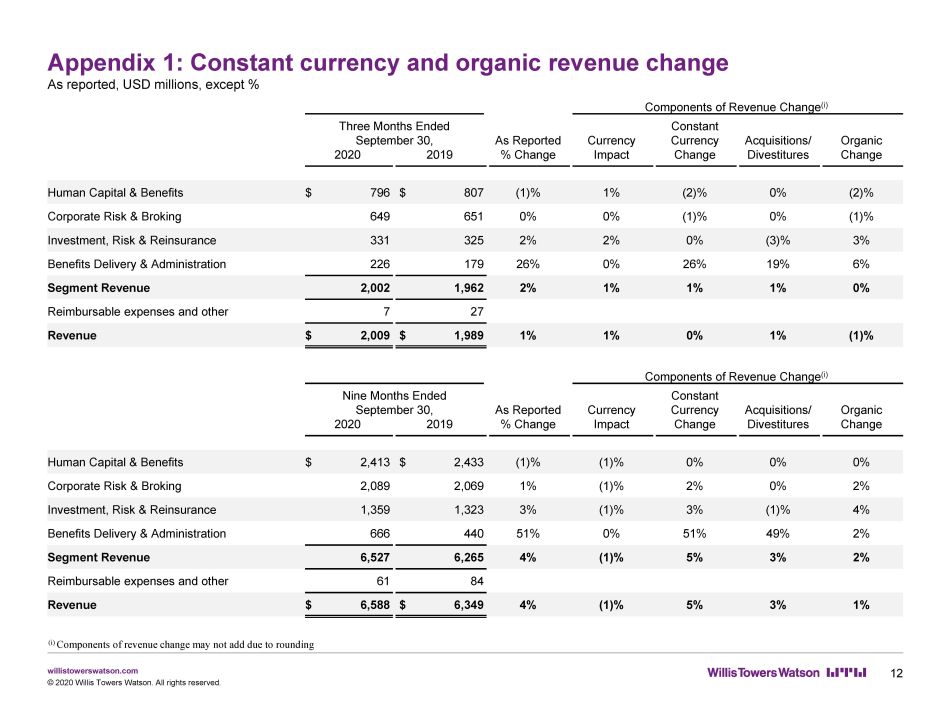
willistowerswatson.com Appendix 1: Constant currency and organic revenue change As reported, USD millions, except % 12 © 2020 Willis Towers Watson. All rights reserved. ( i ) Components of revenue change may not add due to rounding Components of Revenue Change ( i ) Three Months Ended September 30, As Reported Currency Constant Currency Acquisitions/ Organic 2020 2019 % Change Impact Change Divestitures Change Human Capital & Benefits $ 796 $ 807 (1)% 1% (2)% 0% (2)% Corporate Risk & Broking 649 651 0% 0% (1)% 0% (1)% Investment, Risk & Reinsurance 331 325 2% 2% 0% (3)% 3% Benefits Delivery & Administration 226 179 26% 0% 26% 19% 6% Segment Revenue 2,002 1,962 2% 1% 1% 1% 0% Reimbursable expenses and other 7 27 Revenue $ 2,009 $ 1,989 1% 1% 0% 1% (1)% Components of Revenue Change ( i ) Nine Months Ended September 30, As Reported Currency Constant Currency Acquisitions/ Organic 2020 2019 % Change Impact Change Divestitures Change Human Capital & Benefits $ 2,413 $ 2,433 (1)% (1)% 0% 0% 0% Corporate Risk & Broking 2,089 2,069 1% (1)% 2% 0% 2% Investment, Risk & Reinsurance 1,359 1,323 3% (1)% 3% (1)% 4% Benefits Delivery & Administration 666 440 51% 0% 51% 49% 2% Segment Revenue 6,527 6,265 4% (1)% 5% 3% 2% Reimbursable expenses and other 61 84 Revenue $ 6,588 $ 6,349 4% (1)% 5% 3% 1%

willistowerswatson.com Appendix 2: Adjusted operating income and margin, adjusted EBITDA and margin, free cash flow As reported, USD millions, except % 13 © 2020 Willis Towers Watson. All rights reserved. Three Months Ended September 30, 2020 2019 Income from operations $ 73 3.6 % $ 107 5.4 % Adjusted for certain items: Amortization 108 118 Transaction and integration expenses 42 6 Provision for significant litigation ( i ) 15 — Adjusted operating income $ 238 11.8 % $ 231 11.6 % Three Months Ended September 30, 2020 2019 Net Income $ 122 6.1 % $ 80 4.0 % Provision for income taxes 46 20 Interest expense 61 62 Depreciation 73 58 Amortization 108 118 Transaction and integration expenses 42 6 Provision for significant litigation ( i ) 15 — Gain on disposal of operations (85) — Adjusted EBITDA and Adjusted EBITDA Margin $ 382 19.0 % $ 344 17.3 % Nine Months Ended September 30, 2020 2019 Cash flows from operating activities $ 1,206 $ 620 Less: Additions to fixed assets and software for internal use (183) (175) Free Cash Flow $ 1,023 $ 445 Nine Months Ended September 30, 2020 2019 Income from operations $ 596 9.0 % $ 642 10.1 % Adjusted for certain items: Abandonment of long - lived asset 35 — Amortization 348 368 Transaction and integration expenses 65 12 Provision for significant litigation ( i ) 15 — Adjusted operating income $ 1,059 16.1 % $ 1,022 16.1 % Nine Months Ended September 30, 2020 2019 Net Income $ 537 8.2 % $ 552 8.2 % Provision for income taxes 199 125 Interest expense 184 172 Depreciation (ii) 238 171 Amortization 348 368 Transaction and integration expenses 65 12 Provision for significant litigation ( i ) 15 — Gain on disposal of operations (83) — Adjusted EBITDA and Adjusted EBITDA Margin $ 1,503 22.8 % $ 1,370 21.6 % ( i ) See ‘Willis Towers Watson Merger - Related Securities Litigation’ within Part 1, Note 13 in the Company’s Quarterly Report on Form 10 - Q for the quarter ended September 30, 2020. (ii) Includes abandonment of long - lived asset of $35 million for the nine months ended September 30, 2020.
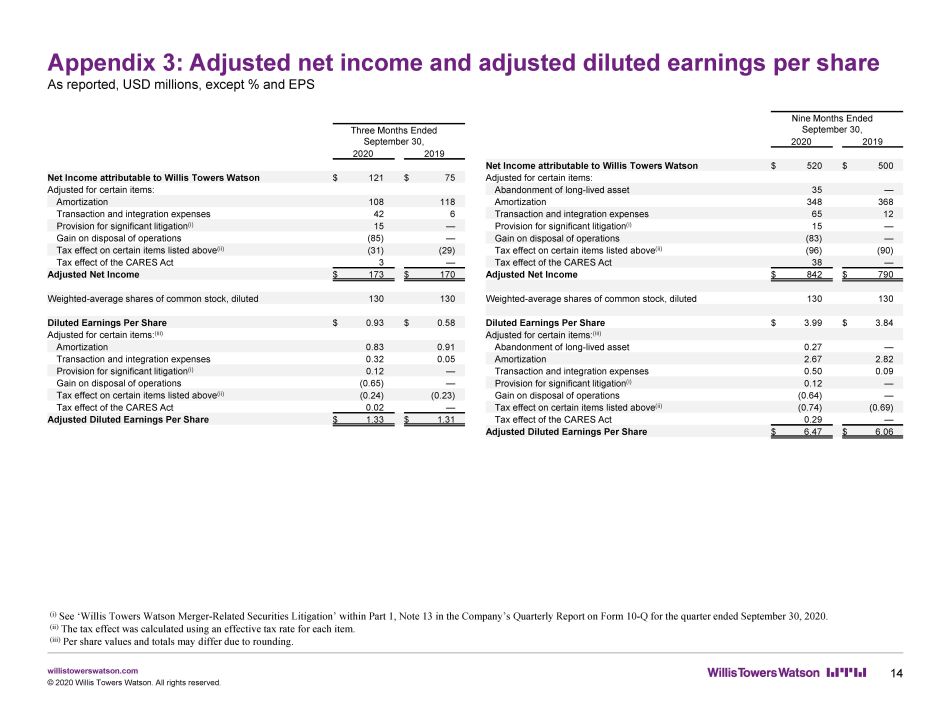
willistowerswatson.com Appendix 3: Adjusted net income and adjusted diluted earnings per share As reported, USD millions, except % and EPS 14 © 2020 Willis Towers Watson. All rights reserved. ( i ) See ‘Willis Towers Watson Merger - Related Securities Litigation’ within Part 1, Note 13 in the Company’s Quarterly Report on Form 10 - Q for the quarter ended September 30, 2020. (ii) The tax effect was calculated using an effective tax rate for each item. (iii) Per share values and totals may differ due to rounding. Three Months Ended September 30, 2020 2019 Net Income attributable to Willis Towers Watson $ 121 $ 75 Adjusted for certain items: Amortization 108 118 Transaction and integration expenses 42 6 Provision for significant litigation ( i ) 15 — Gain on disposal of operations (85) — Tax effect on certain items listed above (ii) (31) (29) Tax effect of the CARES Act 3 — Adjusted Net Income $ 173 $ 170 Weighted - average shares of common stock, diluted 130 130 Diluted Earnings Per Share $ 0.93 $ 0.58 Adjusted for certain items: (iii) Amortization 0.83 0.91 Transaction and integration expenses 0.32 0.05 Provision for significant litigation ( i ) 0.12 — Gain on disposal of operations (0.65) — Tax effect on certain items listed above (ii) (0.24) (0.23) Tax effect of the CARES Act 0.02 — Adjusted Diluted Earnings Per Share $ 1.33 $ 1.31 Nine Months Ended September 30, 2020 2019 Net Income attributable to Willis Towers Watson $ 520 $ 500 Adjusted for certain items: Abandonment of long - lived asset 35 — Amortization 348 368 Transaction and integration expenses 65 12 Provision for significant litigation ( i ) 15 — Gain on disposal of operations (83) — Tax effect on certain items listed above (ii) (96) (90) Tax effect of the CARES Act 38 — Adjusted Net Income $ 842 $ 790 Weighted - average shares of common stock, diluted 130 130 Diluted Earnings Per Share $ 3.99 $ 3.84 Adjusted for certain items: (iii) Abandonment of long - lived asset 0.27 — Amortization 2.67 2.82 Transaction and integration expenses 0.50 0.09 Provision for significant litigation ( i ) 0.12 — Gain on disposal of operations (0.64) — Tax effect on certain items listed above (ii) (0.74) (0.69) Tax effect of the CARES Act 0.29 — Adjusted Diluted Earnings Per Share $ 6.47 $ 6.06
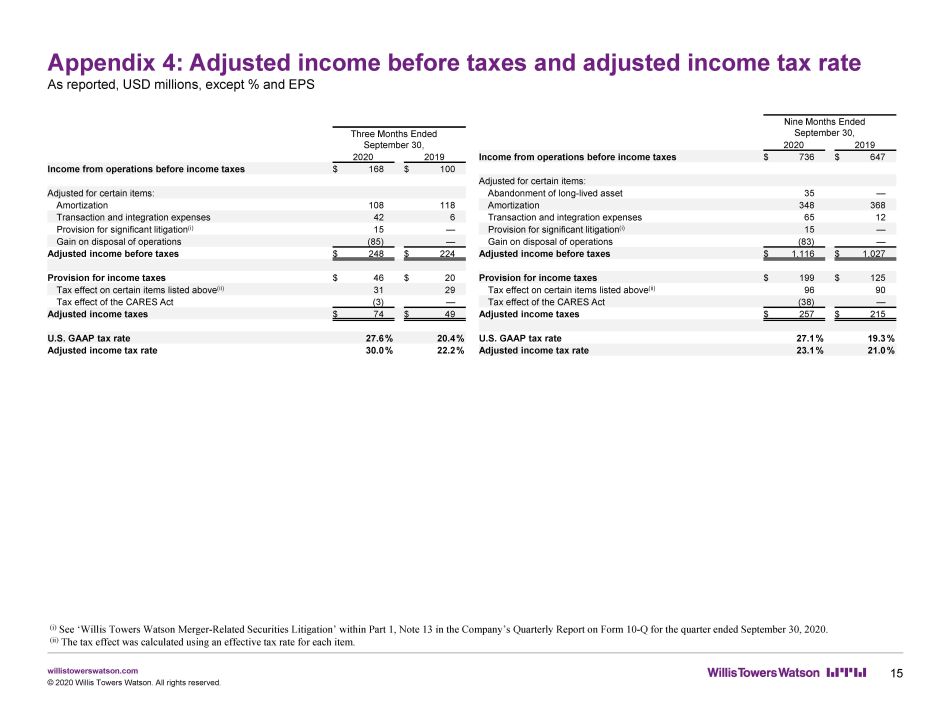
willistowerswatson.com Appendix 4: Adjusted income before taxes and adjusted income tax rate As reported, USD millions, except % and EPS 15 © 2020 Willis Towers Watson. All rights reserved. Three Months Ended September 30, 2020 2019 Income from operations before income taxes $ 168 $ 100 Adjusted for certain items: Amortization 108 118 Transaction and integration expenses 42 6 Provision for significant litigation ( i ) 15 — Gain on disposal of operations (85) — Adjusted income before taxes $ 248 $ 224 Provision for income taxes $ 46 $ 20 Tax effect on certain items listed above (ii) 31 29 Tax effect of the CARES Act (3) — Adjusted income taxes $ 74 $ 49 U.S. GAAP tax rate 27.6 % 20.4 % Adjusted income tax rate 30.0 % 22.2 % Nine Months Ended September 30, 2020 2019 Income from operations before income taxes $ 736 $ 647 Adjusted for certain items: Abandonment of long - lived asset 35 — Amortization 348 368 Transaction and integration expenses 65 12 Provision for significant litigation ( i ) 15 — Gain on disposal of operations (83) — Adjusted income before taxes $ 1,116 $ 1,027 Provision for income taxes $ 199 $ 125 Tax effect on certain items listed above (ii) 96 90 Tax effect of the CARES Act (38) — Adjusted income taxes $ 257 $ 215 U.S. GAAP tax rate 27.1 % 19.3 % Adjusted income tax rate 23.1 % 21.0 % ( i ) See ‘Willis Towers Watson Merger - Related Securities Litigation’ within Part 1, Note 13 in the Company’s Quarterly Report on Form 10 - Q for the quarter ended September 30, 2020. (ii) The tax effect was calculated using an effective tax rate for each item.
willistowerswatson.com About Willis Towers Watson Willis Towers Watson (NASDAQ: WLTW) is a leading global advisory, broking and solutions company that helps clients around the world turn risk into a path for growth. With roots dating to 1828, Willis Towers Watson has more than 45,000 employees and services clients in more than 140 countries. We design and deliver solutions that manage risk, optimize benefits, cultivate talent, and expand the power of capital to protect and strengthen institutions and individuals. Our unique perspective allows us to see the critical intersections between talent, assets and ideas — the dynamic formula that drives business performance. Together, we unlock potential. Learn more at willistowerswatson.com. © 2020 Willis Towers Watson. All rights reserved.