Attached files
| file | filename |
|---|---|
| 8-K - 8-K - UNITED STATES STEEL CORP | x-20201029.htm |

Third Quarter 2020 Earnings Presentation October 29, 2020 www.ussteel.com Advanced high strength steel for customer light weighting

Forward-looking Statements These slides are being provided to assist readers in understanding the results of operations, financial condition and cash flows of United States Steel Corporation for the third quarter of 2020. They should be read in conjunction with the consolidated financial statements and Notes to the Consolidated Financial Statements contained in our Annual Report on Form 10-K and Quarterly Report on Form 10-Q filed with the Securities and Exchange Commission. This presentation contains information that may constitute "forward-looking statements" within the meaning of Section 27A of the Securities Act of 1933, as amended, and Section 21E of the Securities Exchange Act of 1934, as amended. We intend the forward-looking statements to be covered by the safe harbor provisions for forward-looking statements in those sections. Generally, we have identified such forward- looking statements by using the words “believe,” “expect,” “intend,” “estimate,” “anticipate,” “project,” “target,” “forecast,” “aim,” "should," “will,” "may" and similar expressions or by using future dates in connection with any discussion of, among other things, operating performance, trends, events or developments that we expect or anticipate will occur in the future, statements relating to volume changes, share of sales and earnings per share changes, anticipated cost savings, potential capital and operational cash improvements, U. S. Steel's future ability or plans to take ownership of the Big River Steel joint venture as a wholly owned subsidiary, and statements expressing general views about future operating results. However, the absence of these words or similar expressions does not mean that a statement is not forward-looking. Forward-looking statements are not historical facts, but instead represent only the Company’s beliefs regarding future events, many of which, by their nature, are inherently uncertain and outside of the Company’s control. It is possible that the Company’s actual results and financial condition may differ, possibly materially, from the anticipated results and financial condition indicated in these forward looking statements. Management believes that these forward-looking statements are reasonable as of the time made. However, caution should be taken not to place undue reliance on any such forward-looking statements because such statements speak only as of the date when made. Our Company undertakes no obligation to publicly update or revise any forward looking statements, whether as a result of new information, future events or otherwise, except as required by law. In addition, forward-looking statements are subject to certain risks and uncertainties that could cause actual results to differ materially from our Company's historical experience and our present expectations or projections. These risks and uncertainties include, but are not limited to the risks and uncertainties described in “Item 1A. Risk Factors” in our Annual Report on Form 10-K for the year ended December 31, 2019, our Quarterly Reports on Form 10-Q, and those described from time to time in our future reports filed with the Securities and Exchange Commission. References to "we," "us," "our," the "Company," and "U. S. Steel," refer to United States Steel Corporation and its consolidated subsidiaries. 2
Explanation of Use of Non-GAAP Measures We present adjusted net (loss) earnings, adjusted net (loss) earnings per diluted share, (loss) earnings before interest, income taxes, depreciation and amortization (EBITDA) and adjusted EBITDA, which are non-GAAP measures, as additional measurements to enhance the understanding of our operating performance. We believe that EBITDA and segment EBITDA, considered along with net (loss) earnings and segment (loss) earnings before interest and income taxes, are relevant indicators of trends relating to our operating performance and provide management and investors with additional information for comparison of our operating results to the operating results of other companies. Net debt is a non-GAAP measure calculated as total debt less cash and cash equivalents. We believe net debt is a useful measure in calculating enterprise value. Both EBITDA and net debt are used by analysts to refine and improve the accuracy of their financial models which utilize enterprise value. Adjusted net (loss) earnings and adjusted net (loss) earnings per diluted share are non-GAAP measures that exclude the effects of items such as the asset impairment charge, restructuring and other charges, the gain on previously held investment in UPI, the Tubular inventory impairment, the December 24, 2018 Clairton coke making facility fire, the Big River Steel options mark to market and the FIN 48 reserve that are not part of the Company's core operations (Adjustment Items). Adjusted EBITDA is also a non-GAAP measure that excludes the financial effects of the Adjustment Items. We present adjusted net (loss) earnings, adjusted net (loss) earnings per diluted share and adjusted EBITDA to enhance the understanding of our ongoing operating performance and established trends affecting our core operations, by excluding the Adjustment Items. U. S. Steel's management considers adjusted net (loss) earnings, adjusted net (loss) earnings per diluted share and adjusted EBITDA as alternative measures of operating performance and not alternative measures of the Company's liquidity. U. S. Steel’s management considers adjusted net (loss) earnings, adjusted net (loss) earnings per diluted share and adjusted EBITDA useful to investors by facilitating a comparison of our operating performance to the operating performance of our competitors. Additionally, the presentation of adjusted net (loss) earnings, adjusted net (loss) earnings per diluted share and adjusted EBITDA provides insight into management’s view and assessment of the Company’s ongoing operating performance, because management does not consider the Adjustment Items when evaluating the Company’s financial performance. Adjusted net (loss) earnings, adjusted net (loss) earnings per diluted share and adjusted EBITDA should not be considered a substitute for net (loss) earnings, (loss) earnings per diluted share or other financial measures as computed in accordance with U.S. GAAP and is not necessarily comparable to similarly titled measures used by other companies. 3

“BEST OF BOTH” STRATEGY EXECUTION UPDATE Electric arc furnace at Fairfield Tubular

“Best of Both” strategy executing on key strategic actions World competitive positioning in strategic, high-margin end markets Unparalleled product platform to serve 1 customers Big River will unlock value across our entire footprint1 Transforms business to drive long term cash flow through industry cycles 1 Following U. S. Steel’s acquisition of the remaining 50.1% interest in Big River Steel within the next three years. 5

“Best of Both” strategy successful start-up of the Fairfield EAF Insourcing EAF to supply rounds the substrate for production seamless pipe Expected cost savings per ton of $90 seamless pipe / ton produced Able to be more Electric Arc Furnace Agile responsive and at Fairfield Tubular production agile to customers’ needs 6
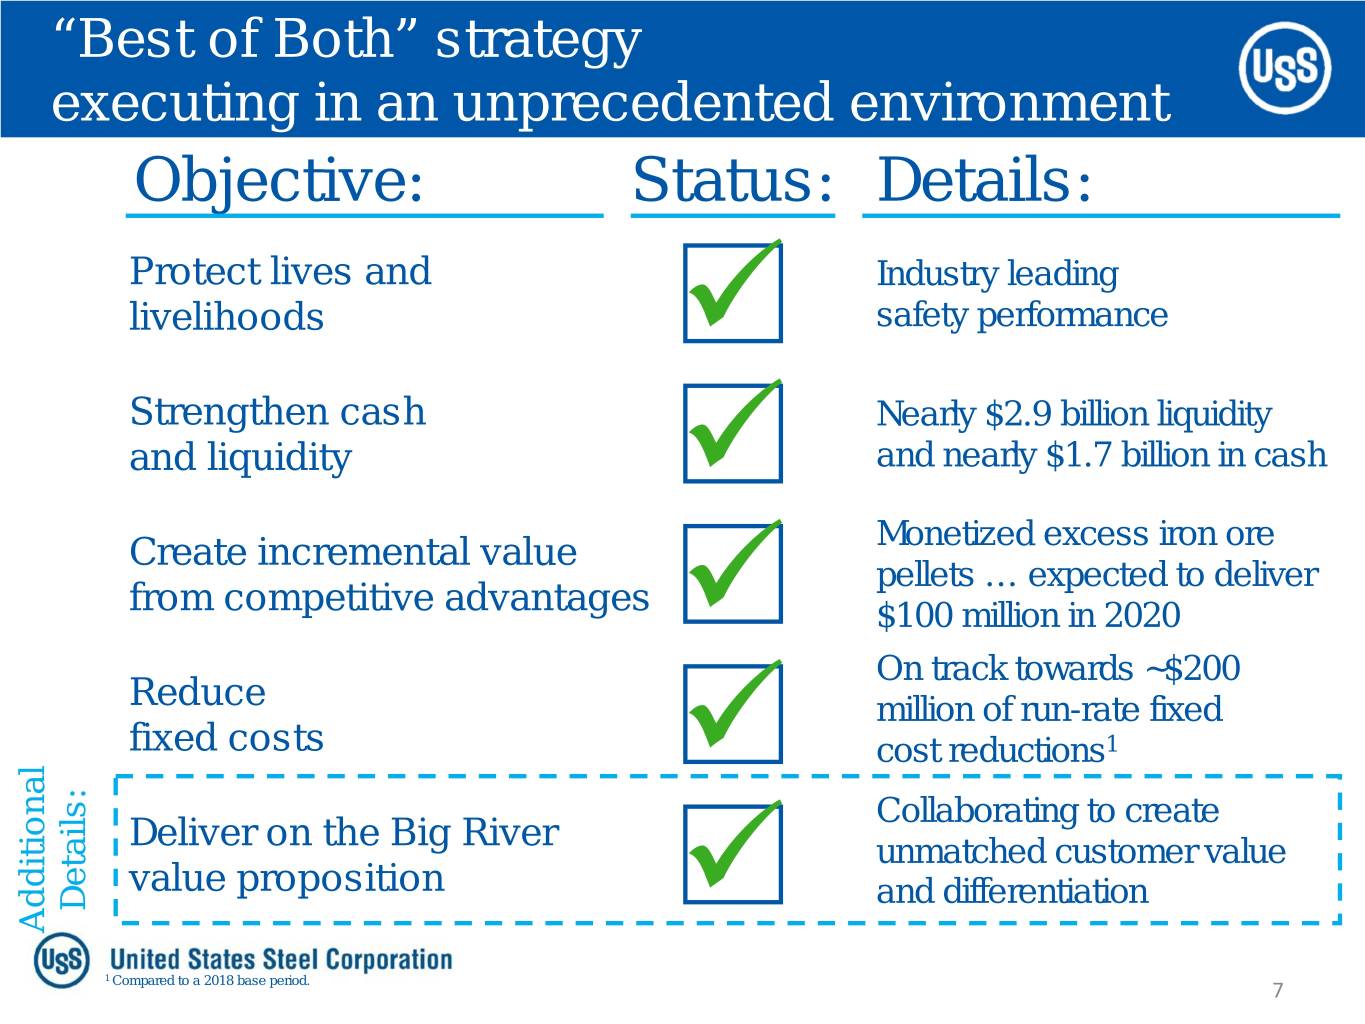
“Best of Both” strategy executing in an unprecedented environment Objective: Status: Details: Protect lives and Industry leading livelihoods safety performance Strengthen cash Nearly $2.9 billion liquidity and liquidity and nearly $1.7 billion in cash Monetized excess iron ore Create incremental value pellets … expected to deliver from competitive advantages $100 million in 2020 On track towards ~$200 Reduce million of run-rate fixed fixed costs cost reductions1 Collaborating to create Deliver on the Big River unmatched customer value value proposition Details: and differentiation Additional 1 Compared to a 2018 base period. 7

BIG RIVER STEEL: 1 YEAR ANNIVERSARY

Big River Steel delivering on the value proposition Delivering on the Step-1 value proposition: Combining U. S. Steel R&D and Big River technology to The product qualities The U. S. Steel grades expand product capabilities wewe have have successfully achieved for customers workingproduced closely at Big River with …U. just S. Steelin year clearly one … validateare already the tremendous exceeding Helping customers benefitsthe team’s created expectations. by the achieve low-carbon goals ‘Best of Both’ strategy. Creating an unmatched customer value proposition David Stickler across strategic end markets CEO, Big River Steel 9

Big River Steel delivering on the value proposition Proof points of value creation: 11 1 ~2 Steel grades1 Only LEED certified Months ahead of steel production globally2 schedule Collaborating on steel Positioned to ultimately Superior project grades, including substrate meet customers’ management and for our grades of demand for green steels efficient production GEN3 advanced high through Big River Steel’s capability strength steels steelmaking operations 1 Successfully run and are in qualification. 10 2 Source: Big River Steel 2019 Corporate Social Responsibility Report.

Big River Steel doubling capacity and enhancing efficiencies Doubling steelmaking capacity from 1.65mnt to 3.3mnt1 Only adding ~100 more employees to create significant operating leverage First Phase Two coil expected in November 2020 1 mnt = million net tons; annual steelmaking capacity. 11

BUSINESS UPDATE

Supporting improved customer demand visibility into 2021 Our automotive order book is strong and auto production should Automotive remain high. Vehicle sales are expected to increase a 6th straight month and inventories are at a low 50 days (year ago = 66 days). Construction remains resilient. Customers are not seeing a market - rolled slowdown in forward demand into winter. Construction - Construction spend is exceeding pre-COVID-19 levels (up 2.5% y-o-y1). end Flat Low appliance inventories are expected to support healthy N. American N. Appliance production through at least year-end. Despite COVID-19, AHAM2 suggests 2020 unit sales should exceed 2019 levels. Similar to the U.S. market, European auto demand accelerated Automotive through 3Q. Our auto order book into 4Q suggests continued strength from this important end-market. Resilient construction demand in today’s COVID-19 market - Construction environment, but still reduced compared to last year. Europe end U. S. U. S. Steel Appliance demand is approaching pre-COVID-19 levels. Demand Appliance for appliance OEMs remains strong within our order book. Oil prices have stabilized around $40/barrel and we expect slow but steady improvement in rig count through 4Q, however no market Oil & gas , - major catalyst to demand improvement expected near-term as drillers look to manage inventory into year-end. Tubular end 1 2 y-o-y = year-over-year performance. AHAM = Association of Home Appliance Manufacturers. 13 Sources: Wards / Census Bureau / AHAM / IHS / Eurofer / Bloomberg.

Supporting improved customer demand sustainable market conditions Strong customer demand and low The reasons customer inventories we are confident Inventory restocks expected to support winter steel demand Long lead times give us visibility into 2021 14

Supporting improved customer demand informed by our order book Operating Idled Indefinitely Idled Total Idled Capacity1 Iron ore pellets Minntac Keetac2 6.02 22.4 rolled Clairton cokemaking Extended coking times – 4.3 - Gary BF #4 BF #6 BF #8 BF #14 1.5 7.5 Granite City BF ‘A’ BF ‘B’ 1.4 2.8 Great Lakes3 BF ‘A1’ BF ‘B2’ BF ‘D4’ 3.8 3.8 N.American Flat Mon Valley BF #1 BF #3 – 2.9 Kosice BF #1 BF #24 BF #34 1.7 5.0 Europe Fairfield EAF steelmaking / seamless pipe – 0.75 Lorain #3 seamless pipe 0.38 0.38 Tubular Lone Star #1 ERW #2 ERW 0.79 0.79 1 Raw steel capacity, except at Minntac and Keetac (iron ore pellet capacity), Clairton (coke capacity), and Fairfield, Lorain, and Lone Star (pipe capacity). 2 Evaluating a potential restart of Keetac by year-end. 3 Great Lakes D4 blast furnace idled as of April 2020; blast furnace A1/B2 previously idled. 15 4 Replacing BF #3 with BF #2 to improve operating efficiency. Three blast furnaces are temporarily operating as we transition back to a two blast furnace configuration in November.

“Best of Both” strategy strategic projects status Strategic Projects Status Details First arc in October. EAF to supply EAF at Tubular rounds for our seamless pipe production. Purchasing equipment and expect to Endless Casting and draw on our export credit agreement in Rolling at Mon Valley Status Update 2021. Continuing capability upgrades in Gary Hot Strip Mill conjunction with planned outages. Status Update Project delayed for an indeterminate Dynamo Line at USSK period of time. Currently expect 2021 capital spending to be ~$675 million 16

THIRD QUARTER UPDATE
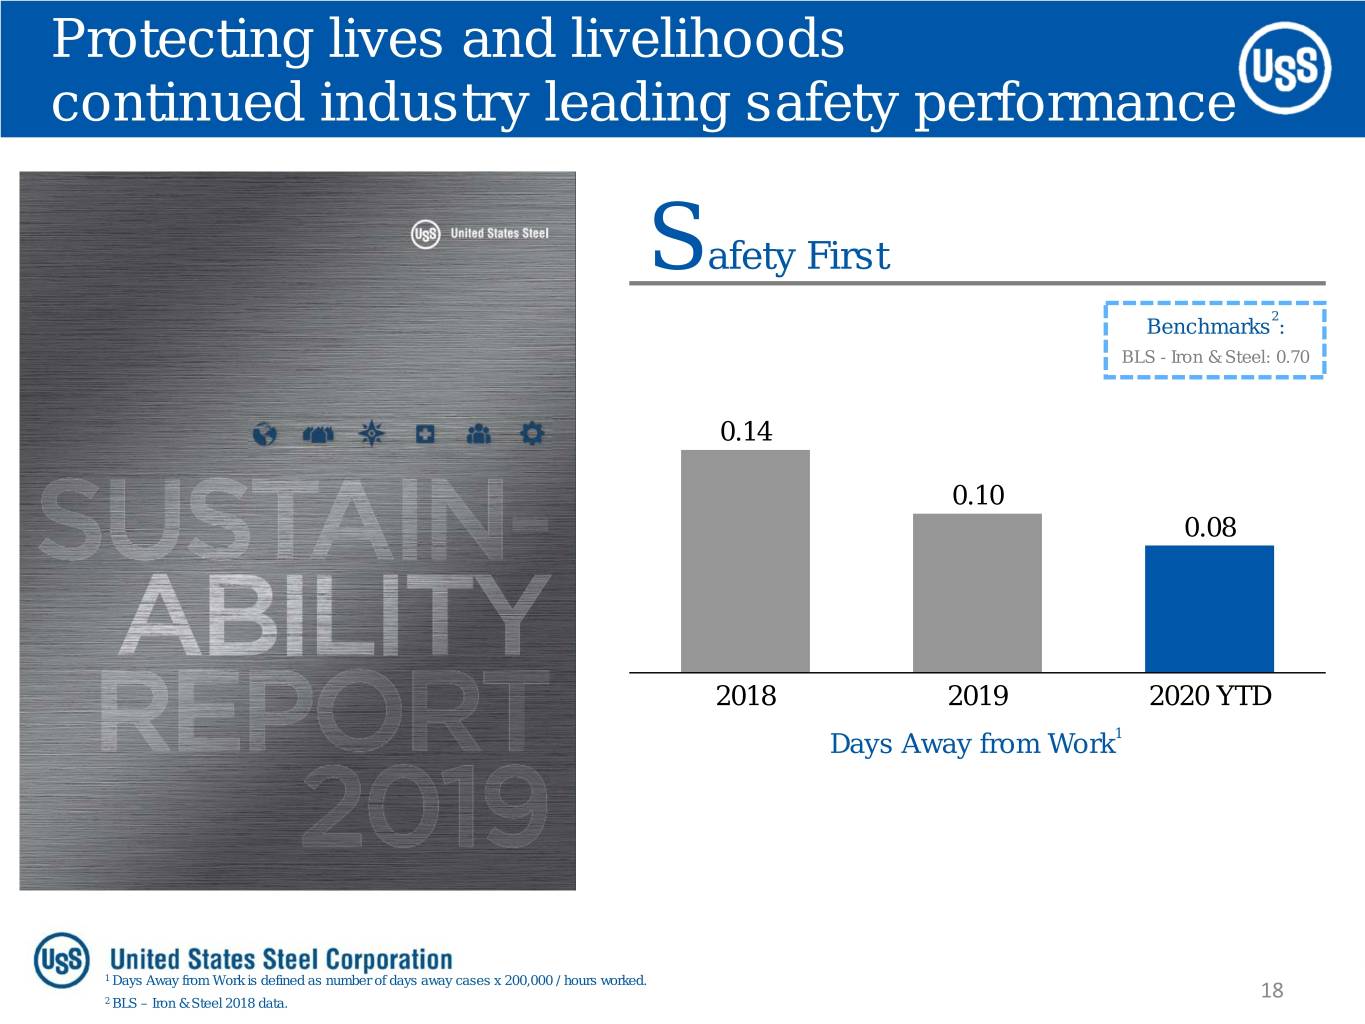
Protecting lives and livelihoods continued industry leading safety performance Safety First 2 Benchmarks : BLS - Iron & Steel: 0.70 0.14 0.10 0.08 2018 2019 2020 YTD Days Away from Work1 1 Days Away from Work is defined as number of days away cases x 200,000 / hours worked. 18 2 BLS – Iron & Steel 2018 data.

Third quarter 2020 financial highlights Reported Net (Loss) Earnings $ Millions Adjusted Net (Loss) Earnings $ Millions ($84) ($35) ($109) ($123) ($234) ($391) ($268) ($589) ($680) ($469) 3Q 2019 4Q 2019 1Q 2020 2Q 2020 3Q 2020 3Q 2019 4Q 2019 1Q 2020 2Q 2020 3Q 2020 Adjusted Profit (3%) (24%) (14%) (28%) (10%) Profit (1%) (4%) (4%) (22%) (11%) Margin: Margin: Segment EBIT1 $ Millions Adjusted EBITDA2 $ Millions $144 $64 ($17) $4 ($96) ($158) ($211) ($49) ($423) ($264) 3Q 2019 4Q 2019 1Q 2020 2Q 2020 3Q 2020 3Q 2019 4Q 2019 1Q 2020 2Q 2020 3Q 2020 Segment Adjusted EBIT (1%) (6%) (3%) (20%) (9%) EBITDA 5% 0% 2% (13%) (2%) Margin1: Margin2: Note: For reconciliation of non-GAAP amounts see Appendix 1 Earnings before interest and income taxes. 19 2 Earnings before interest, income taxes, depreciation and amortization, and excluding adjustment items.

Flat-rolled segment Key Segment Statistics Segment EBITDA $ Millions $167 3Q 4Q 1Q 2Q 3Q $86 $42 2019 2019 2020 2020 2020 Shipments: 2,654 2,517 2,509 1,790 2,155 ($33) in 000s, net tons Production: 2,783 2,567 3,148 1,468 2,207 ($203) in 000s, net tons 3Q 2019 4Q 2019 1Q 2020 2Q 2020 3Q 2020 Average Selling Price $732 $699 $711 $721 $712 EBITDA $ / net ton 7% 2% 4% (13%) (2%) Margin: Select End – Market Indicators1 EBITDA Bridge 3Q 2019 vs. 3Q 2020 Automotive September auto sales at a SAAR2 of 16.34 million. Five months $167 of consecutive increase. ($251) ($33) $23 Construction $9 $19 August construction spending up 2.5% versus last year, 3Q Commercial Raw Maintenance Other 3Q largely driven by residential construction. 2019 Materials & Outage 2020 Commercial: The unfavorable impact is primarily the result of Appliance decreased volumes and lower average realized prices. Record 3Q sales of major appliance units. Up 8.4% versus 3Q Raw Materials: The favorable impact is primarily the result of 2019 and up 19% compared to 2Q. lower costs for coking coal and purchased scrap offset by higher blast furnace fuel costs for banked blast furnaces. Maintenance & Outage: The favorable impact is primarily the result of fewer planned outages. Other: The favorable impact is primarily the result of lower energy costs as well as reduced SG&A costs. 1 Source: Wards, Dodge, AHAM. 20 2 SAAR = seasonally adjusted annual rate.

U. S. Steel Europe segment Key Segment Statistics Segment EBITDA $ Millions $39 3Q 4Q 1Q 2Q 3Q 2019 2019 2020 2020 2020 $9 Shipments: 765 757 801 610 790 in 000s, net tons ($7) ($3) Production: 823 773 882 645 873 ($23) in 000s, net tons 3Q 2019 4Q 2019 1Q 2020 2Q 2020 3Q 2020 Average Selling Price $656 $622 $611 $632 $608 EBITDA $ / net ton (4%) (1%) 2% (1%) 8% Margin: Select End – Market Indicators1 EBITDA Bridge 3Q 2019 vs. 3Q 2020 Automotive $28 $39 V42 car production outpacing the broader EU. EU car $26 production expected to decline 25% y-o-y in 2020. The V4 ($23) region is projected to decline 21% y-o-y in 2020. ($48) $56 Construction In 2020, the construction sector is expected to decline by 9% 3Q Commercial Raw Maintenance Other 3Q 2019 Materials & Outage 2020 y-o-y. Commercial: The unfavorable impact is primarily the result of Appliance lower average realized prices. The EU appliance sector is expected to decline by at least 11% y-o-y. Raw Materials: The favorable impact is primarily the result of lower costs for iron ore pellets and coking coal. Maintenance & Outage: The favorable impact is primarily the result of cost control measures and fewer planned outages. Other: The favorable impact is primarily the result of favorable foreign exchange rates, lower energy costs, and a significant portion of an annual electricity cost compensation rebate. 1 Source: IHS, Euroconstruct, Eurofer. 21 2 Visegrad Group – Czech Republic, Hungary, Poland, and Slovakia.

Tubular segment Key Segment Statistics Segment EBITDA $ Millions 3Q 4Q 1Q 2Q 3Q 2019 2019 2020 2020 2020 ($14) Shipments: 174 193 187 132 71 in 000s, net tons ($34) ($35) Average Selling Price ($40) $1,417 $1,298 $1,283 $1,288 $1,230 ($44) $ / net ton 3Q 2019 4Q 2019 1Q 2020 2Q 2020 3Q 2020 EBITDA Margin: (5%) (13%) (14%) (22%) (46%) Select End – Market Indicators1 EBITDA Bridge 3Q 2019 vs. 3Q 2020 Oil Prices ($14) West Texas Intermediate oil price at ~$37/barrel2, down ~38% ($44) since the end of 2019. ($28) $6 ($5) Imports ($3) During 3Q, import share of OCTG apparent market demand 3Q Commercial Raw Maintenance Other 3Q is projected to be approximately 36%. 2019 Materials & Outage 2020 Commercial: The unfavorable impact is primarily the result of OCTG Inventory decreased volumes and lower average realized prices. Overall, OCTG supply chain inventory is approximately 15 months. Raw Materials: The change is not material. Maintenance & Outage: The favorable impact is primarily the result of fewer planned outages. Other: The unfavorable impact is primarily the result of idled plant carrying costs. 1 Source: Bloomberg, US Department of Commerce, Preston Publishing. 22 2 as of October 28, 2020.

Cash and liquidity Cash from Operations $ Millions Cash and Cash Equivalents $ Millions $938 $1,696 $826 $1,515 $1,553 $754 $682 $1,000 $749 ($149) YE 2016 YE 2017 YE 2018 YE 2019 9M 2020 YE 2016 YE 2017 YE 2018 YE 2019 9M 2020 Total Estimated Liquidity $ Millions Net Debt $ Millions $3,350 $3,194 $2,899 $2,830 $2,864 $2,892 $2,284 $1,516 $1,381 $1,150 YE 2016 YE 2017 YE 2018 YE 2019 9M 2020 YE 2016 YE 2017 YE 2018 YE 2019 9M 2020 23
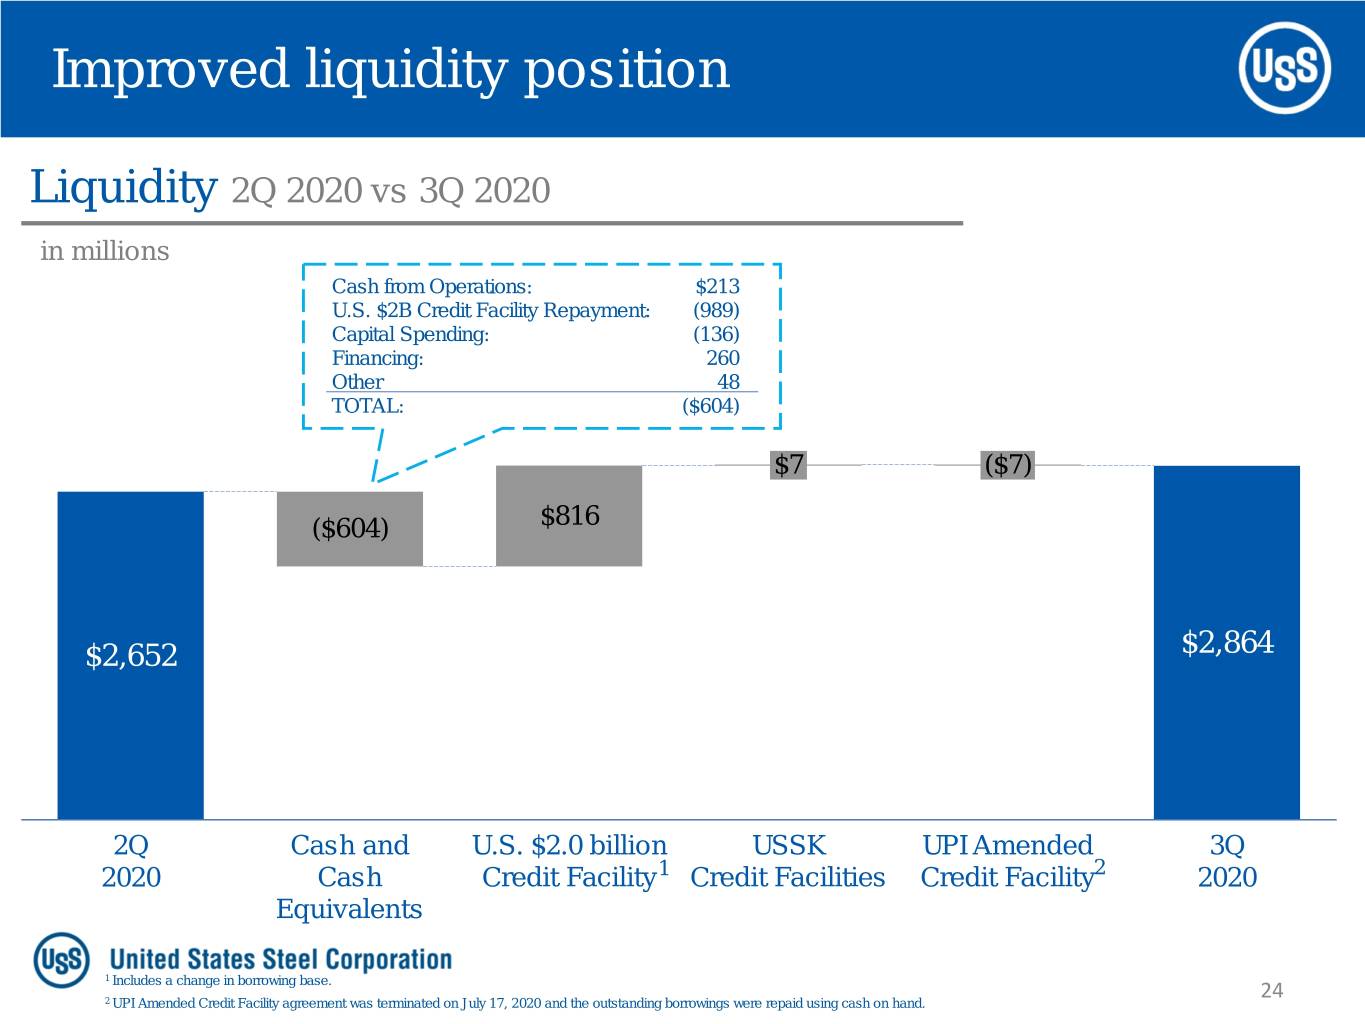
Improved liquidity position Liquidity 2Q 2020 vs 3Q 2020 in millions Cash from Operations: $213 U.S. $2B Credit Facility Repayment: (989) Capital Spending: (136) Financing: 260 Other 48 TOTAL: ($604) $7 ($7) ($604) $816 $2,652 $2,864 2Q Cash and U.S. $2.0 billion USSK UPI Amended 3Q 2020 Cash Credit Facility1 Credit Facilities Credit Facility2 2020 Equivalents 1 Includes a change in borrowing base. 24 2 UPI Amended Credit Facility agreement was terminated on July 17, 2020 and the outstanding borrowings were repaid using cash on hand.

APPENDIX
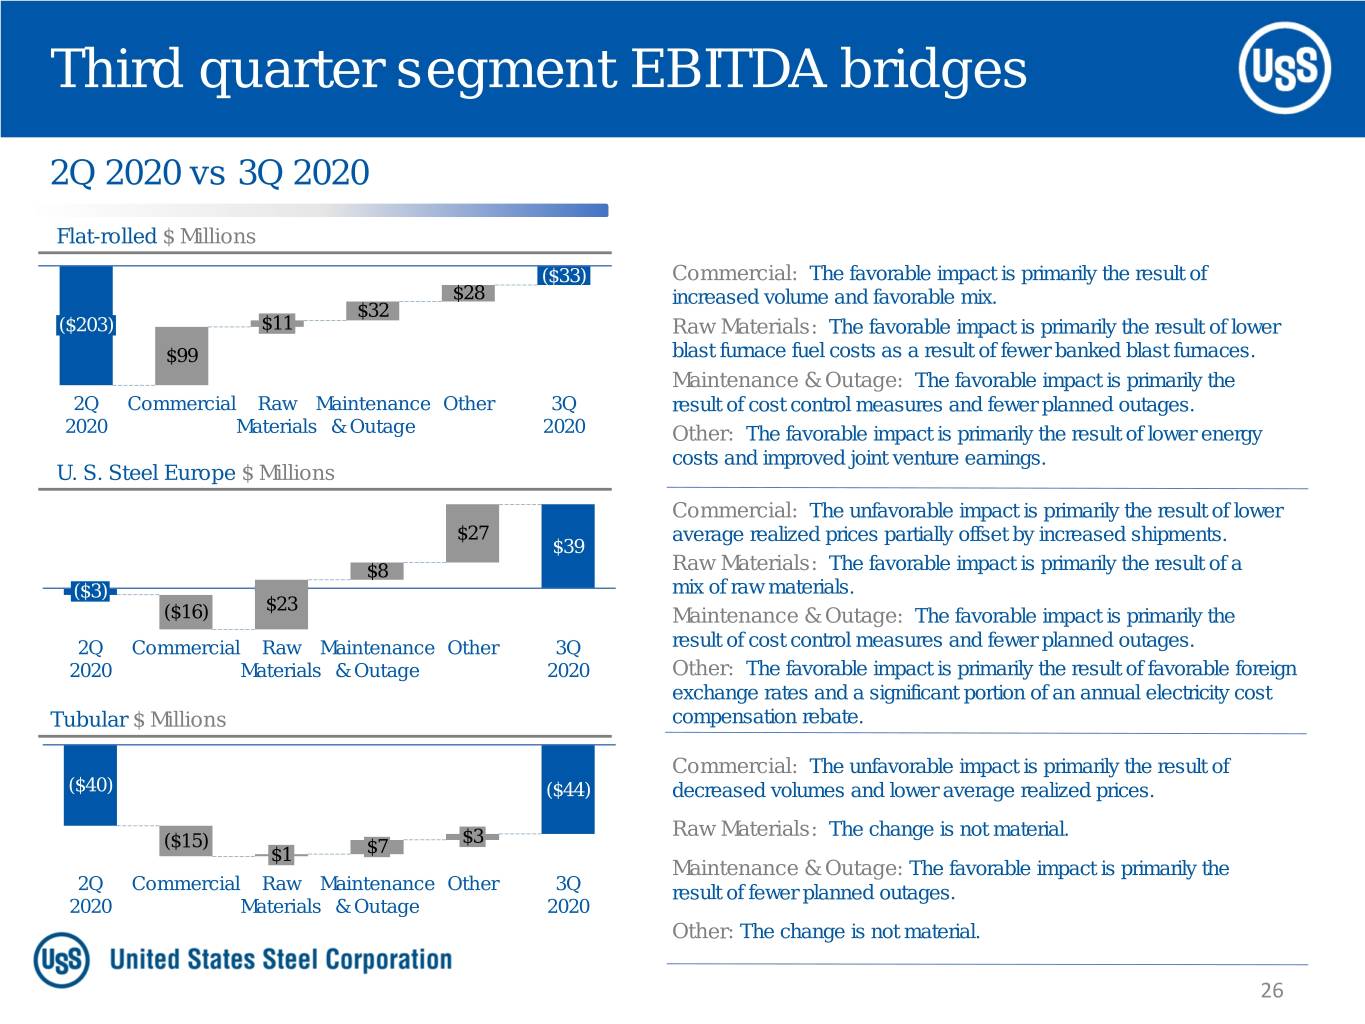
Third quarter segment EBITDA bridges 2Q 2020 vs 3Q 2020 Flat-rolled $ Millions ($33) Commercial: The favorable impact is primarily the result of $28 increased volume and favorable mix. $32 ($203) $11 Raw Materials: The favorable impact is primarily the result of lower $99 blast furnace fuel costs as a result of fewer banked blast furnaces. Maintenance & Outage: The favorable impact is primarily the 2Q Commercial Raw Maintenance Other 3Q result of cost control measures and fewer planned outages. 2020 Materials & Outage 2020 Other: The favorable impact is primarily the result of lower energy costs and improved joint venture earnings. U. S. Steel Europe $ Millions Commercial: The unfavorable impact is primarily the result of lower $27 average realized prices partially offset by increased shipments. $39 $8 Raw Materials: The favorable impact is primarily the result of a ($3) mix of raw materials. $23 ($16) Maintenance & Outage: The favorable impact is primarily the 2Q Commercial Raw Maintenance Other 3Q result of cost control measures and fewer planned outages. 2020 Materials & Outage 2020 Other: The favorable impact is primarily the result of favorable foreign exchange rates and a significant portion of an annual electricity cost Tubular $ Millions compensation rebate. Commercial: The unfavorable impact is primarily the result of ($40) ($44) decreased volumes and lower average realized prices. Raw Materials: The change is not material. ($15) $3 $1 $7 Maintenance & Outage: The favorable impact is primarily the 2Q Commercial Raw Maintenance Other 3Q result of fewer planned outages. 2020 Materials & Outage 2020 Other: The change is not material. 26

Total corporation adjusted EBITDA bridges 3Q 2019 vs 3Q 2020 $ Millions 3Q 2019 vs 3Q 2020 $ Millions $144 $144 ($327) ($49) ($200) $21 $51 ($30) $62 $62 ($25) ($49) 3Q Commercial Raw Maintenance Other 3Q 3Q Flat- U. S. Steel Tubular Other 3Q 2019 Materials & Outage 2020 2019 rolled Europe 2020 2Q 2020 vs. 3Q 2020 $ Millions 2Q 2020 vs. 3Q 2020 $ Millions ($49) ($49) ($4) $7 $65 $42 ($264) $47 ($264) $35 $170 $68 2Q Commercial Raw Maintenance Other 3Q 2Q Flat- U. S. Steel Tubular Other 3Q 2020 Materials & Outage 2020 2020 rolled Europe 2020 27

Reconciliation of segment EBITDA Flat-rolled ($millions) 3Q 2019 4Q 2019 1Q 2020 2Q 2020 3Q 2020 Segment (loss) earnings before interest and income taxes $46 ($79) ($35) ($329) ($159) Depreciation 121 121 121 126 126 Flat-rolled Segment EBITDA $167 $42 $86 ($203) ($33) U. S. Steel Europe ($ millions) 3Q 2019 4Q 2019 1Q 2020 2Q 2020 3Q 2020 Segment (loss) earnings before interest and income taxes ($46) ($30) ($14) ($26) $13 Depreciation 23 23 23 23 26 U. S. Steel Europe Segment EBITDA ($23) ($7) $9 ($3) $39 Tubular ($ millions) 3Q 2019 4Q 2019 1Q 2020 2Q 2020 3Q 2020 Segment (loss) earnings before interest and income taxes ($25) ($46) ($48) ($47) ($52) Depreciation 11 12 13 7 8 Tubular Segment EBITDA ($14) ($34) ($35) ($40) ($44) Other Businesses ($ millions) 3Q 2019 4Q 2019 1Q 2020 2Q 2020 3Q 2020 Segment (loss) earnings before interest and income taxes $8 ($3) $1 ($21) ($13) Depreciation 6 6 3 3 2 Other Businesses Segment EBITDA $14 $3 $4 ($18) ($11) 28

Reconciliation of net debt Net Debt YE 2016 YE 2017 YE 2018 YE 2019 9M 2020 ($ millions) Short-term debt and current maturities of long-term $50 $3 $65 $14 $262 debt Long-term debt, less unamortized discount and debt 2,981 2,700 2,316 3,627 4,628 issuance costs Total Debt $3,031 $2,703 $2,381 $3,641 $4,890 Less: Cash and cash equivalents 1,515 1,553 1,000 749 1,696 Net Debt $1,516 $1,150 $1,381 $2,892 $3,194 29

Reconciliation of reported and adjusted net earnings ($ millions) 3Q 2019 4Q 2019 1Q 2020 2Q 2020 3Q 2020 Reported net (loss) earnings attributable to U. S. Steel ($84) ($680) ($391) ($589) ($234) Asset impairment charges ─ ─ 263 ─ ─ Restructuring and other charges 42 221 41 82 ─ Gain on previously held investment in UPI ─ ─ (25) ─ ─ Tubular inventory impairment ─ ─ ─ 24 ─ December 24, 2018 Clairton coke making facility fire 7 (3) ─ (4) ─ Big River Steel options mark to market ─ 7 (11) 5 (34) Tax valuation allowance ─ 346 ─ ─ ─ FIN 48 reserve ─ ─ ─ 13 ─ Adjusted net (loss) earnings attributable to U. S. Steel ($35) ($109) ($123) ($469) ($268) 30

Reconciliation of adjusted EBITDA ($ millions) 3Q 2019 4Q 2019 1Q 2020 2Q 2020 3Q 2020 Reported net (loss) earnings attributable to U. S. Steel ($84) ($680) ($391) ($589) ($234) Income tax provision (benefit) (44) 233 (19) (5) (24) Net interest and other financial costs 48 71 35 62 47 Reported (loss) earnings before interest and income taxes ($80) ($376) ($375) ($532) ($211) Depreciation, depletion and amortization expense 161 162 160 159 162 EBITDA $81 ($214) ($215) ($373) ($49) Asset impairment charges ─ ─ 263 ─ ─ Restructuring and other charges 54 221 41 89 ─ Gain on previously held investment in UPI ─ ─ (25) ─ ─ Tubular inventory impairment ─ ─ ─ 24 ─ December 24, 2018 Clairton coke making facility fire 9 (3) ─ (4) ─ Adjusted EBITDA $144 $4 $64 ($264) ($49) 31

INVESTOR RELATIONS Kevin Lewis Vice President 412-433-6935 klewis@uss.com Eric Linn Senior Manager 412-433-2385 eplinn@uss.com www.ussteel.com
