Attached files
| file | filename |
|---|---|
| EX-99.1 - EX-99.1 - Shake Shack Inc. | shak-20201029exhibit991.htm |
| 8-K - 8-K - Shake Shack Inc. | shak-20201029.htm |
THIRD QUARTER 2020 EARNINGS SUPPLEMENTAL OCTOBER 29, 2020 Strategic Plan Update Board of Directors Meeting| Q1 2020
CAUTIONARY NOTE ON FORWARD-LOOKING STATEMENTS This presentation contains forward-looking Forward-looking statements discuss the Company's current expectations and projections relating to its financial position, results of operations, plans, objectives, statements, within the meaning of the Private future performance and business. You can identify forward-looking statements by the Securities Litigation Reform Act of 1995, which are fact that they do not relate strictly to historical or current facts. These statements may include words such as "aim," "anticipate," "believe," "estimate," "expect," "forecast,“ subject to known and unknown risks, uncertainties ”future,” “intend,” "outlook," "potential," "project," "projection," "plan," "seek," "may," and other important factors that may cause actual "could," "would," "will," "should," "can," "can have," "likely," the negatives thereof and results to be materially different. other similar expressions. All forward-looking statements are expressly qualified in their entirety by these All statements other than statements of historical fact included in this cautionary statements. You should evaluate all forward-looking statements made presentation are forward-looking statements, including, but not limited to, in this presentation in the context of the risks and uncertainties disclosed in expected financial outlook for fiscal 2020, expected operating performance for the Company’s Annual Report on Form 10-K for the fiscal year ended December fiscal 2020, expected Shack construction and openings, expected same-Shack 25, 2019 and Quarterly Report on Form 10-Q for the period ended June 24, 2020 as sales growth and trends in Shake Shack Inc.’s (the "Company's") filed with the Securities and Exchange Commission ("SEC"). All of the Company's operations including statements relating to the effects of COVID-19 and the SEC filings are available online at www.sec.gov, www.shakeshack.com or upon Company’s mitigation efforts. request from Shake Shack Inc. The forward-looking statements included in this presentation are made only as of the date hereof. The Company undertakes no obligation to publicly update or revise any forward-looking statement as a result of new information, future events or otherwise, except as otherwise required by law. Strategic Plan Update Board of Directors Meeting| Q1 2020 2
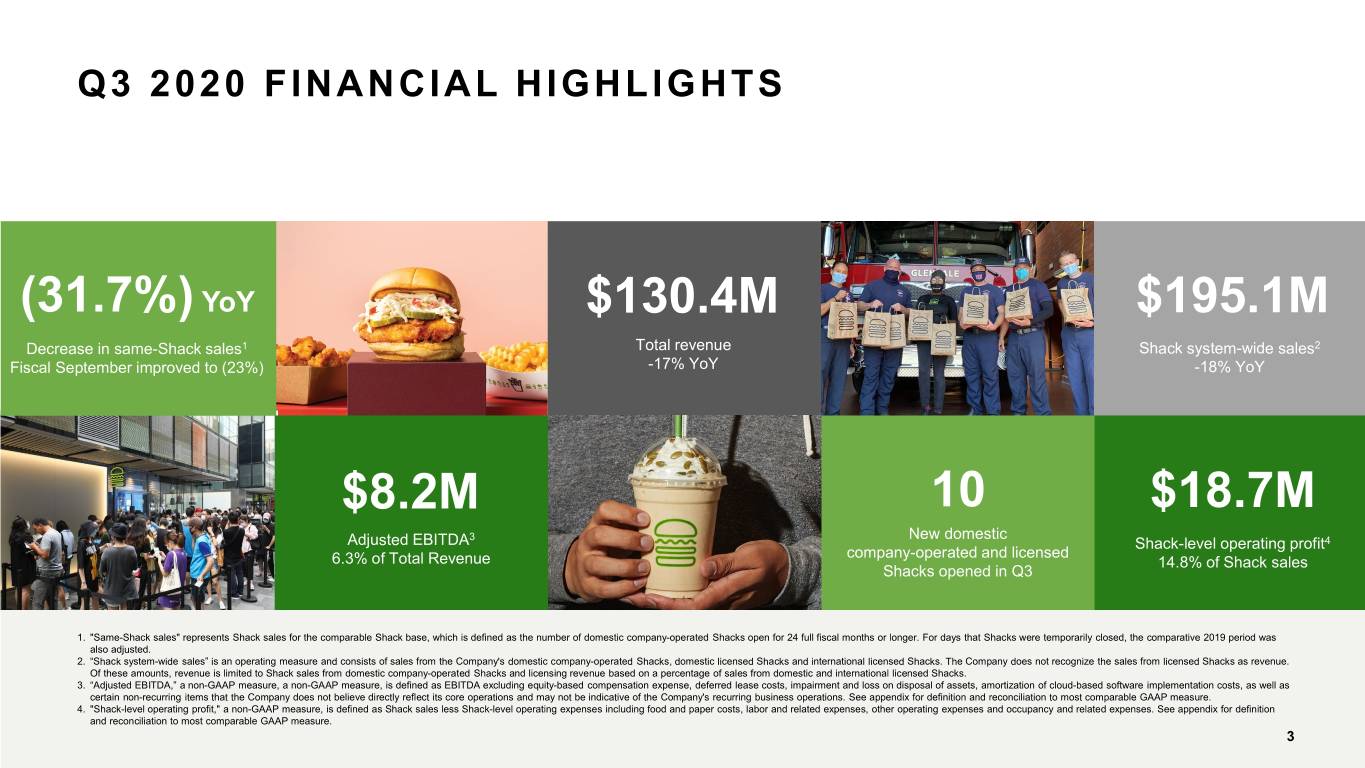
Q3 2020 FINANCIAL HIGHLIGHTS (31.7%) YoY $130.4M $195.1M Decrease in same-Shack sales1 Total revenue Shack system-wide sales2 Fiscal September improved to (23%) -17% YoY -18% YoY $8.2M 10 $18.7M 3 New domestic Adjusted EBITDA Shack-level operating profit4 company-operated and licensed 6.3% of Total Revenue 14.8% of Shack sales Shacks opened in Q3 1. "Same-Shack sales" represents Shack sales for the comparable Shack base, which is defined as the number of domestic company-operated Shacks open for 24 full fiscal months or longer. For days that Shacks were temporarily closed, the comparative 2019 period was also adjusted. 2. “Shack system-wide sales” is an operating measure and consists of sales from the Company's domestic company-operated Shacks, domestic licensed Shacks and international licensed Shacks. The Company does not recognize the sales from licensed Shacks as revenue. Of these amounts, revenue is limited to Shack sales from domestic company-operated Shacks and licensing revenue based on a percentage of sales from domestic and international licensed Shacks. 3. “Adjusted EBITDA,” a non-GAAP measure, a non-GAAP measure, is defined as EBITDA excluding equity-based compensation expense, deferred lease costs, impairment and loss on disposal of assets, amortization of cloud-based software implementation costs, as well as certain non-recurring items that the Company does not believe directly reflect its core operations and may not be indicative of the Company's recurring business operations. See appendix for definition and reconciliation to most comparable GAAP measure. 4. "Shack-level operating profit," a non-GAAP measure, is defined as Shack sales less Shack-level operating expenses including food and paper costs, labor and related expenses, other operating expenses and occupancy and related expenses. See appendix for definition and reconciliation to most comparable GAAP measure. Strategic Plan Update Board of Directors Meeting| Q1 2020 3
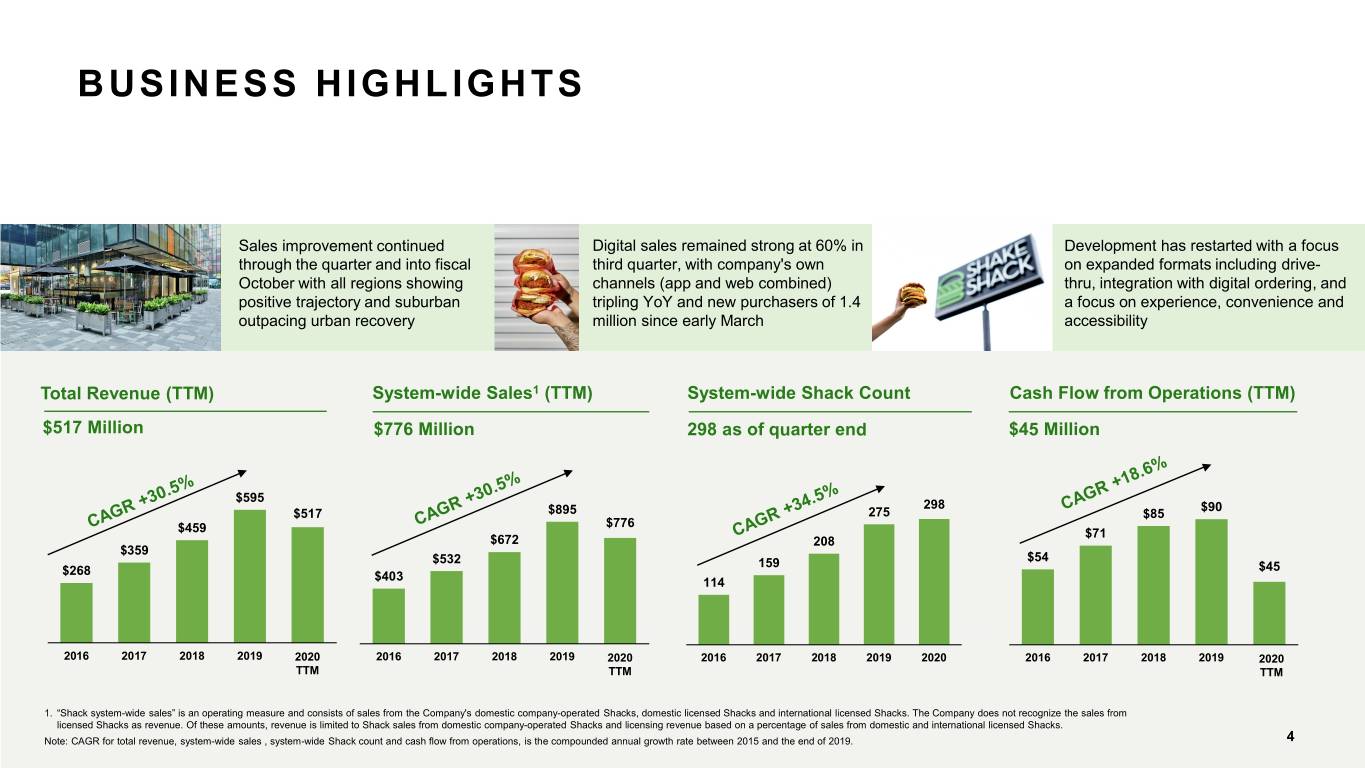
BUSINESS HIGHLIGHTS Sales improvement continued Digital sales remained strong at 60% in Development has restarted with a focus through the quarter and into fiscal third quarter, with company's own on expanded formats including drive- October with all regions showing channels (app and web combined) thru, integration with digital ordering, and positive trajectory and suburban tripling YoY and new purchasers of 1.4 a focus on experience, convenience and outpacing urban recovery million since early March accessibility Total Revenue (TTM) System-wide Sales1 (TTM) System-wide Shack Count Cash Flow from Operations (TTM) $517 Million $776 Million 298 as of quarter end $45 Million $595 298 $90 $517 $895 275 $85 $776 $459 $71 $672 208 $359 $532 159 $54 $268 $45 $403 114 2016 2017 2018 2019 2020 2016 2017 2018 2019 2020 2016 2017 2018 2019 2020 2016 2017 2018 2019 2020 TTM TTM TTM 1. “Shack system-wide sales” is an operating measure and consists of sales from the Company's domestic company-operated Shacks, domestic licensed Shacks and international licensed Shacks. The Company does not recognize the sales from licensed Shacks as revenue. Of these amounts, revenue is limited to Shack sales from domestic company-operated Shacks and licensing revenue based on a percentage of sales from domestic and international licensed Shacks. Strategic Plan Update Note: CAGR for total revenue, system-wide sales , system-wide Shack count and cash flow from operations, is the compounded annual growth rate between 2015 and the end of 2019. Board of Directors Meeting| Q1 2020 4
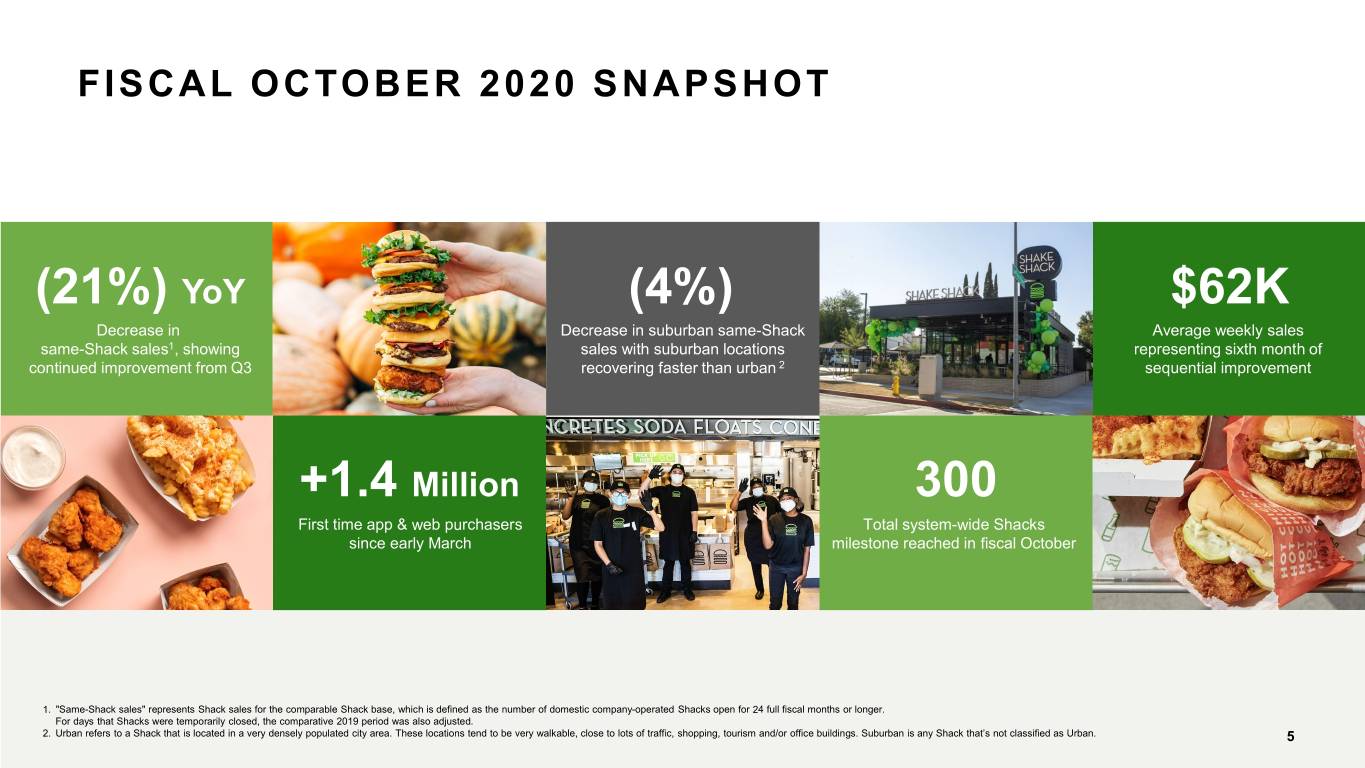
FISCAL OCTOBER 2020 SNAPSHOT (21%) YoY (4%) $62K Decrease in Decrease in suburban same-Shack Average weekly sales same-Shack sales1, showing sales with suburban locations representing sixth month of continued improvement from Q3 recovering faster than urban 2 sequential improvement +1.4 Million 300 First time app & web purchasers Total system-wide Shacks since early March milestone reached in fiscal October 1. "Same-Shack sales" represents Shack sales for the comparable Shack base, which is defined as the number of domestic company-operated Shacks open for 24 full fiscal months or longer. For days that Shacks were temporarily closed, the comparative 2019 period was also adjusted. Strategic Plan Update 2. Urban refers to a Shack that is located in a very densely populated city area. These locations tend to be very walkable, close to lots of traffic, shopping, tourism and/or office buildings. Suburban is any Shack that’s not classified as Urban. Board of Directors Meeting| Q1 2020 5
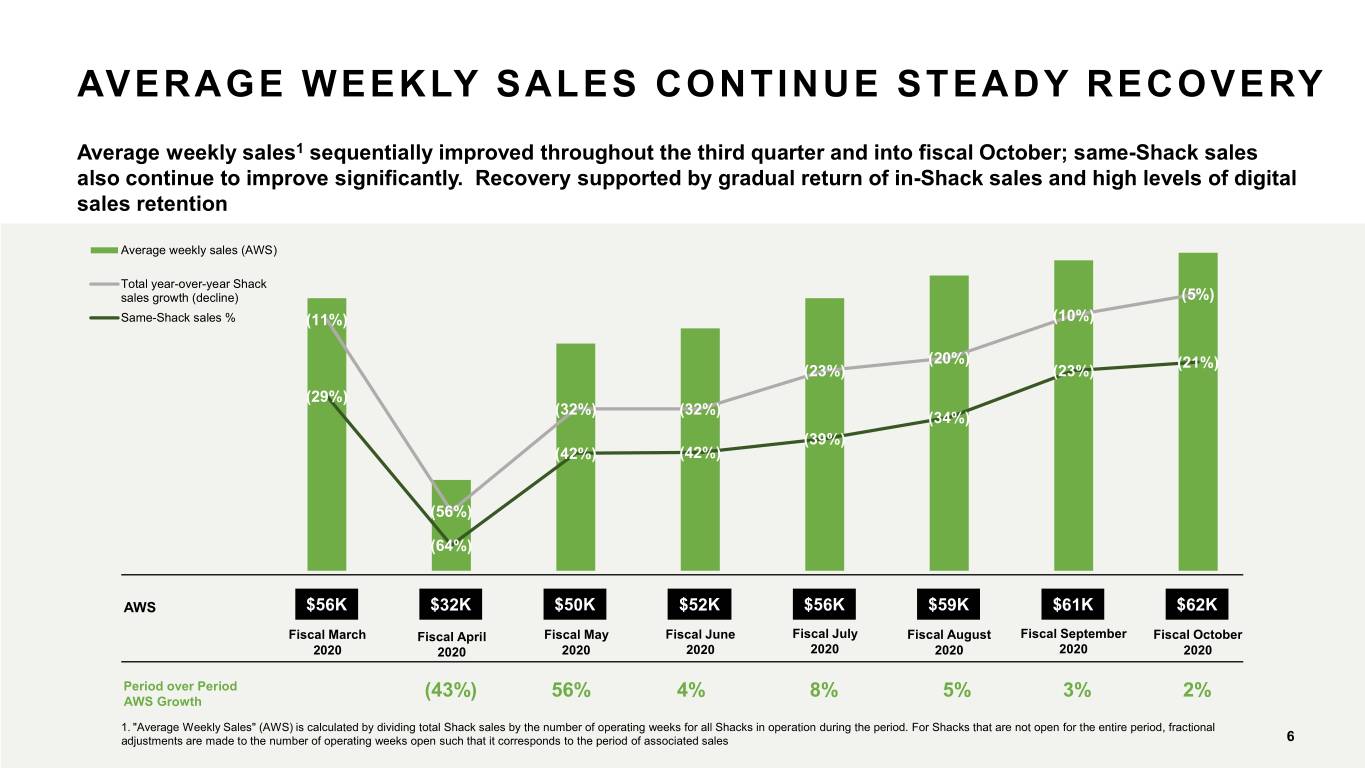
AVERAGE WEEKLY SALES CONTINUE STEADY RECOVERY Average weekly sales1 sequentially improved throughout the third quarter and into fiscal October; same-Shack sales also continue to improve significantly. Recovery supported by gradual return of in-Shack sales and high levels of digital sales retention Average weekly sales (AWS) Total year-over-year Shack sales growth (decline) (5%) Same-Shack sales % (11%) (10%) (20%) (21%) (23%) (23%) (29%) (32%) (32%) (34%) (39%) (42%) (42%) (56%) (64%) AWS $56K $32K $50K $52K $56K $59K $61K $62K Fiscal March Fiscal April Fiscal May Fiscal June Fiscal July Fiscal August Fiscal September Fiscal October 2020 2020 2020 2020 2020 2020 2020 2020 Period over Period (43%) 56% 4% 8% 5% 3% 2% AWS Growth 1. "Average Weekly Sales" (AWS) is calculated by dividing total Shack sales by the number of operating weeks for all Shacks in operation during the period. For Shacks that are not open forStrategic the entire period, Plan fractional Update adjustments are made to the number of operating weeks open such that it corresponds to the period of associated sales Board of Directors Meeting| Q1 2020 6
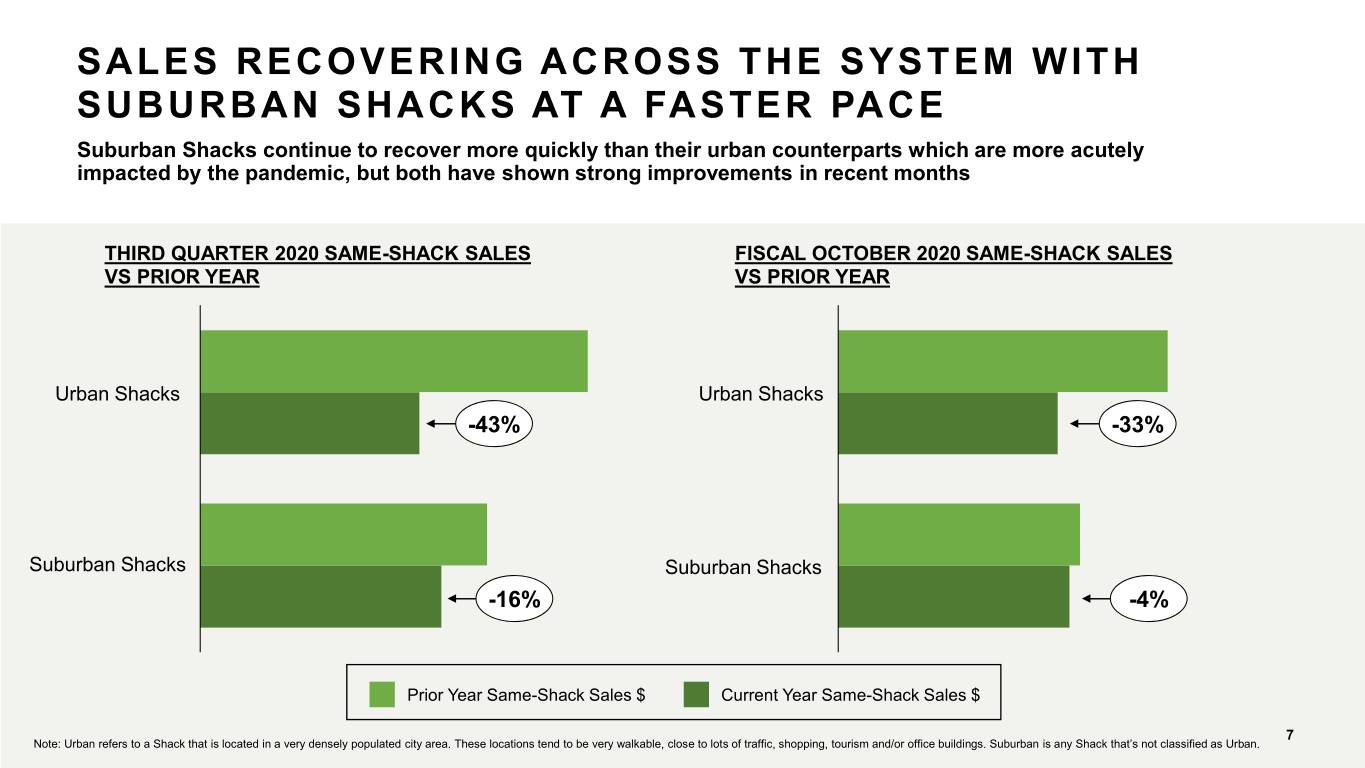
SALES RECOVERING ACROSS THE SYSTEM WITH SUBURBAN SHACKS AT A FASTER PACE Suburban Shacks continue to recover more quickly than their urban counterparts which are more acutely impacted by the pandemic, but both have shown strong improvements in recent months THIRD QUARTER 2020 SAME-SHACK SALES FISCAL OCTOBER 2020 SAME-SHACK SALES VS PRIOR YEAR VS PRIOR YEAR Urban Shacks Urban Shacks -43% -33% Suburban Shacks Suburban Shacks -16% -4% Prior Year Same-Shack Sales $ Current Year Same-Shack Sales $ Strategic Plan Update 7 Note: Urban refers to a Shack that is located in a very densely populated city area. These locations tend to be very walkable, close to lots of traffic, shopping, tourism and/or office buildings.Board Suburban of Directors is any Shack Meeting that’s not classified| Q1 as2020 Urban.
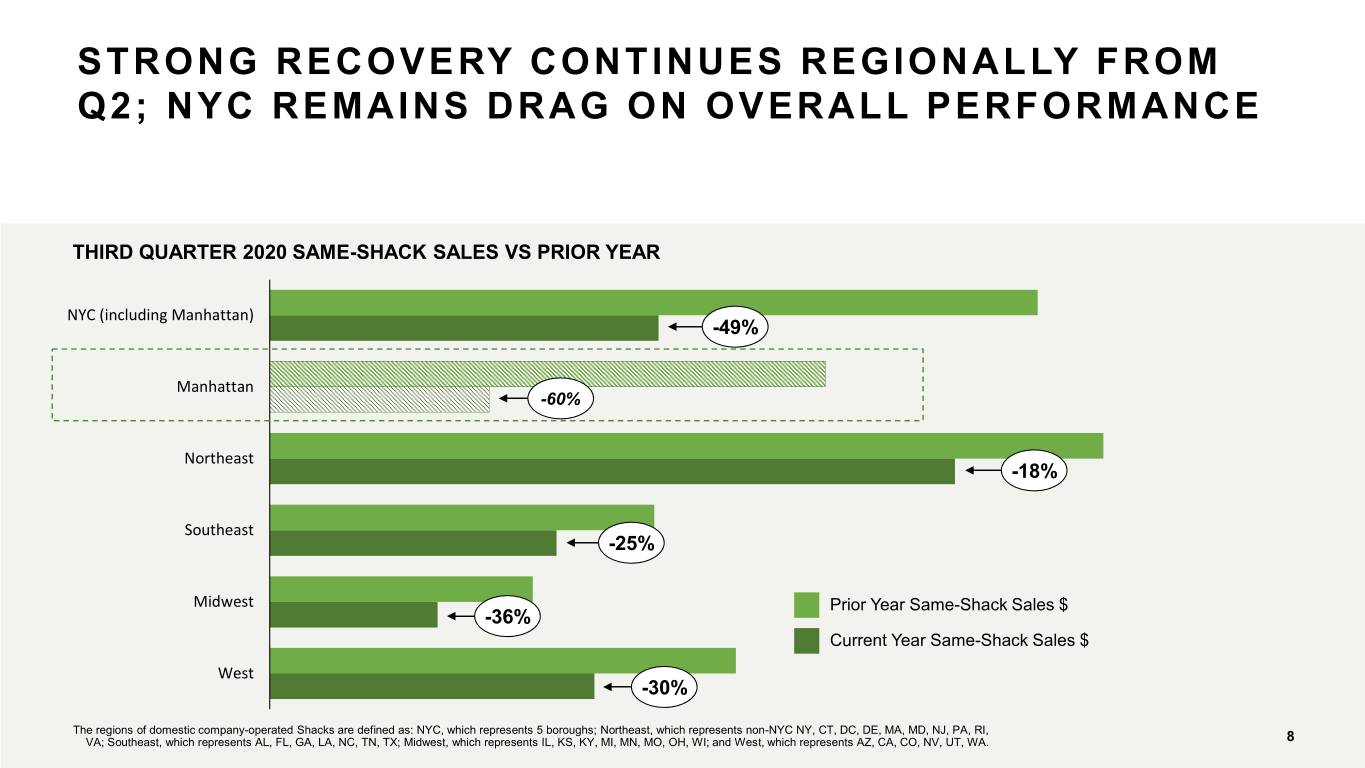
STRONG RECOVERY CONTINUES REGIONALLY FROM Q2; NYC REMAINS DRAG ON OVERALL PERFORMANCE THIRD QUARTER 2020 SAME-SHACK SALES VS PRIOR YEAR NYC (including Manhattan) -49% Manhattan -60% Northeast -18% Southeast -25% Midwest Prior Year Same-Shack Sales $ -36% Current Year Same-Shack Sales $ West -30% Strategic Plan Update The regions of domestic company-operated Shacks are defined as: NYC, which represents 5 boroughs; Northeast, which represents non-NYC NY, CT, DC, DE, MA, MD, NJ, PA, RI, VA; Southeast, which represents AL, FL, GA, LA, NC, TN, TX; Midwest, which represents IL, KS, KY, MI, MN, MO, OH, WI; and West, which represents AZ, CA, CO, NV, UT,Board WA. of Directors Meeting| Q1 2020 8
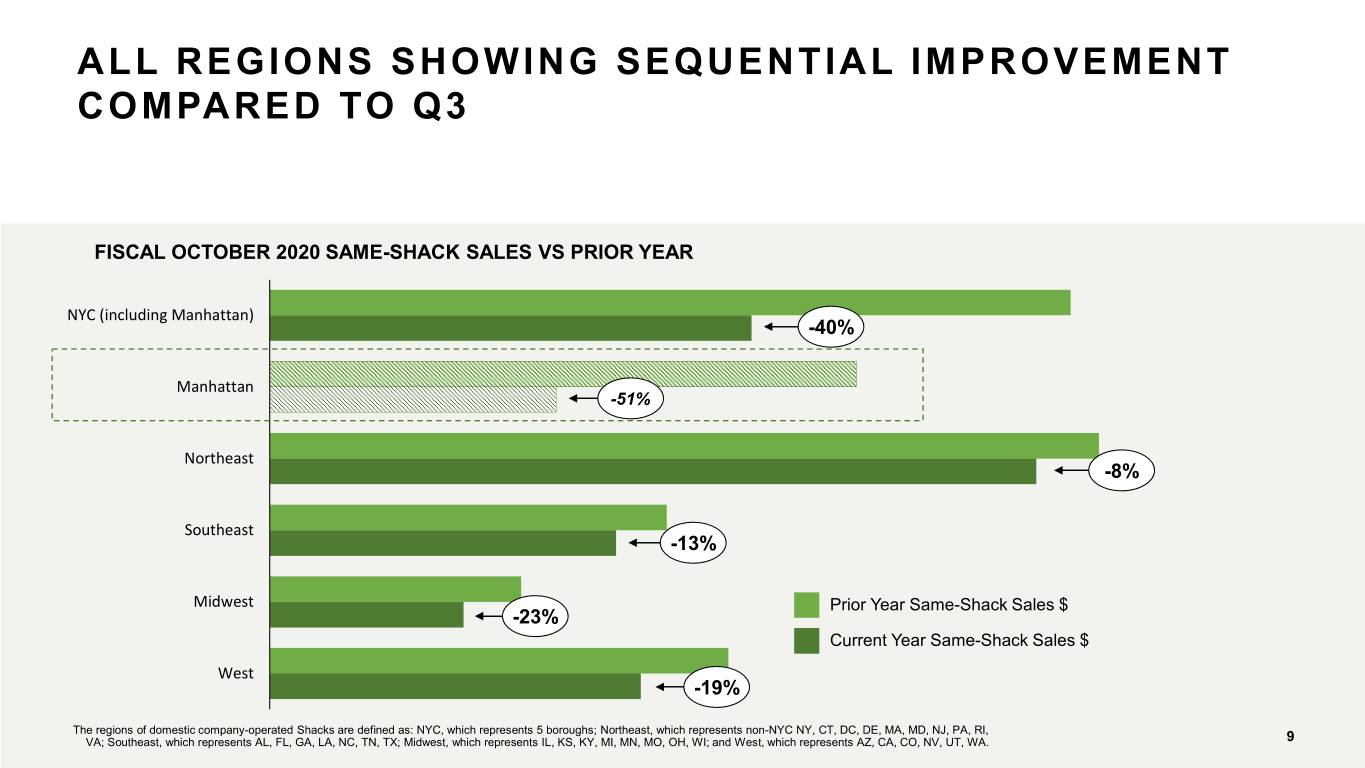
ALL REGIONS SHOWING SEQUENTIAL IMPROVEMENT COMPARED TO Q3 FISCAL OCTOBER 2020 SAME-SHACK SALES VS PRIOR YEAR NYC (including Manhattan) -40% Manhattan -51% Northeast -8% Southeast -13% Midwest Prior Year Same-Shack Sales $ -23% Current Year Same-Shack Sales $ West -19% Strategic Plan Update The regions of domestic company-operated Shacks are defined as: NYC, which represents 5 boroughs; Northeast, which represents non-NYC NY, CT, DC, DE, MA, MD, NJ, PA, RI, VA; Southeast, which represents AL, FL, GA, LA, NC, TN, TX; Midwest, which represents IL, KS, KY, MI, MN, MO, OH, WI; and West, which represents AZ, CA, CO, NV, UT,Board WA. of Directors Meeting| Q1 2020 9
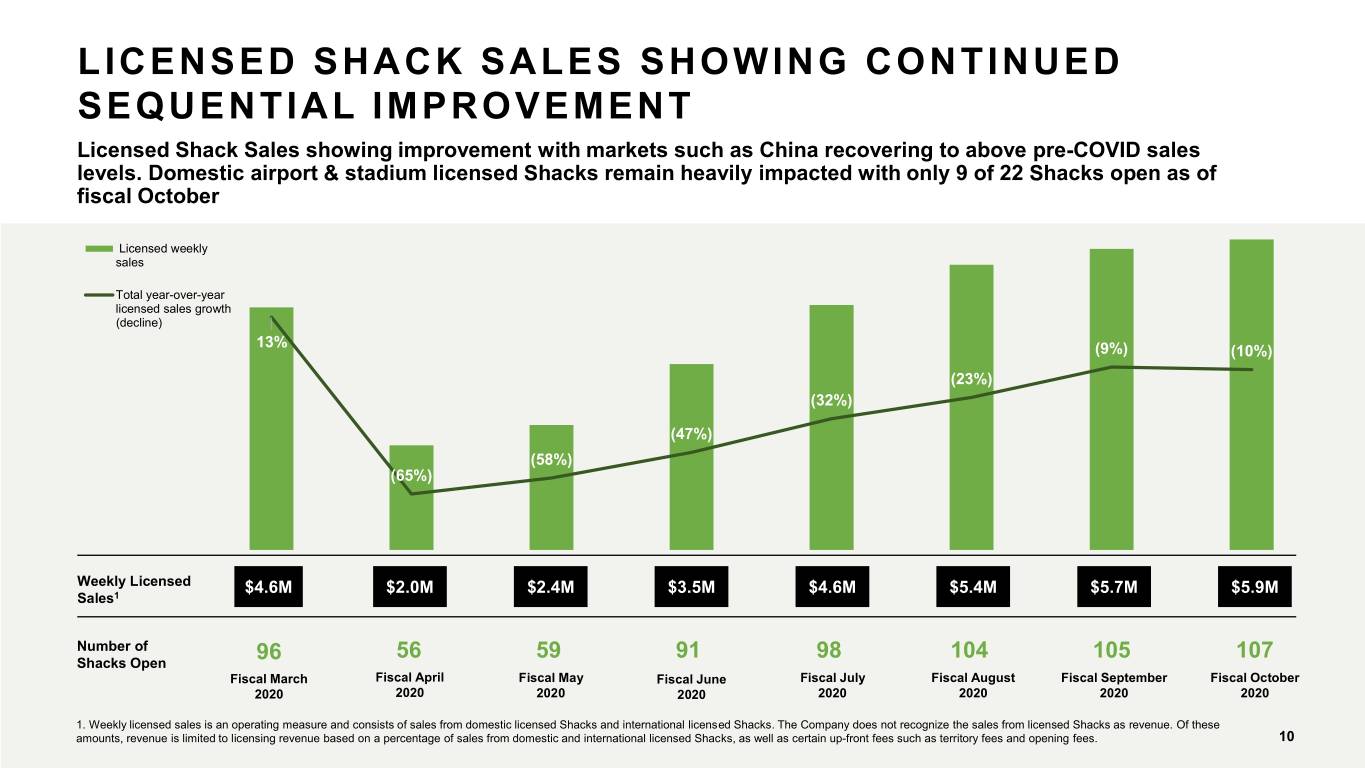
LICENSED SHACK SALES SHOWING CONTINUED SEQUENTIAL IMPROVEMENT Licensed Shack Sales showing improvement with markets such as China recovering to above pre-COVID sales levels. Domestic airport & stadium licensed Shacks remain heavily impacted with only 9 of 22 Shacks open as of fiscal October Licensed weekly sales Total year-over-year licensed sales growth (decline) 13% (9%) (10%) (23%) (32%) (47%) (58%) (65%) Weekly Licensed $4.6M $2.0M $2.4M $3.5M $4.6M $5.4M $5.7M $5.9M Sales1 Number of 56 59 91 98 104 105 107 Shacks Open 96 Fiscal March Fiscal April Fiscal May Fiscal June Fiscal July Fiscal August Fiscal September Fiscal October 2020 2020 2020 2020 2020 2020 2020 2020 1. Weekly licensed sales is an operating measure and consists of sales from domestic licensed Shacks and international licensed Shacks. The Company does not recognize the sales from licensed StrategicShacks as revenue. Plan Of Updatethese amounts, revenue is limited to licensing revenue based on a percentage of sales from domestic and international licensed Shacks, as well as certain up-front fees such as territoryBoard fees of and Directors opening fees. Meeting| Q1 2020 10
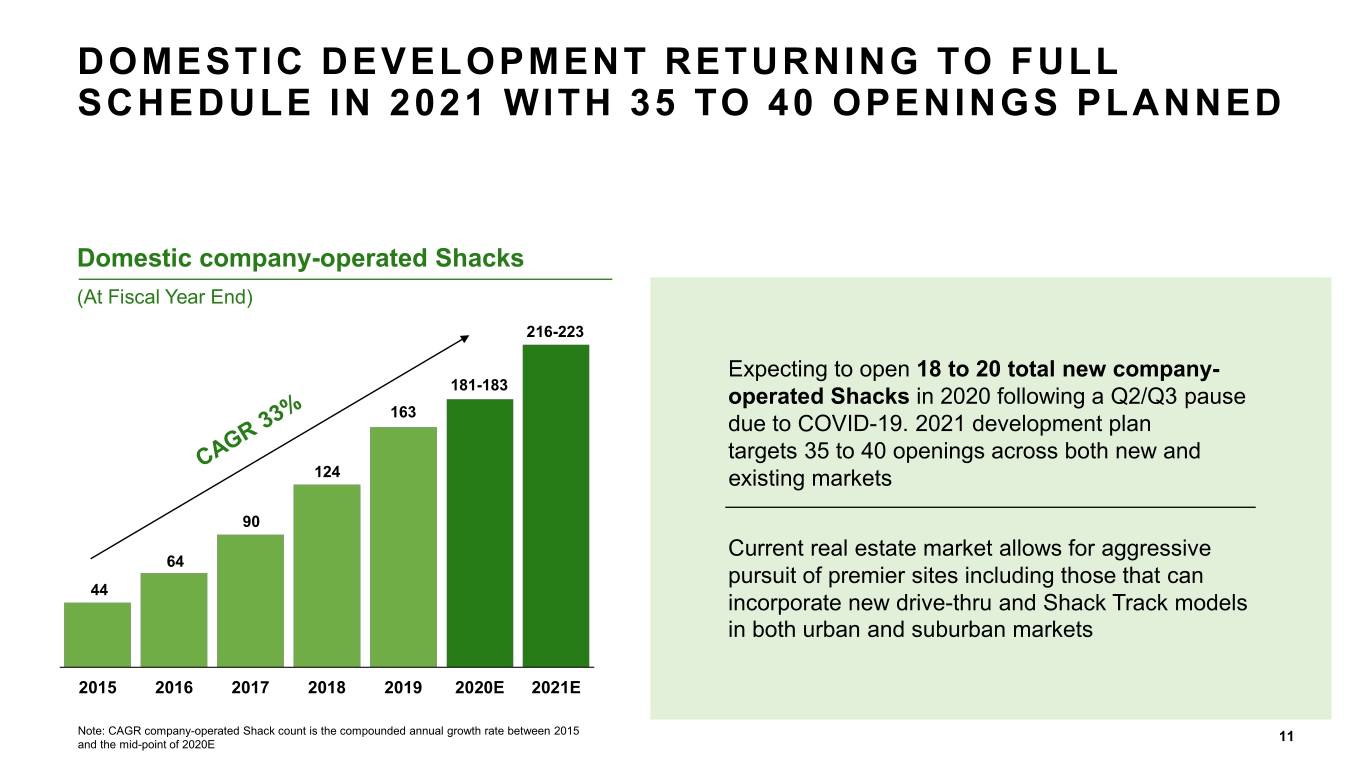
DOMESTIC DEVELOPMENT RETURNING TO FULL SCHEDULE IN 2021 WITH 35 TO 40 OPENINGS PLANNED Domestic company-operated Shacks (At Fiscal Year End) 216-223 Expecting to open 18 to 20 total new company- 181-183 operated Shacks in 2020 following a Q2/Q3 pause 163 due to COVID-19. 2021 development plan targets 35 to 40 openings across both new and 124 existing markets 90 Current real estate market allows for aggressive 64 pursuit of premier sites including those that can 44 incorporate new drive-thru and Shack Track models in both urban and suburban markets 2015 2016 2017 2018 2019 2020E 2021E Note: CAGR company-operated Shack count is the compounded annual growth rate between 2015 and the mid-point of 2020E 11
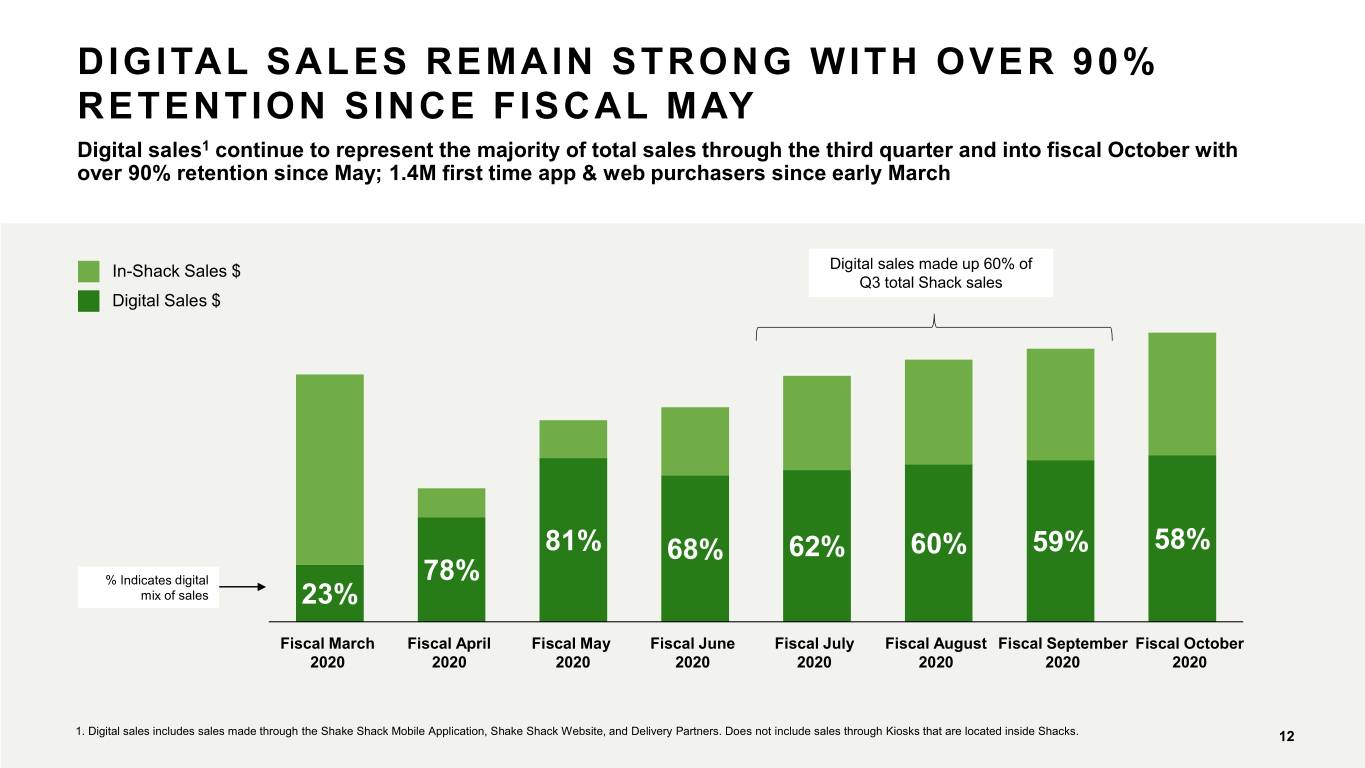
DIGITAL SALES REMAIN STRONG WITH OVER 90% RETENTION SINCE FISCAL MAY Digital sales1 continue to represent the majority of total sales through the third quarter and into fiscal October with over 90% retention since May; 1.4M first time app & web purchasers since early March In-Shack Sales $ Digital sales made up 60% of Q3 total Shack sales Digital Sales $ 81% 68% 62% 60% 59% 58% % Indicates digital 78% mix of sales 23% Fiscal March Fiscal April Fiscal May Fiscal June Fiscal July Fiscal August Fiscal September Fiscal October 2020 2020 2020 2020 2020 2020 2020 2020 Strategic Plan Update 1. Digital sales includes sales made through the Shake Shack Mobile Application, Shake Shack Website, and Delivery Partners. Does not include sales through Kiosks that are located inside Shacks. Board of Directors Meeting| Q1 2020 12

DIGITAL INNOVATION REMAINS KEY COMPONENT OF ONGOING GROWTH STRATEGY • Digital experience elevation remains a priority with focus on convenience, speed and accessibility • Digital ordering tools becoming a more integrated part of physical Shack design with increased pre-order and pickup formats rolling out • Delivery capability will be integrated within native app and web ordering channels; initial app testing planned by end of year with broader rollout over the first half of 2021 • Integration of multi-channel guest data progressing well; better enabling key strategic decision-making and one-on- one marketing opportunities Strategic Plan Update Board of Directors Meeting| Q1 2020 13
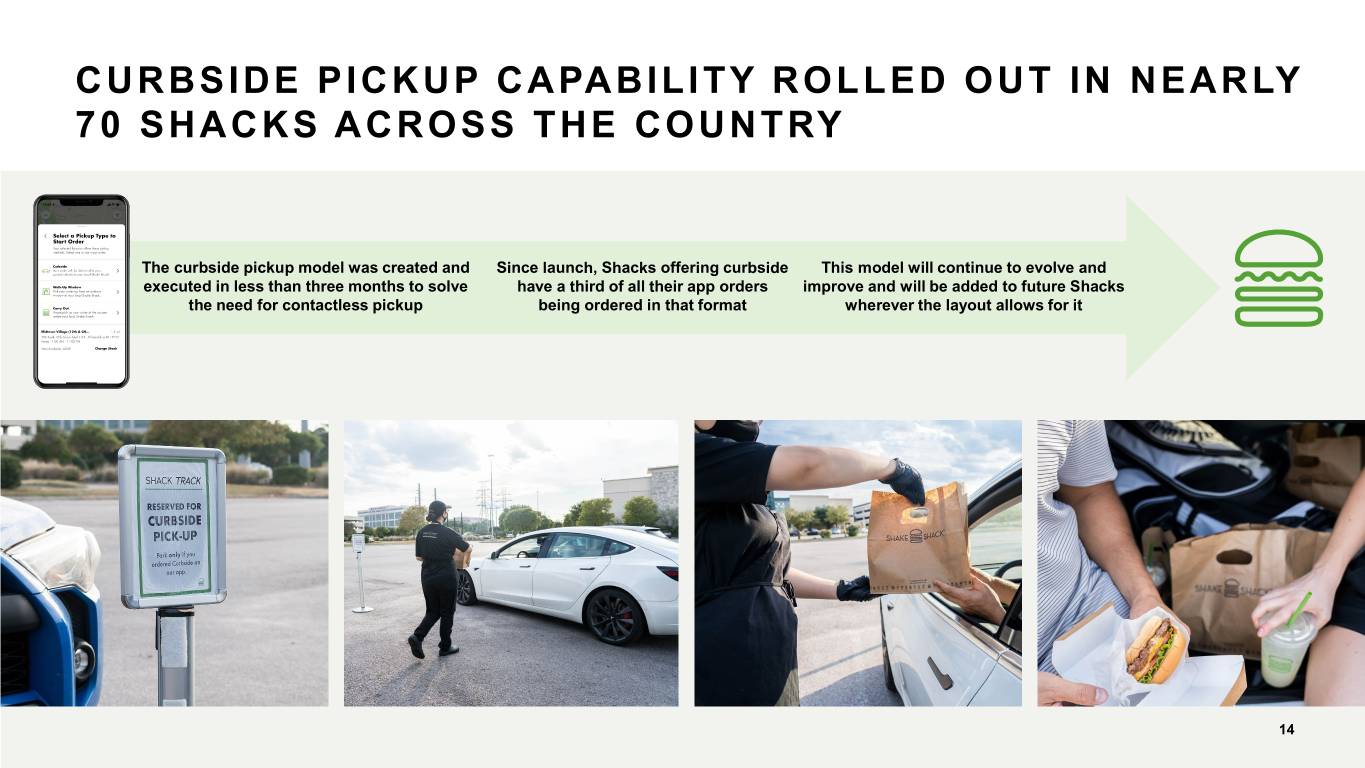
CURBSIDE PICKUP CAPABILITY ROLLED OUT IN NEARLY 70 SHACKS ACROSS THE COUNTRY The curbside pickup model was created and Since launch, Shacks offering curbside This model will continue to evolve and executed in less than three months to solve have a third of all their app orders improve and will be added to future Shacks the need for contactless pickup being ordered in that format wherever the layout allows for it Strategic Plan Update 14 Board of Directors Meeting| Q1 2020
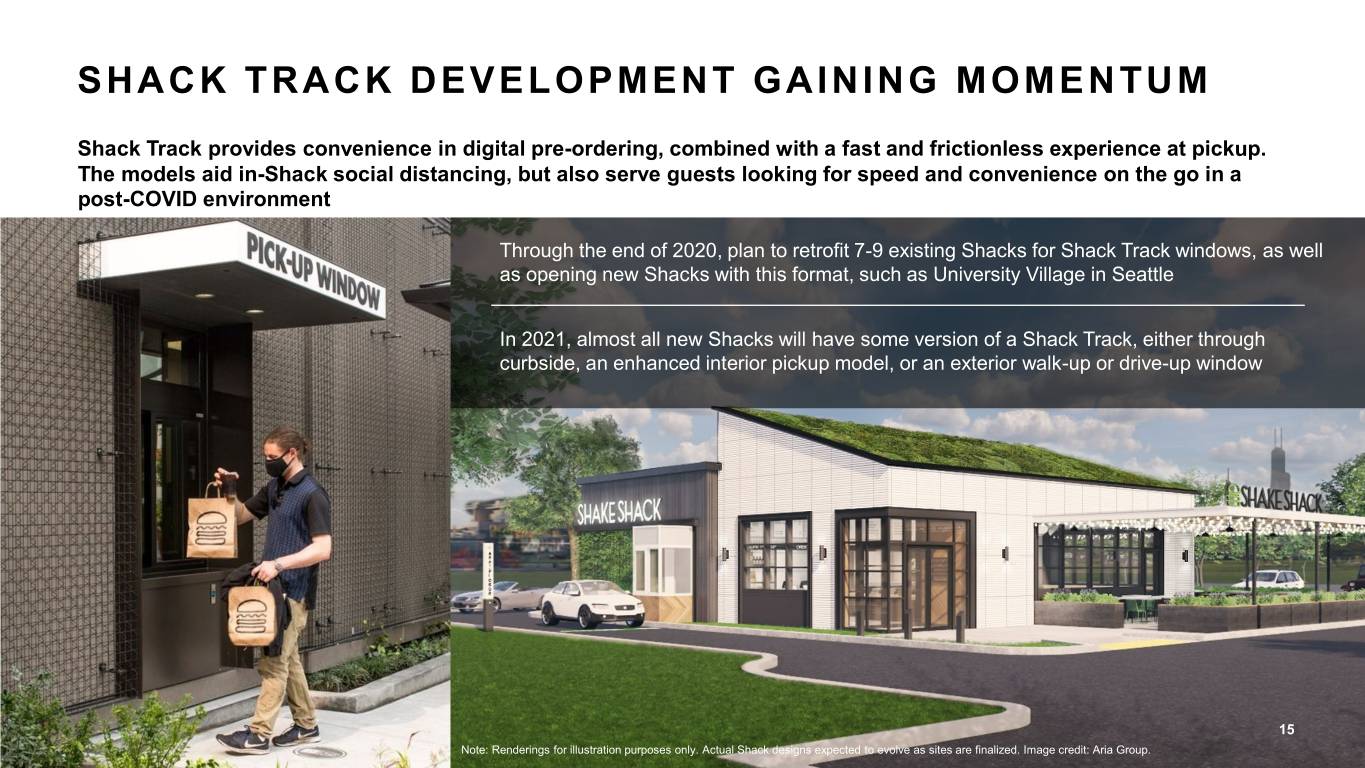
SHACK TRACK DEVELOPMENT GAINING MOMENTUM Shack Track provides convenience in digital pre-ordering, combined with a fast and frictionless experience at pickup. The models aid in-Shack social distancing, but also serve guests looking for speed and convenience on the go in a post-COVID environment Through the end of 2020, plan to retrofit 7-9 existing Shacks for Shack Track windows, as well as opening new Shacks with this format, such as University Village in Seattle In 2021, almost all new Shacks will have some version of a Shack Track, either through curbside, an enhanced interior pickup model, or an exterior walk-up or drive-up window Strategic Plan Update 15 Note: Renderings for illustration purposes only. Actual Shack designs expected to evolve as sitesBoard are finalized. of DirectorsImage credit: Aria Meeting Group. | Q1 2020
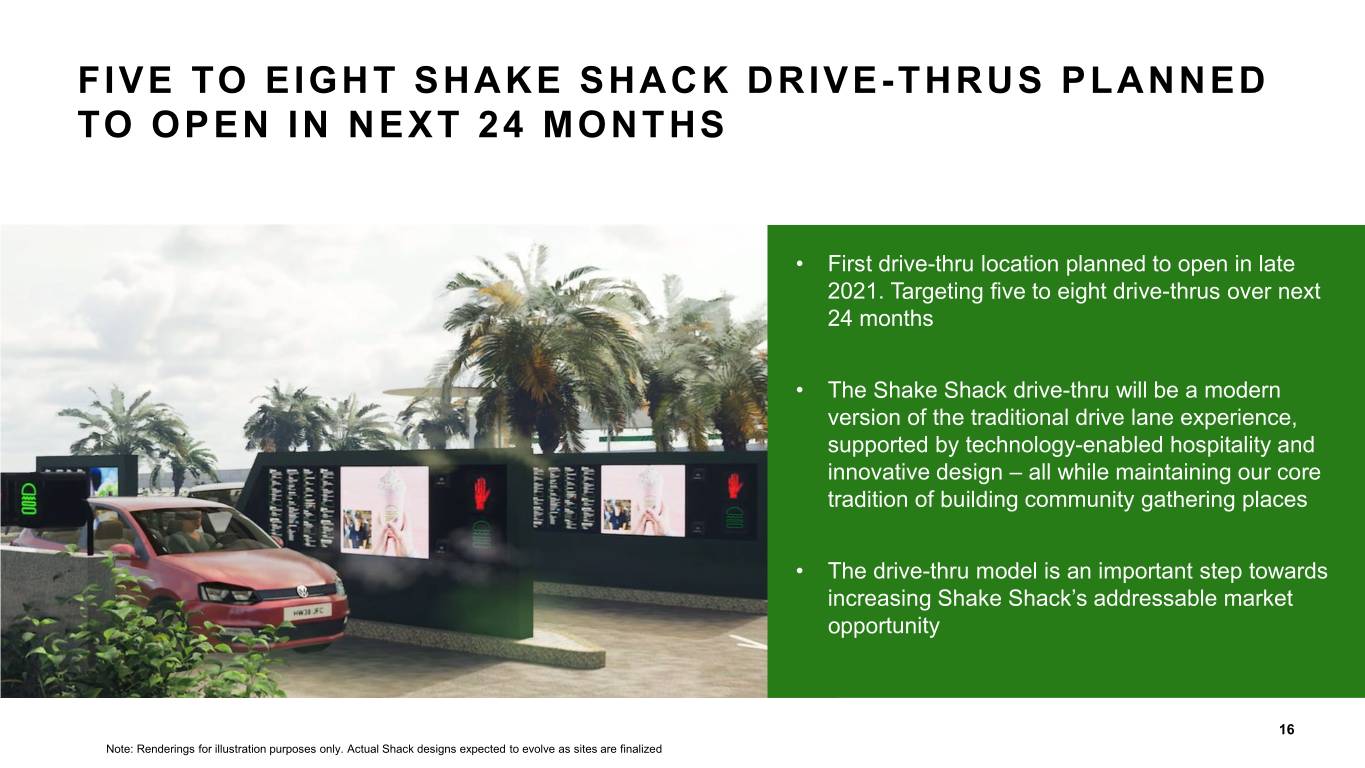
FIVE TO EIGHT SHAKE SHACK DRIVE-THRUS PLANNED TO OPEN IN NEXT 24 MONTHS • First drive-thru location planned to open in late 2021. Targeting five to eight drive-thrus over next 24 months • The Shake Shack drive-thru will be a modern version of the traditional drive lane experience, supported by technology-enabled hospitality and innovative design – all while maintaining our core tradition of building community gathering places • The drive-thru model is an important step towards increasing Shake Shack’s addressable market opportunity Strategic Plan Update 16 Note: Renderings for illustration purposes only. Actual Shack designs expected to evolve as sites are finalized Board of Directors Meeting| Q1 2020
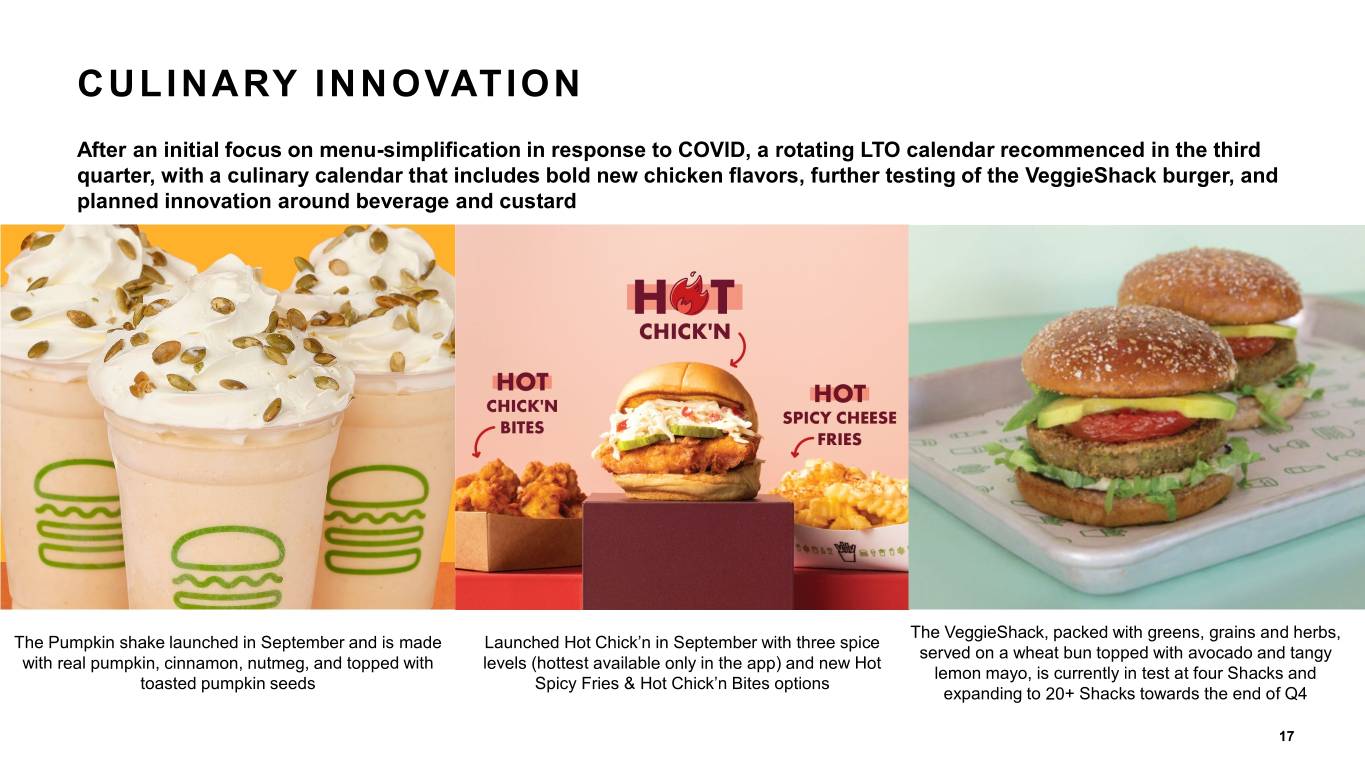
CULINARY INNOVATION After an initial focus on menu-simplification in response to COVID, a rotating LTO calendar recommenced in the third quarter, with a culinary calendar that includes bold new chicken flavors, further testing of the VeggieShack burger, and planned innovation around beverage and custard The VeggieShack, packed with greens, grains and herbs, The Pumpkin shake launched in September and is made Launched Hot Chick’n in September with three spice served on a wheat bun topped with avocado and tangy with real pumpkin, cinnamon, nutmeg, and topped with levels (hottest available only in the app) and new Hot lemon mayo, is currently in test at four Shacks and toasted pumpkin seeds Spicy Fries & Hot Chick’n Bites options expanding to 20+ Shacks towards the end of Q4 Strategic Plan Update Board of Directors Meeting| Q1 2020 17

FINANCIAL DETAILS Strategic Plan Update Board of Directors Meeting| Q1 2020
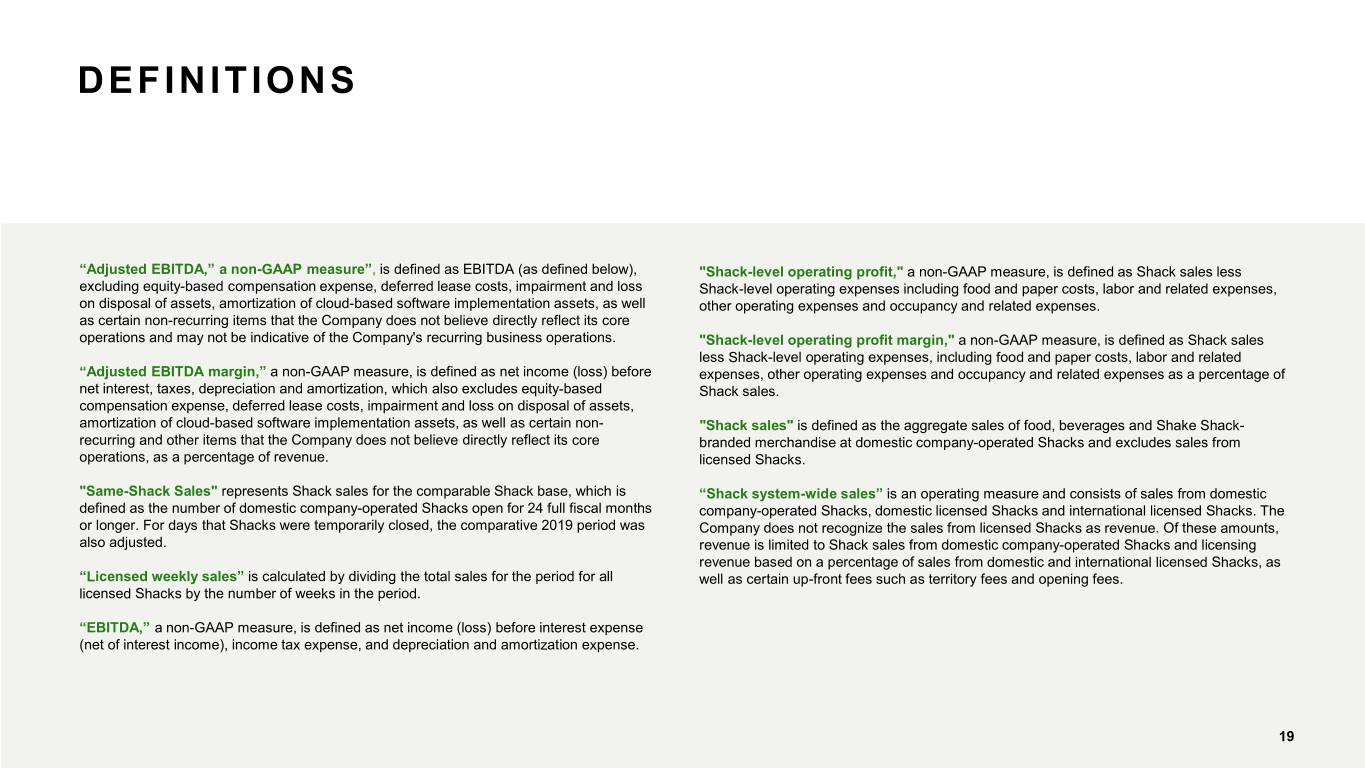
DEFINITIONS “Adjusted EBITDA,” a non-GAAP measure”, is defined as EBITDA (as defined below), "Shack-level operating profit," a non-GAAP measure, is defined as Shack sales less excluding equity-based compensation expense, deferred lease costs, impairment and loss Shack-level operating expenses including food and paper costs, labor and related expenses, on disposal of assets, amortization of cloud-based software implementation assets, as well other operating expenses and occupancy and related expenses. as certain non-recurring items that the Company does not believe directly reflect its core operations and may not be indicative of the Company's recurring business operations. "Shack-level operating profit margin," a non-GAAP measure, is defined as Shack sales less Shack-level operating expenses, including food and paper costs, labor and related “Adjusted EBITDA margin,” a non-GAAP measure, is defined as net income (loss) before expenses, other operating expenses and occupancy and related expenses as a percentage of net interest, taxes, depreciation and amortization, which also excludes equity-based Shack sales. compensation expense, deferred lease costs, impairment and loss on disposal of assets, amortization of cloud-based software implementation assets, as well as certain non- "Shack sales" is defined as the aggregate sales of food, beverages and Shake Shack- recurring and other items that the Company does not believe directly reflect its core branded merchandise at domestic company-operated Shacks and excludes sales from operations, as a percentage of revenue. licensed Shacks. "Same-Shack Sales" represents Shack sales for the comparable Shack base, which is “Shack system-wide sales” is an operating measure and consists of sales from domestic defined as the number of domestic company-operated Shacks open for 24 full fiscal months company-operated Shacks, domestic licensed Shacks and international licensed Shacks. The or longer. For days that Shacks were temporarily closed, the comparative 2019 period was Company does not recognize the sales from licensed Shacks as revenue. Of these amounts, also adjusted. revenue is limited to Shack sales from domestic company-operated Shacks and licensing revenue based on a percentage of sales from domestic and international licensed Shacks, as “Licensed weekly sales” is calculated by dividing the total sales for the period for all well as certain up-front fees such as territory fees and opening fees. licensed Shacks by the number of weeks in the period. “EBITDA,” a non-GAAP measure, is defined as net income (loss) before interest expense (net of interest income), income tax expense, and depreciation and amortization expense. Strategic Plan Update Board of Directors Meeting| Q1 2020 19
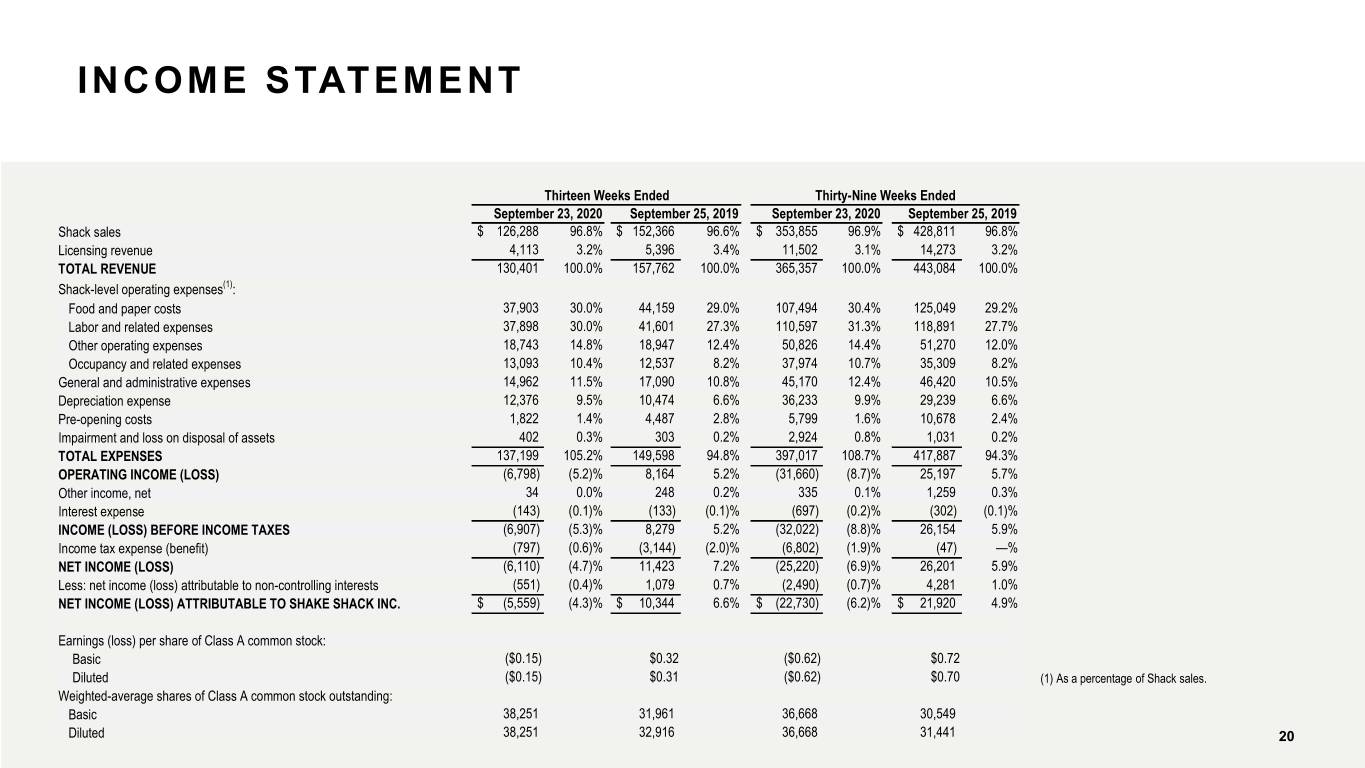
INCOME STATEMENT Thirteen Weeks Ended Thirty-Nine Weeks Ended September 23, 2020 September 25, 2019 September 23, 2020 September 25, 2019 Shack sales $ 126,288 96.8% $ 152,366 96.6% $ 353,855 96.9% $ 428,811 96.8% Licensing revenue 4,113 3.2% 5,396 3.4% 11,502 3.1% 14,273 3.2% TOTAL REVENUE 130,401 100.0% 157,762 100.0% 365,357 100.0% 443,084 100.0% Shack-level operating expenses(1): Food and paper costs 37,903 30.0% 44,159 29.0% 107,494 30.4% 125,049 29.2% Labor and related expenses 37,898 30.0% 41,601 27.3% 110,597 31.3% 118,891 27.7% Other operating expenses 18,743 14.8% 18,947 12.4% 50,826 14.4% 51,270 12.0% Occupancy and related expenses 13,093 10.4% 12,537 8.2% 37,974 10.7% 35,309 8.2% General and administrative expenses 14,962 11.5% 17,090 10.8% 45,170 12.4% 46,420 10.5% Depreciation expense 12,376 9.5% 10,474 6.6% 36,233 9.9% 29,239 6.6% Pre-opening costs 1,822 1.4% 4,487 2.8% 5,799 1.6% 10,678 2.4% Impairment and loss on disposal of assets 402 0.3% 303 0.2% 2,924 0.8% 1,031 0.2% TOTAL EXPENSES 137,199 105.2% 149,598 94.8% 397,017 108.7% 417,887 94.3% OPERATING INCOME (LOSS) (6,798) (5.2)% 8,164 5.2% (31,660) (8.7)% 25,197 5.7% Other income, net 34 0.0% 248 0.2% 335 0.1% 1,259 0.3% Interest expense (143) (0.1)% (133) (0.1)% (697) (0.2)% (302) (0.1)% INCOME (LOSS) BEFORE INCOME TAXES (6,907) (5.3)% 8,279 5.2% (32,022) (8.8)% 26,154 5.9% Income tax expense (benefit) (797) (0.6)% (3,144) (2.0)% (6,802) (1.9)% (47) —% NET INCOME (LOSS) (6,110) (4.7)% 11,423 7.2% (25,220) (6.9)% 26,201 5.9% Less: net income (loss) attributable to non-controlling interests (551) (0.4)% 1,079 0.7% (2,490) (0.7)% 4,281 1.0% NET INCOME (LOSS) ATTRIBUTABLE TO SHAKE SHACK INC. $ (5,559) (4.3)% $ 10,344 6.6% $ (22,730) (6.2)% $ 21,920 4.9% Earnings (loss) per share of Class A common stock: Basic ($0.15) $0.32 ($0.62) $0.72 Diluted ($0.15) $0.31 ($0.62) $0.70 (1) As a percentage of Shack sales. Weighted-average shares of Class A common stock outstanding: Basic 38,251 31,961 36,668 30,549 Strategic Plan Update Diluted 38,251 32,916 36,668 31,441 Board of Directors Meeting| Q1 2020 20
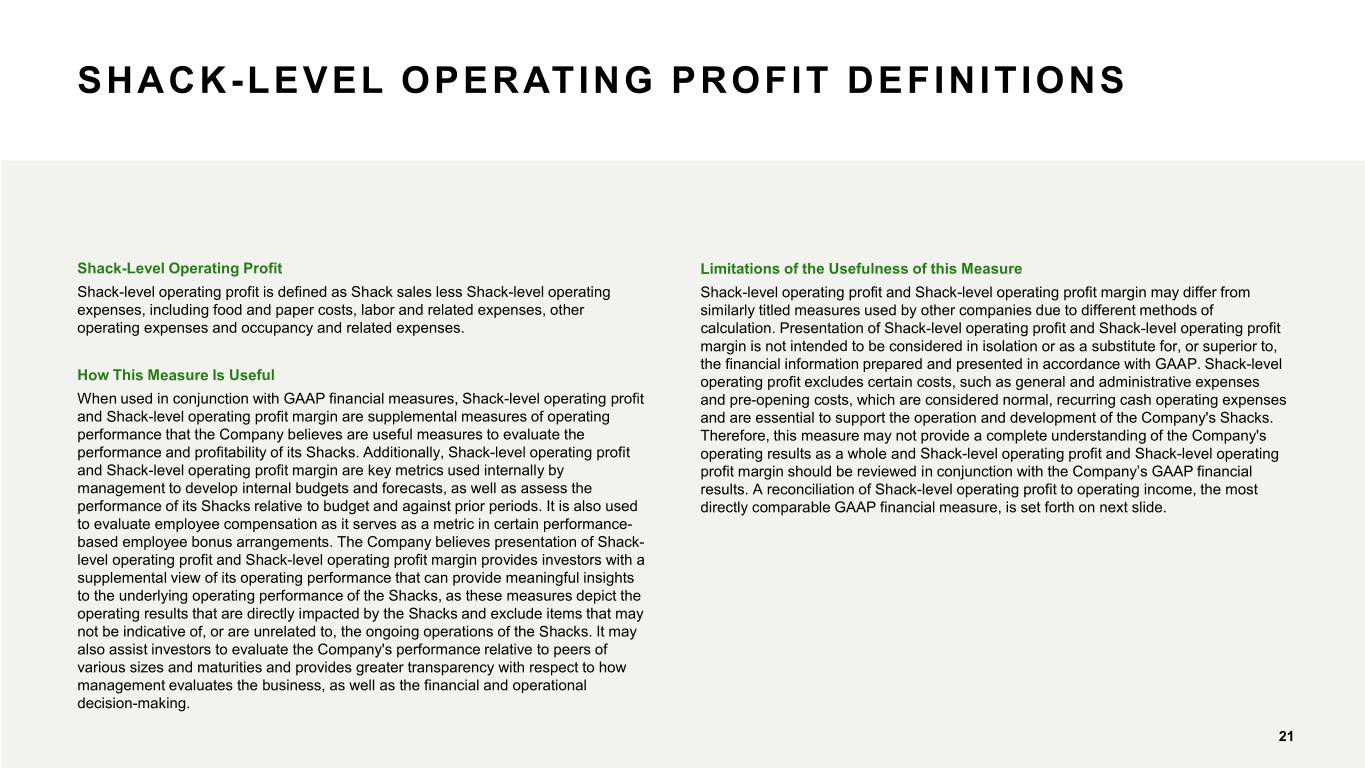
SHACK-LEVEL OPERATING PROFIT DEFINITIONS Shack-Level Operating Profit Limitations of the Usefulness of this Measure Shack-level operating profit is defined as Shack sales less Shack-level operating Shack-level operating profit and Shack-level operating profit margin may differ from expenses, including food and paper costs, labor and related expenses, other similarly titled measures used by other companies due to different methods of operating expenses and occupancy and related expenses. calculation. Presentation of Shack-level operating profit and Shack-level operating profit margin is not intended to be considered in isolation or as a substitute for, or superior to, the financial information prepared and presented in accordance with GAAP. Shack-level How This Measure Is Useful operating profit excludes certain costs, such as general and administrative expenses When used in conjunction with GAAP financial measures, Shack-level operating profit and pre-opening costs, which are considered normal, recurring cash operating expenses and Shack-level operating profit margin are supplemental measures of operating and are essential to support the operation and development of the Company's Shacks. performance that the Company believes are useful measures to evaluate the Therefore, this measure may not provide a complete understanding of the Company's performance and profitability of its Shacks. Additionally, Shack-level operating profit operating results as a whole and Shack-level operating profit and Shack-level operating and Shack-level operating profit margin are key metrics used internally by profit margin should be reviewed in conjunction with the Company’s GAAP financial management to develop internal budgets and forecasts, as well as assess the results. A reconciliation of Shack-level operating profit to operating income, the most performance of its Shacks relative to budget and against prior periods. It is also used directly comparable GAAP financial measure, is set forth on next slide. to evaluate employee compensation as it serves as a metric in certain performance- based employee bonus arrangements. The Company believes presentation of Shack- level operating profit and Shack-level operating profit margin provides investors with a supplemental view of its operating performance that can provide meaningful insights to the underlying operating performance of the Shacks, as these measures depict the operating results that are directly impacted by the Shacks and exclude items that may not be indicative of, or are unrelated to, the ongoing operations of the Shacks. It may also assist investors to evaluate the Company's performance relative to peers of various sizes and maturities and provides greater transparency with respect to how management evaluates the business, as well as the financial and operational decision-making. Strategic Plan Update Board of Directors Meeting| Q1 2020 21
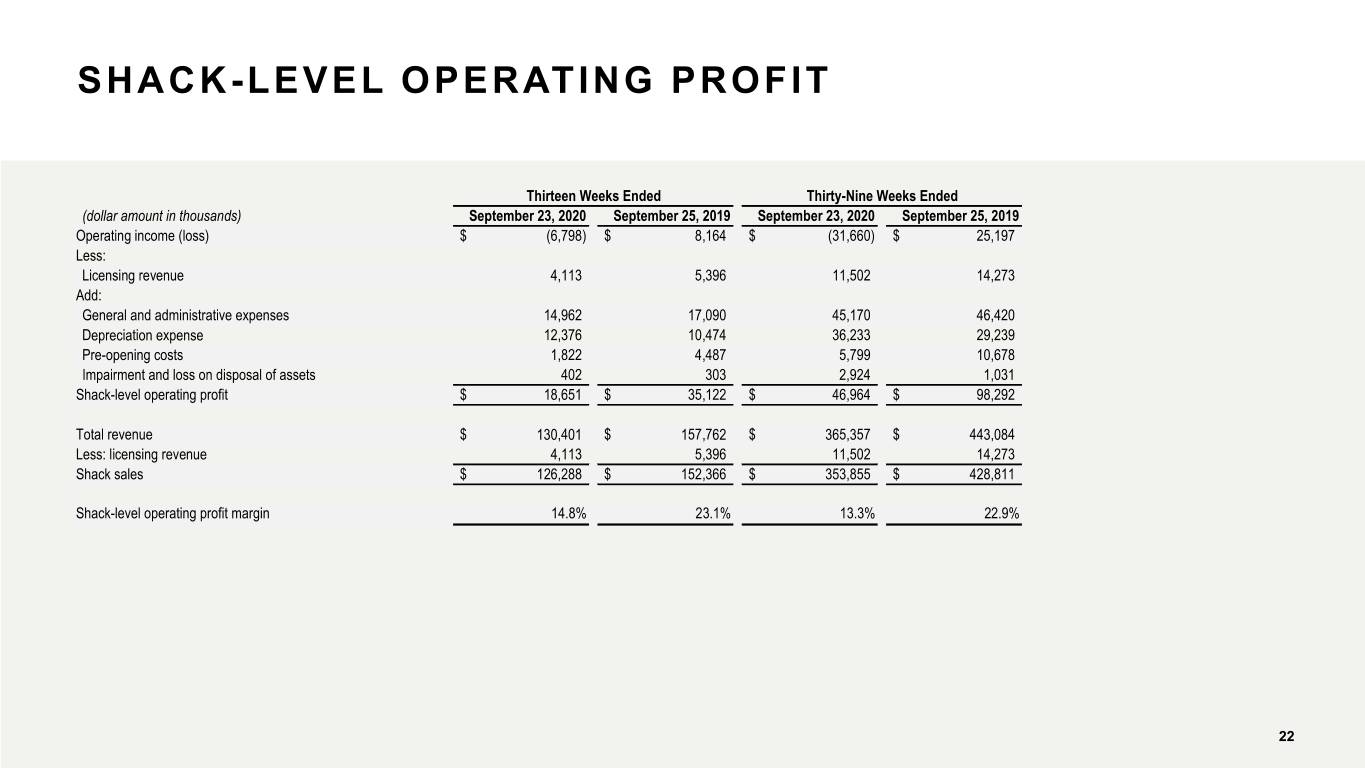
SHACK-LEVEL OPERATING PROFIT Thirteen Weeks Ended Thirty-Nine Weeks Ended (dollar amount in thousands) September 23, 2020 September 25, 2019 September 23, 2020 September 25, 2019 Operating income (loss) $ (6,798) $ 8,164 $ (31,660) $ 25,197 Less: Licensing revenue 4,113 5,396 11,502 14,273 Add: General and administrative expenses 14,962 17,090 45,170 46,420 Depreciation expense 12,376 10,474 36,233 29,239 Pre-opening costs 1,822 4,487 5,799 10,678 Impairment and loss on disposal of assets 402 303 2,924 1,031 Shack-level operating profit $ 18,651 $ 35,122 $ 46,964 $ 98,292 Total revenue $ 130,401 $ 157,762 $ 365,357 $ 443,084 Less: licensing revenue 4,113 5,396 11,502 14,273 Shack sales $ 126,288 $ 152,366 $ 353,855 $ 428,811 Shack-level operating profit margin 14.8% 23.1% 13.3% 22.9% Strategic Plan Update Board of Directors Meeting| Q1 2020 22
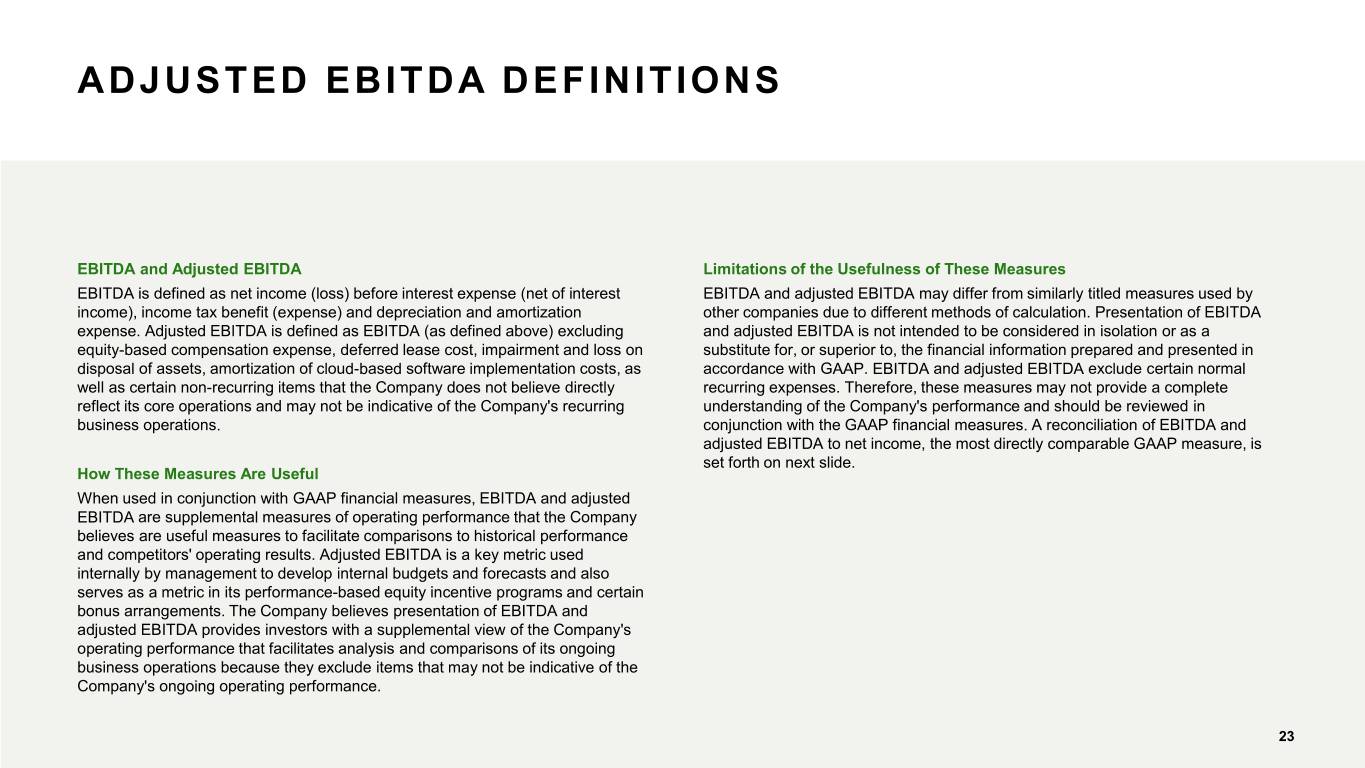
ADJUSTED EBITDA DEFINITIONS EBITDA and Adjusted EBITDA Limitations of the Usefulness of These Measures EBITDA is defined as net income (loss) before interest expense (net of interest EBITDA and adjusted EBITDA may differ from similarly titled measures used by income), income tax benefit (expense) and depreciation and amortization other companies due to different methods of calculation. Presentation of EBITDA expense. Adjusted EBITDA is defined as EBITDA (as defined above) excluding and adjusted EBITDA is not intended to be considered in isolation or as a equity-based compensation expense, deferred lease cost, impairment and loss on substitute for, or superior to, the financial information prepared and presented in disposal of assets, amortization of cloud-based software implementation costs, as accordance with GAAP. EBITDA and adjusted EBITDA exclude certain normal well as certain non-recurring items that the Company does not believe directly recurring expenses. Therefore, these measures may not provide a complete reflect its core operations and may not be indicative of the Company's recurring understanding of the Company's performance and should be reviewed in business operations. conjunction with the GAAP financial measures. A reconciliation of EBITDA and adjusted EBITDA to net income, the most directly comparable GAAP measure, is set forth on next slide. How These Measures Are Useful When used in conjunction with GAAP financial measures, EBITDA and adjusted EBITDA are supplemental measures of operating performance that the Company believes are useful measures to facilitate comparisons to historical performance and competitors' operating results. Adjusted EBITDA is a key metric used internally by management to develop internal budgets and forecasts and also serves as a metric in its performance-based equity incentive programs and certain bonus arrangements. The Company believes presentation of EBITDA and adjusted EBITDA provides investors with a supplemental view of the Company's operating performance that facilitates analysis and comparisons of its ongoing business operations because they exclude items that may not be indicative of the Company's ongoing operating performance. Strategic Plan Update Board of Directors Meeting| Q1 2020 23
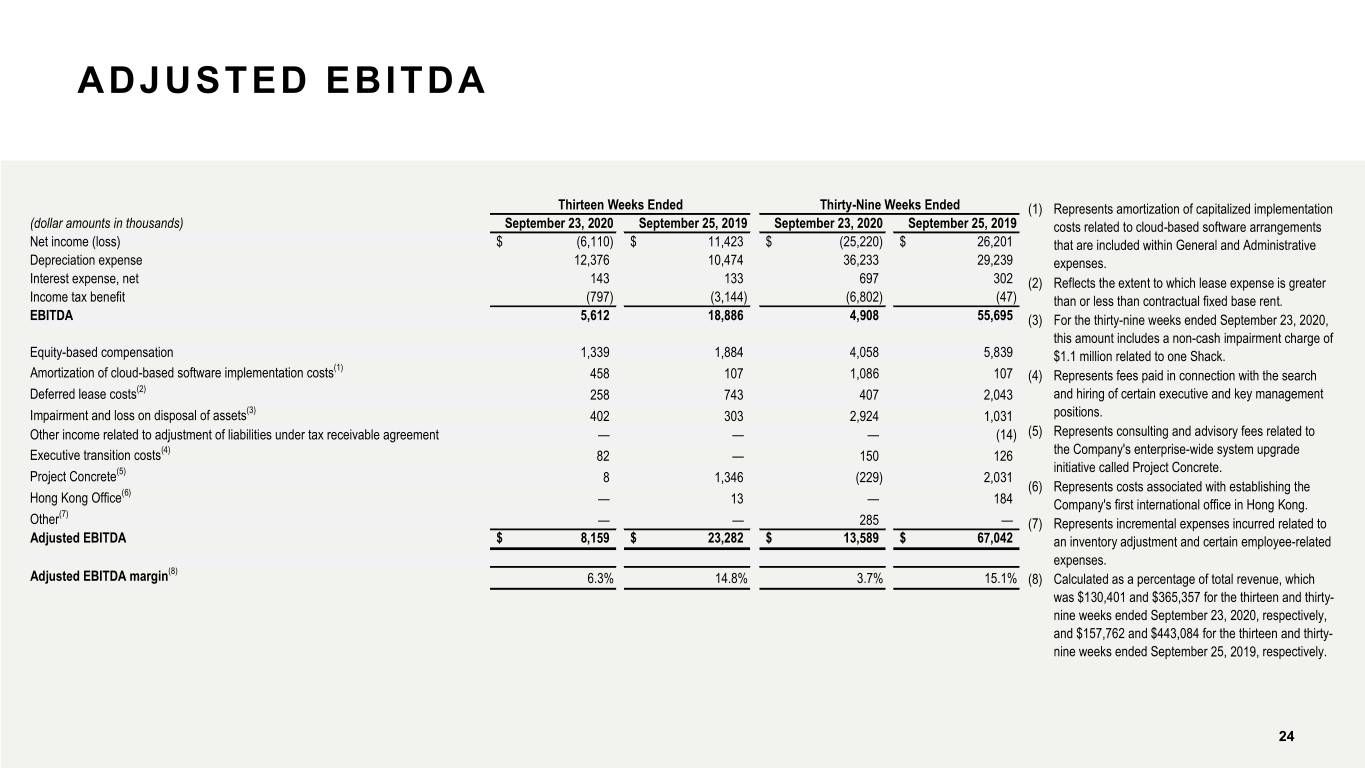
ADJUSTED EBITDA Thirteen Weeks Ended Thirty-Nine Weeks Ended (1) Represents amortization of capitalized implementation (dollar amounts in thousands) September 23, 2020 September 25, 2019 September 23, 2020 September 25, 2019 costs related to cloud-based software arrangements Net income (loss) $ (6,110) $ 11,423 $ (25,220) $ 26,201 that are included within General and Administrative Depreciation expense 12,376 10,474 36,233 29,239 expenses. Interest expense, net 143 133 697 302 (2) Reflects the extent to which lease expense is greater Income tax benefit (797) (3,144) (6,802) (47) than or less than contractual fixed base rent. EBITDA 5,612 18,886 4,908 55,695 (3) For the thirty-nine weeks ended September 23, 2020, this amount includes a non-cash impairment charge of Equity-based compensation 1,339 1,884 4,058 5,839 $1.1 million related to one Shack. (1) Amortization of cloud-based software implementation costs 458 107 1,086 107 (4) Represents fees paid in connection with the search Deferred lease costs(2) 258 743 407 2,043 and hiring of certain executive and key management Impairment and loss on disposal of assets(3) 402 303 2,924 1,031 positions. Other income related to adjustment of liabilities under tax receivable agreement — — — (14) (5) Represents consulting and advisory fees related to Executive transition costs(4) 82 — 150 126 the Company's enterprise-wide system upgrade initiative called Project Concrete. Project Concrete(5) 8 1,346 (229) 2,031 (6) (6) Represents costs associated with establishing the Hong Kong Office — 13 — 184 Company's first international office in Hong Kong. (7) Other — — 285 — (7) Represents incremental expenses incurred related to Adjusted EBITDA $ 8,159 $ 23,282 $ 13,589 $ 67,042 an inventory adjustment and certain employee-related expenses. (8) Adjusted EBITDA margin 6.3% 14.8% 3.7% 15.1% (8) Calculated as a percentage of total revenue, which was $130,401 and $365,357 for the thirteen and thirty- nine weeks ended September 23, 2020, respectively, and $157,762 and $443,084 for the thirteen and thirty- nine weeks ended September 25, 2019, respectively. Strategic Plan Update Board of Directors Meeting| Q1 2020 24
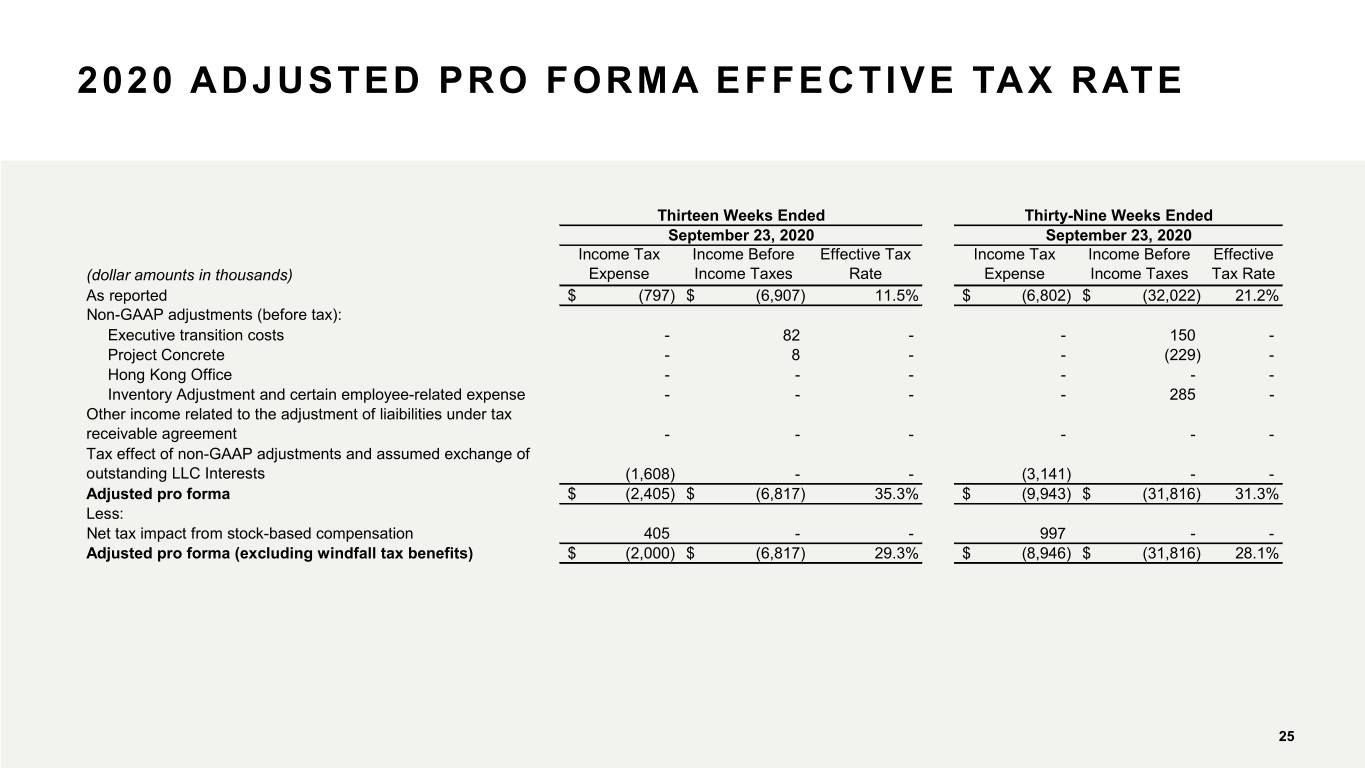
2020 ADJUSTED PRO FORMA EFFECTIVE TAX RATE Thirteen Weeks Ended Thirty-Nine Weeks Ended September 23, 2020 September 23, 2020 Income Tax Income Before Effective Tax Income Tax Income Before Effective (dollar amounts in thousands) Expense Income Taxes Rate Expense Income Taxes Tax Rate As reported $ (797) $ (6,907) 11.5% $ (6,802) $ (32,022) 21.2% Non-GAAP adjustments (before tax): Executive transition costs - 82 - - 150 - Project Concrete - 8 - - (229) - Hong Kong Office - - - - - - Inventory Adjustment and certain employee-related expense - - - - 285 - Other income related to the adjustment of liaibilities under tax receivable agreement - - - - - - Tax effect of non-GAAP adjustments and assumed exchange of outstanding LLC Interests (1,608) - - (3,141) - - Adjusted pro forma $ (2,405) $ (6,817) 35.3% $ (9,943) $ (31,816) 31.3% Less: Net tax impact from stock-based compensation 405 - - 997 - - Adjusted pro forma (excluding windfall tax benefits) $ (2,000) $ (6,817) 29.3% $ (8,946) $ (31,816) 28.1% Strategic Plan Update Board of Directors Meeting| Q1 2020 25
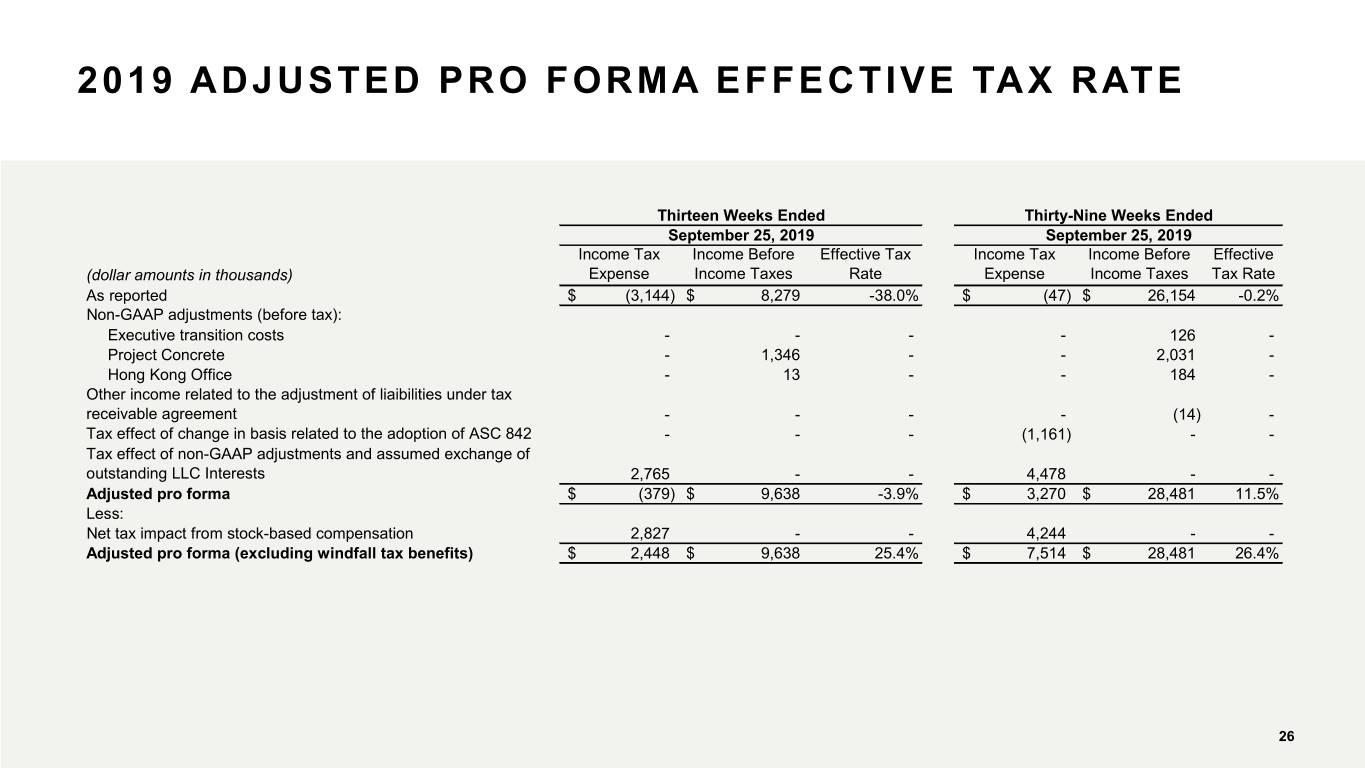
2019 ADJUSTED PRO FORMA EFFECTIVE TAX RATE Thirteen Weeks Ended Thirty-Nine Weeks Ended September 25, 2019 September 25, 2019 Income Tax Income Before Effective Tax Income Tax Income Before Effective (dollar amounts in thousands) Expense Income Taxes Rate Expense Income Taxes Tax Rate As reported $ (3,144) $ 8,279 -38.0% $ (47) $ 26,154 -0.2% Non-GAAP adjustments (before tax): Executive transition costs - - - - 126 - Project Concrete - 1,346 - - 2,031 - Hong Kong Office - 13 - - 184 - Other income related to the adjustment of liaibilities under tax receivable agreement - - - - (14) - Tax effect of change in basis related to the adoption of ASC 842 - - - (1,161) - - Tax effect of non-GAAP adjustments and assumed exchange of outstanding LLC Interests 2,765 - - 4,478 - - Adjusted pro forma $ (379) $ 9,638 -3.9% $ 3,270 $ 28,481 11.5% Less: Net tax impact from stock-based compensation 2,827 - - 4,244 - - Adjusted pro forma (excluding windfall tax benefits) $ 2,448 $ 9,638 25.4% $ 7,514 $ 28,481 26.4% Strategic Plan Update Board of Directors Meeting| Q1 2020 26

CONTACT INFORMATION INVESTOR CONTACT Melissa Calandruccio, ICR Michelle Michalski, ICR (844) Shack-04 (844-742-2504) investor@shakeshack.com MEDIA CONTACT Kristyn Clark, Shake Shack 646-747-8776 kclark@shakeshack.com Strategic Plan Update Board of Directors Meeting| Q1 2020 27
