Attached files
| file | filename |
|---|---|
| EX-99.1 - EX-99.1 - Regional Management Corp. | rm-ex991_6.htm |
| 8-K - 8-K - Regional Management Corp. | rm-8k_20201029.htm |
3Q 2020 Earnings Call Supplemental Presentation October 29, 2020 Exhibit 99.2
Legal Disclosures This document contains summarized information concerning Regional Management Corp. (the “Company”) and the Company’s business, operations, financial performance, and trends. No representation is made that the information in this document is complete. For additional financial, statistical, and business information, please see the Company’s most recent Annual Report on Form 10-K and Quarterly Reports on Form 10-Q filed with the U.S. Securities and Exchange Commission (the “SEC”), as well as the Company’s other reports filed with the SEC from time to time. Such reports are or will be available on the Company’s website (www.regionalmanagement.com) and on the SEC’s website (www.sec.gov). The information and opinions contained in this document are provided as of the date of this presentation and are subject to change without notice. This document has not been approved by any regulatory or supervisory authority. This presentation, the related remarks, and the responses to various questions may contain various “forward-looking statements” within the meaning of the Private Securities Litigation Reform Act of 1995. Forward-looking statements are not statements of historical fact but instead represent the Company’s expectations or beliefs concerning future events. Forward-looking statements include, without limitation, statements concerning future plans, objectives, goals, projections, strategies, events, or performance, and underlying assumptions and other statements related thereto. Words such as “may,” “will,” “should,” “likely,” “anticipates,” “expects,” “intends,” “plans,” “projects,” “believes,” “estimates,” “outlook,” and similar expressions may be used to identify these forward-looking statements. Such forward-looking statements speak only as of the date on which they were made and are about matters that are inherently subject to risks and uncertainties, many of which are outside of the control of the Company. As a result, actual performance and results may differ materially from those contemplated by these forward-looking statements. Therefore, investors should not place undue reliance on such statements. Factors that could cause actual results or performance to differ from the expectations expressed or implied in forward-looking statements include, but are not limited to, the following: changes in general economic conditions, including levels of unemployment and bankruptcies; the impact of the recent outbreak of a novel coronavirus (COVID-19), including on the Company’s access to liquidity and the credit risk of the Company’s finance receivable portfolio; risks associated with the Company’s ability to timely and effectively implement, transition to, and maintain the necessary information technology systems, infrastructure, processes, and controls to support its operations and initiatives; risks associated with the Company’s loan origination and servicing software system, including the risk of prolonged system outages; risks related to opening new branches, including the ability or inability to open new branches as planned; risks inherent in making loans, including credit risk, repayment risk, and value of collateral, which risks may increase in light of adverse or recessionary economic conditions; risks associated with the implementation of new underwriting models and processes, including as to the effectiveness of new custom scorecards; risks relating to the Company’s asset-backed securitization transactions; changes in interest rates; the risk that the Company’s existing sources of liquidity become insufficient to satisfy its needs or that its access to these sources becomes unexpectedly restricted; changes in federal, state, or local laws, regulations, or regulatory policies and practices, and risks associated with the manner in which laws and regulations are interpreted, implemented, and enforced; changes in accounting standards, rules, and interpretations, and the failure of related assumptions and estimates, including those associated with the implementation of current expected credit loss (CECL) accounting; the impact of changes in tax laws, guidance, and interpretations; the timing and amount of revenues that may be recognized by the Company; changes in current revenue and expense trends (including trends affecting delinquencies and credit losses); changes in the Company’s markets and general changes in the economy (particularly in the markets served by the Company); changes in the competitive environment in which the Company operates or a decrease in the demand for its products; the timing and amount of future cash dividend payments; risks related to acquisitions; changes in operating and administrative expenses; and the departure, transition, or replacement of key personnel. The foregoing factors and others are discussed in greater detail in the Company’s filings with the SEC. The COVID-19 pandemic may also magnify many of these risks and uncertainties. The Company cannot guarantee future events, results, actions, levels of activity, performance, or achievements. The Company will not update or revise forward-looking statements to reflect events or circumstances after the date of this presentation or to reflect the occurrence of unanticipated events or the non-occurrence of anticipated events, whether as a result of new information, future developments, or otherwise, except as required by law. This presentation also contains certain non-GAAP measures. Please refer to the Appendix accompanying this presentation for a reconciliation of non-GAAP measures to the most comparable GAAP measures.
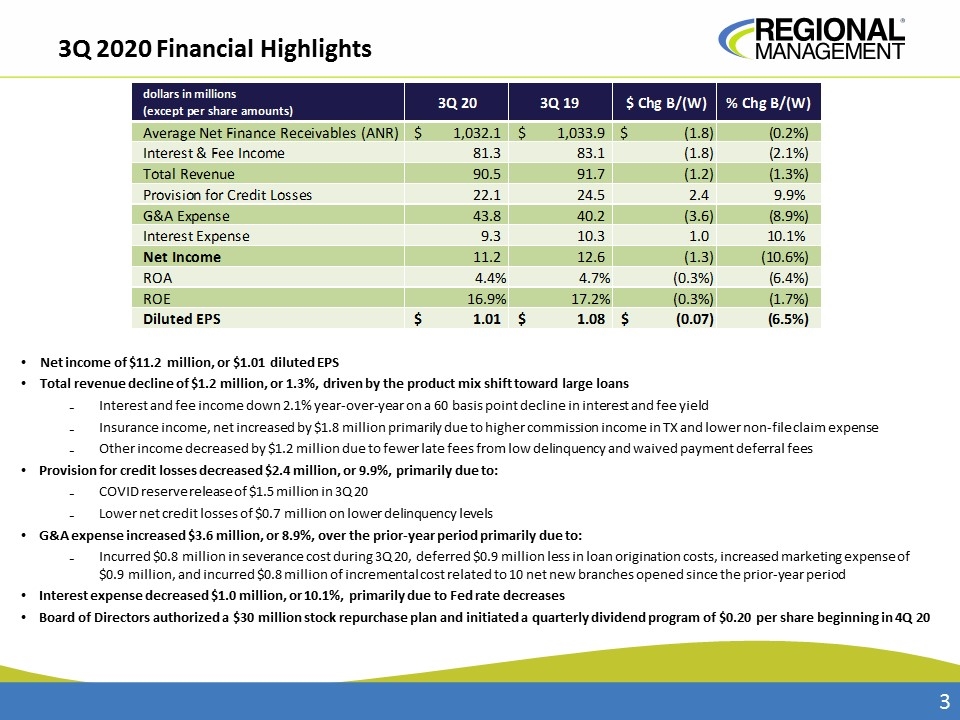
3Q 2020 Financial Highlights Net income of $11.2 million, or $1.01 diluted EPS Total revenue decline of $1.2 million, or 1.3%, driven by the product mix shift toward large loans Interest and fee income down 2.1% year-over-year on a 60 basis point decline in interest and fee yield Insurance income, net increased by $1.8 million primarily due to higher commission income in TX and lower non-file claim expense Other income decreased by $1.2 million due to fewer late fees from low delinquency and waived payment deferral fees Provision for credit losses decreased $2.4 million, or 9.9%, primarily due to: COVID reserve release of $1.5 million in 3Q 20 Lower net credit losses of $0.7 million on lower delinquency levels G&A expense increased $3.6 million, or 8.9%, over the prior-year period primarily due to: Incurred $0.8 million in severance cost during 3Q 20, deferred $0.9 million less in loan origination costs, increased marketing expense of $0.9 million, and incurred $0.8 million of incremental cost related to 10 net new branches opened since the prior-year period Interest expense decreased $1.0 million, or 10.1%, primarily due to Fed rate decreases Board of Directors authorized a $30 million stock repurchase plan and initiated a quarterly dividend program of $0.20 per share beginning in 4Q 20
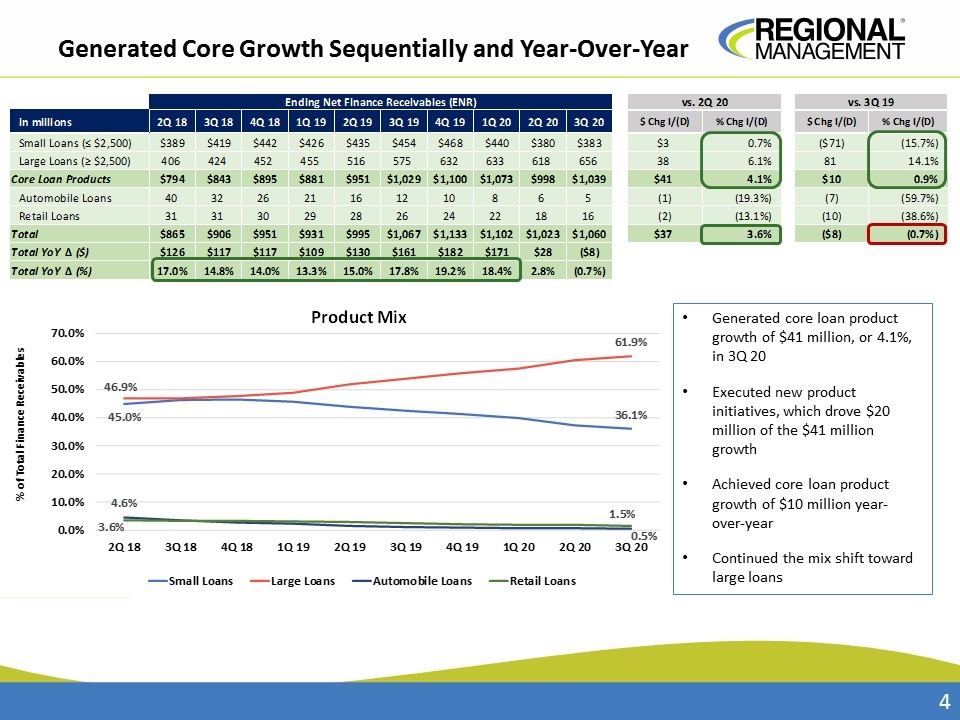
Generated Core Growth Sequentially and Year-Over-Year Generated core loan product growth of $41 million, or 4.1%, in 3Q 20 Executed new product initiatives, which drove $20 million of the $41 million growth Achieved core loan product growth of $10 million year-over-year Continued the mix shift toward large loans
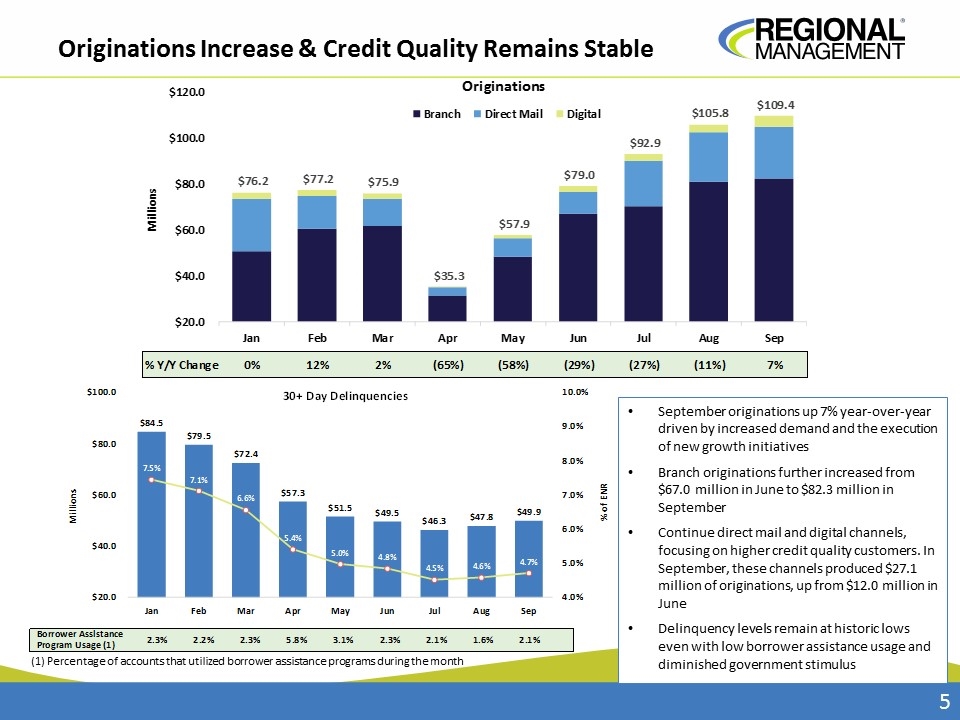
Originations Increase & Credit Quality Remains Stable September originations up 7% year-over-year driven by increased demand and the execution of new growth initiatives Branch originations further increased from $67.0 million in June to $82.3 million in September Continue direct mail and digital channels, focusing on higher credit quality customers. In September, these channels produced $27.1 million of originations, up from $12.0 million in June Delinquency levels remain at historic lows even with low borrower assistance usage and diminished government stimulus (1) Percentage of accounts that utilized borrower assistance programs during the month
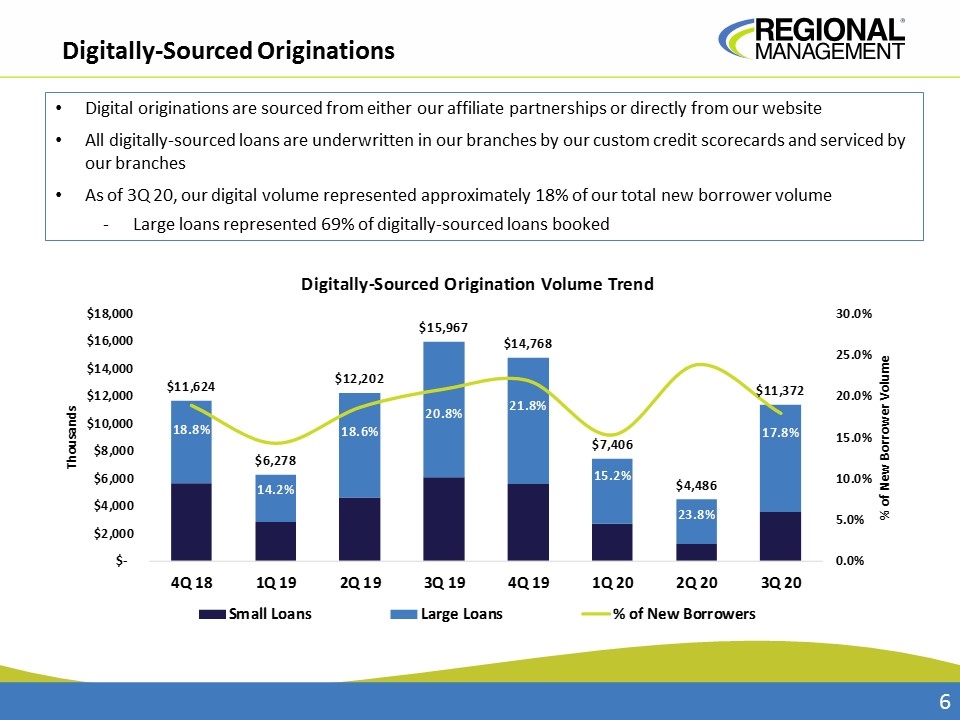
Digitally-Sourced Originations Digital originations are sourced from either our affiliate partnerships or directly from our website All digitally-sourced loans are underwritten in our branches by our custom credit scorecards and serviced by our branches As of 3Q 20, our digital volume represented approximately 18% of our total new borrower volume Large loans represented 69% of digitally-sourced loans booked
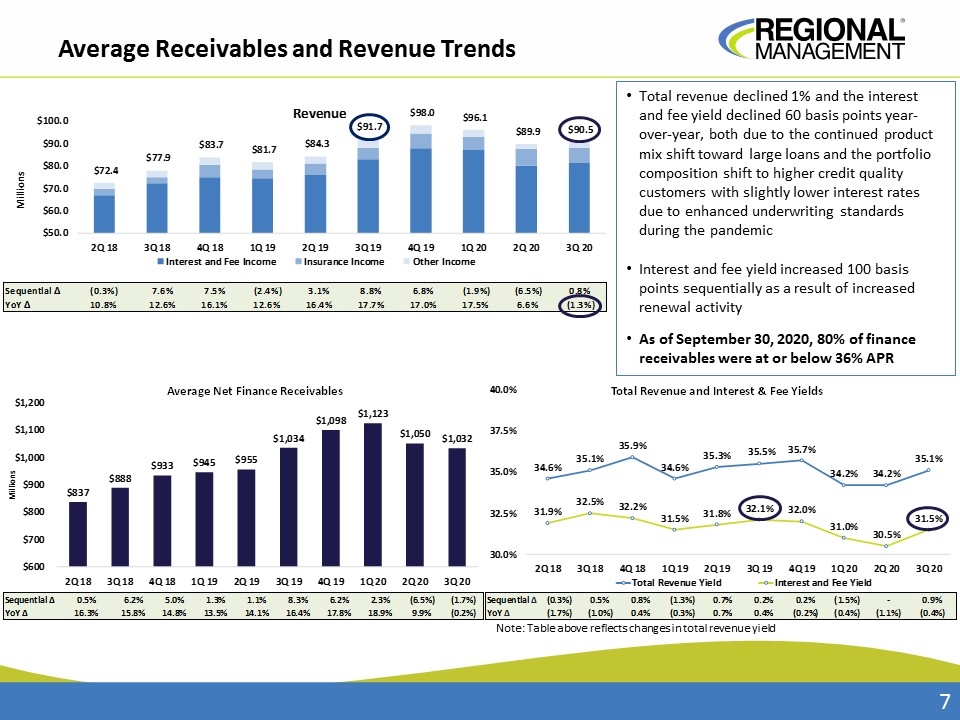
Average Receivables and Revenue Trends Total revenue declined 1% and the interest and fee yield declined 60 basis points year-over-year, both due to the continued product mix shift toward large loans and the portfolio composition shift to higher credit quality customers with slightly lower interest rates due to enhanced underwriting standards during the pandemic Interest and fee yield increased 100 basis points sequentially as a result of increased renewal activity As of September 30, 2020, 80% of finance receivables were at or below 36% APR Note: Table above reflects changes in total revenue yield
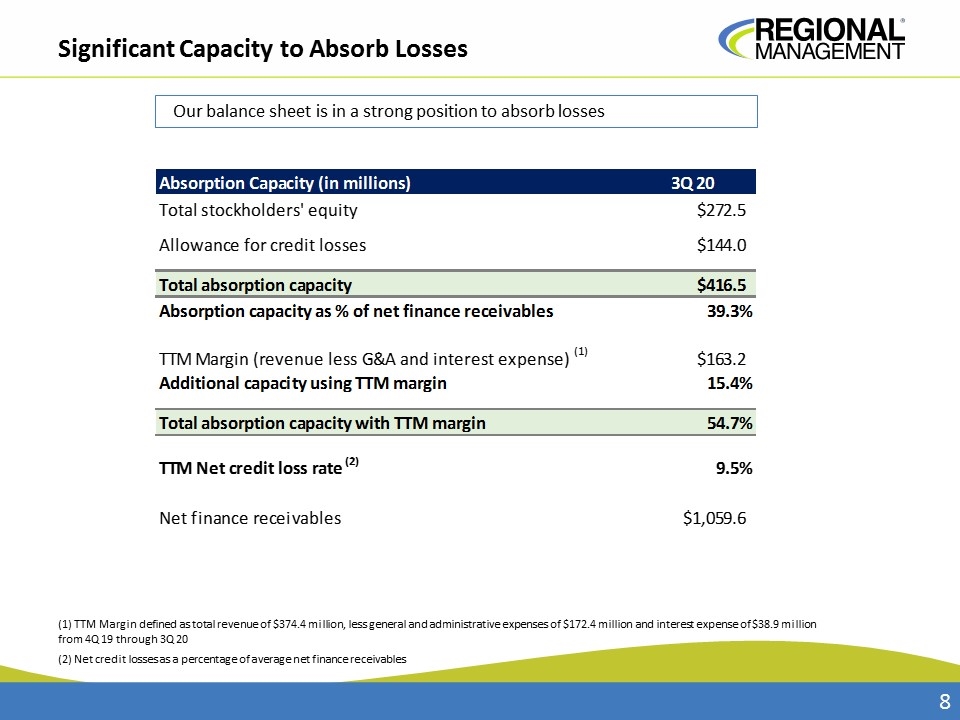
(1) TTM Margin defined as total revenue of $374.4 million, less general and administrative expenses of $172.4 million and interest expense of $38.9 million from 4Q 19 through 3Q 20 (2) Net credit losses as a percentage of average net finance receivables Significant Capacity to Absorb Losses Our balance sheet is in a strong position to absorb losses
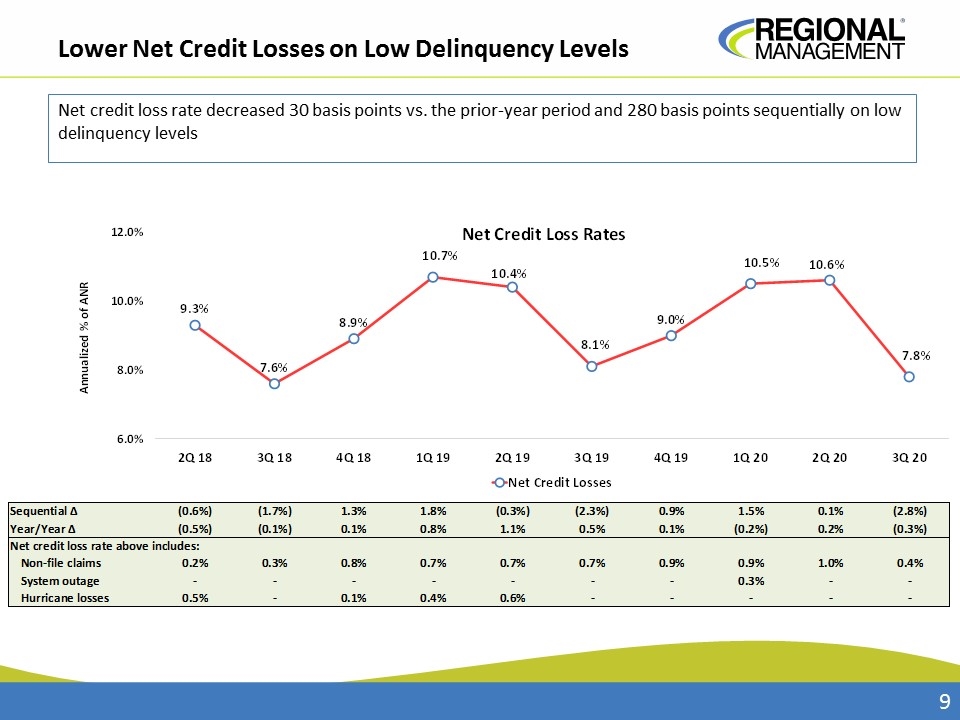
Lower Net Credit Losses on Low Delinquency Levels Net credit loss rate decreased 30 basis points vs. the prior-year period and 280 basis points sequentially on low delinquency levels
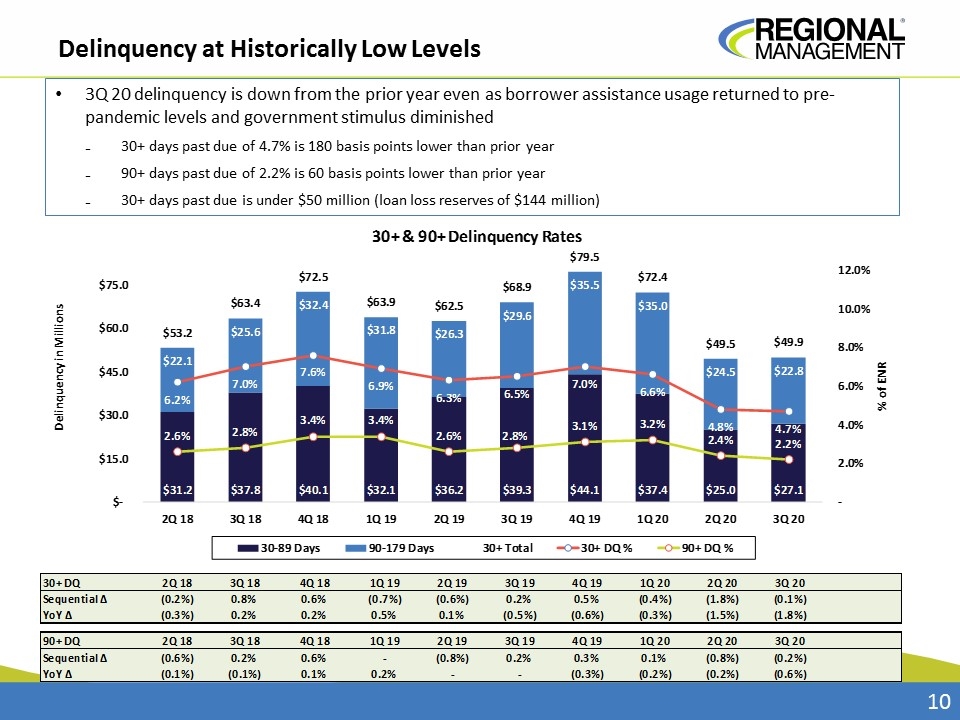
Delinquency at Historically Low Levels 3Q 20 delinquency is down from the prior year even as borrower assistance usage returned to pre-pandemic levels and government stimulus diminished 30+ days past due of 4.7% is 180 basis points lower than prior year 90+ days past due of 2.2% is 60 basis points lower than prior year 30+ days past due is under $50 million (loan loss reserves of $144 million)
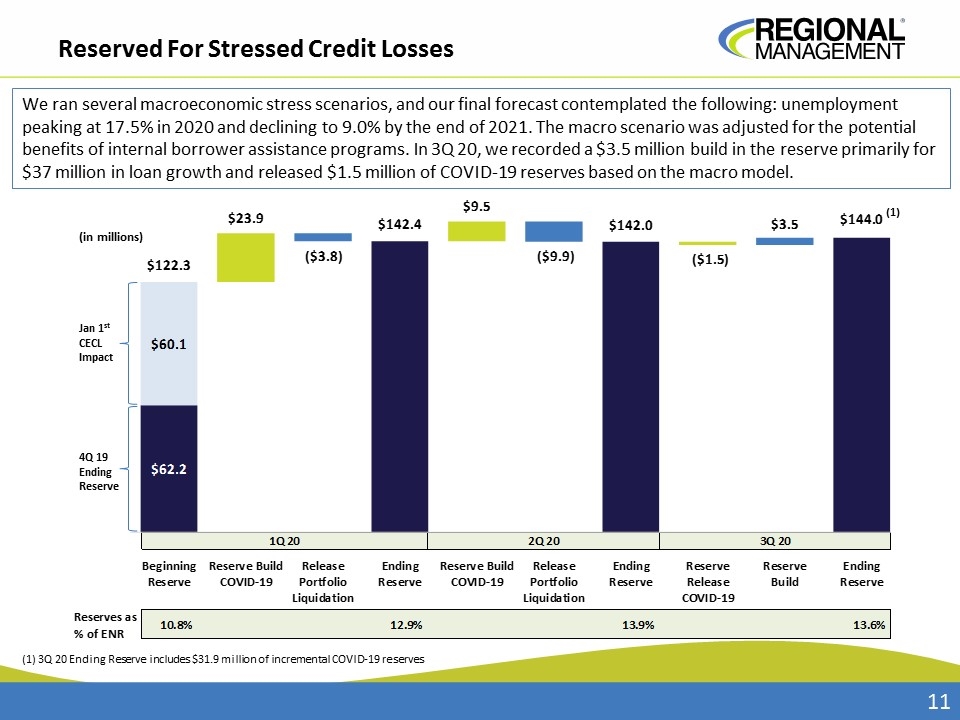
Reserved For Stressed Credit Losses (1) 3Q 20 Ending Reserve includes $31.9 million of incremental COVID-19 reserves (in millions) We ran several macroeconomic stress scenarios, and our final forecast contemplated the following: unemployment peaking at 17.5% in 2020 and declining to 9.0% by the end of 2021. The macro scenario was adjusted for the potential benefits of internal borrower assistance programs. In 3Q 20, we recorded a $3.5 million build in the reserve primarily for $37 million in loan growth and released $1.5 million of COVID-19 reserves based on the macro model. 4Q 19 Ending Reserve Jan 1st CECL Impact (1)
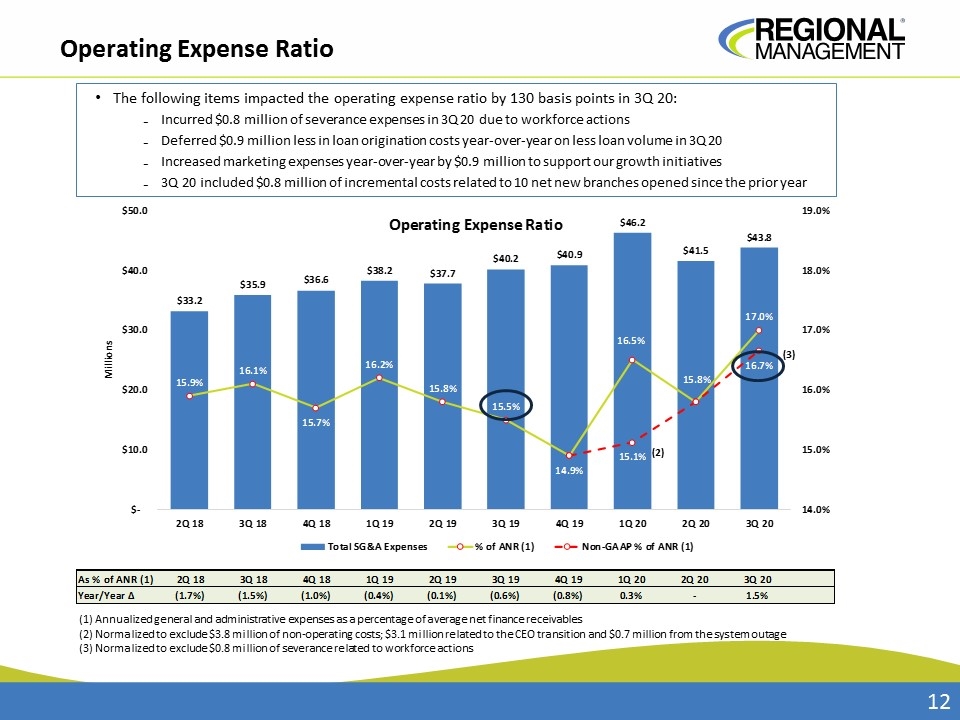
Operating Expense Ratio (1) Annualized general and administrative expenses as a percentage of average net finance receivables (2) Normalized to exclude $3.8 million of non-operating costs; $3.1 million related to the CEO transition and $0.7 million from the system outage (3) Normalized to exclude $0.8 million of severance related to workforce actions The following items impacted the operating expense ratio by 130 basis points in 3Q 20: Incurred $0.8 million of severance expenses in 3Q 20 due to workforce actions Deferred $0.9 million less in loan origination costs year-over-year on less loan volume in 3Q 20 Increased marketing expenses year-over-year by $0.9 million to support our growth initiatives 3Q 20 included $0.8 million of incremental costs related to 10 net new branches opened since the prior year (2) (3)
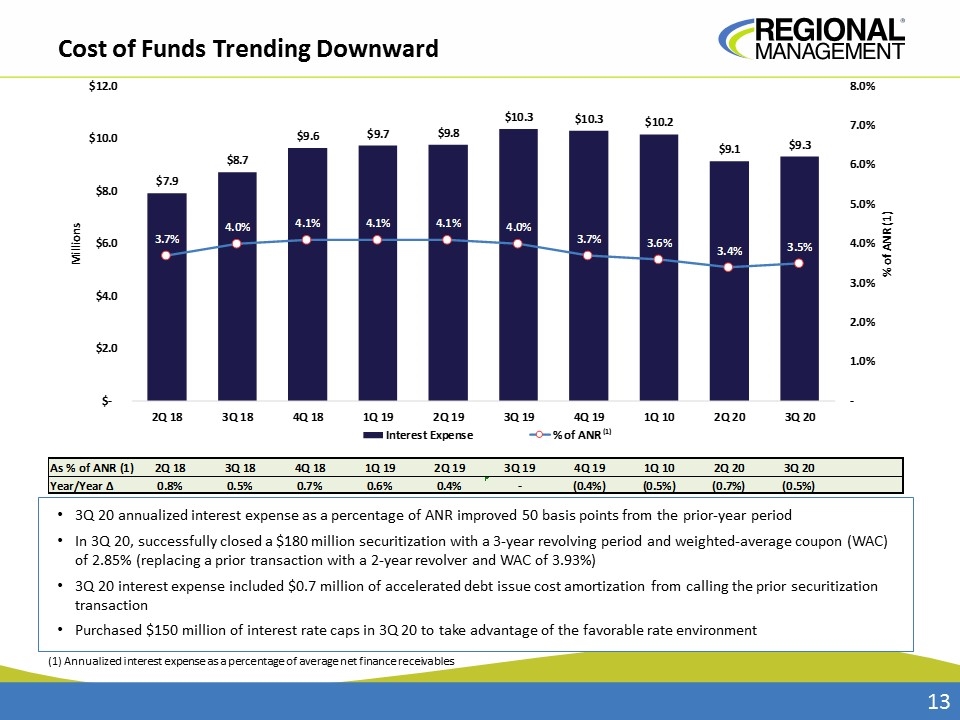
Cost of Funds Trending Downward 3Q 20 annualized interest expense as a percentage of ANR improved 50 basis points from the prior-year period In 3Q 20, successfully closed a $180 million securitization with a 3-year revolving period and weighted-average coupon (WAC) of 2.85% (replacing a prior transaction with a 2-year revolver and WAC of 3.93%) 3Q 20 interest expense included $0.7 million of accelerated debt issue cost amortization from calling the prior securitization transaction Purchased $150 million of interest rate caps in 3Q 20 to take advantage of the favorable rate environment (1) Annualized interest expense as a percentage of average net finance receivables
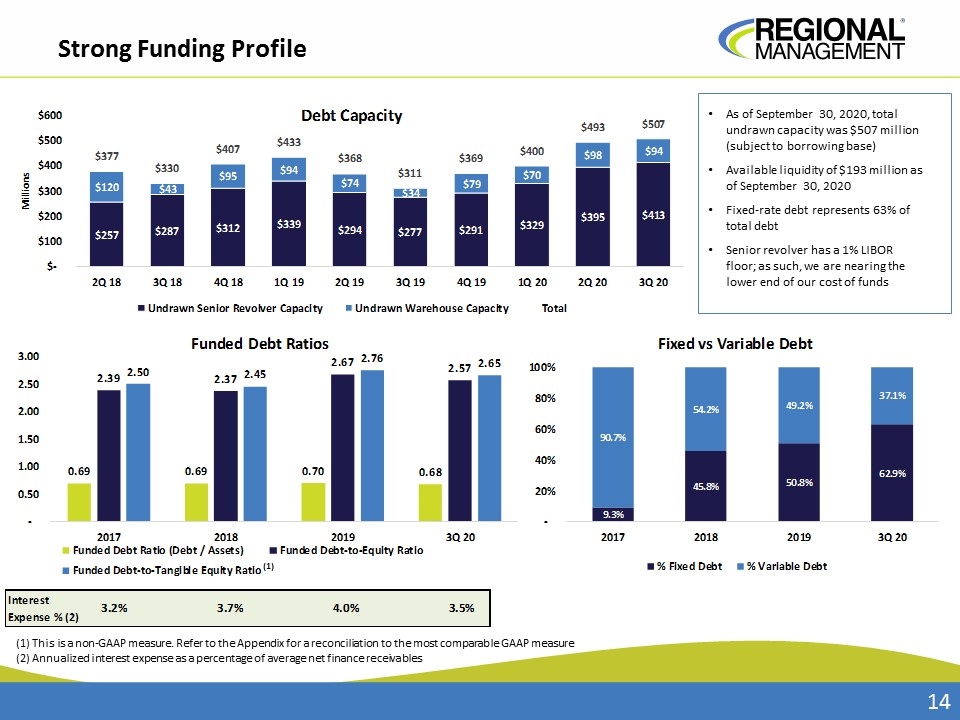
Strong Funding Profile (1) This is a non-GAAP measure. Refer to the Appendix for a reconciliation to the most comparable GAAP measure (2) Annualized interest expense as a percentage of average net finance receivables (1) As of September 30, 2020, total undrawn capacity was $507 million (subject to borrowing base) Available liquidity of $193 million as of September 30, 2020 Fixed-rate debt represents 63% of total debt Senior revolver has a 1% LIBOR floor; as such, we are nearing the lower end of our cost of funds
Appendix
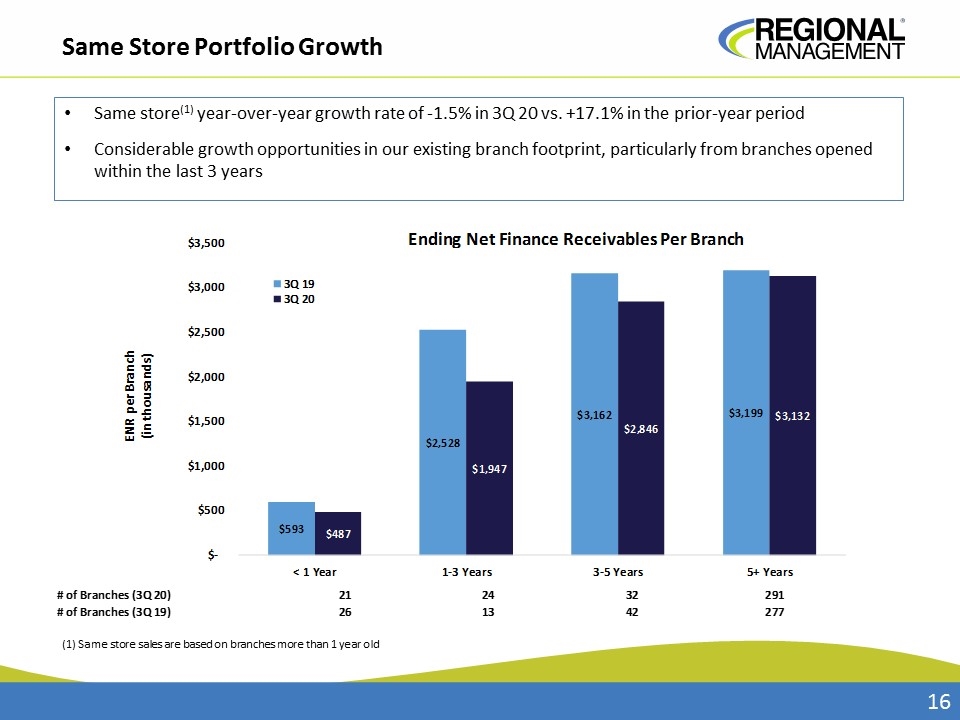
Same Store Portfolio Growth (1) Same store sales are based on branches more than 1 year old Same store(1) year-over-year growth rate of -1.5% in 3Q 20 vs. +17.1% in the prior-year period Considerable growth opportunities in our existing branch footprint, particularly from branches opened within the last 3 years
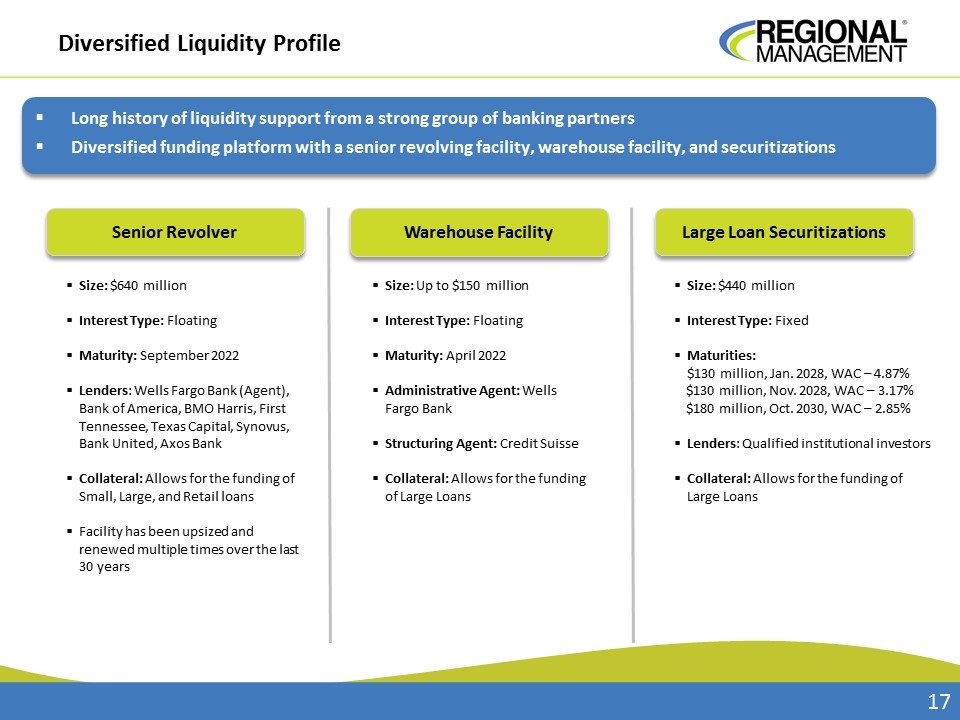
Senior Revolver Size: $640 million Interest Type: Floating Maturity: September 2022 Lenders: Wells Fargo Bank (Agent), Bank of America, BMO Harris, First Tennessee, Texas Capital, Synovus, Bank United, Axos Bank Collateral: Allows for the funding of Small, Large, and Retail loans Facility has been upsized and renewed multiple times over the last 30 years Large Loan Securitizations Warehouse Facility Size: Up to $150 million Interest Type: Floating Maturity: April 2022 Administrative Agent: Wells Fargo Bank Structuring Agent: Credit Suisse Collateral: Allows for the funding of Large Loans Size: $440 million Interest Type: Fixed Maturities: $130 million, Jan. 2028, WAC – 4.87% $130 million, Nov. 2028, WAC – 3.17% $180 million, Oct. 2030, WAC – 2.85% Lenders: Qualified institutional investors Collateral: Allows for the funding of Large Loans Long history of liquidity support from a strong group of banking partners Diversified funding platform with a senior revolving facility, warehouse facility, and securitizations Diversified Liquidity Profile
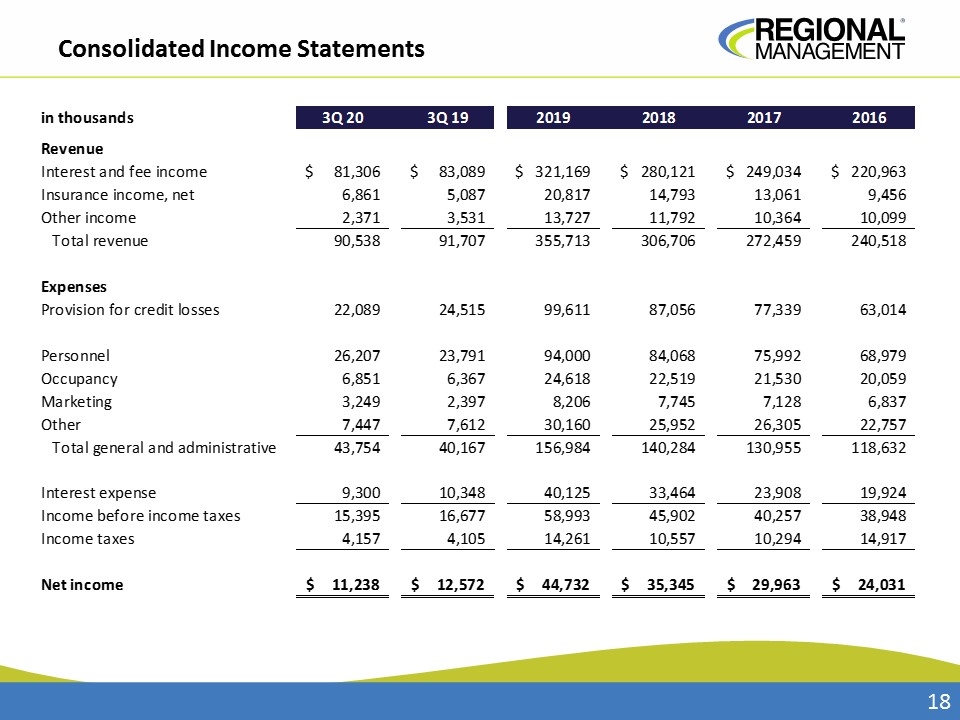
Consolidated Income Statements
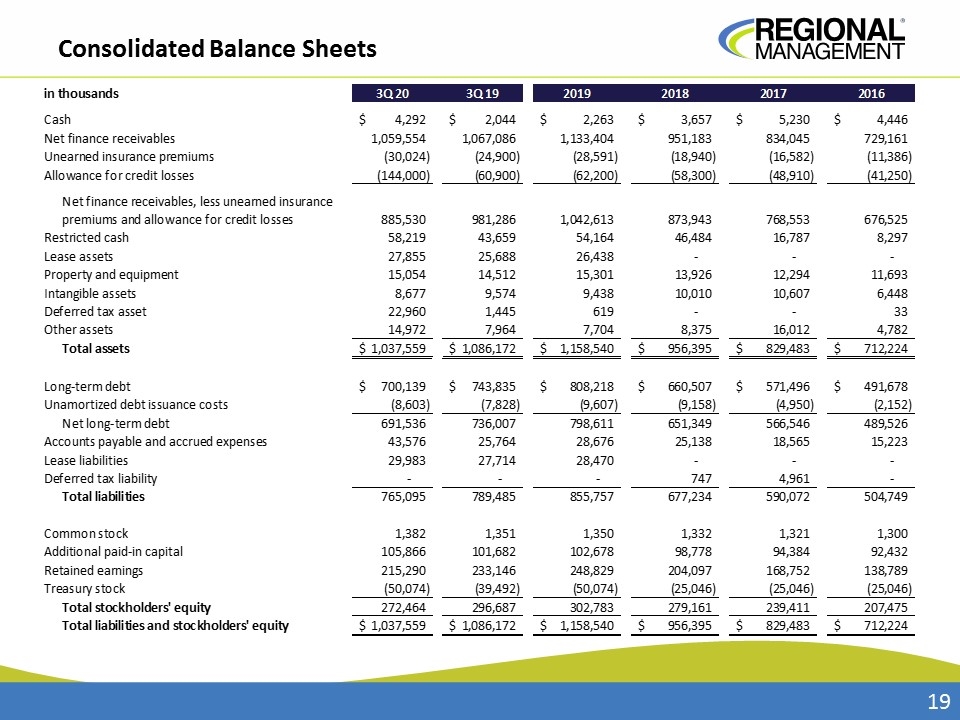
Consolidated Balance Sheets
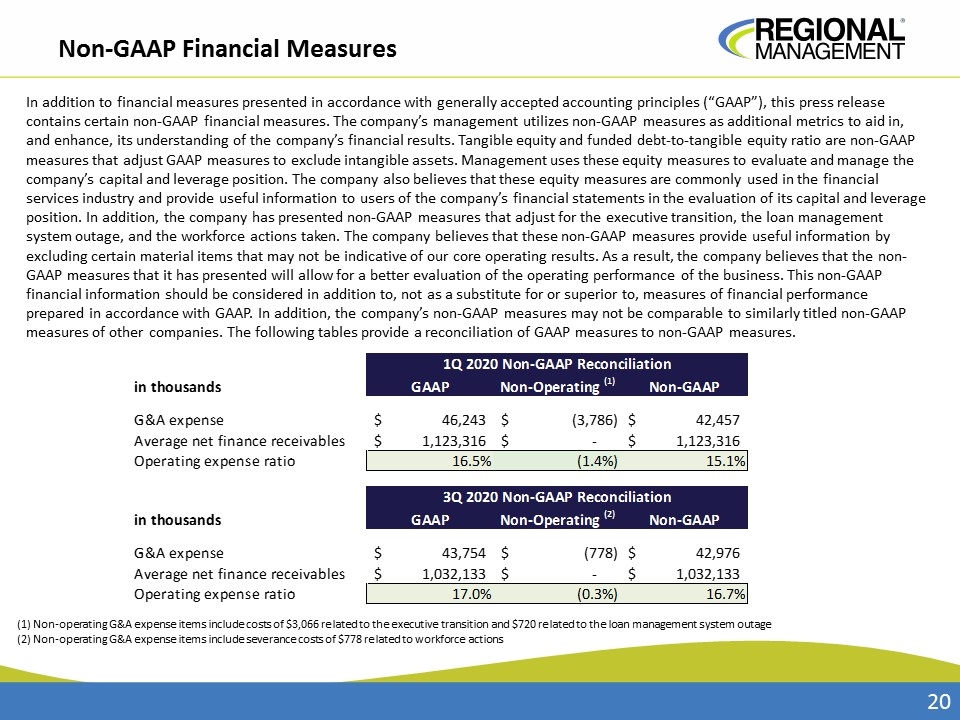
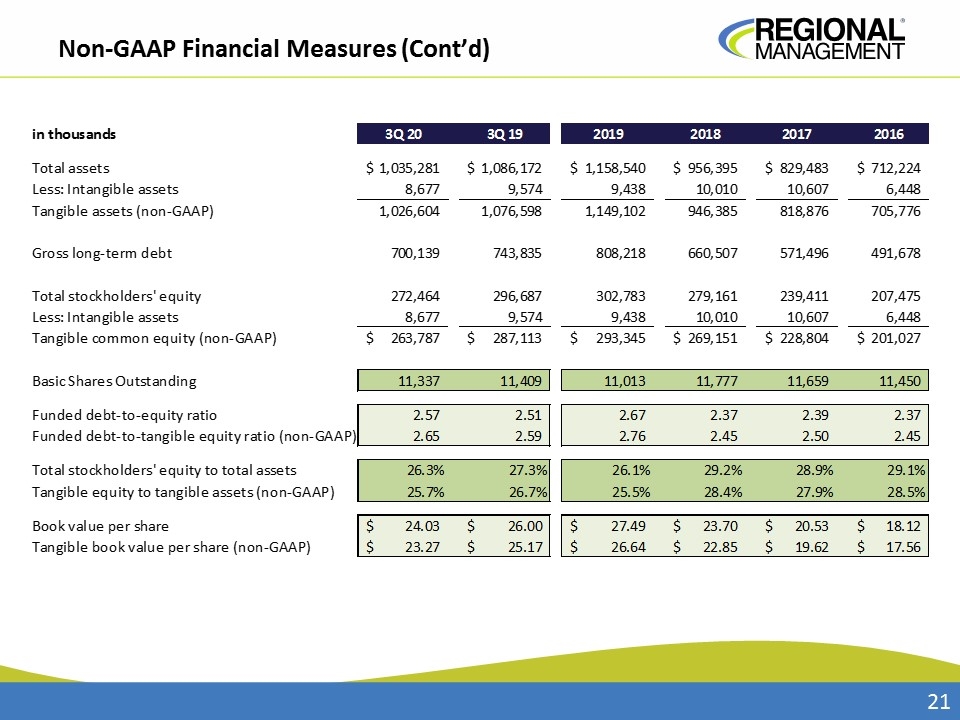
Non-GAAP Financial Measures In addition to financial measures presented in accordance with generally accepted accounting principles (“GAAP”), this press release contains certain non-GAAP financial measures. The company’s management utilizes non-GAAP measures as additional metrics to aid in, and enhance, its understanding of the company’s financial results. Tangible equity and funded debt-to-tangible equity ratio are non-GAAP measures that adjust GAAP measures to exclude intangible assets. Management uses these equity measures to evaluate and manage the company’s capital and leverage position. The company also believes that these equity measures are commonly used in the financial services industry and provide useful information to users of the company’s financial statements in the evaluation of its capital and leverage position. In addition, the company has presented non-GAAP measures that adjust for the executive transition, the loan management system outage, and the workforce actions taken. The company believes that these non-GAAP measures provide useful information by excluding certain material items that may not be indicative of our core operating results. As a result, the company believes that the non-GAAP measures that it has presented will allow for a better evaluation of the operating performance of the business. This non-GAAP financial information should be considered in addition to, not as a substitute for or superior to, measures of financial performance prepared in accordance with GAAP. In addition, the company’s non-GAAP measures may not be comparable to similarly titled non-GAAP measures of other companies. The following tables provide a reconciliation of GAAP measures to non-GAAP measures. (1) Non-operating G&A expense items include costs of $3,066 related to the executive transition and $720 related to the loan management system outage (2) Non-operating G&A expense items include severance costs of $778 related to workforce actions
Non-GAAP Financial Measures (Cont’d)
