Attached files
| file | filename |
|---|---|
| EX-99.1 - EX-99.1 - MEDICAL PROPERTIES TRUST INC | d71472dex991.htm |
| 8-K - 8-K - MEDICAL PROPERTIES TRUST INC | d71472d8k.htm |
Exhibit 99.2
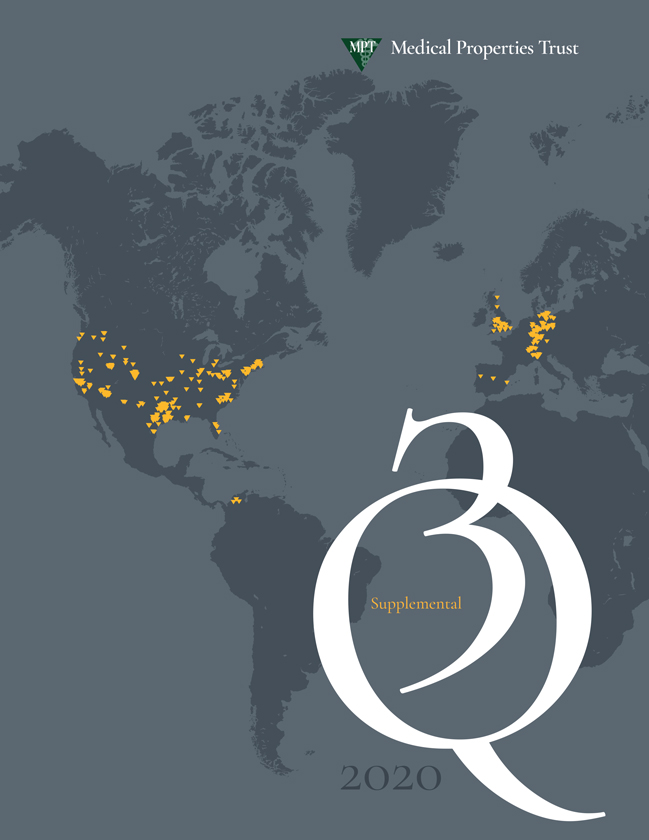
Medical Properties Trust
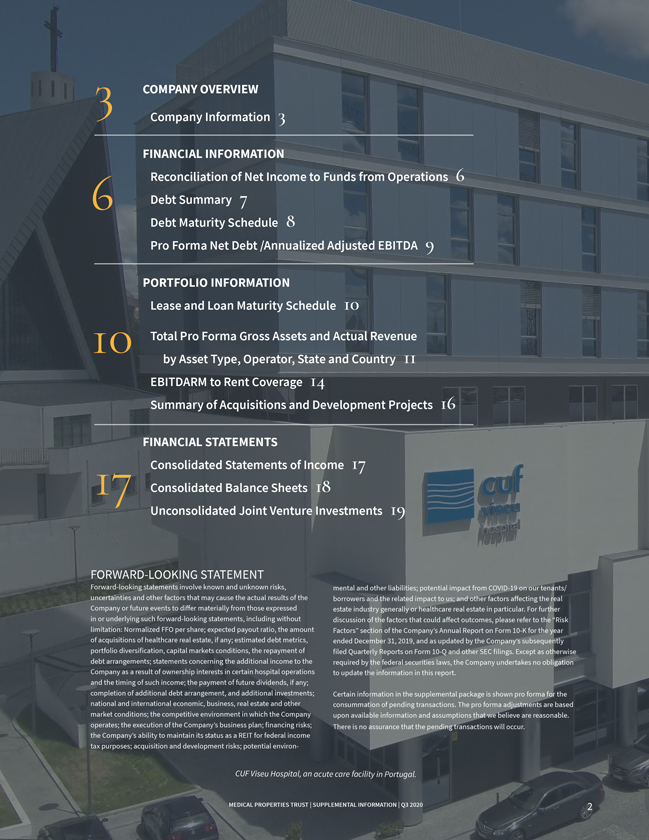
3 COMPANY OVERVIEW Company Information 3 FINANCIAL INFORMATION Reconciliation of Net Income to Funds from Operations 6 6 Debt Summary 7 Debt Maturity Schedule 8 Pro Forma Net Debt /Annualized Adjusted EBITDA 9 PORTFOLIO INFORMATION Lease and Loan Maturity Schedule 10 10 Total Pro Forma Gross Assets and Actual Revenue by Asset Type, Operator, State and Country 11 EBITDARM to Rent Coverage 14 Summary of Acquisitions and Development Projects 16 FINANCIAL STATEMENTS Consolidated Statements of Income 17 17 Consolidated Balance Sheets 18 Unconsolidated Joint Venture Investments 19 FORWARD-LOOKING STATEMENT Forward-looking statements involve known and unknown risks, uncertainties and other factors that may cause the actual results of the Company or future events to differ materially from those expressed in or underlying such forward-looking statements, including without limitation: Normalized FFO per share; expected payout ratio, the amount of acquisitions of phealthcare real estate, if any; estimated debt metrics, portfolio diversification, capital markets conditions, the repayment of debt arrangements; statements concerning the additional income to the Company as a result of ownership interests in certain hospital operations and the timing of such income; the payment of future dividends, if any; completion of additional debt arrangement, and additional investments; national and international economic, business, real estate and other market conditions; the competitive environment in which the Company operates; the execution of the Company’s business plan; financing risks; the Company’s ability to maintain its status as a REIT for federal income tax purposes; acquisition and development risks; potential environ- mental and other liabilities; potential impact from COVID-19 on our tenants/ borrowers and the related impact to us; and other factors affecting the real estate industry generally or healthcare real estate in particular. For further discussion of the factors that could affect outcomes, please refer to the “Risk Factors” section of the Company’s Annual Report on Form 10-K for the year ended December 31, 2019, and as updated by the Company’s subsequently filed Quarterly Reports on Form 10-Q and other SEC filings. Except as otherwise required by the federal securities laws, the Company undertakes no obligation to update the information in this report. Certain information in the supplemental package is shown pro forma for the consummation of pending transactions. The pro forma adjustments are based upon available information and assumptions that we believe are reasonable. There is no assurance that the pending transactions will occur. CUF Viseu Hospital, an acute care facility in Portugal. MEDICAL PROPERTIES TRUST | SUPPLEMENTAL INFORMATION | Q3 2020 2

COMPANY OVERVIEW Medical Properties Trust, Inc. is a self-advised real estate investment trust formed in 2003 to acquire and develop net-leased hospital facilities. From its inception in Birmingham, Alabama, the Company has grown to become one of the world’s largest owners of hospitals. MPT’s financing model facilitates acquisitions and recapitalizations and allows operators of hospitals to unlock the value of their real estate assets to fund facility improvements, technology upgrades and other investments in operations. 385 46 ~42,000 33 9 properties operators beds U. S. states countries MEDICAL PROPERTIES TRUST | SUPPLEMENTAL INFORMATION | Q3 2020 3

COMPANY OVERVIEW MPT OFFICERS: From the Left: Charles R. Lambert, Rosa H. Hooper, R. Lucas Savage, Edward K. Aldag, Jr., R. Steven Hamner, Emmett E. McLean and J. Kevin Hanna. Officers Edward K. Aldag, Jr. Chairman, President and Chief Executive Officer R. Steven Hamner Executive Vice President and Chief Financial Officer Emmett E. McLean Executive Vice President, Chief Operating Officer and Secretary J. Kevin Hanna Vice President, Controller and Chief Accounting Officer Rosa H. Hooper Vice President, Managing Director of Asset Management and Underwriting R. Lucas Savage Vice President, International Acquisitions Charles R. Lambert Vice President, Treasurer and Managing Director of Capital Markets Board of Directors Edward K. Aldag, Jr. G. Steven Dawson R. Steven Hamner Caterina A. Mozingo Elizabeth N. Pitman D. Paul Sparks, Jr. Michael G. Stewart C. Reynolds Thompson, III Corporate Headquarters Medical Properties Trust, Inc. 1000 Urban Center Drive, Suite 501 Birmingham, AL 35242 (205) 969-3755 (205) 969-3756 (fax) www.medicalpropertiestrust.com MEDICAL PROPERTIES TRUST | SUPPLEMENTAL INFORMATION | Q3 2020 4
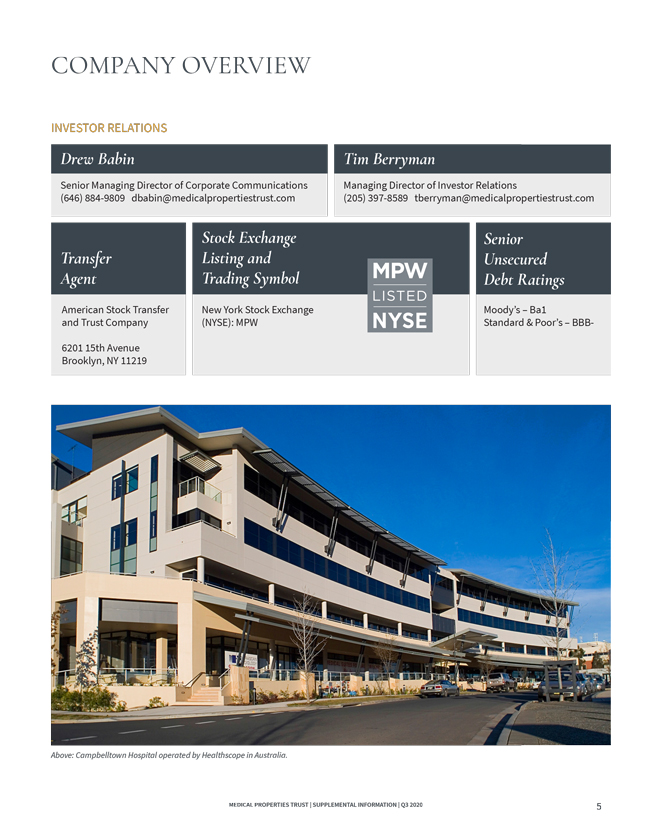
COMPANY OVERVIEW INVESTOR RELATIONS Drew Babin Senior Managing Director of Corporate Communications (646) 884-9809 dbabin@medicalpropertiestrust.com Tim Berryman Managing Director of Investor Relations (205) 397-8589 tberryman@medicalpropertiestrust.com Transfer Agent American Stock Transfer and Trust Company 6201 15th Avenue Brooklyn, NY 11219 Stock Exchange Listing and Trading Symbol New York Stock Exchange (NYSE): MPW Senior Unsecured Debt Ratings Moody’s – Ba1 Standard & Poor’s – BBB- Above: Campbelltown Hospital operated by Healthscope in Australia. MEDICAL PROPERTIES TRUST | SUPPLEMENTAL INFORMATION | Q3 2020 5
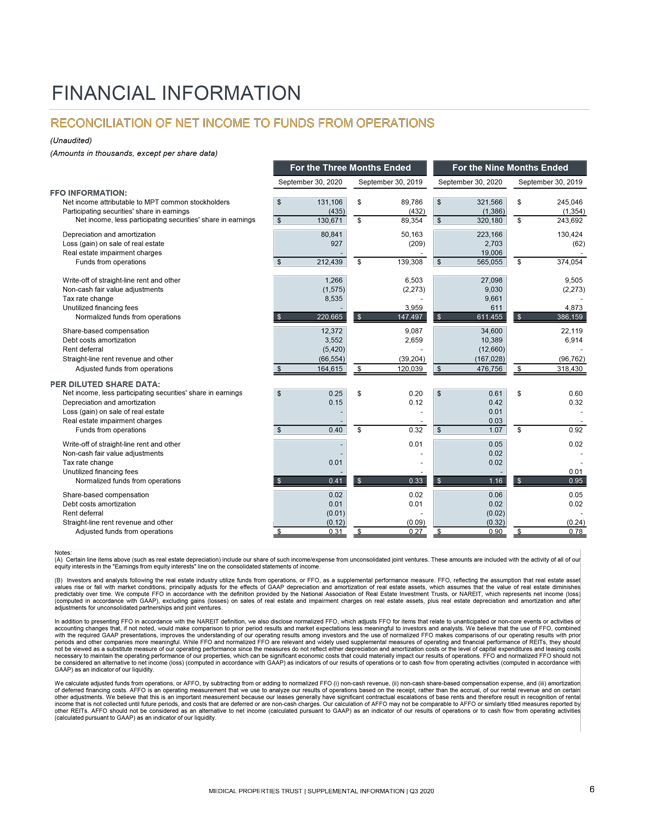
FINANCIAL INFORMATION RECONCILIATION OF NET INCOME TO FUNDS FROM OPERATIONS (Unaudited) (Amounts in thousands, except per share data) For the Three Months Ended For the Nine Months Ended September 30, 2020 September 30, 2019 September 30, 2020 September 30, 2019 FFO INFORMATION: Net income attributable to MPT common stockholders $ 131,106 $ 89,786 $ 321,566 $ 245,046 Participating securities’ share in earnings (435) (432) (1,386) (1,354) Net income, less participating securities’ share in earnings $ 130,671 $ 89,354 $ 320,180 $ 243,692 Depreciation and amortization 80,841 50,163 223,166 130,424 Loss (gain) on sale of real estate 927 (209) 2,703 (62) Real estate impairment charges —— 19,006 —Funds from operations $ 212,439 $ 139,308 $ 565,055 $ 374,054 Write-off of straight-line rent and other 1,266 6,503 27,098 9,505 Non-cash fair value adjustments (1,575) (2,273) 9,030 (2,273) Tax rate change 8,535 — 9,661 —Unutilized financing fees — 3,959 611 4,873 Normalized funds from operations $ 220,665 $ 147,497 $ 611,455 $ 386,159 Share-based compensation 12,372 9,087 34,600 22,119 Debt costs amortization 3,552 2,659 10,389 6,914 Rent deferral (5,420) — (12,660) —Straight-line rent revenue and other (66,554) (39,204) (167,028) (96,762) Adjusted funds from operations $ 164,615 $ 120,039 $ 476,756 $ 318,430 PER DILUTED SHARE DATA: Net income, less participating securities’ share in earnings $ 0.25 $ 0.20 $ 0.61 $ 0.60 Depreciation and amortization 0.15 0.12 0.42 0.32 Loss (gain) on sale of real estate —— 0.01 —Real estate impairment charges —— 0.03 —Funds from operations $ 0.40 $ 0.32 $ 1.07 $ 0.92 Write-off of straight-line rent and other — 0.01 0.05 0.02 Non-cash fair value adjustments —— 0.02 —Tax rate change 0.01 — 0.02 —Unutilized financing fees ——— 0.01 Normalized funds from operations $ 0.41 $ 0.33 $ 1.16 $ 0.95 Share-based compensation 0.02 0.02 0.06 0.05 Debt costs amortization 0.01 0.01 0.02 0.02 Rent deferral (0.01) — (0.02) —Straight-line rent revenue and other (0.12) (0.09) (0.32) (0.24) Adjusted funds from operations $ 0.31 $ 0.27 $ 0.90 $ 0.78 Notes: (A) Certain line items above (such as real estate depreciation) include our share of such income/expense from unconsolidated joint ventures. These amounts are included with the activity of all of our equity interests in the “Earnings from equity interests” line on the consolidated statements of income. (B) Investors and analysts following the real estate industry utilize funds from operations, or FFO, as a supplemental performance measure. FFO, reflecting the assumption that real estate asset values rise or fall with market conditions, principally adjusts for the effects of GAAP depreciation and amortization of real estate assets, which assumes that the value of real estate diminishes predictably over time. We compute FFO in accordance with the definition provided by the National Association of Real Estate Investment Trusts, or NAREIT, which represents net income (loss) (computed in accordance with GAAP), excluding gains (losses) on sales of real estate and impairment charges on real estate assets, plus real estate depreciation and amortization and after adjustments for unconsolidated partnerships and joint ventures. In addition to presenting FFO in accordance with the NAREIT definition, we also disclose normalized FFO, which adjusts FFO for items that relate to unanticipated or non-core events or activities or accounting changes that, if not noted, would make comparison to prior period results and market expectations less meaningful to investors and analysts. We believe that the use of FFO, combined with the required GAAP presentations, improves the understanding of our operating results among investors and the use of normalized FFO makes comparisons of our operating results with prior periods and other companies more meaningful. While FFO and normalized FFO are relevant and widely used supplemental measures of operating and financial performance of REITs, they should not be viewed as a substitute measure of our operating performance since the measures do not reflect either depreciation and amortization costs or the level of capital expenditures and leasing costs necessary to maintain the operating performance of our properties, which can be significant economic costs that could materially impact our results of operations. FFO and normalized FFO should not be considered an alternative to net income (loss) (computed in accordance with GAAP) as indicators of our results of operations or to cash flow from operating activities (computed in accordance with GAAP) as an indicator of our liquidity. We calculate adjusted funds from operations, or AFFO, by subtracting from or adding to normalized FFO (i) non-cash revenue, (ii) non-cash share-based compensation expense, and (iii) amortization of deferred financing costs. AFFO is an operating measurement that we use to analyze our results of operations based on the receipt, rather than the accrual, of our rental revenue and on certain other adjustments. We believe that this is an important measurement because our leases generally have significant contractual escalations of base rents and therefore result in recognition of rental income that is not collected until future periods, and costs that are deferred or are non-cash charges. Our calculation of AFFO may not be comparable to AFFO or similarly titled measures reported by other REITs. AFFO should not be considered as an alternative to net income (calculated pursuant to GAAP) as an indicator of our results of operations or to cash flow from operating activities (calculated pursuant to GAAP) as an indicator of our liquidity. MEDICAL PROPERTIES TRUST | SUPPLEMENTAL INFORMATION | Q3 2020 6
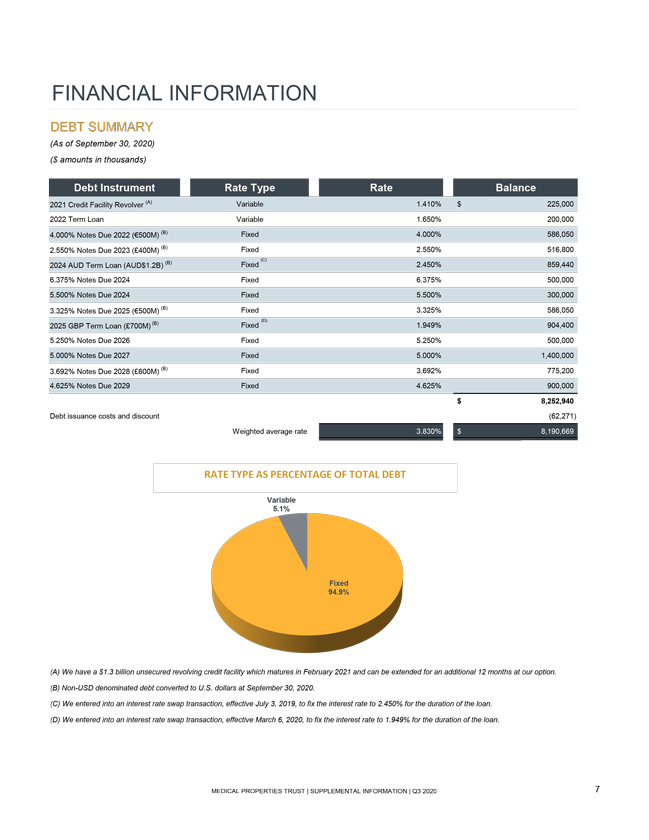
FINANCIAL INFORMATION DEBT SUMMARY (As of September 30, 2020) ($ amounts in thousands) Debt Instrument Rate Type Rate Balance 2021 Credit Facility Revolver (A) Variable 1.410% $ 225,000 2022 Term Loan Variable 1.650% 200,000 4.000% Notes Due 2022 (500M) (B) Fixed 4.000% 586,050 2.550% Notes Due 2023 (400M) (B) Fixed 2.550% 516,800 2024 AUD Term Loan (AUD$1.2B) (B) Fixed (C) 2.450% 859,440 6.375% Notes Due 2024 Fixed 6.375% 500,000 5.500% Notes Due 2024 Fixed 5.500% 300,000 3.325% Notes Due 2025 (500M) (B) Fixed 3.325% 586,050 2025 GBP Term Loan (700M) (B) Fixed (D) 1.949% 904,400 5.250% Notes Due 2026 Fixed 5.250% 500,000 5.000% Notes Due 2027 Fixed 5.000% 1,400,000 3.692% Notes Due 2028 (600M) (B) Fixed 3.692% 775,200 4.625% Notes Due 2029 Fixed 4.625% 900,000 $ 8,252,940 Debt issuance costs and discount (62,271) Weighted average rate 3.830% $ 8,190,669 RATE TYPE AS PERCENTAGE OF TOTAL DEBT (A) We have a $1.3 billion unsecured revolving credit facility which matures in February 2021 and can be extended for an additional 12 months at our option. (B) Non-USD denominated debt converted to U.S. dollars at September 30, 2020. (C) We entered into an interest rate swap transaction, effective July 3, 2019, to fix the interest rate to 2.450% for the duration of the loan. (D) We entered into an interest rate swap transaction, effective March 6, 2020, to fix the interest rate to 1.949% for the duration of the loan. MEDICAL PROPERTIES TRUST | SUPPLEMENTAL INFORMATION | Q3 2020 7
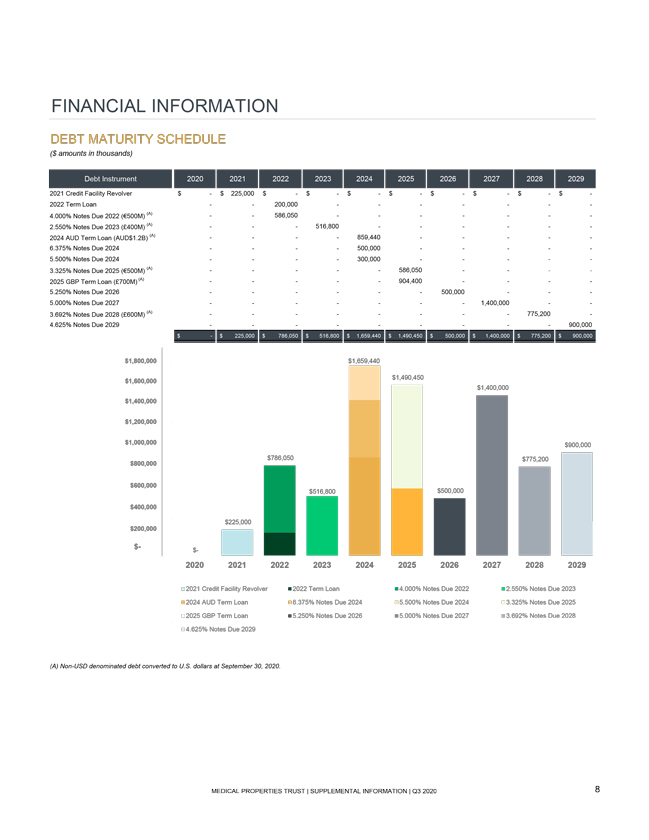
FINANCIAL INFORMATION DEBT MATURITY SCHEDULE ($ amounts in thousands) Debt Instrument 2020 2021 2022 2023 2024 2025 2026 2027 2028 2029 2021 Credit Facility Revolver $ — $ 225,000 $- $ —$ —$ —$ — $—$ —$ -2022 Term Loan — 200,000 — — ——4.000% Notes Due 2022 (500M) (A) — 586,050 — — ——2.550% Notes Due 2023 (400M) (A) —- 516,800 —— — -2024 AUD Term Loan (AUD$1.2B) (A) — — 859,440 — ——6.375% Notes Due 2024 — — 500,000 — ——5.500% Notes Due 2024 — — 300,000 — ——3.325% Notes Due 2025 (500M) (A) — —— 586,050— — -2025 GBP Term Loan (700M) (A) ——— 904,400— ——5.250% Notes Due 2026 — — — 500,000 ——5.000% Notes Due 2027 — — ——1,400,000 — 3.692% Notes Due 2028 (600M) (A) — — — — 775,200—4.625% Notes Due 2029 — — —— — 900,000 $ —$225,000 $ 786,050 $ 516,800 $ 1,659,440 $ 1,490,450 $500,000 $ 1,400,000 $ 775,200 $900,000 $1,800,000 $1,659,440 $1,490,450 $1,600,000 $1,400,000 $1,400,000 $1,200,000 $1,000,000 $900,000 $786,050 $775,200 $800,000 $600,000 $516,800 $500,000 $400,000 $200,000 $225,000 $- $- 2020 2021 2022 2023 2024 2025 2026 2027 2028 2029 2021 Credit Facility Revolver 2022 Term Loan 4.000% Notes Due 2022 2.550% Notes Due 2023 2024 AUD Term Loan 6.375% Notes Due 2024 5.500% Notes Due 2024 3.325% Notes Due 2025 2025 GBP Term Loan 5.250% Notes Due 2026 5.000% Notes Due 2027 3.692% Notes Due 2028 4.625% Notes Due 2029 (A) Non-USD denominated debt converted to U.S. dollars at September 30, 2020. MEDICAL PROPERTIES TRUST | SUPPLEMENTAL INFORMATION | Q3 2020 8
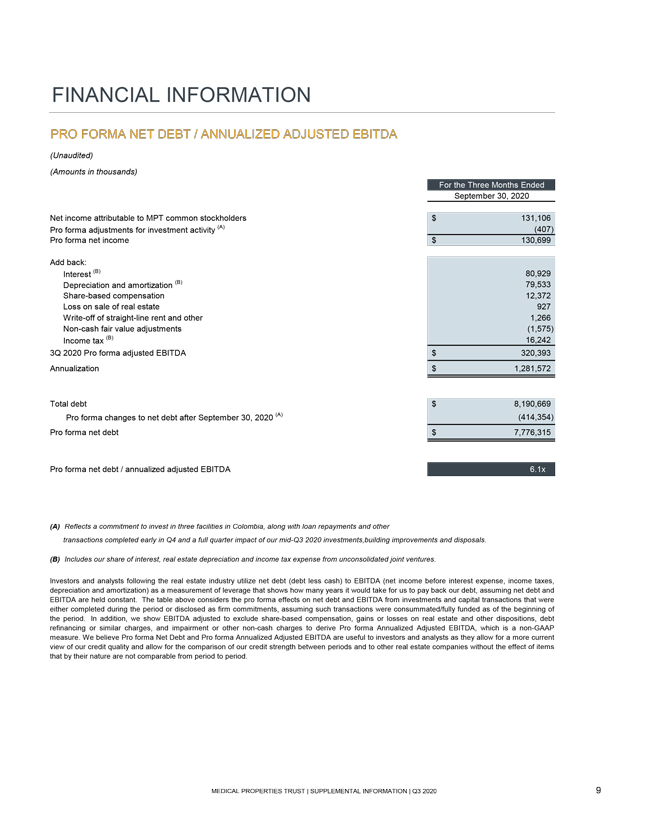
FINANCIAL INFORMATION PRO FORMA NET DEBT / ANNUALIZED ADJUSTED EBITDA (Unaudited) (Amounts in thousands) For the Three Months Ended September 30, 2020 Net income attributable to MPT common stockholders $ 131,106 Pro forma adjustments for investment activity (A) (407) Pro forma net income $ 130,699 Add back: Interest (B) 80,929 Depreciation and amortization (B) 79,533 Share-based compensation 12,372 Loss on sale of real estate 927 Write-off of straight-line rent and other 1,266 Non-cash fair value adjustments (1,575) Income tax (B) 16,242 3Q 2020 Pro forma adjusted EBITDA $ 320,393 Annualization $ 1,281,572 Total debt $ 8,190,669 Pro forma changes to net debt after September 30, 2020 (A) (414,354) Pro forma net debt $ 7,776,315 Pro forma net debt / annualized adjusted EBITDA 6.1x (A) Reflects a commitment to invest in three facilities in Colombia, along with loan repayments and other transactions completed early in Q4 and a full quarter impact of our mid-Q3 2020 investments,building improvements and disposals. (B) Includes our share of interest, real estate depreciation and income tax expense from unconsolidated joint ventures. Investors and analysts following the real estate industry utilize net debt (debt less cash) to EBITDA (net income before interest expense, income taxes, depreciation and amortization) as a measurement of leverage that shows how many years it would take for us to pay back our debt, assuming net debt and EBITDA are held constant. The table above considers the pro forma effects on net debt and EBITDA from investments and capital transactions that were either completed during the period or disclosed as firm commitments, assuming such transactions were consummated/fully funded as of the beginning of the period. In addition, we show EBITDA adjusted to exclude share-based compensation, gains or losses on real estate and other dispositions, debt refinancing or similar charges, and impairment or other non-cash charges to derive Pro forma Annualized Adjusted EBITDA, which is a non-GAAP measure. We believe Pro forma Net Debt and Pro forma Annualized Adjusted EBITDA are useful to investors and analysts as they allow for a more current view of our credit quality and allow for the comparison of our credit strength between periods and to other real estate companies without the effect of items that by their nature are not comparable from period to period. MEDICAL PROPERTIES TRUST | SUPPLEMENTAL INFORMATION | Q3 2020 9
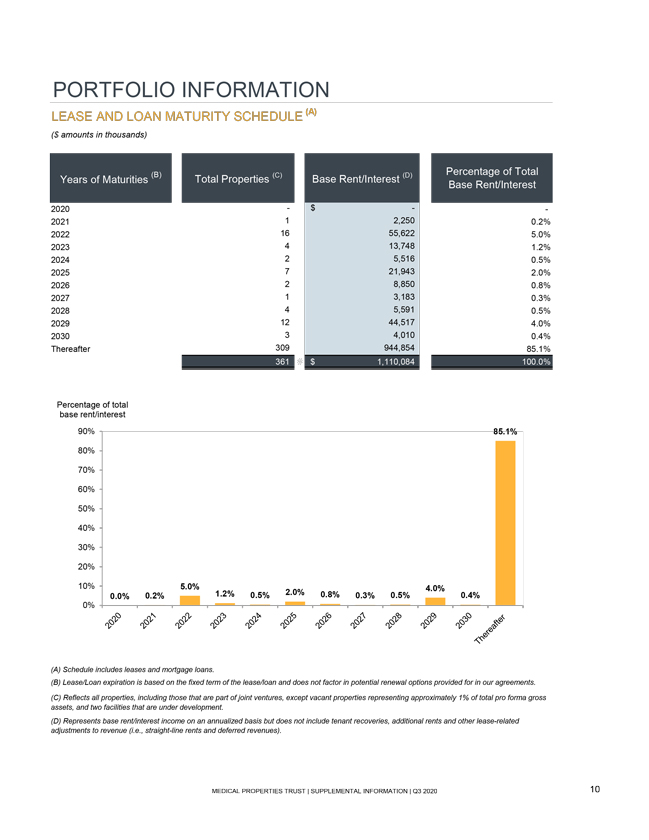
PORTFOLIO INFORMATION LEASE AND LOAN MATURITY SCHEDULE (A) ($ amounts in thousands) (B) Percentage of Total Years of Maturities Total Properties (C) Base Rent/Interest (D) Base Rent/Interest 2020— $ — 2021 1 2,250 0.2% 2022 16 55,622 5.0% 2023 4 13,748 1.2% 2024 2 5,516 0.5% 2025 7 21,943 2.0% 2026 2 8,850 0.8% 2027 1 3,183 0.3% 2028 4 5,591 0.5% 2029 12 44,517 4.0% 2030 3 4,010 0.4% Thereafter 309 944,854 85.1% 361 # $ 1,110,084 100.0% Percentage of total base rent/interest 90% 85.1% 80% 70% 60% 50% 40% 30% 20% 10% 5.0% 4.0% 0.0% 0.2% 1.2% 0.5% 2.0% 0.8% 0.3% 0.5% 0.4% 0% (A) Schedule includes leases and mortgage loans. (B) Lease/Loan expiration is based on the fixed term of the lease/loan and does not factor in potential renewal options provided for in our agreements. (C) Reflects all properties, including those that are part of joint ventures, except vacant properties representing approximately 1% of total pro forma gross assets, and two facilities that are under development. (D) Represents base rent/interest income on an annualized basis but does not include tenant recoveries, additional rents and other lease-related adjustments to revenue (i.e., straight-line rents and deferred revenues). MEDICAL PROPERTIES TRUST | SUPPLEMENTAL INFORMATION | Q3 2020 10
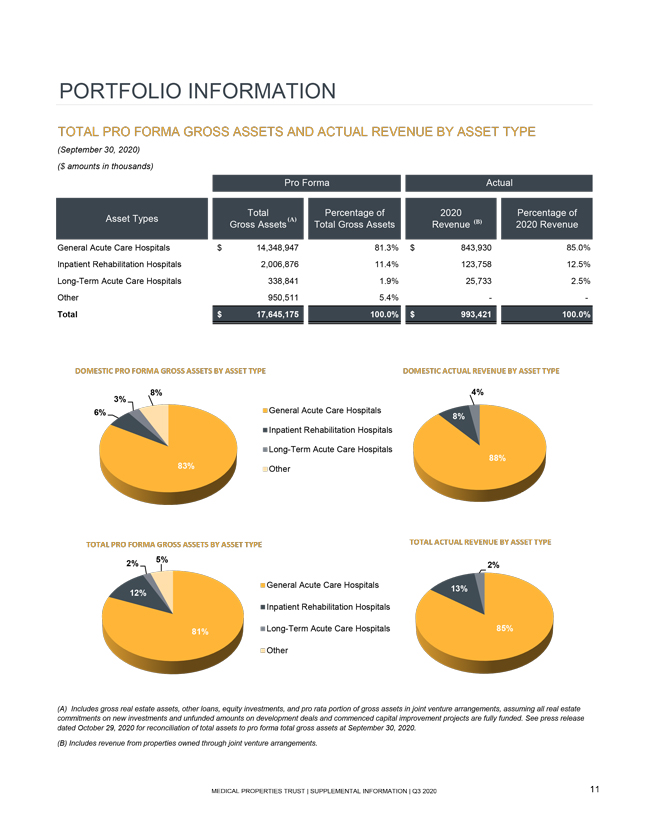
PORTFOLIO INFORMATION TOTAL PRO FORMA GROSS ASSETS AND ACTUAL REVENUE BY ASSET TYPE (September 30, 2020) ($ amounts in thousands) Pro Forma Actual Total Percentage of 2020 Percentage of Asset Types Gross Assets (A) Total Gross Assets Revenue (B) 2020 Revenue General Acute Care Hospitals $ 14,348,947 81.3% $ 843,930 85.0% Inpatient Rehabilitation Hospitals 2,006,876 11.4% 123,758 12.5% Long-Term Acute Care Hospitals 338,841 1.9% 25,733 2.5% Other 950,511 5.4% — Total $ 17,645,175 100.0% $ 993,421 100.0% DOMESTIC PRO FORMA GROSS ASSETS BY ASSET TYPE DOMESTIC ACTUAL REVENUE BY ASSET TYPE 3% 8% 4% 6% General Acute Care Hospitals 8% Inpatient Rehabilitation Hospit Long-Term Acute Care Hospit 88% 83% Other TOTAL PRO FORMA GROSS ASSETS BY ASSET TYPE TOTAL ACTUAL REVENUE BY ASSET TYPE 2% 5% 2% General Acute Care Hospitals 13% 12% Inpatient Rehabilitation Hospitals 81% Long-Term Acute Care Hospitals 85% Other (A) Includes gross real estate assets, other loans, equity investments, and pro rata portion of gross assets in joint venture arrangements, assuming all real estate commitments on new investments and unfunded amounts on development deals and commenced capital improvement projects are fully funded. See press release dated October 29, 2020 for reconciliation of total assets to pro forma total gross assets at September 30, 2020. (B) Includes revenue from properties owned through joint venture arrangements. MEDICAL PROPERTIES TRUST | SUPPLEMENTAL INFORMATION | Q3 2020 11
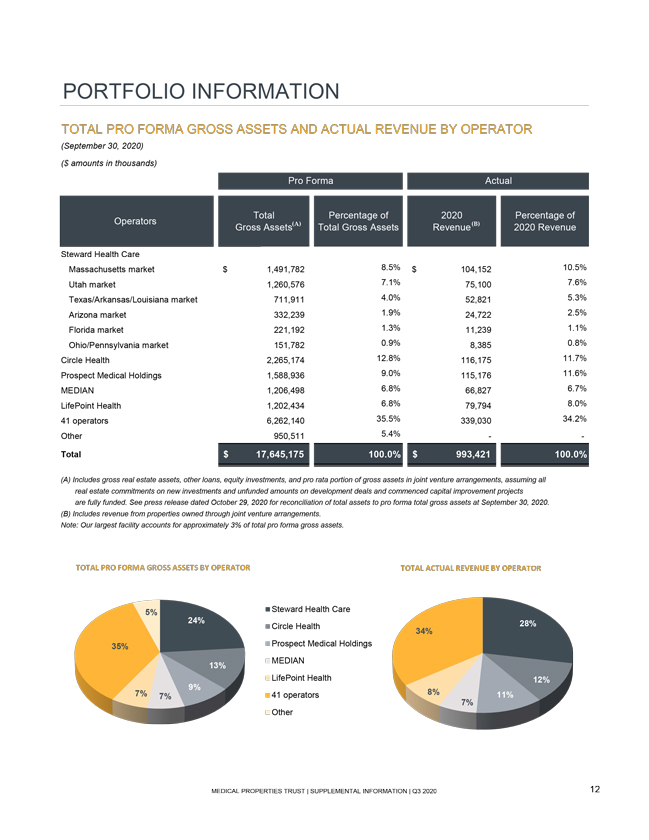
PORTFOLIO INFORMATION TOTAL PRO FORMA GROSS ASSETS AND ACTUAL REVENUE BY OPERATOR (September 30, 2020) ($ amounts in thousands) Pro Forma Actual Total Percentage of 2020 Percentage of Operators Gross Assets(A) Total Gross Assets Revenue(B) 2020 Revenue Steward Health Care Massachusetts market $ 1,491,782 8.5% $ 104,152 10.5% Utah market 1,260,576 7.1% 75,100 7.6% Texas/Arkansas/Louisiana market 711,911 4.0% 52,821 5.3% Arizona market 332,239 1.9% 24,722 2.5% Florida market 221,192 1.3% 11,239 1.1% Ohio/Pennsylvania market 151,782 0.9% 8,385 0.8% Circle Health 2,265,174 12.8% 116,175 11.7% Prospect Medical Holdings 1,588,936 9.0% 115,176 11.6% MEDIAN 1,206,498 6.8% 66,827 6.7% LifePoint Health 1,202,434 6.8% 79,794 8.0% 41 operators 6,262,140 35.5% 339,030 34.2% Other 950,511 5.4% — Total $ 17,645,175 100.0% $ 993,421 100.0% (A) Includes gross real estate assets, other loans, equity investments, and pro rata portion of gross assets in joint venture arrangements, assuming all real estate commitments on new investments and unfunded amounts on development deals and commenced capital improvement projects are fully funded. See press release dated October 29, 2020 for reconciliation of total assets to pro forma total gross assets at September 30, 2020. (B) Includes revenue from properties owned through joint venture arrangements. Note: Our largest facility accounts for approximately 3% of total pro forma gross assets. TOTAL PRO FORMA GROSS ASSETS BY OPERATOR TOTAL ACTUAL REVENUE BY OPERATOR 5% Steward Health Care 24% Circle Health 28% 34% 35% Prospect Medical Holdings 13% MEDIAN LifePoint Health 12% 9% 7% 7% 41 operators 8% 11% 7% Other MEDICAL PROPERTIES TRUST | SUPPLEMENTAL INFORMATION | Q3 2020 12
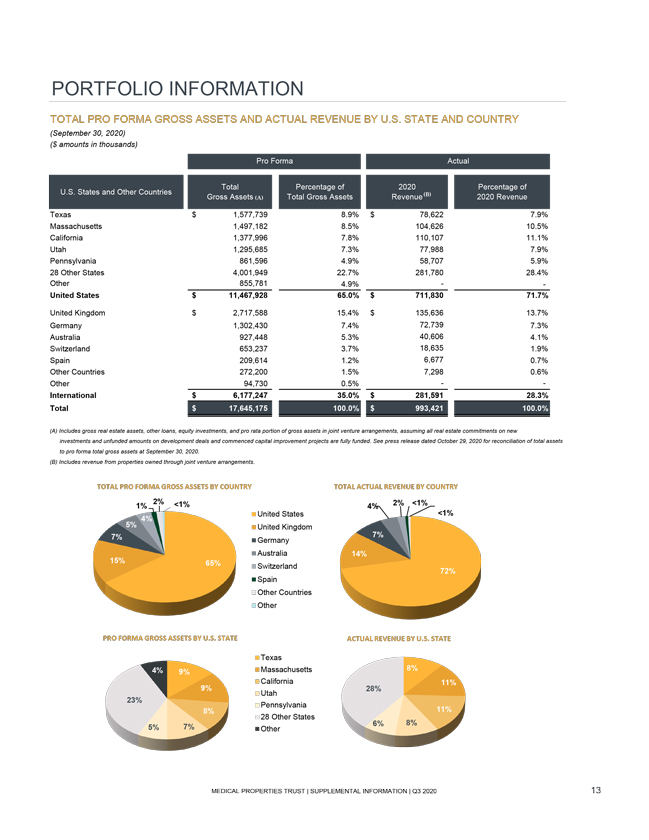
PORTFOLIO INFORMATION TOTAL PRO FORMA GROSS ASSETS AND ACTUAL REVENUE BY U.S. STATE AND COUNTRY (September 30, 2020) ($ amounts in thousands) Pro Forma Actual Total Percentage of 2020 Percentage of U.S. States and Other Countries Gross Assets (A) Total Gross Assets Revenue (B) 2020 Revenue Texas $ 1,577,739 8.9% $ 78,622 7.9% Massachusetts 1,497,182 8.5% 104,626 10.5% California 1,377,996 7.8% 110,107 11.1% Utah 1,295,685 7.3% 77,988 7.9% Pennsylvania 861,596 4.9% 58,707 5.9% 28 Other States 4,001,949 22.7% 281,780 28.4% Other 855,781 4.9% — United States $ 11,467,928 65.0% $ 711,830 71.7% United Kingdom $ 2,717,588 15.4% $ 135,636 13.7% Germany 1,302,430 7.4% 72,739 7.3% Australia 927,448 5.3% 40,606 4.1% Switzerland 653,237 3.7% 18,635 1.9% Spain 209,614 1.2% 6,677 0.7% Other Countries 272,200 1.5% 7,298 0.6% Other 94,730 0.5% — International $ 6,177,247 35.0% $ 281,591 28.3% Total $ 17,645,175 100.0% $ 993,421 100.0% (A) Includes gross real estate assets, other loans, equity investments, and pro rata portion of gross assets in joint venture arrangements, assuming all real estate commitments on new investments and unfunded amounts on development deals and commenced capital improvement projects are fully funded. See press release dated October 29, 2020 for reconciliation of total assets to pro forma total gross assets at September 30, 2020. (B) Includes revenue from properties owned through joint venture arrangements. TOTAL PRO FORMA GROSS ASSETS BY COUNTRY TOTAL ACTUAL REVENUE BY COUNTRY 1% 2% <1% 4% 2% <1% 4% United States <1% 5% United Kingdom 7% Germany 7% Australia 14% 15% 65% Switzerland 72% Spain Other Countries Other PRO FORMA GROSS ASSETS BY U.S. STATE ACTUAL REVENUE BY U.S. STATE Texas 4% 9% Massachusetts 8% California 11% 9% 28% Utah 23% Pennsylvania 8% 11% 28 Other States 5% 7% Other 6% 8% MEDICAL PROPERTIES TRUST | SUPPLEMENTAL INFORMATION | Q3 2020 13
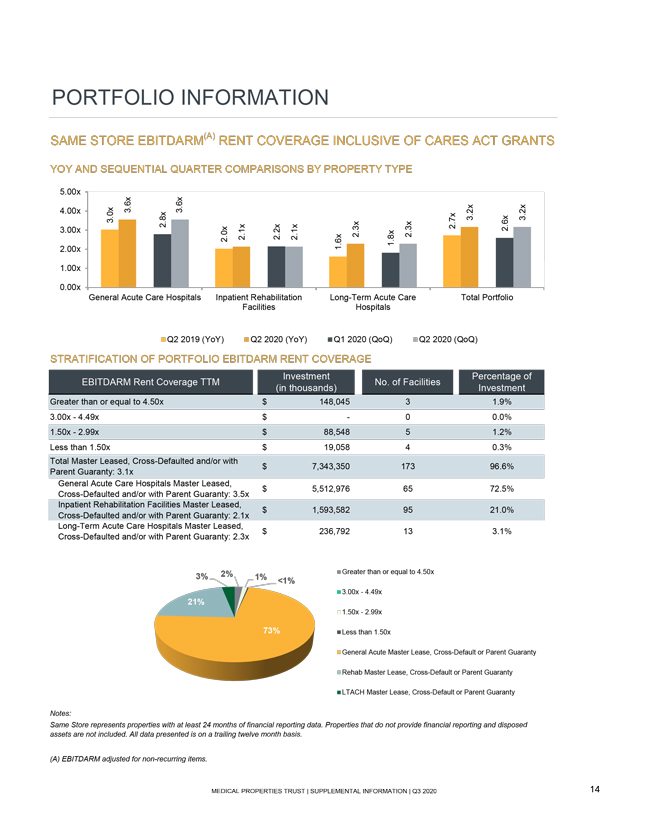
PORTFOLIO INFORMATION SAME STORE EBITDARM(A) RENT COVERAGE INCLUSIVE OF CARES ACT GRANTS YOY AND SEQUENTIAL QUARTER COMPARISONS BY PROPERTY TYPE 5.00x 4.00x 3.6x 3.6x 3.0x 2.8x 2.7x 3.2x 2.6x 3.2x 2.00x 3.00x 2.0x 2.1x 2.2x 2.1x 1.6x 2.3x 1.8x 2.3x 1.00x 0.00x General Acute Care Hospitals Inpatient Rehabilitation Long-Term Acute Care Total Portfolio Facilities Hospitals Q2 2019 (YoY) Q2 2020 (YoY) Q1 2020 (QoQ) Q2 2020 (QoQ) STRATIFICATION OF PORTFOLIO EBITDARM RENT COVERAGE Investment Percentage of EBITDARM Rent Coverage TTM No. of Facilities (in thousands) Investment Greater than or equal to 4.50x $ 148,045 3 1.9% 3.00x—4.49x $— 0 0.0% 1.50x—2.99x $ 88,548 5 1.2% Less than 1.50x $ 19,058 4 0.3% Total Master Leased, Cross-Defaulted and/or with Parent Guaranty: 3.1x $ 7,343,350 173 96.6% General Acute Care Hospitals Master Leased, $ 5,512,976 65 72.5% Cross-Defaulted and/or with Parent Guaranty: 3.5x Inpatient Rehabilitation Facilities Master Leased, $ 1,593,582 95 21.0% Cross-Defaulted and/or with Parent Guaranty: 2.1x Long-Term Acute Care Hospitals Master Leased, $ 236,792 13 3.1% Cross-Defaulted and/or with Parent Guaranty: 2.3x 3% 2% 1% <1% Greater than or equal to 4.50x 3.00x—4.49x 21% 1.50x—2.99x 73% Less than 1.50x General Acute Master Lease, Cross-Default or Parent Guaranty Rehab Master Lease, Cross-Default or Parent Guaranty LTACH Master Lease, Cross-Default or Parent Guaranty Notes: Same Store represents properties with at least 24 months of financial reporting data. Properties that do not provide financial reporting and disposed assets are not included. All data presented is on a trailing twelve month basis. (A) EBITDARM adjusted for non-recurring items. MEDICAL PROPERTIES TRUST | SUPPLEMENTAL INFORMATION | Q3 2020 14
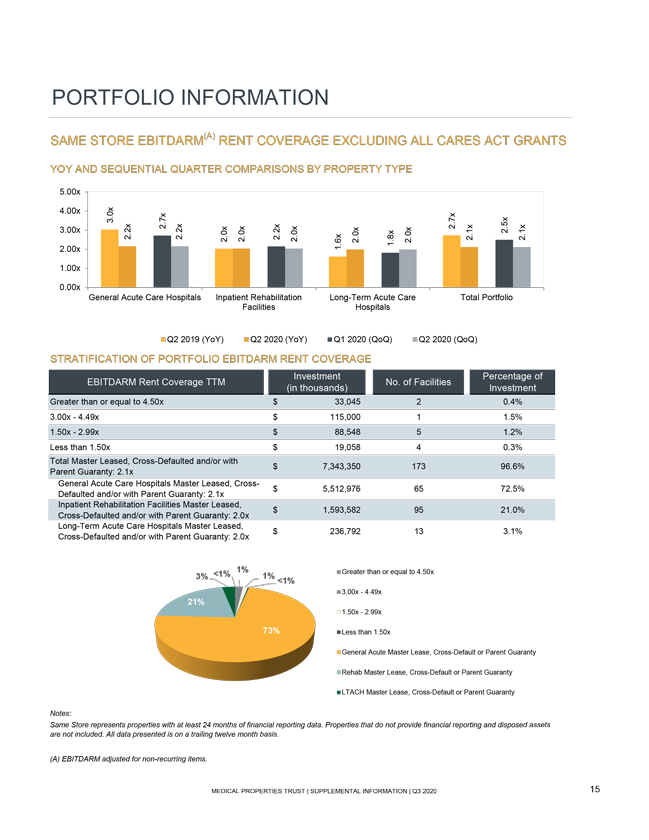
PORTFOLIO INFORMATION SAME STORE EBITDARM(A) RENT COVERAGE EXCLUDING ALL CARES ACT GRANTS YOY AND SEQUENTIAL QUARTER COMPARISONS BY PROPERTY TYPE 5.00x 4.00x 3.0x 3.00x 2.2x 2.7x 2.2x 2.0x 2.0x 2.2x 2.0x 2.0x 1.8x 2.0x 2.7x 2.1x 2.5x 2.1x 2.00x 1.6x 1.00x 0.00x General Acute Care Hospitals Inpatient Rehabilitation Long-Term Acute Care Total Portfolio Facilities Hospitals Q2 2019 (YoY) Q2 2020 (YoY) Q1 2020 (QoQ) Q2 2020 (QoQ) STRATIFICATION OF PORTFOLIO EBITDARM RENT COVERAGE Investment Percentage of EBITDARM Rent Coverage TTM No. of Facilities (in thousands) Investment Greater than or equal to 4.50x $ 33,045 2 0.4% 3.00x—4.49x $ 115,000 1 1.5% 1.50x—2.99x $ 88,548 5 1.2% Less than 1.50x $ 19,058 4 0.3% Total Master Leased, Cross-Defaulted and/or with Parent Guaranty: 2.1x $ 7,343,350 173 96.6% General Acute Care Hospitals Master Leased, Cross- $ 5,512,976 65 72.5% Defaulted and/or with Parent Guaranty: 2.1x Inpatient Rehabilitation Facilities Master Leased, $ 1,593,582 95 21.0% Cross-Defaulted and/or with Parent Guaranty: 2.0x Long-Term Acute Care Hospitals Master Leased, $ 236,792 13 3.1% Cross-Defaulted and/or with Parent Guaranty: 2.0x 3% <1% 1% 1% Greater than or equal to 4.50x <1% 3.00x—4.49x 21% 1.50x—2.99x 73% Less than 1.50x General Acute Master Lease, Cross-Default or Parent Guaranty Rehab Master Lease, Cross-Default or Parent Guaranty LTACH Master Lease, Cross-Default or Parent Guaranty Notes: Same Store represents properties with at least 24 months of financial reporting data. Properties that do not provide financial reporting and disposed assets are not included. All data presented is on a trailing twelve month basis. (A) EBITDARM adjusted for non-recurring items. MEDICAL PROPERTIES TRUST | SUPPLEMENTAL INFORMATION | Q3 2020 15
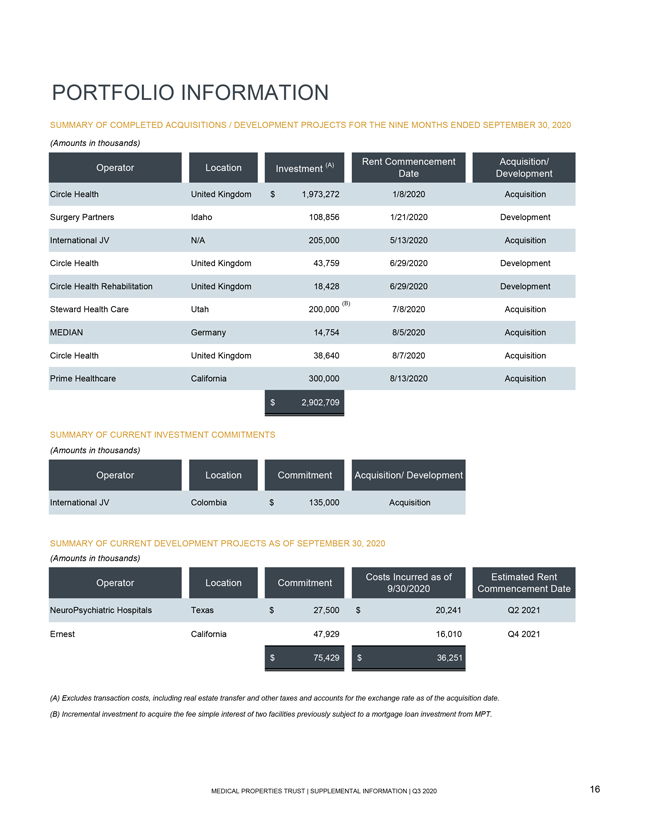
PORTFOLIO INFORMATION SUMMARY OF COMPLETED ACQUISITIONS / DEVELOPMENT PROJECTS FOR THE NINE MONTHS ENDED SEPTEMBER 30, 2020 (Amounts in thousands) Rent Commencement Acquisition/ Operator Location Investment (A) Date Development Circle Health United Kingdom $ 1,973,272 1/8/2020 Acquisition Surgery Partners Idaho 108,856 1/21/2020 Development International JV N/A 205,000 5/13/2020 Acquisition Circle Health United Kingdom 43,759 6/29/2020 Development Circle Health Rehabilitation United Kingdom 18,428 6/29/2020 Development Steward Health Care Utah 200,000 (B) 7/8/2020 Acquisition MEDIAN Germany 14,754 8/5/2020 Acquisition Circle Health United Kingdom 38,640 8/7/2020 Acquisition Prime Healthcare California 300,000 8/13/2020 Acquisition $ 2,902,709 SUMMARY OF CURRENT INVESTMENT COMMITMENTS (Amounts in thousands) Operator Location Commitment Acquisition/ Development International JV Colombia $ 135,000 Acquisition SUMMARY OF CURRENT DEVELOPMENT PROJECTS AS OF SEPTEMBER 30, 2020 (Amounts in thousands) Operator Location Commitment Costs Incurred as of Estimated Rent 9/30/2020 Commencement Date NeuroPsychiatric Hospitals Texas $ 27,500 $ 20,241 Q2 2021 Ernest California 47,929 16,010 Q4 2021 $ 75,429 $ 36,251 (A) Excludes transaction costs, including real estate transfer and other taxes and accounts for the exchange rate as of the acquisition date. (B) Incremental investment to acquire the fee simple interest of two facilities previously subject to a mortgage loan investment from MPT. MEDICAL PROPERTIES TRUST | SUPPLEMENTAL INFORMATION | Q3 2020 16
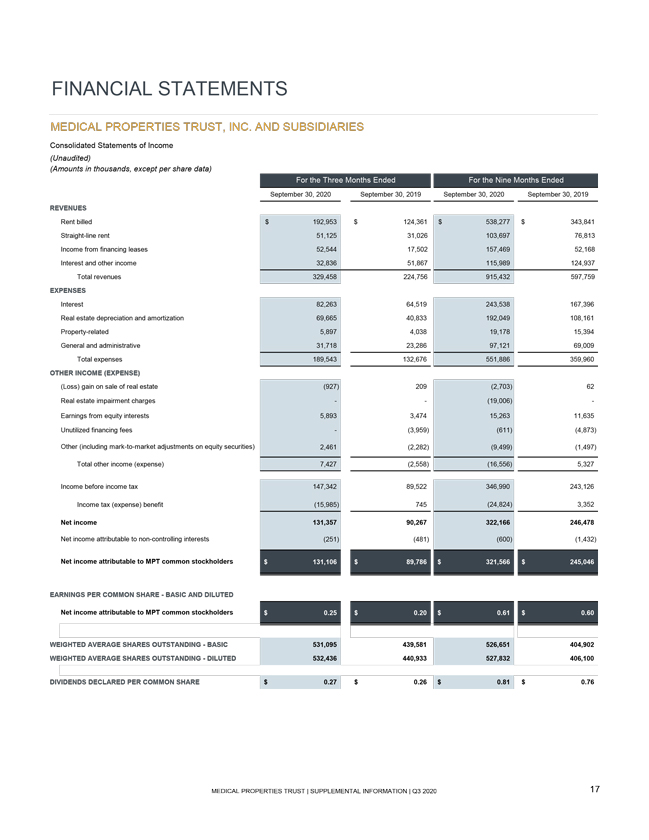
FINANCIAL STATEMENTS MEDICAL PROPERTIES TRUST, INC. AND SUBSIDIARIES Consolidated Statements of Income (Unaudited) (Amounts in thousands, except per share data) For the Three Months Ended For the Nine Months Ended September 30, 2020 September 30, 2019 September 30, 2020 September 30, 2019 REVENUES Rent billed $ 192,953 $ 124,361 $ 538,277 $ 343,841 Straight-line rent 51,125 31,026 103,697 76,813 Income from financing leases 52,544 17,502 157,469 52,168 Interest and other income 32,836 51,867 115,989 124,937 Total revenues 329,458 224,756 915,432 597,759 EXPENSES Interest 82,263 64,519 243,538 167,396 Real estate depreciation and amortization 69,665 40,833 192,049 108,161 Property-related 5,897 4,038 19,178 15,394 General and administrative 31,718 23,286 97,121 69,009 Total expenses 189,543 132,676 551,886 359,960 OTHER INCOME (EXPENSE) (Loss) gain on sale of real estate (927) 209 (2,703) 62 Real estate impairment charges —— (19,006) —Earnings from equity interests 5,893 3,474 15,263 11,635 Unutilized financing fees — (3,959) (611) (4,873) Other (including mark-to-market adjustments on equity securities) 2,461 (2,282) (9,499) (1,497) Total other income (expense) 7,427 (2,558) (16,556) 5,327 Income before income tax 147,342 89,522 346,990 243,126 Income tax (expense) benefit (15,985) 745 (24,824) 3,352 Net income 131,357 90,267 322,166 246,478 Net income attributable to non-controlling interests (251) (481) (600) (1,432) Net income attributable to MPT common stockholders $ 131,106 $ 89,786 $ 321,566 $ 245,046 EARNINGS PER COMMON SHARE—BASIC AND DILUTED Net income attributable to MPT common stockholders $ 0.25 $ 0.20 $ 0.61 $ 0.60 WEIGHTED AVERAGE SHARES OUTSTANDING—BASIC 531,095 439,581 526,651 404,902 WEIGHTED AVERAGE SHARES OUTSTANDING—DILUTED 532,436 440,933 527,832 406,100 $ - $ - DIVIDENDS DECLARED PER COMMON SHARE $ 0.27 $ 0.26 $ 0.81 $ 0.76 MEDICAL PROPERTIES TRUST | SUPPLEMENTAL INFORMATION | Q3 2020 17
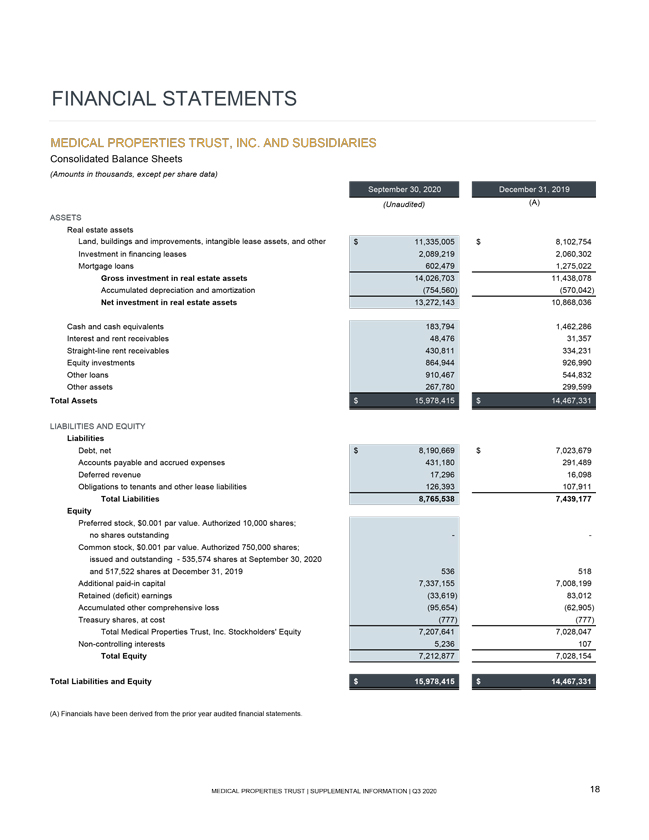
FINANCIAL STATEMENTS MEDICAL PROPERTIES TRUST, INC. AND SUBSIDIARIES Consolidated Balance Sheets (Amounts in thousands, except per share data) September 30, 2020 December 31, 2019 (Unaudited) (A) ASSETS Real estate assets Land, buildings and improvements, intangible lease assets, and other $ 11,335,005 $ 8,102,754 Investment in financing leases 2,089,219 2,060,302 Mortgage loans 602,479 1,275,022 Gross investment in real estate assets 14,026,703 11,438,078 Accumulated depreciation and amortization (754,560) (570,042) Net investment in real estate assets 13,272,143 10,868,036 Cash and cash equivalents 183,794 1,462,286 Interest and rent receivables 48,476 31,357 Straight-line rent receivables 430,811 334,231 Equity investments 864,944 926,990 Other loans 910,467 544,832 Other assets 267,780 299,599 Total Assets $ 15,978,415 $ 14,467,331 LIABILITIES AND EQUITY Liabilities Debt, net $ 8,190,669 $ 7,023,679 Accounts payable and accrued expenses 431,180 291,489 Deferred revenue 17,296 16,098 Obligations to tenants and other lease liabilities 126,393 107,911 Total Liabilities 8,765,538 7,439,177 Equity Preferred stock, $0.001 par value. Authorized 10,000 shares; no shares outstanding - —Common stock, $0.001 par value. Authorized 750,000 shares; issued and outstanding—535,574 shares at September 30, 2020 and 517,522 shares at December 31, 2019 536 518 Additional paid-in capital 7,337,155 7,008,199 Retained (deficit) earnings (33,619) 83,012 Accumulated other comprehensive loss (95,654) (62,905) Treasury shares, at cost (777) (777) Total Medical Properties Trust, Inc. Stockholders’ Equity 7,207,641 7,028,047 Non-controlling interests 5,236 107 Total Equity 7,212,877 7,028,154 Total Liabilities and Equity $ 15,978,415 $ 14,467,331 (A) Financials have been derived from the prior year audited financial statements. MEDICAL PROPERTIES TRUST | SUPPLEMENTAL INFORMATION | Q3 2020 18
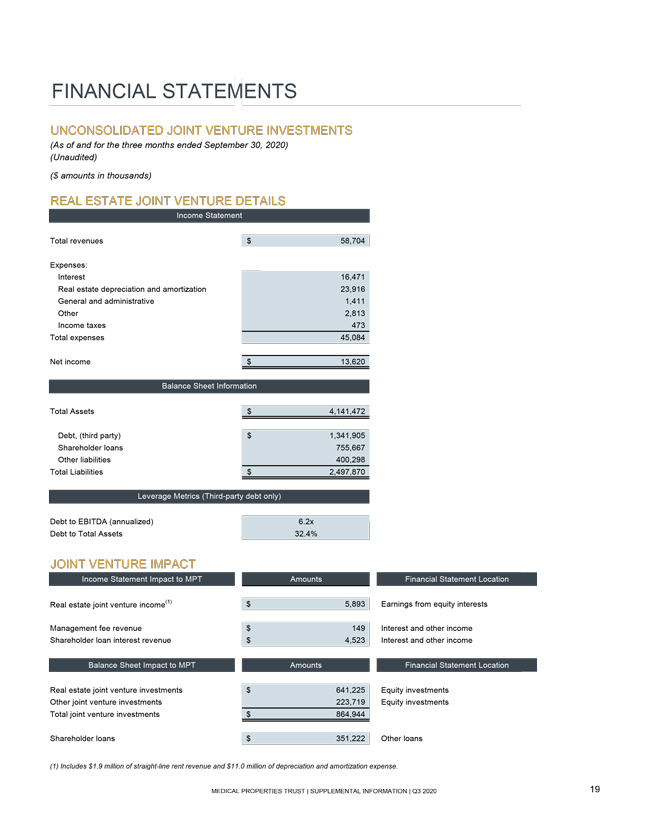
FINANCIAL STATEMENTS UNCONSOLIDATED JOINT VENTURE INVESTMENTS (As of and for the three months ended September 30, 2020) (Unaudited) ($ amounts in thousands) REAL ESTATE JOINT VENTURE DETAILS Income Statement Total revenues $ 58,704 Expenses: Interest 16,471 Real estate depreciation and amortization 23,916 General and administrative 1,411 Other 2,813 Income taxes 473 Total expenses 45,084 Net income $ 13,620 Balance Sheet Information Total Assets $ 4,141,472 Debt, (third party) $ 1,341,905 Shareholder loans 755,667 Other liabilities 400,298 Total Liabilities $ 2,497,870 Leverage Metrics (Third-party debt only) Debt to EBITDA (annualized) 6.2x Debt to Total Assets 32.4% JOINT VENTURE IMPACT Income Statement Impact to MPT Amounts Financial Statement Location Real estate joint venture income(1) $ 5,893 Earnings from equity interests Management fee revenue $ 149 Interest and other income Shareholder loan interest revenue $ 4,523 Interest and other income Balance Sheet Impact to MPT Amounts Financial Statement Location Real estate joint venture investments $ 641,225 Equity investments Other joint venture investments 223,719 Equity investments Total joint venture investments $ 864,944 Shareholder loans $ 351,222 Other loans (1) Includes $1.9 million of straight-line rent revenue and $ 11.0 million of depreciation and amortization expense. MEDICAL PROPERTIES TRUST | SUPPLEMENTAL INFORMATION | Q3 2020 19
1000 Urban Center Drive, Suite 501 Birmingham, AL 35242 (205) 969-3755 NYSE: MPW www.medicalpropertiestrust.com Contact: Drew Babin, Senior Managing Director of Corporate Communications (646) 884-9809 or dbabin@medicalpropertiestrust.com or Tim Berryman, Managing Director of Investor Relations (205) 397-8589 or tberryman@medicalpropertiestrust.com