Attached files
| file | filename |
|---|---|
| EX-99.2 - EX-99.2 - FEDERAL NATIONAL MORTGAGE ASSOCIATION FANNIE MAE | q320exhibit992.htm |
| 8-K - 8-K - FEDERAL NATIONAL MORTGAGE ASSOCIATION FANNIE MAE | fnm-20201029.htm |

Contact: Pete Bakel Resource Center: 1-800-732-6643
202-752-2034 Exhibit 99.1
Date: October 29, 2020
Fannie Mae Reports Net Income of $4.2 Billion for Third Quarter 2020
Third Quarter 2020 Results | “Fannie Mae has helped more than 1.2 million homeowners with forbearance plans so far in 2020, while providing record levels of critical liquidity to the mortgage market through one of the most severe and sudden economic shocks in a century. Our performance this year demonstrates our ability to support the mortgage market in a safe and sound manner even during these uniquely challenging times. To continue meeting these challenges, we believe our company and the broader housing finance system would be best served by a responsible end to Fannie Mae’s conservatorship, consistent with FHFA’s goals.” Hugh R. Frater, Chief Executive Officer | ||||||||||||||||||||||||||||||||||
| • | Fannie Mae reported net income of $4.2 billion for the third quarter of 2020, compared with net income of $2.5 billion for the second quarter of 2020. The increase in net income was due to higher amortization income driven by an increase in mortgage prepayment activity, a decrease in fair value losses, an increase in net investment gains, and a shift to credit-related income in the third quarter of 2020 from credit-related losses in the prior quarter. | ||||||||||||||||||||||||||||||||||
| • | Fannie Mae continues to provide economic relief to borrowers impacted by COVID-19 through its forbearance program. As of September 30, 2020, 4.1% of Fannie Mae’s single-family guaranty book of business based on loan count and 0.5% of the company’s multifamily guaranty book of business based on unpaid principal balance were in forbearance, the vast majority of which were related to COVID-19. | ||||||||||||||||||||||||||||||||||
| • | Fannie Mae’s net worth increased from $16.5 billion as of June 30, 2020 to $20.7 billion as of September 30, 2020. Based on its agreement with the U.S. Department of the Treasury, the company may retain quarterly earnings until its net worth reaches $25 billion. | ||||||||||||||||||||||||||||||||||
| • | Fannie Mae expects the impact of the COVID-19 pandemic to continue to negatively affect its financial results, contributing to lower net income in 2020 than in 2019. | ||||||||||||||||||||||||||||||||||
Business Highlights | |||||||||||||||||||||||||||||||||||
| • | Fannie Mae is providing substantial liquidity to lenders during the COVID-19 pandemic and fulfilling Fannie Mae’s mission to stabilize the housing finance market and provide liquidity, support, and access to affordable mortgage financing in all U.S. markets in all economic cycles. Fannie Mae provided $982 billion of liquidity in the first nine months of 2020, which represents the company’s highest acquisition volume since the same period in 2003. | ||||||||||||||||||||||||||||||||||
| • | Fannie Mae provided $933 billion in single-family liquidity to the mortgage market in the first nine months of 2020, including $506 billion through its whole loan conduit, enabling the financing of approximately 1,039,000 home purchases and 2,298,000 refinancings. Fannie Mae has financed approximately one in four single-family mortgage loans outstanding in the United States. | ||||||||||||||||||||||||||||||||||
| • | Fannie Mae provided $49 billion in multifamily financing in the first nine months of 2020, which enabled the financing of 542,000 units of multifamily housing. More than 90% of the multifamily units the company financed in the first nine months of 2020 were affordable to families earning at or below 120% of the area median income, providing support for both affordable and workforce housing. | ||||||||||||||||||||||||||||||||||

| Third Quarter 2020 Results | 1 | |||||||
WASHINGTON, DC — Fannie Mae (FNMA/OTCQB) reported net income of $4.2 billion and comprehensive income of $4.2 billion for the third quarter of 2020, compared with net income of $2.5 billion and comprehensive income of $2.5 billion for the second quarter of 2020. The increase in net income was due to higher amortization income driven by an increase in mortgage prepayment activity as a result of the historically low interest rate environment in the third quarter of 2020; a decrease in fair value losses due primarily to yields remaining mostly flat during the quarter and gains on credit enhancement derivatives due to higher loan default expectations on loans covered by certain credit risk transfer transactions; an increase in net investment gains driven by an increase in sales of single-family held-for-sale loans; and a shift from credit-related expense to credit-related income in the third quarter of 2020 due to the impact of actual and forecasted home prices as well as the redesignation of reperforming single-family mortgage loans from held-for-investment to held-for-sale, partially offset by an increase in the allowance for loan losses the company expects to incur as a result of the COVID-19 pandemic.
| Fannie Mae Response to COVID-19 | ||
In March 2020, the COVID-19 outbreak in the United States was declared a national emergency. The COVID-19 pandemic resulted in stay-at-home orders, school closures, and widespread business shutdowns across the country. Although business activity has begun to resume to varying degrees, the speed and nature of the resumption of economic activity remains highly uncertain. The COVID-19 pandemic continues to have a significant impact on Fannie Mae’s business and financial results. Fannie Mae significantly increased its allowance for loan losses in the first nine months of 2020 to reflect the company’s expected loan losses as a result of the pandemic, which resulted in substantial credit-related expenses. Fannie Mae also is incurring other costs associated with the pandemic, such as paying higher fees to servicers to support providing loss mitigation to borrowers. Fannie Mae has increased technology investments in tools that support its forbearance programs. In addition, the company has increased its debt balances to fund increased conduit volumes and in anticipation of future loss mitigation activities and future loan buyouts from trusts. The company’s capital requirements also have increased as a result of loans that have stopped making payments as a result of the forbearance the company has provided.
Fannie Mae Response
Fannie Mae is taking a number of actions to help borrowers, renters, lenders, and its employees manage the negative impact of the COVID-19 pandemic.
Borrowers and Renters
•Fannie Mae has implemented new policies to enable the company’s single-family and multifamily loan servicers to better assist borrowers and renters impacted by COVID-19, including to:
◦provide forbearance to single-family borrowers reporting they are experiencing a financial hardship due to the COVID-19 pandemic for up to 180 days, and at the borrower’s request, extend the forbearance period up to a maximum of 12 months total; approximately 703,000 single-family loans in the company’s book of business were in forbearance as of September 30, 2020;
▪as of September 30, 2020, Fannie Mae estimates that the company had provided forbearance on approximately 96% of those single-family loans in its book of business that were negatively impacted by COVID-19 (that is, were current as of March 1, 2020 and were 60 days or more delinquent as of September 30, 2020).
◦offer options following forbearance, including a repayment plan, payment deferral, or a loan modification that aims to reduce a borrower’s monthly payment;
◦suspend foreclosures and foreclosure-related activities for single-family properties through at least December 31, 2020, other than for vacant or abandoned properties;
◦report as current to credit bureaus homeowners who receive a forbearance plan or other form of relief as a result of the COVID-19 pandemic during the covered period if they were current before the accommodation and make payments as agreed under the accommodation in accordance with the Fair Credit Reporting Act, as amended by the CARES Act, and provide that no late fees are charged for homeowners in a forbearance plan; and
| Third Quarter 2020 Results | 2 | |||||||
◦provide forbearance to multifamily borrowers experiencing a financial hardship due to the COVID-19 pandemic for up to 6 months on the condition that the borrower suspend all renter evictions for nonpayment of rent during the forbearance period, through the 120-day eviction moratorium under the CARES Act, which ended on July 25, 2020, or any longer period required by federal, state or local law, including the order issued by the Centers for Disease Control and Prevention, effective September 4, 2020 through December 31, 2020, which halts residential evictions for nonpayment of rent for tenants who qualify for protection under the order.
•Fannie Mae created the #HeretoHelp educational effort and updated the company’s KnowYourOptions.com website to help keep people in their homes, providing information and resources on relief options for borrowers and renters impacted by COVID-19. The website includes the Renters Resource Finder, an online tool that allows renters to enter their building address to determine whether they live in a Fannie Mae-financed property and learn what resources they can access for help. Resources include access to Fannie Mae’s Disaster Response Network, which offers free assistance to renters in Fannie Mae-financed rental properties, such as HUD-approved housing counselors that can help create a personalized action plan, offer financial coaching and budgeting, and provide other support.
Lenders
•Fannie Mae provided more than $860 billion in liquidity to the single-family and multifamily mortgage markets from the beginning of March 2020 through September 2020, including more than $460 billion through the company’s whole loan conduit, which primarily supports small- to mid-sized lenders, including community lenders, fulfilling Fannie Mae’s mission to stabilize the housing finance market and provide liquidity, support, and access to affordable mortgage financing in all U.S. markets in all economic cycles.
•Fannie Mae limited the duration of single-family servicers’ obligations to advance principal and interest payments on delinquent loans to four months, and allows servicers to automatically receive reimbursement for advanced payments of principal and interest on a delinquent loan after four missed payments. Multifamily servicers can be reimbursed for advanced payments of principal and interest on a delinquent mortgage loan after paying the fourth of four continuous months of advances.
•Fannie Mae continues to build its digital mortgage capabilities, enabling the company to adapt quickly to lenders’ needs. In addition, the company is offering measures to help ensure lenders have the clarity and flexibility to continue to lend in a prudent and responsible manner during the COVID-19 pandemic. These measures include: offering additional methods of obtaining verbal verification of borrower employment; using the company’s digital tools to offer flexibilities related to the lender’s process for obtaining inspections and appraisals; and allowing remote online notarization options.
Employees
•Fannie Mae has taken steps to help protect the safety and resiliency of its workforce. From mid-March through early October 2020, the company required nearly all of its workforce to work remotely. In early October, the company began allowing employees, on a voluntary basis, to request approval to return to work at some of its office locations and has established mandatory COVID-19 safety protocols for these locations. Fannie Mae expects a significant majority of its employees will continue to work remotely for the foreseeable future.
•To date, the company’s business resiliency plans and technology systems have effectively supported its telework arrangement, allowing Fannie Mae to continue its critical function of supporting mortgage market liquidity.
•Fannie Mae offers support services and resources for employees and their families affected by COVID-19, including the company’s Employee Assistance Program, which provides a helpline number to support loved ones who may not be covered otherwise.
| Third Quarter 2020 Results | 3 | |||||||
Risks and Uncertainties
Fannie Mae’s current forecasts and expectations relating to the impact of the COVID-19 pandemic are subject to many uncertainties and may change, perhaps substantially. It is difficult to assess or predict the impact of this unprecedented event on the company’s business, financial results, or financial condition. Factors that will impact the extent to which the COVID-19 pandemic affects the company’s business, financial results, and financial condition include: the duration, spread, and severity of COVID-19 outbreaks; the actions taken to contain the virus or treat its impact, including government actions to mitigate the economic impact of the pandemic and the widespread availability and public acceptance of a COVID-19 vaccine; the extent to which consumers, workers, and families feel safe resuming pre-pandemic activities; the nature, extent and success of the forbearance, payment deferrals, modifications, and other loss mitigation options the company provides to borrowers affected by the pandemic; accounting elections and estimates relating to the impact of the COVID-19 pandemic; borrower and renter behavior in response to the pandemic and its economic impact; how quickly and to what extent normal economic and operating conditions can resume, including whether any future outbreaks or increases in the daily number of new COVID-19 cases interrupt economic recovery; and how quickly and to what extent affected borrowers, renters, and counterparties can recover from the negative economic impact of the pandemic. See “Risk Factors” in the company’s Third Quarter 2020 Form 10-Q for a discussion of the risks to the company’s business, financial results and financial condition relating to the COVID-19 pandemic. See “Forward-Looking Statements” in the company’s Third Quarter 2020 Form 10-Q for a discussion of factors that could cause actual conditions, events, or results to differ materially from those described in the company’s forecasts, expectations, and other forward-looking statements in this release.
Summary of Financial Results | ||
(Dollars in millions) | 3Q20 | 2Q20 | Variance | 3Q19 | Variance | |||||||||||||||||||||||||||
Net interest income | $ | 6,656 | $ | 5,777 | $ | 879 | $ | 5,348 | $ | 1,308 | ||||||||||||||||||||||
Fee and other income | 93 | 90 | 3 | 188 | (95) | |||||||||||||||||||||||||||
Net revenues | 6,749 | 5,867 | 882 | 5,536 | 1,213 | |||||||||||||||||||||||||||
| Investment gains, net | 653 | 149 | 504 | 253 | 400 | |||||||||||||||||||||||||||
| Fair value losses, net | (327) | (1,018) | 691 | (713) | 386 | |||||||||||||||||||||||||||
| Administrative expenses | (762) | (754) | (8) | (749) | (13) | |||||||||||||||||||||||||||
| Credit-related income (expenses): | ||||||||||||||||||||||||||||||||
| Benefit (provision) for credit losses | 501 | (12) | 513 | 1,857 | (1,356) | |||||||||||||||||||||||||||
Foreclosed property expense | (71) | (10) | (61) | (96) | 25 | |||||||||||||||||||||||||||
| Total credit-related income (expenses) | 430 | (22) | 452 | 1,761 | (1,331) | |||||||||||||||||||||||||||
Temporary Payroll Tax Cut Continuation Act of 2011 (“TCCA”) fees | (679) | (660) | (19) | (613) | (66) | |||||||||||||||||||||||||||
| Credit enhancement expense | (325) | (360) | 35 | (290) | (35) | |||||||||||||||||||||||||||
| Change in expected credit enhancement recoveries | (48) | 273 | (321) | — | (48) | |||||||||||||||||||||||||||
Other expenses, net | (313) | (261) | (52) | (186) | (127) | |||||||||||||||||||||||||||
Income before federal income taxes | 5,378 | 3,214 | 2,164 | 4,999 | 379 | |||||||||||||||||||||||||||
Provision for federal income taxes | (1,149) | (669) | (480) | (1,036) | (113) | |||||||||||||||||||||||||||
Net income | $ | 4,229 | $ | 2,545 | $ | 1,684 | $ | 3,963 | $ | 266 | ||||||||||||||||||||||
Total comprehensive income | $ | 4,216 | $ | 2,532 | $ | 1,684 | $ | 3,977 | $ | 239 | ||||||||||||||||||||||
Net revenues, which consist of net interest income and fee and other income, were $6.7 billion for the third quarter of 2020, compared with $5.9 billion for the second quarter of 2020.
Net interest income was $6.7 billion for the third quarter of 2020, compared with $5.8 billion for the second quarter of 2020. The increase in net interest income was due to higher mortgage loan prepayment activity as a result of the historically low interest rate environment in the third quarter of 2020. The company’s net interest income for the third quarter of 2020 was also impacted by the application of its updated accounting policy for nonaccrual loans that allowed the company to continue accruing interest income on delinquent loans that were current at March 1, 2020 and have been negatively impacted by the COVID-19 pandemic. As a result of this update, the company recognized
| Third Quarter 2020 Results | 4 | |||||||
$763 million in interest income related to these loans in the third quarter, which it would not have recognized prior to the application of its updated policy.
Net Interest Income
(Dollars in Billions)
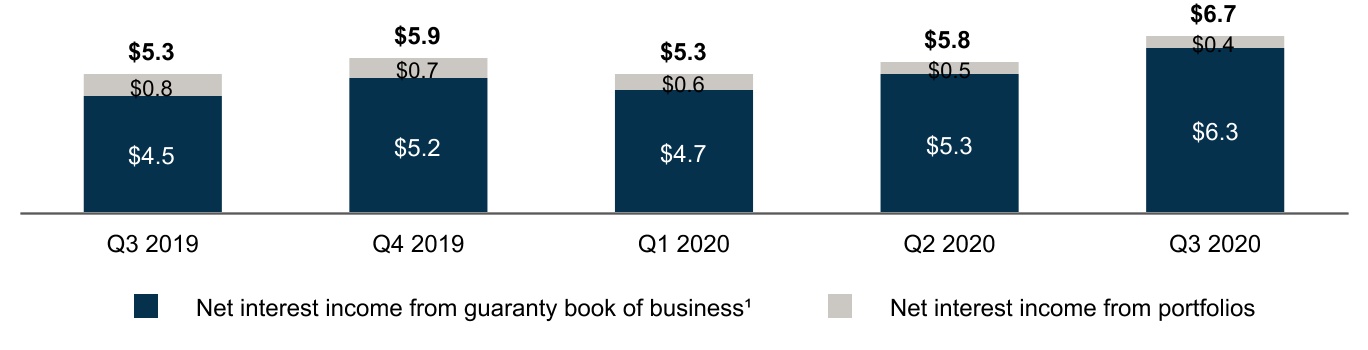
(1)Includes revenues generated by the 10 basis point guaranty fee increase the company implemented pursuant to the TCCA, the incremental revenue from which is remitted to Treasury and not retained by Fannie Mae.
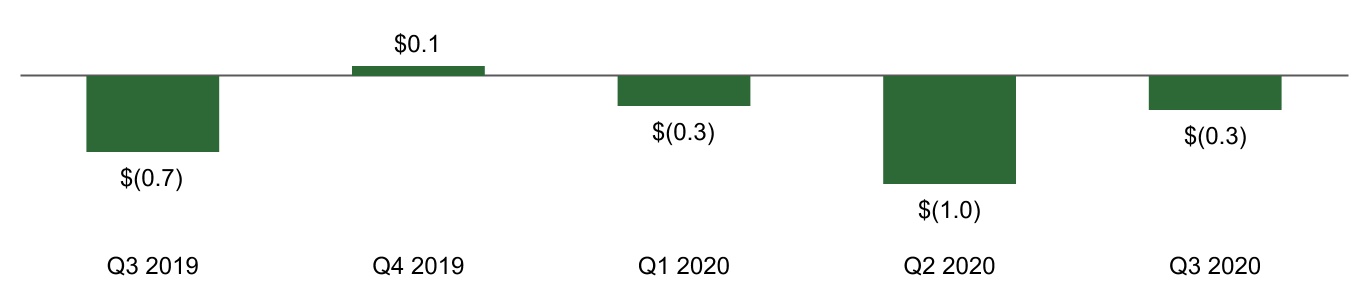
Net fair value losses were $327 million in the third quarter of 2020, compared with $1.0 billion in the second quarter of 2020. Net fair value losses decreased in the third quarter of 2020 compared with the second quarter of 2020 due primarily to (1) a decrease in losses on debt reported at fair value due to yields remaining mostly flat during the quarter compared to declines in the second quarter of 2020 and (2) gains on credit enhancement derivatives as higher loan default expectations led to an increase in the fair value of risk-sharing securities covering the loans.
Fair Value Gains (Losses), Net
(Dollars in Billions)
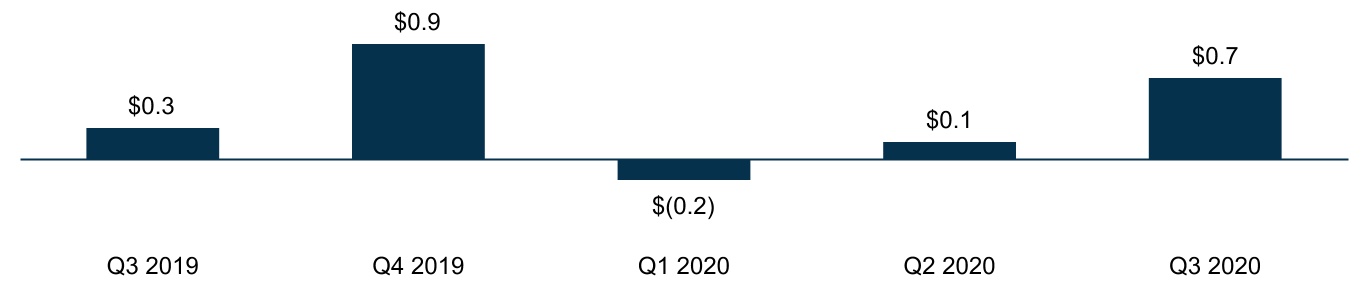
Net investment gains were $653 million in the third quarter of 2020, compared with $149 million in the second quarter of 2020. The increase in the third quarter of 2020 was driven by an increase in sales of single-family held-for-sale loans.
Investment Gains (Losses), Net
(Dollars in Billions)
| Third Quarter 2020 Results | 5 | |||||||
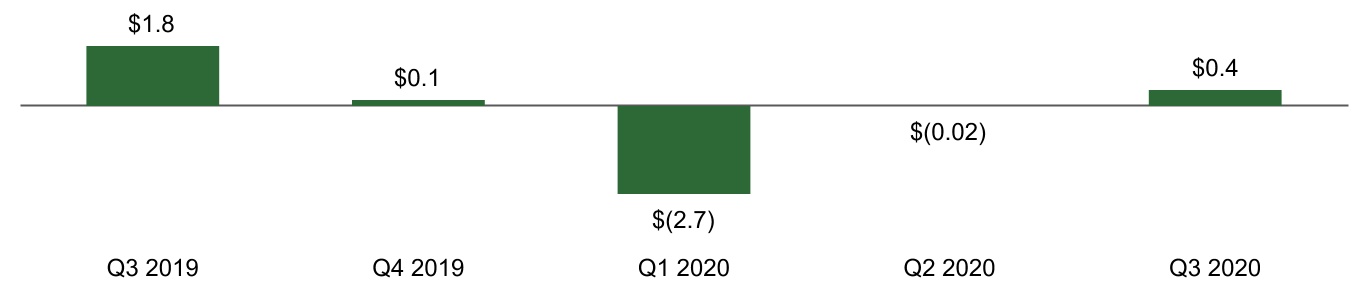
Credit-related income (expense) consists of a benefit or provision for credit losses and foreclosed property expense. Credit-related income was $430 million in the third quarter of 2020, compared with credit-related expense of $22 million in the second quarter of 2020. The shift to credit-related income in the third quarter of 2020 was driven by the impact of actual and forecasted home prices as well as the redesignation of reperforming single-family mortgage loans from held-for-investment to held-for-sale, partially offset by an increase in the allowance for loan losses the company expects to incur as a result of the COVID-19 pandemic. In the third quarter of 2020, management continued to apply its judgment and supplement model results as of September 30, 2020, taking into account the continued high degree of uncertainty regarding the future impact of the pandemic and its effect on the economy, future economic and housing policy, and extended foreclosure moratoriums.
Credit-Related Income (Expense)
(Dollars in Billions)
Providing Liquidity and Support to the Market | ||
Fannie Mae’s mission is to provide a stable source of liquidity to support housing for low-and moderate-income borrowers and renters. In the first nine months of 2020, more than 90% of the multifamily units the company financed were affordable to families earning at or below 120% of the area median income, providing support for workforce housing and affordable housing.
Through its single-family and multifamily business segments, Fannie Mae provided $982 billion in liquidity to the mortgage market in the first nine months of 2020, including $506 billion through its whole loan conduit, enabling the financing of approximately 3.9 million home purchases, refinancings, or rental units.
Fannie Mae Provided $982 Billion in Liquidity in the First Nine Months of 2020
| Unpaid Principal Balance | Units | |||||||||||||
| $286B | 1.0M Single-Family Home Purchases | |||||||||||||
| $647B | 2.3M Single-Family Refinancings | |||||||||||||
| $49B | 542K Multifamily Rental Units | |||||||||||||
| Third Quarter 2020 Results | 6 | |||||||
Business Segments | ||
Fannie Mae’s two reportable business segments—Single-Family and Multifamily—engage in complementary business activities to provide liquidity, access to credit, and affordability in all U.S. housing markets at all times, while effectively managing risk.
Single-Family Business Financial Results | ||
(Dollars in millions) | 3Q20 | 2Q20 | Variance | 3Q19 | Variance | |||||||||||||||||||||||||||
| Net interest income | $ | 5,870 | $ | 4,939 | $ | 931 | $ | 4,484 | $ | 1,386 | ||||||||||||||||||||||
| Fee and other income | 73 | 71 | 2 | 156 | (83) | |||||||||||||||||||||||||||
| Net revenues | 5,943 | 5,010 | 933 | 4,640 | 1,303 | |||||||||||||||||||||||||||
| Investment gains, net | 583 | 96 | 487 | 198 | 385 | |||||||||||||||||||||||||||
| Fair value losses, net | (244) | (1,030) | 786 | (719) | 475 | |||||||||||||||||||||||||||
| Administrative expenses | (634) | (625) | (9) | (634) | — | |||||||||||||||||||||||||||
| Credit-related income | 478 | 216 | 262 | 1,747 | (1,269) | |||||||||||||||||||||||||||
| TCCA fees | (679) | (660) | (19) | (613) | (66) | |||||||||||||||||||||||||||
| Credit enhancement expense | (274) | (307) | 33 | (240) | (34) | |||||||||||||||||||||||||||
| Change in expected credit enhancement recoveries | (48) | 208 | (256) | — | (48) | |||||||||||||||||||||||||||
| Other expenses, net | (307) | (252) | (55) | (184) | (123) | |||||||||||||||||||||||||||
| Income before federal income taxes | 4,818 | 2,656 | 2,162 | 4,195 | 623 | |||||||||||||||||||||||||||
| Provision for federal income taxes | (1,049) | (556) | (493) | (872) | (177) | |||||||||||||||||||||||||||
| Net income | $ | 3,769 | $ | 2,100 | $ | 1,669 | $ | 3,323 | $ | 446 | ||||||||||||||||||||||
| Serious delinquency rate | 3.20 | % | 2.65 | % | 0.68 | % | ||||||||||||||||||||||||||
Business Highlights
•The average single-family conventional guaranty book of business during the third quarter of 2020 increased from the second quarter of 2020 by approximately $72 billion. The average charged guaranty fee, net of Temporary Payroll Tax Cut Continuation Act of 2011 (TCCA) fees, on the single-family conventional guaranty book increased from 44.2 basis points as of June 30, 2020 to 44.4 basis points as of September 30, 2020. The credit characteristics of the single-family conventional guaranty book of business did not change materially in the third quarter of 2020 and remained strong, with a weighted-average mark-to-market loan-to-value ratio of 57% and weighted-average FICO credit score of 749.
•Fannie Mae’s average charged guaranty fee on newly acquired conventional single-family loans, net of TCCA fees, decreased 1.8 basis points to 44.9 basis points in the third quarter of 2020 from 46.7 basis points in the second quarter of 2020, driven primarily by the stronger credit profile of the single-family loans acquired in the third quarter of 2020 compared with the second quarter of 2020.
•Single-family acquisition volume was $391.4 billion in the third quarter of 2020, an increase of 11% compared with the second quarter of 2020. The increase was driven by a $7 billion increase in refinance volume due to the historically low interest rate environment, resulting in the highest level of refinance volumes in any quarter since the third quarter of 2003.
•The single-family serious delinquency rate increased to 3.20% as of September 30, 2020, from 2.65% as of June 30, 2020, as a result of the large number of loans in COVID-19-related forbearances becoming seriously delinquent. The single-family serious delinquency rate excluding loans in forbearance was 0.65% as of September 30, 2020, compared to 0.59% as of June 30, 2020. Single-family seriously delinquent loans are loans that are 90 days or more past due or in the foreclosure process.
•As of September 30, 2020, 4.1% of Fannie Mae’s single-family guaranty book of business based on loan count was in forbearance, the vast majority of which was related to the COVID-19 pandemic, compared to 5.7% as of June 30, 2020. As of September 30, 2020, 20% of the loans in forbearance were still current.
| Third Quarter 2020 Results | 7 | |||||||
| Multifamily Business Financial Results | ||
| (Dollars in millions) | 3Q20 | 2Q20 | Variance | 3Q19 | Variance | |||||||||||||||||||||||||||
| Net interest income | $ | 786 | $ | 838 | $ | (52) | $ | 864 | $ | (78) | ||||||||||||||||||||||
| Fee and other income | 20 | 19 | 1 | 32 | (12) | |||||||||||||||||||||||||||
| Net revenues | 806 | 857 | (51) | 896 | (90) | |||||||||||||||||||||||||||
| Fair value gains (losses), net | (83) | 12 | (95) | 6 | (89) | |||||||||||||||||||||||||||
| Administrative expenses | (128) | (129) | 1 | (115) | (13) | |||||||||||||||||||||||||||
| Credit-related income (expense) | (48) | (238) | 190 | 14 | (62) | |||||||||||||||||||||||||||
| Credit enhancement expense | (51) | (53) | 2 | (50) | (1) | |||||||||||||||||||||||||||
| Change in expected credit enhancement recoveries | — | 65 | (65) | — | — | |||||||||||||||||||||||||||
| Other income, net | 64 | 44 | 20 | 53 | 11 | |||||||||||||||||||||||||||
| Income before federal income taxes | 560 | 558 | 2 | 804 | (244) | |||||||||||||||||||||||||||
| Provision for federal income taxes | (100) | (113) | 13 | (164) | 64 | |||||||||||||||||||||||||||
| Net income | $ | 460 | $ | 445 | $ | 15 | $ | 640 | $ | (180) | ||||||||||||||||||||||
| Serious delinquency rate | 1.12 | % | 1.00 | % | 0.06 | % | ||||||||||||||||||||||||||
Business Highlights
•The multifamily guaranty book of business increased by $9 billion during the third quarter of 2020 to $367 billion. The average charged guaranty fee on the multifamily book increased from 72.3 basis points as of June 30, 2020 to 73.3 basis points as of September 30, 2020. This resulted in an increase in guaranty fee revenue, which was offset by a decrease in portfolio net interest income and yield maintenance revenue resulting in a decrease in net interest income for the quarter.
•New multifamily business volume was $49 billion in the first nine months of 2020. Approximately $33 billion of new business capacity remains under the $100 billion multifamily business volume cap for the five-quarter period ending December 31, 2020.
•The multifamily serious delinquency rate increased to 1.12% as of September 30, 2020 from 1.00% as of June 30, 2020 as a result of the large number of loans in COVID-19-related forbearances becoming seriously delinquent. The multifamily serious delinquency rate excluding loans in forbearance was 0.04% as of September 30, 2020. Multifamily seriously delinquent loans are loans that are 60 days or more past due.
•As of September 30, 2020, based on unpaid principal balance, 1.3% of Fannie Mae’s multifamily guaranty book of business received a forbearance plan, primarily as a result of the COVID-19 pandemic. Approximately half of those loans measured by unpaid principal balance are currently in a repayment plan, and 0.5% of the book, or $1.7 billion, is still in active forbearance.
| Third Quarter 2020 Results | 8 | |||||||
Net Worth, Treasury Funding and Senior Preferred Stock Dividends | ||
Treasury has made a commitment under a senior preferred stock purchase agreement to provide funding to Fannie Mae under certain circumstances if the company has a net worth deficit. Pursuant to the senior preferred stock purchase agreement, the company issued shares of senior preferred stock to Treasury in 2008.
Under the terms of the senior preferred stock, Fannie Mae will not owe senior preferred stock dividends to Treasury until it has accumulated over $25 billion in net worth as of the end of a quarter. Accordingly, no dividends were payable to Treasury for the third quarter of 2020, and none are payable for the fourth quarter of 2020.
The charts below show information about Fannie Mae’s net worth, the remaining amount of Treasury’s funding commitment to Fannie Mae, senior preferred stock dividends the company has paid Treasury and funds the company has drawn from Treasury pursuant to its funding commitment.
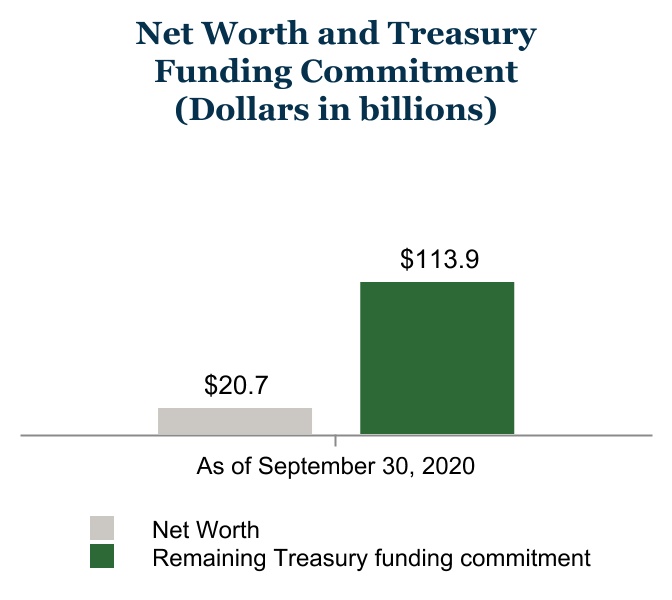
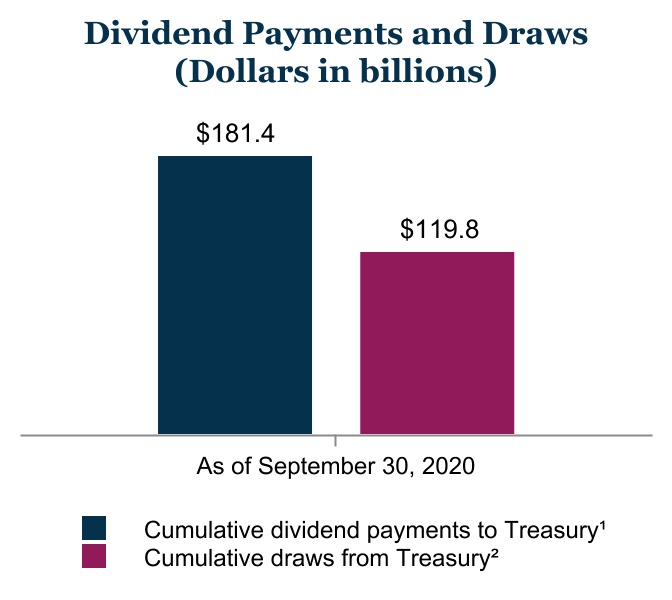
(1)Aggregate amount of dividends the company has paid to Treasury on the senior preferred stock from 2008 through September 30, 2020. Under the terms of the senior preferred stock purchase agreement, dividend payments the company makes to Treasury do not offset its draws of funds from Treasury.
(2)Aggregate amount of funds the company has drawn from Treasury pursuant to the senior preferred stock purchase agreement from 2008 through September 30, 2020.
The aggregate liquidation preference of the senior preferred stock increased from $135.4 billion as of June 30, 2020 to $138.0 billion as of September 30, 2020 due to the $2.5 billion increase in the company’s net worth during the second quarter of 2020. The aggregate liquidation preference of the senior preferred stock will increase to $142.2 billion as of December 31, 2020 due to the $4.2 billion increase in our net worth during the third quarter of 2020.
If the company were to draw additional funds from Treasury under the senior preferred stock purchase agreement with respect to a future period, the amount of remaining funding under the agreement would be reduced by the amount of the company’s draw, and the aggregate liquidation preference of the senior preferred stock would increase by the amount of that draw.
For a description of the terms of the senior preferred stock purchase agreement and the senior preferred stock, see “Business—Conservatorship, Treasury Agreements and Housing Finance Reform” in the company’s 2019 Form 10-K.
-
Fannie Mae’s financial statements for the third quarter of 2020 are available in the accompanying Annex; however, investors and interested parties should read the company’s Third Quarter 2020 Form 10-Q, which was filed today with the Securities and Exchange Commission and is available on Fannie Mae’s website, www.fanniemae.com. The company provides further discussion of its financial results and condition, credit performance, and other matters in
| Third Quarter 2020 Results | 9 | |||||||
its Third Quarter 2020 Form 10-Q. Additional information about the company’s financial and credit performance is contained in Fannie Mae’s Q3 2020 Financial Supplement at www.fanniemae.com.
# # #
In this release, the company has presented a number of estimates, forecasts, expectations, and other forward-looking statements, including statements regarding: the company’s business plans, the company’s future business and financial results, the future impact of the COVID-19 pandemic on the company’s business and financial results, future dividend payments to Treasury, and the future liquidation preference of the senior preferred stock. These estimates, forecasts, expectations, and statements are forward-looking statements based on the company’s current assumptions regarding numerous factors and are subject to significant uncertainties and changes in circumstances. Actual results, and future projections, could be materially different from what is set forth in these forward-looking statements due to a variety of factors, including those described in “Forward-Looking Statements” and “Risk Factors” in the company’s Third Quarter 2020 Form 10-Q and its 2019 Form 10-K.
Fannie Mae provides website addresses in its news releases solely for readers’ information. Other content or information appearing on these websites is not part of this release.
Fannie Mae helps make the 30-year fixed-rate mortgage and affordable rental housing possible for millions of Americans. We partner with lenders to create housing opportunities for families across the country. We are driving positive changes in housing finance to make the home buying process easier, while reducing costs and risk. To learn more, visit fanniemae.com and follow us on twitter.com/fanniemae.
| Third Quarter 2020 Results | 10 | |||||||
ANNEX
FANNIE MAE
(In conservatorship)
Condensed Consolidated Balance Sheets — (Unaudited)
(Dollars in millions)
| As of | |||||||||||||||||||||||
| September 30, 2020 | December 31, 2019 | ||||||||||||||||||||||
| ASSETS | |||||||||||||||||||||||
| Cash and cash equivalents | $ | 37,472 | $ | 21,184 | |||||||||||||||||||
Restricted cash (includes $65,431 and $33,294, respectively, related to consolidated trusts) | 73,516 | 40,223 | |||||||||||||||||||||
| Federal funds sold and securities purchased under agreements to resell or similar arrangements | 12,700 | 13,578 | |||||||||||||||||||||
| Investments in securities: | |||||||||||||||||||||||
Trading, at fair value (includes $6,237 and $3,037, respectively, pledged as collateral) | 142,472 | 48,123 | |||||||||||||||||||||
Available-for-sale, at fair value (with an amortized cost of $1,780, net of allowance for credit losses of $3 as of September 30, 2020) | 1,895 | 2,404 | |||||||||||||||||||||
| Total investments in securities | 144,367 | 50,527 | |||||||||||||||||||||
| Mortgage loans: | |||||||||||||||||||||||
Loans held for sale, at lower of cost or fair value | 8,312 | 6,773 | |||||||||||||||||||||
| Loans held for investment, at amortized cost: | |||||||||||||||||||||||
| Of Fannie Mae | 111,056 | 94,911 | |||||||||||||||||||||
Of consolidated trusts | 3,439,678 | 3,241,494 | |||||||||||||||||||||
Total loans held for investment (includes $6,968 and $7,825, respectively, at fair value) | 3,550,734 | 3,336,405 | |||||||||||||||||||||
| Allowance for loan losses | (11,703) | (9,016) | |||||||||||||||||||||
| Total loans held for investment, net of allowance | 3,539,031 | 3,327,389 | |||||||||||||||||||||
| Total mortgage loans | 3,547,343 | 3,334,162 | |||||||||||||||||||||
| Advances to lenders | 10,228 | 6,453 | |||||||||||||||||||||
| Deferred tax assets, net | 12,808 | 11,910 | |||||||||||||||||||||
Accrued interest receivable, net (includes $9,867 and $8,172, respectively, related to consolidated trusts and net of an allowance of $569 as of September 30, 2020) | 9,748 | 8,604 | |||||||||||||||||||||
| Acquired property, net | 1,462 | 2,366 | |||||||||||||||||||||
| Other assets | 14,959 | 14,312 | |||||||||||||||||||||
| Total assets | $ | 3,864,603 | $ | 3,503,319 | |||||||||||||||||||
| LIABILITIES AND EQUITY | |||||||||||||||||||||||
| Liabilities: | |||||||||||||||||||||||
Accrued interest payable (includes $9,133 and $9,361, respectively, related to consolidated trusts) | $ | 9,982 | $ | 10,228 | |||||||||||||||||||
| Debt: | |||||||||||||||||||||||
Of Fannie Mae (includes $3,986 and $5,687, respectively, at fair value) | 289,423 | 182,247 | |||||||||||||||||||||
Of consolidated trusts (includes $24,741 and $21,880, respectively, at fair value) | 3,530,381 | 3,285,139 | |||||||||||||||||||||
Other liabilities (includes $1,813 and $376, respectively, related to consolidated trusts) | 14,124 | 11,097 | |||||||||||||||||||||
| Total liabilities | 3,843,910 | 3,488,711 | |||||||||||||||||||||
| Commitments and contingencies (Note 13) | — | — | |||||||||||||||||||||
| Fannie Mae stockholders’ equity: | |||||||||||||||||||||||
Senior preferred stock (liquidation preference of $137,976 and $131,178, respectively) | 120,836 | 120,836 | |||||||||||||||||||||
Preferred stock, 700,000,000 shares are authorized—555,374,922 shares issued and outstanding | 19,130 | 19,130 | |||||||||||||||||||||
Common stock, no par value, no maximum authorization—1,308,762,703 shares issued and 1,158,087,567 shares outstanding | 687 | 687 | |||||||||||||||||||||
| Accumulated deficit | (112,680) | (118,776) | |||||||||||||||||||||
| Accumulated other comprehensive income | 120 | 131 | |||||||||||||||||||||
Treasury stock, at cost, 150,675,136 shares | (7,400) | (7,400) | |||||||||||||||||||||
Total stockholders’ equity (See Note 1: Senior Preferred Stock Purchase Agreement and Senior Preferred Stock for information on the related dividend obligation and liquidation preference) | 20,693 | 14,608 | |||||||||||||||||||||
| Total liabilities and equity | $ | 3,864,603 | $ | 3,503,319 | |||||||||||||||||||
See Notes to Condensed Consolidated Financial Statements in the Third Quarter 2020 Form 10-Q
| Third Quarter 2020 Results | 11 | |||||||
FANNIE MAE
(In conservatorship)
Condensed Consolidated Statements of Operations and Comprehensive Income — (Unaudited)
(Dollars in millions, except per share amounts)
| For the Three Months Ended September 30, | For the Nine Months Ended September 30, | ||||||||||||||||||||||||||||||||||||||||||||||
| 2020 | 2019 | 2020 | 2019 | ||||||||||||||||||||||||||||||||||||||||||||
| Interest income: | |||||||||||||||||||||||||||||||||||||||||||||||
| Trading securities | $ | 177 | $ | 418 | $ | 712 | $ | 1,277 | |||||||||||||||||||||||||||||||||||||||
| Available-for-sale securities | 19 | 40 | 76 | 138 | |||||||||||||||||||||||||||||||||||||||||||
| Mortgage loans | 25,810 | 29,072 | 81,755 | 88,445 | |||||||||||||||||||||||||||||||||||||||||||
Federal funds sold and securities purchased under agreements to resell or similar arrangements | 14 | 178 | 135 | 698 | |||||||||||||||||||||||||||||||||||||||||||
| Other | 33 | 47 | 92 | 120 | |||||||||||||||||||||||||||||||||||||||||||
| Total interest income | 26,053 | 29,755 | 82,770 | 90,678 | |||||||||||||||||||||||||||||||||||||||||||
| Interest expense: | |||||||||||||||||||||||||||||||||||||||||||||||
Short-term debt | (19) | (125) | (175) | (369) | |||||||||||||||||||||||||||||||||||||||||||
| Long-term debt | (19,378) | (24,282) | (64,815) | (74,938) | |||||||||||||||||||||||||||||||||||||||||||
| Total interest expense | (19,397) | (24,407) | (64,990) | (75,307) | |||||||||||||||||||||||||||||||||||||||||||
| Net interest income | 6,656 | 5,348 | 17,780 | 15,371 | |||||||||||||||||||||||||||||||||||||||||||
| Benefit (provision) for credit losses | 501 | 1,857 | (2,094) | 3,732 | |||||||||||||||||||||||||||||||||||||||||||
| Net interest income after benefit (provision) for credit losses | 7,157 | 7,205 | 15,686 | 19,103 | |||||||||||||||||||||||||||||||||||||||||||
| Investment gains, net | 653 | 253 | 644 | 847 | |||||||||||||||||||||||||||||||||||||||||||
| Fair value losses, net | (327) | (713) | (1,621) | (2,298) | |||||||||||||||||||||||||||||||||||||||||||
| Fee and other income | 93 | 188 | 303 | 435 | |||||||||||||||||||||||||||||||||||||||||||
| Non-interest income (loss) | 419 | (272) | (674) | (1,016) | |||||||||||||||||||||||||||||||||||||||||||
| Administrative expenses: | |||||||||||||||||||||||||||||||||||||||||||||||
| Salaries and employee benefits | (386) | (361) | (1,161) | (1,123) | |||||||||||||||||||||||||||||||||||||||||||
| Professional services | (230) | (241) | (673) | (699) | |||||||||||||||||||||||||||||||||||||||||||
| Other administrative expenses | (146) | (147) | (431) | (415) | |||||||||||||||||||||||||||||||||||||||||||
| Total administrative expenses | (762) | (749) | (2,265) | (2,237) | |||||||||||||||||||||||||||||||||||||||||||
| Foreclosed property expense | (71) | (96) | (161) | (364) | |||||||||||||||||||||||||||||||||||||||||||
| Temporary Payroll Tax Cut Continuation Act of 2011 (“TCCA”) fees | (679) | (613) | (1,976) | (1,806) | |||||||||||||||||||||||||||||||||||||||||||
| Credit enhancement expense | (325) | (290) | (1,061) | (782) | |||||||||||||||||||||||||||||||||||||||||||
| Change in expected credit enhancement recoveries | (48) | — | 413 | — | |||||||||||||||||||||||||||||||||||||||||||
| Other expenses, net | (313) | (186) | (792) | (551) | |||||||||||||||||||||||||||||||||||||||||||
| Total expenses | (2,198) | (1,934) | (5,842) | (5,740) | |||||||||||||||||||||||||||||||||||||||||||
| Income before federal income taxes | 5,378 | 4,999 | 9,170 | 12,347 | |||||||||||||||||||||||||||||||||||||||||||
| Provision for federal income taxes | (1,149) | (1,036) | (1,935) | (2,552) | |||||||||||||||||||||||||||||||||||||||||||
| Net income | 4,229 | 3,963 | 7,235 | 9,795 | |||||||||||||||||||||||||||||||||||||||||||
| Other comprehensive income (loss): | |||||||||||||||||||||||||||||||||||||||||||||||
Changes in unrealized gains (losses) on available-for-sale securities, net of reclassification adjustments and taxes | (11) | 16 | (4) | (85) | |||||||||||||||||||||||||||||||||||||||||||
| Other, net of taxes | (2) | (2) | (7) | (7) | |||||||||||||||||||||||||||||||||||||||||||
| Total other comprehensive income (loss) | (13) | 14 | (11) | (92) | |||||||||||||||||||||||||||||||||||||||||||
| Total comprehensive income | $ | 4,216 | $ | 3,977 | $ | 7,224 | $ | 9,703 | |||||||||||||||||||||||||||||||||||||||
| Net income | $ | 4,229 | $ | 3,963 | $ | 7,235 | $ | 9,795 | |||||||||||||||||||||||||||||||||||||||
Dividends distributed or amounts attributable to senior preferred stock | (4,216) | (3,977) | (7,224) | (9,703) | |||||||||||||||||||||||||||||||||||||||||||
| Net income (loss) attributable to common stockholders | $ | 13 | $ | (14) | $ | 11 | $ | 92 | |||||||||||||||||||||||||||||||||||||||
| Earnings per share: | |||||||||||||||||||||||||||||||||||||||||||||||
| Basic | $ | 0.00 | $ | 0.00 | $ | 0.00 | $ | 0.02 | |||||||||||||||||||||||||||||||||||||||
| Diluted | 0.00 | 0.00 | 0.00 | 0.02 | |||||||||||||||||||||||||||||||||||||||||||
| Weighted-average common shares outstanding: | |||||||||||||||||||||||||||||||||||||||||||||||
| Basic | 5,867 | 5,762 | 5,867 | 5,762 | |||||||||||||||||||||||||||||||||||||||||||
| Diluted | 5,893 | 5,762 | 5,893 | 5,893 | |||||||||||||||||||||||||||||||||||||||||||
See Notes to Condensed Consolidated Financial Statements in the Third Quarter 2020 Form 10-Q
| Third Quarter 2020 Results | 12 | |||||||
FANNIE MAE
(In conservatorship)
Condensed Consolidated Statements of Cash Flows — (Unaudited)
(Dollars in millions)
| For the Nine Months Ended September 30, | |||||||||||||||||||||||
| 2020 | 2019 | ||||||||||||||||||||||
| Net cash provided by (used in) operating activities | $ | (76,994) | $ | 3,176 | |||||||||||||||||||
| Cash flows provided by (used in) investing activities: | |||||||||||||||||||||||
| Proceeds from maturities and paydowns of trading securities held for investment | 35 | 46 | |||||||||||||||||||||
| Proceeds from sales of trading securities held for investment | 44 | 49 | |||||||||||||||||||||
| Proceeds from maturities and paydowns of available-for-sale securities | 275 | 364 | |||||||||||||||||||||
| Proceeds from sales of available-for-sale securities | 258 | 376 | |||||||||||||||||||||
| Purchases of loans held for investment | (519,133) | (181,898) | |||||||||||||||||||||
| Proceeds from repayments of loans acquired as held for investment of Fannie Mae | 7,711 | 9,338 | |||||||||||||||||||||
| Proceeds from sales of loans acquired as held for investment of Fannie Mae | 4,422 | 8,987 | |||||||||||||||||||||
Proceeds from repayments and sales of loans acquired as held for investment of consolidated trusts | 770,982 | 377,789 | |||||||||||||||||||||
| Advances to lenders | (223,007) | (95,636) | |||||||||||||||||||||
| Proceeds from disposition of acquired property and preforeclosure sales | 4,694 | 5,644 | |||||||||||||||||||||
Net change in federal funds sold and securities purchased under agreements to resell or similar arrangements | 878 | 9,762 | |||||||||||||||||||||
| Other, net | (576) | (74) | |||||||||||||||||||||
| Net cash provided by investing activities | 46,583 | 134,747 | |||||||||||||||||||||
| Cash flows provided by (used in) financing activities: | |||||||||||||||||||||||
| Proceeds from issuance of debt of Fannie Mae | 501,627 | 587,659 | |||||||||||||||||||||
| Payments to redeem debt of Fannie Mae | (394,187) | (606,665) | |||||||||||||||||||||
| Proceeds from issuance of debt of consolidated trusts | 716,591 | 286,126 | |||||||||||||||||||||
| Payments to redeem debt of consolidated trusts | (743,578) | (385,496) | |||||||||||||||||||||
| Payments of cash dividends on senior preferred stock to Treasury | — | (5,601) | |||||||||||||||||||||
| Other, net | (461) | 1,129 | |||||||||||||||||||||
| Net cash provided by (used in) financing activities | 79,992 | (122,848) | |||||||||||||||||||||
| Net increase in cash, cash equivalents and restricted cash | 49,581 | 15,075 | |||||||||||||||||||||
| Cash, cash equivalents and restricted cash at beginning of period | 61,407 | 49,423 | |||||||||||||||||||||
| Cash, cash equivalents and restricted cash at end of period | $ | 110,988 | $ | 64,498 | |||||||||||||||||||
| Cash paid during the period for: | |||||||||||||||||||||||
| Interest | $ | 86,035 | $ | 86,699 | |||||||||||||||||||
| Income taxes | 2,750 | 1,250 | |||||||||||||||||||||
See Notes to Condensed Consolidated Financial Statements in the Third Quarter 2020 Form 10-Q
| Third Quarter 2020 Results | 13 | |||||||
FANNIE MAE
(In conservatorship)
Condensed Consolidated Statements of Changes in Equity (Deficit) — (Unaudited)
(Dollars and shares in millions)
| Fannie Mae Stockholders’ Equity (Deficit) | ||||||||||||||||||||||||||||||||||||||||||||||||||||||||||||||
| Shares Outstanding | Senior Preferred Stock | Preferred Stock | Common Stock | Accumulated Deficit | Accumulated Other Comprehensive Income | Treasury Stock | Total Equity | |||||||||||||||||||||||||||||||||||||||||||||||||||||||
| Senior Preferred | Preferred | Common | ||||||||||||||||||||||||||||||||||||||||||||||||||||||||||||
| Balance as of June 30, 2020 | 1 | 556 | 1,158 | $ | 120,836 | $ | 19,130 | $ | 687 | $ | (116,909) | $ | 133 | $ | (7,400) | $ | 16,477 | |||||||||||||||||||||||||||||||||||||||||||||
| Senior preferred stock dividends paid | — | — | — | — | — | — | — | — | — | — | ||||||||||||||||||||||||||||||||||||||||||||||||||||
| Comprehensive income: | ||||||||||||||||||||||||||||||||||||||||||||||||||||||||||||||
| Net income | — | — | — | — | — | — | 4,229 | — | — | 4,229 | ||||||||||||||||||||||||||||||||||||||||||||||||||||
| Other comprehensive income, net of tax effect: | ||||||||||||||||||||||||||||||||||||||||||||||||||||||||||||||
Changes in net unrealized gains on available- for-sale securities (net of taxes of $0) | — | — | — | — | — | — | — | 1 | — | 1 | ||||||||||||||||||||||||||||||||||||||||||||||||||||
Reclassification adjustment for gains included in net income (net of taxes of $3) | — | — | — | — | — | — | — | (12) | — | (12) | ||||||||||||||||||||||||||||||||||||||||||||||||||||
Other (net of taxes of $1) | — | — | — | — | — | — | — | (2) | — | (2) | ||||||||||||||||||||||||||||||||||||||||||||||||||||
| Total comprehensive income | 4,216 | |||||||||||||||||||||||||||||||||||||||||||||||||||||||||||||
| Balance as of September 30, 2020 | 1 | 556 | 1,158 | $ | 120,836 | $ | 19,130 | $ | 687 | $ | (112,680) | $ | 120 | $ | (7,400) | $ | 20,693 | |||||||||||||||||||||||||||||||||||||||||||||
| Fannie Mae Stockholders’ Equity (Deficit) | ||||||||||||||||||||||||||||||||||||||||||||||||||||||||||||||
| Shares Outstanding | Senior Preferred Stock | Preferred Stock | Common Stock | Accumulated Deficit | Accumulated Other Comprehensive Income | Treasury Stock | Total Equity | |||||||||||||||||||||||||||||||||||||||||||||||||||||||
| Senior Preferred | Preferred | Common | ||||||||||||||||||||||||||||||||||||||||||||||||||||||||||||
| Balance as of December 31, 2019 | 1 | 556 | 1,158 | $ | 120,836 | $ | 19,130 | $ | 687 | $ | (118,776) | $ | 131 | $ | (7,400) | $ | 14,608 | |||||||||||||||||||||||||||||||||||||||||||||
| Transition impact, net of tax, from the adoption of the current expected credit loss standard | — | — | — | — | — | — | (1,139) | — | — | (1,139) | ||||||||||||||||||||||||||||||||||||||||||||||||||||
| Balance as of January 1, 2020, adjusted | 1 | 556 | 1,158 | 120,836 | 19,130 | 687 | (119,915) | 131 | (7,400) | 13,469 | ||||||||||||||||||||||||||||||||||||||||||||||||||||
| Senior preferred stock dividends paid | — | — | — | — | — | — | — | — | — | — | ||||||||||||||||||||||||||||||||||||||||||||||||||||
| Comprehensive income: | ||||||||||||||||||||||||||||||||||||||||||||||||||||||||||||||
| Net income | — | — | — | — | — | — | 7,235 | — | — | 7,235 | ||||||||||||||||||||||||||||||||||||||||||||||||||||
| Other comprehensive income, net of tax effect: | ||||||||||||||||||||||||||||||||||||||||||||||||||||||||||||||
Changes in net unrealized gains on available- for-sale securities (net of taxes of $1) | — | — | — | — | — | — | — | 2 | — | 2 | ||||||||||||||||||||||||||||||||||||||||||||||||||||
Reclassification adjustment for gains included in net income (net of taxes of $2) | — | — | — | — | — | — | — | (6) | — | (6) | ||||||||||||||||||||||||||||||||||||||||||||||||||||
Other (net of taxes of $2) | — | — | — | — | — | — | — | (7) | — | (7) | ||||||||||||||||||||||||||||||||||||||||||||||||||||
| Total comprehensive income | 7,224 | |||||||||||||||||||||||||||||||||||||||||||||||||||||||||||||
| Balance as of September 30, 2020 | 1 | 556 | 1,158 | $ | 120,836 | $ | 19,130 | $ | 687 | $ | (112,680) | $ | 120 | $ | (7,400) | $ | 20,693 | |||||||||||||||||||||||||||||||||||||||||||||
See Notes to Condensed Consolidated Financial Statements in the Third Quarter 2020 Form 10-Q
| Third Quarter 2020 Results | 14 | |||||||
FANNIE MAE
(In conservatorship)
Condensed Consolidated Statements of Changes in Equity (Deficit) — (Unaudited)
(Dollars and shares in millions)
| Fannie Mae Stockholders’ Equity (Deficit) | ||||||||||||||||||||||||||||||||||||||||||||||||||||||||||||||
| Shares Outstanding | Senior Preferred Stock | Preferred Stock | Common Stock | Accumulated Deficit | Accumulated Other Comprehensive Income | Treasury Stock | Total Equity | |||||||||||||||||||||||||||||||||||||||||||||||||||||||
| Senior Preferred | Preferred | Common | ||||||||||||||||||||||||||||||||||||||||||||||||||||||||||||
| Balance as of June 30, 2019 | 1 | 556 | 1,158 | $ | 120,836 | $ | 19,130 | $ | 687 | $ | (127,104) | $ | 216 | $ | (7,400) | $ | 6,365 | |||||||||||||||||||||||||||||||||||||||||||||
| Senior preferred stock dividends paid | — | — | — | — | — | — | — | — | — | — | ||||||||||||||||||||||||||||||||||||||||||||||||||||
| Comprehensive income: | ||||||||||||||||||||||||||||||||||||||||||||||||||||||||||||||
| Net income | — | — | — | — | — | — | 3,963 | — | — | 3,963 | ||||||||||||||||||||||||||||||||||||||||||||||||||||
| Other comprehensive income, net of tax effect: | ||||||||||||||||||||||||||||||||||||||||||||||||||||||||||||||
Changes in net unrealized gains on available- for-sale securities (net of taxes of $2) | — | — | — | — | — | — | — | 10 | — | 10 | ||||||||||||||||||||||||||||||||||||||||||||||||||||
Reclassification adjustment for gains included in net income (net of taxes of $1) | — | — | — | — | — | — | — | 6 | — | 6 | ||||||||||||||||||||||||||||||||||||||||||||||||||||
Other (net of taxes of $1) | — | — | — | — | — | — | — | (2) | — | (2) | ||||||||||||||||||||||||||||||||||||||||||||||||||||
| Total comprehensive income | 3,977 | |||||||||||||||||||||||||||||||||||||||||||||||||||||||||||||
| Balance as of September 30, 2019 | 1 | 556 | 1,158 | $ | 120,836 | $ | 19,130 | $ | 687 | $ | (123,141) | $ | 230 | $ | (7,400) | $ | 10,342 | |||||||||||||||||||||||||||||||||||||||||||||
| Fannie Mae Stockholders’ Equity (Deficit) | ||||||||||||||||||||||||||||||||||||||||||||||||||||||||||||||
| Shares Outstanding | Senior Preferred Stock | Preferred Stock | Common Stock | Accumulated Deficit | Accumulated Other Comprehensive Income | Treasury Stock | Total Equity | |||||||||||||||||||||||||||||||||||||||||||||||||||||||
| Senior Preferred | Preferred | Common | ||||||||||||||||||||||||||||||||||||||||||||||||||||||||||||
| Balance as of December 31, 2018 | 1 | 556 | 1,158 | $ | 120,836 | $ | 19,130 | $ | 687 | $ | (127,335) | $ | 322 | $ | (7,400) | $ | 6,240 | |||||||||||||||||||||||||||||||||||||||||||||
| Senior preferred stock dividends paid | — | — | — | — | — | — | (5,601) | — | — | (5,601) | ||||||||||||||||||||||||||||||||||||||||||||||||||||
| Comprehensive income: | ||||||||||||||||||||||||||||||||||||||||||||||||||||||||||||||
| Net income | — | — | — | — | — | — | 9,795 | — | — | 9,795 | ||||||||||||||||||||||||||||||||||||||||||||||||||||
| Other comprehensive income, net of tax effect: | ||||||||||||||||||||||||||||||||||||||||||||||||||||||||||||||
Changes in net unrealized gains on available- for-sale securities (net of taxes of $7) | — | — | — | — | — | — | — | 27 | — | 27 | ||||||||||||||||||||||||||||||||||||||||||||||||||||
Reclassification adjustment for gains included in net income (net of taxes of $30) | — | — | — | — | — | — | — | (112) | — | (112) | ||||||||||||||||||||||||||||||||||||||||||||||||||||
Other (net of taxes of $2) | — | — | — | — | — | — | — | (7) | — | (7) | ||||||||||||||||||||||||||||||||||||||||||||||||||||
| Total comprehensive income | 9,703 | |||||||||||||||||||||||||||||||||||||||||||||||||||||||||||||
| Balance as of September 30, 2019 | 1 | 556 | 1,158 | $ | 120,836 | $ | 19,130 | $ | 687 | $ | (123,141) | $ | 230 | $ | (7,400) | $ | 10,342 | |||||||||||||||||||||||||||||||||||||||||||||
See Notes to Condensed Consolidated Financial Statements in the Third Quarter 2020 Form 10-Q
| Third Quarter 2020 Results | 15 | |||||||