Attached files
| file | filename |
|---|---|
| EX-99.1 - EXHIBIT 99.1 - CURTISS WRIGHT CORP | a52315870ex99_1.htm |
| 8-K - CURTISS-WRIGHT CORPORATION 8-K - CURTISS WRIGHT CORP | a52315870.htm |
Exhibit 99.2

Q3 2020 Earnings Conference CallOctober 29, 2020 NYSE: CW Listen-Only dial-in numbers:(844) 220-4970
(domestic)(262) 558-6349 (international)Conference ID: 8071759

Safe Harbor Statement Please note that the information provided in this presentation is accurate as of
the date of the original presentation. The presentation will remain posted on this website from one to twelve months following the initial presentation, but content will not be updated to reflect new information that may become available after
the original presentation posting. The presentation contains forward-looking statements within the meaning of Section 27A of the Securities Act of 1933, as amended ("Securities Act"), Section 21E of the Securities Exchange Act of 1934, as
amended ("Exchange Act"), and the Private Securities Litigation Reform Act of 1995. Such forward-looking statements only speak as of the date of this report and Curtiss-Wright Corporation assumes no obligation to update the information included
in this report. Such forward-looking statements include, among other things, management's estimates of future performance, revenue and earnings, our management's growth objectives, our management’s ability to integrate our acquisition, and our
management's ability to produce consistent operating improvements. These forward-looking statements are based on expectations as of the time the statements were made only, and are subject to a number of risks and uncertainties which could cause
us to fail to achieve our then-current financial projections and other expectations, including the impact of a global pandemic or national epidemic. Any references to organic growth exclude the effects of restructuring costs, foreign currency
fluctuations, acquisitions and divestitures, unless otherwise noted. This presentation also includes certain non-GAAP financial measures with reconciliations to GAAP financial measures being made available in the earnings release that is posted
to our website and furnished with the SEC. We undertake no duty to update this information. More information about potential factors that could affect our business and financial results is included in our filings with the Securities and
Exchange Commission, including our Annual Reports on Form 10-K and Quarterly Reports on Form 10-Q, including, among other sections, under the captions, "Risk Factors" and "Management's Discussion and Analysis of Financial Condition and Results
of Operations," which is on file with the SEC and available at the SEC's website at www.sec.gov.
Agenda Review of Q3 2020 Performance Updated Full-Year 2020 Financial Outlook and
AssumptionsRestructuring Commercial Aerospace BusinessExecuting on Balanced Capital Allocation StrategyPacStar AcquisitionNew Share Repurchase AuthorizationStrengths of Curtiss-Wright’s Defense Businesses

Notes: 2020 Adjusted results exclude restructuring costs, one-time inventory step-up, backlog
amortization and transaction costs for current and prior year acquisitions, and one-time transition and IT security costs associated with the relocation of our DRG business. 2020 Adjusted Free Cash Flow excludes a voluntary contribution to the
Company’s corporate defined benefit pension plan, the cash impact from restructuring, and a capital investment related to construction of a new, state-of-the-art naval facility for the DRG business (Power segment). Third Quarter 2020 Business
Review and Financial Highlights Net Sales of $572 million, down 7% Solid defense market growth, up 11%, aided by acquisitions and timing of naval productionReduced demand across all commercial markets, as expectedAdjusted Operating Income of
$100 million, down 7%Principally due to lower sales and reduced profitability in C/I segmentAdjusted Operating Margin flat at 17.4%Benefits of ongoing cost containment actions and restructuring savings in all segmentsAdjusted Diluted EPS of
$1.85, down 5%Adjusted FCF of $55 million, down 48%; Year-to-date Adjusted FCF up 12% to $138MAnnounced acquisition of Pacific Star Communications, Inc. (PacStar) for $400 million cash

Third Quarter 2020 End Market Sales Growth Notes: Percentages in chart relate to Third Quarter 2020
sales compared to the prior year quarter. Amounts may not add due to rounding. Q3’20Change % of Total Sales Aero Defense 10% 21% Ground Defense (8%) 4% Naval Defense 15% 29% Total Defense 11% 54% Commercial Aero
(35%) 12% Power Generation (9%) 14% General Industrial (20%) 20% Total Commercial (22%) 46% Total Curtiss-Wright (7%) 100% Commercial Markets:Commercial Aerospace: Lower sales of equipment and surface treatment services
across all major OEM platforms Power Generation: Lower domestic and international aftermarket revenues, part. offset by higher CAP1000 program revenuesGeneral Industrial: Reduced demand across all categories of industrial products and surface
treatment services Key DriversDefense Markets:Aerospace Defense: Higher sales of actuation and sensors equipment on fighter jets (JSF) and defense electronics revenues on UAV programs Ground Defense: Lower TDSS revenues on Int’l tank
platformsNaval Defense: Higher revenues on Virginia class and Columbia class submarine programs and contribution from 901D acquisition; Partially offset by lower service center revenues

Third Quarter 2020 Adjusted Operating Income / Margin Drivers ($ in millions) Q3’20 Adjusted(1) Q3’19
Adjusted(1) Chg vs. Q3’19 Key Drivers Commercial / IndustrialMargin $32.5 14.6% $43.6 15.6% (25%) (100 bps) Lower sales / unfavorable absorption in comm’l marketsPartially offset by benefits of cost containment / restructuring
savings DefenseMargin 45.2 25.0% 40.9 25.4% 11%(40 bps) Contribution from 901D acquisition (naval defense)Benefit of restructuring savingsMargins impacted by unfavorable mix on solid defense revenues PowerMargin 29.9 17.7% 29.8
17.0% 0% 70 bps Benefits of cost containment / restructuring savingsPartially offset by unfavorable absorption on lower aftermarket power generation revenues Total SegmentsAdjusted Operating Income $107.6 $114.3 (6%) Corp &
Other ($7.8) ($7.1) (10%) Total CW Adjusted Op IncomeMargin $99.9 17.4% $107.2 17.4% (7%)0 bps Notes: Amounts may not add down due to rounding. Adjusted operating income and operating margin exclude restructuring costs, one-time
inventory step-up, backlog amortization and transaction costs for current and prior year acquisitions, and one-time transition and IT security costs associated with the relocation of our DRG business.

2020E End Market Sales Growth (Guidance as of October 28, 2020) 2020E(Prior) 2020E(Current) 2020E %
Total Sales Key Drivers Aero Defense 4% - 6% 8% - 10% 19% Favorable growth on key platforms (esp. F-35) Ground Defense (5% - 7%) (5% - 7%) 4% Lower sales on international ground platforms Naval Defense 14% - 16% 17% -
19% 28% Strong growth on submarines and aircraft carriersContribution from 901D acquisition Total Defense 8% - 10% 11% - 13% 51% Maintain healthy organic growth, Up 7% - 9% Commercial Aero (19% - 21%) (22% - 24%) 14% Widespread
reduction in OEM production rates Power Generation (3% - 5%) (8% - 10%) 15% Lower Int’l aftermarket sales (U.S. market relatively flat)Push out of CAP1000 revenues General Industrial (18% - 20%) (18% - 20%) 20% Reduced demand in all
major categories (most notably industrial valves and vehicles) Total Commercial (14% - 16%) (16% - 18%) 49% Total Curtiss-Wright (4% - 6%) (4% - 5%) 100% Updated
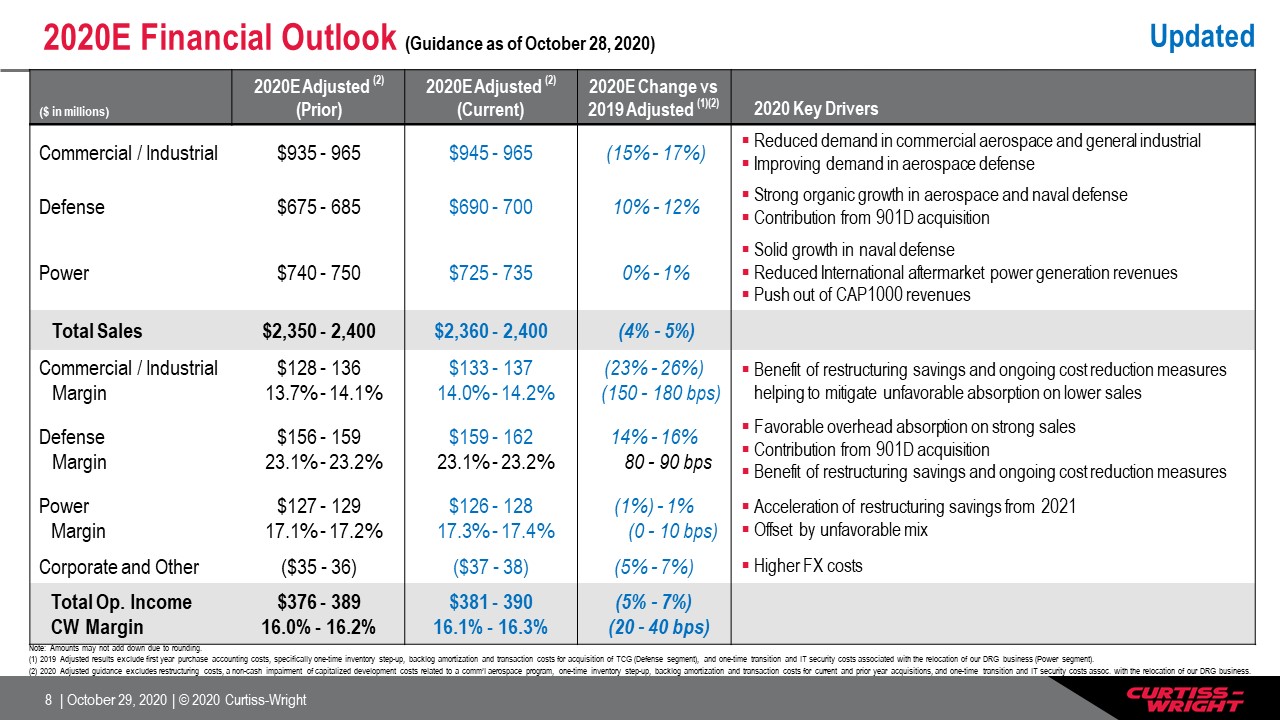
Note: Amounts may not add down due to rounding. (1) 2019 Adjusted results exclude first year purchase
accounting costs, specifically one-time inventory step-up, backlog amortization and transaction costs for acquisition of TCG (Defense segment), and one-time transition and IT security costs associated with the relocation of our DRG business
(Power segment).(2) 2020 Adjusted guidance excludes restructuring costs, a non-cash impairment of capitalized development costs related to a comm’l aerospace program, one-time inventory step-up, backlog amortization and transaction costs for
current and prior year acquisitions, and one-time transition and IT security costs assoc. with the relocation of our DRG business. ($ in millions) 2020E Adjusted (2)(Prior) 2020E Adjusted (2)(Current) 2020E Change vs 2019 Adjusted
(1)(2) 2020 Key Drivers Commercial / Industrial $935 - 965 $945 - 965 (15% - 17%) Reduced demand in commercial aerospace and general industrialImproving demand in aerospace defense Defense $675 - 685 $690 - 700 10% - 12% Strong
organic growth in aerospace and naval defenseContribution from 901D acquisition Power $740 - 750 $725 - 735 0% - 1% Solid growth in naval defense Reduced International aftermarket power generation revenuesPush out of CAP1000
revenues Total Sales $2,350 - 2,400 $2,360 - 2,400 (4% - 5%) Commercial / IndustrialMargin $128 - 136 13.7% - 14.1% $133 - 137 14.0% - 14.2% (23% - 26%) (150 - 180 bps) Benefit of restructuring savings and ongoing cost reduction
measures helping to mitigate unfavorable absorption on lower sales DefenseMargin $156 - 159 23.1% - 23.2% $159 - 162 23.1% - 23.2% 14% - 16% 80 - 90 bps Favorable overhead absorption on strong salesContribution from 901D acquisition
Benefit of restructuring savings and ongoing cost reduction measures PowerMargin $127 - 129 17.1% - 17.2% $126 - 128 17.3% - 17.4% (1%) - 1% (0 - 10 bps) Acceleration of restructuring savings from 2021Offset by unfavorable mix Corporate
and Other ($35 - 36) ($37 - 38) (5% - 7%) Higher FX costs Total Op. IncomeCW Margin $376 - 38916.0% - 16.2% $381 - 39016.1% - 16.3% (5% - 7%) (20 - 40 bps) 2020E Financial Outlook (Guidance as of October 28, 2020) Updated

2020E Financial Outlook (Guidance as of October 28, 2020) ($ in millions, except EPS) 2020E Adjusted
(3)(Prior) 2020E Adjusted (3)(Current) 2020E Change vs 2019 Adjusted (2)(3) 2020 Key Drivers Total Operating Income $376 - 389 $381 - 390 (5% - 7%) Other Income/(Expense) $23 - 24 $22 Lower interest income Interest
Expense ($35 - 36) ($35 - 36) Effective Tax Rate ~23.5% ~23.5% Diluted EPS $6.60 - 6.85 $6.70 - 6.85 (6% - 8%) Raised bottom end of range by $0.10 Diluted Shares Outstanding 42.1 42.1 Includes $200M in share
repurchase Free Cash Flow(1) $350 - 380 $350 - 380 ~ Flat Strong working capital management Free Cash Flow Conversion(1) ~130% ~130% Capital Expenditures $40 - 50 $40 - 50 Depreciation & Amortization $110 - 120 $110 -
120 (1) Free Cash Flow is defined as cash flow from operations less capital expenditures. FCF Conversion is calculated as free cash flow divided by net earnings from continuing operations. Adjusted FCF Conversion is calculated as adjusted
free cash flow divided by adjusted net earnings.(2) 2019 Adjusted results exclude first year purchase accounting costs, specifically one-time inventory step-up, backlog amortization and transaction costs for acquisition of TCG (Defense
segment), and one-time transition and IT security costs associated with the relocation of our DRG business (Power segment). 2019 Adjusted Free Cash Flow excludes a $19 million capital investment related to construction of a new,
state-of-the-art naval facility for the DRG business (Power segment).(3) 2020 Adjusted guidance excludes restructuring costs, a non-cash impairment of capitalized development costs related to a comm’l aerospace program, one-time inventory
step-up, backlog amortization and transaction costs for current and prior year acquisitions, and one-time transition and IT security costs assoc. with the relocation of our DRG business. 2020 Adjusted Free Cash Flow guidance excludes a
voluntary contribution to the Company’s corporate defined benefit pension plan of $150 million, a $20 million cash impact from restructuring, and a $13 million capital investment related to construction of a new, state-of-the-art naval facility
for the DRG business (Power segment). Updated

Restructuring Commercial Aerospace Business Strategic management decision to lessen exposure to legacy
aerospace equipmentRestructuring actuation business supporting Boeing 737 MAX programExiting historically low-margin (dilutive) and commodity-type build-to-print workReducing manufacturing footprint Closing Queretaro, Mexico facilityNear-term
financial impactsNegotiated substantially higher margin on 2019 contract, in anticipation of potential non-renewal beyond 2020FY’21 impact to sales ($70 million) and EPS (~$0.30) Adjusted financials will be restated with issuance of Feb. 2021
guidanceLong-term benefits to Curtiss-WrightDecision supports Curtiss-Wright’s objectives for long-term, profitable growth and top quartile performanceExpect C/I segment to demonstrate future margin expansion, despite elimination of actuation
contracts

Balanced Capital Allocation Strategy: PacStar Acquisition Announced acquisition of PacStar on Sept. 24,
2020Deal expected to close in 4th quarterBenefits of PacStar acquisitionLeading Defense industry supplier of secure tactical communications solutions (hardware + software) for battlefield network managementExhibiting sustainable high
single-digit revenue growth driven by high profile program winsOpportunity to integrate CW’s intra-platform COTS technologies with PacStar’s inter-platform networking connectivityAligned with DoD priorities:Driving “Battlefield of the Future”
through enhanced situational awarenessArmy’s tactical network modernization plan supports continuous network upgrades Expected to contribute to CW’s overall operating margin target of 17% over time PacStar Purchase Price $400M
(cash) EBITDA Multiple(1) ~12x NTM 2020 Sales >$120M Adjusted Operating Margin Dilutive to Overall CW in Year One(2) Adjusted EPS Impact Expected to be Accretive to 2021 Adj. EPS(2) Free Cash Flow Impact Expected to generate
>100% FCF Conv. EBITDA defined as Earnings before Interest, Tax, Depreciation and Amortization Excludes impact of first-year purchase accounting costs, including backlog amortization and transaction costs

Balanced Capital Allocation Strategy Consistent Return to Shareholders(1) Returned more than $1.1
Billion since beginning of 2014Board of Directors granted $200 Million increase in repurchase authorization (now $250 Million)Expect to repurchase minimum of $50 Million opportunistically in Q4’20 ($ in millions) Capital ALLOCATION SINCE
2013(1) Pro Forma including PacStar and additional $50M share repurchase in Q4’20
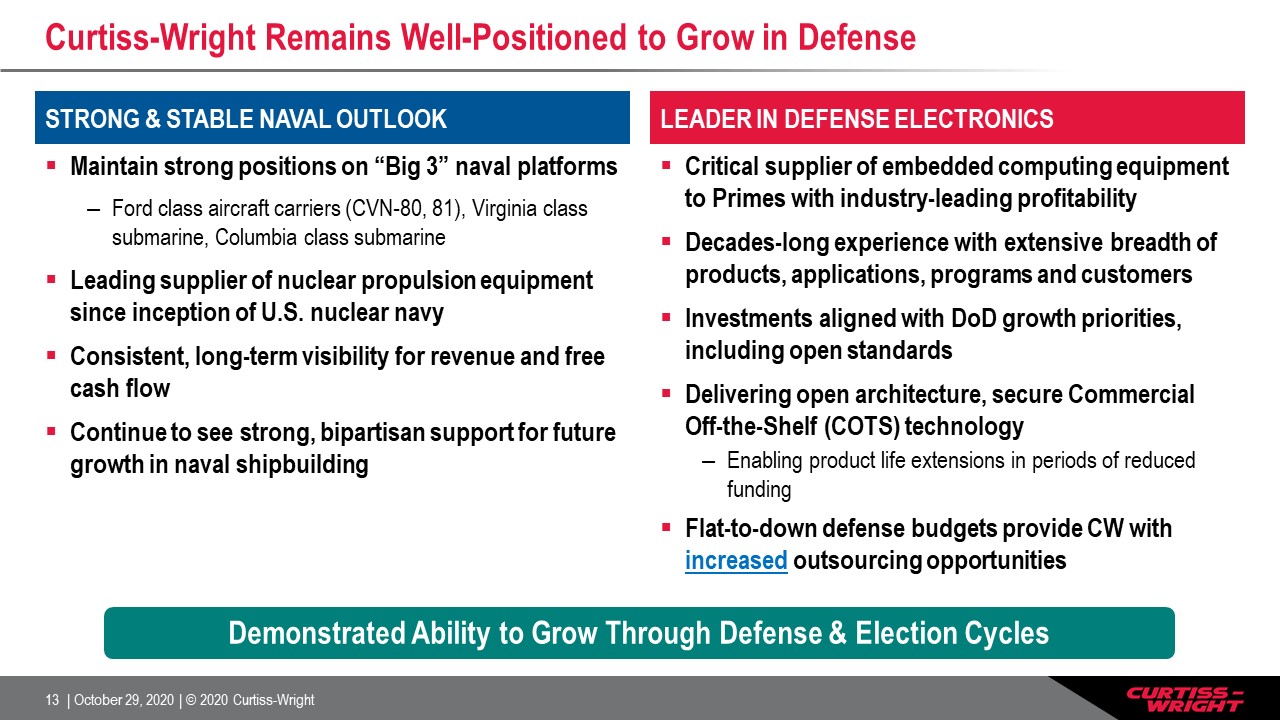
Curtiss-Wright Remains Well-Positioned to Grow in Defense Maintain strong positions on “Big 3” naval
platformsFord class aircraft carriers (CVN-80, 81), Virginia class submarine, Columbia class submarineLeading supplier of nuclear propulsion equipment since inception of U.S. nuclear navyConsistent, long-term visibility for revenue and free
cash flowContinue to see strong, bipartisan support for future growth in naval shipbuilding Critical supplier of embedded computing equipment to Primes with industry-leading profitabilityDecades-long experience with extensive breadth of
products, applications, programs and customersInvestments aligned with DoD growth priorities, including open standards Delivering open architecture, secure Commercial Off-the-Shelf (COTS) technologyEnabling product life extensions in periods of
reduced fundingFlat-to-down defense budgets provide CW with increased outsourcing opportunities Leader in DEFENSE ELECTRONICS Demonstrated Ability to Grow Through Defense & Election Cycles Strong & Stable naval outlook

2020 Summary and Expectations Maintain outlook for solid revenue growth in Defense, as Commercial
markets continue to reboundDefense acquisitions providing modest boost to top-lineAggressively driving improved profitability, despite global economic challengesBenefit of increased and accelerated cost containment measuresPlanned restructuring
actions to drive $40 Million in annualized savings; Benefit to 2020 and 2021Long-term goal: Maintain top quartile performance vs. peersStrong balance sheet and FCF outlook promote balanced capital allocation strategy Curtiss-Wright remains
well-positioned for profitable growth

Appendix Non-GAAP Financial Results The company reports its financial performance in accordance with
accounting principles generally accepted in the United States of America ("GAAP"). This press release refers to "Adjusted" amounts, which are Non-GAAP financial measures described below. We utilize a number of different financial measures in
analyzing and assessing the overall performance of our business, and in making operating decisions, forecasting and planning for future periods. We consider the use of the non-GAAP measures to be helpful in assessing the performance of the
ongoing operation of our business. We believe that disclosing non-GAAP financial measures provides useful supplemental data that, while not a substitute for financial measures prepared in accordance with GAAP, allows for greater transparency in
the review of our financial and operational performance. The Company’s presentation of its financials and guidance includes an Adjusted (non-GAAP) view that excludes significant restructuring costs in 2020 associated with its operations,
including one-time actions taken in response to COVID-19, a non-cash impairment of capitalized development costs related to a commercial aerospace program, first year purchase accounting costs associated with its acquisitions, as well as
one-time transition and IT security costs, and capital investments, specifically associated with the relocation of the DRG business in the Power segment. Transition costs include relocation of employees and equipment as well as overlapping
facility and labor costs associated with the relocation. We believe this Adjusted view will provide improved transparency to the investment community in order to better measure Curtiss-Wright’s ongoing operating and financial performance and
better comparisons of our key financial metrics to our peers. Reconciliations of “Reported” GAAP amounts to “Adjusted” non-GAAP amounts are furnished with this presentation. All per share amounts are reported on a diluted basis. The following
definitions are provided: Adjusted Operating Income, Operating Margin, Net Earnings and Diluted EPSThese Adjusted financials are defined as Reported Operating Income, Operating Margin, Net Earnings and Diluted EPS under GAAP excluding: (i) the
impact of first year purchase accounting costs associated with acquisitions for current and prior year periods, specifically one-time inventory step-up, backlog amortization and transaction costs; (ii) one-time transition and IT security costs
associated with the relocation of a business in the current year period; (iii) the non-cash impairment of capitalized development costs related to a commercial aerospace program; and (iv) significant restructuring costs in 2020 associated with
its operations.Free Cash Flow and Free Cash Flow ConversionThe Corporation discloses free cash flow because it measures cash flow available for investing and financing activities. Free cash flow represents cash available to repay outstanding
debt, invest in the business, acquire businesses, return capital to shareholders and make other strategic investments. Free cash flow is defined as cash flow provided by operating activities less capital expenditures. Adjusted free cash flow
excludes: (i) a capital investment in the Power segment related to the new, state-of-the-art naval facility principally for DRG; (ii) voluntary contribution to the Company’s corporate defined benefit pension plan made in the first quarter of
2020; and (iii) the cash impact from restructuring in 2020. The Corporation discloses free cash flow conversion because it measures the proportion of net earnings converted into free cash flow and is defined as free cash flow divided by net
earnings from continuing operations. Adjusted free cash flow conversion is defined as Adjusted free cash flow divided by Adjusted net earnings.

FY2020E Guidance: Sales Waterfall (as of October 28, 2020) Guidance:Overall DOWN 4 - 5%Defense Markets
UP 11 - 13%Comm’l Markets DOWN 16 - 18% Non-Nuclear:Fossil power gen equipment; Surface Technologies services (peening/coatings) Industrial Pumps & Valves:65% O&G, 35% Chem/Petro(All Downstream)75% MRO, 25% Projects90% Valves, 10%
Pumps Industrial Vehicles:“Own the Cab” strategy45% On-highway,(Class 8 <2% total CW sales)55% Off-Highway Industrial Controls:Medical Mobility; Sensors & Controls; Industrial Automation equipment Ground:50% US platforms 50% Int’l
platforms (incl. TDSS) Commercial Aero:~90% Comm’l OEMPrimarily narrow-body jets

Non-GAAP Reconciliation – 2020 vs. 2019 (Adjusted)

Non-GAAP Reconciliations – Q3 2020 Results (In millions, except EPS) Q3-2020 Q3-2019
Change Sales $ 571.6 $ 614.9 (7%) Reported operating income (GAAP) $ 84.6 $ 105.6 (20%) Adjustments (1) 15.3 1.6 Adjusted operating income (Non-GAAP) $ 99.9 $ 107.2 (7%) Adjusted operating margin (Non-GAAP)
17.4% 17.4% 0 bps Reported net earnings (GAAP) $ 64.6 $ 82.5 (22%) Adjustments, net of tax (1) 12.8 1.3 Adjusted net earnings (Non-GAAP) $ 77.4 $ 83.8 (8%) Reported diluted EPS (GAAP) $ 1.55 $ 1.92 (19%) Adjustments, net
of tax (1) 0.30 0.03 Adjusted diluted EPS (Non-GAAP) $ 1.85 $ 1.95 (5%) Adjusted operating income, operating margin, net earnings and diluted EPS results exclude restructuring costs of $11 million, one-time inventory step-up, backlog
amortization and transaction costs for current and prior year acquisitions, and one-time transition and IT security costs associated with the relocation of our DRG business.
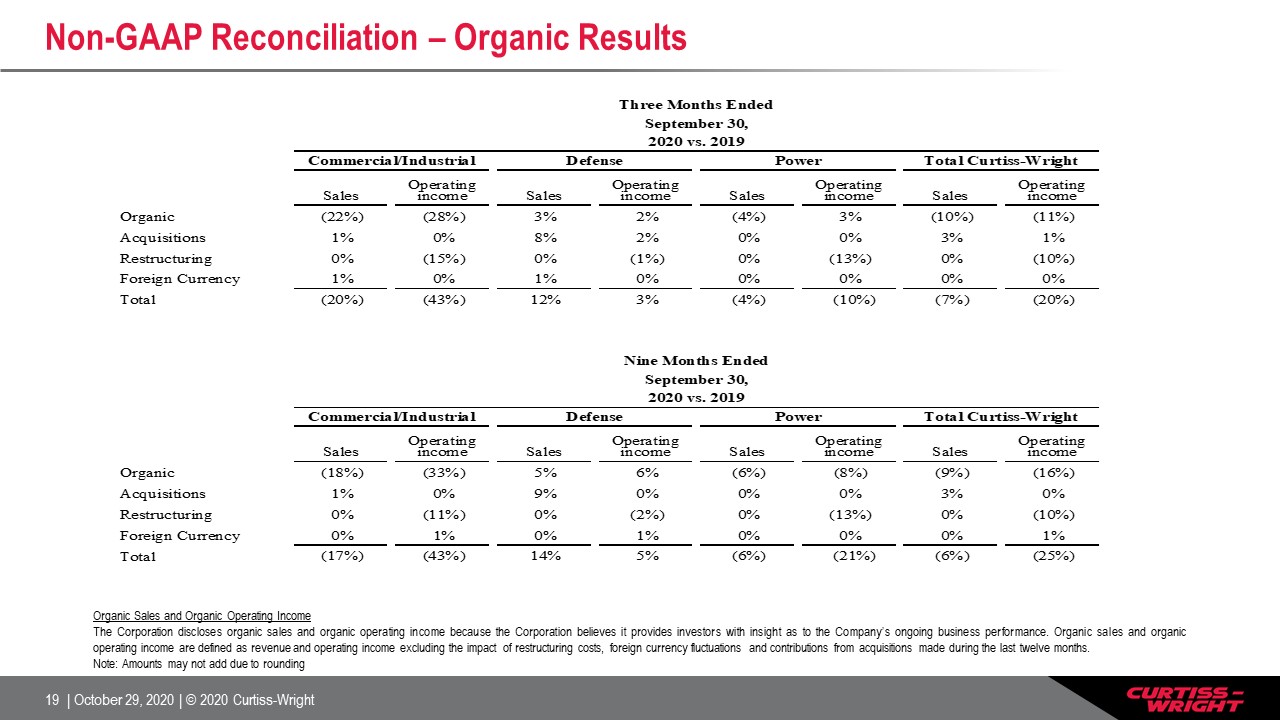
Non-GAAP Reconciliation – Organic Results Organic Sales and Organic Operating IncomeThe Corporation
discloses organic sales and organic operating income because the Corporation believes it provides investors with insight as to the Company’s ongoing business performance. Organic sales and organic operating income are defined as revenue and
operating income excluding the impact of restructuring costs, foreign currency fluctuations and contributions from acquisitions made during the last twelve months.Note: Amounts may not add due to rounding