Attached files
| file | filename |
|---|---|
| EX-99.2 - EX-99.2 - CARVANA CO. | ex992q32020.htm |
| 8-K - 8-K - CARVANA CO. | cvna-20201029.htm |
Exhibit 99.1
Dear Shareholders,
The third quarter was an exceptional quarter for Carvana. We hit several significant operational and financial milestones including buying more cars from our customers than we sold, crossing $4,000 in GPU, and achieving our first EBITDA positive quarter.
These are important milestones, and they carry important meaning.
Buying more cars from our customers than we sold to them just 2 years after focusing on the opportunity demonstrates the appeal of our customer experience, the scrappiness of our team, the quality of our brand, and the scalability of our infrastructure. It also feeds back into our retail offering by supplying us with a highly scalable channel of extremely diverse and desirable inventory.
Crossing $4,000 GPU and achieving our first EBITDA positive quarter demonstrate the power of our financial model as we march toward our long-term goals.
Customer preference shifts and our team’s continued execution in 2020 bode very well for our long-term opportunity. Looking forward, our focus will remain exactly where it has been: on our customers, on our team, and on our execution. We are firmly on the path to changing the way people buy cars, to delivering 2 million+ cars per year, and to becoming the largest and most profitable automotive retailer.
Summary of Q3 2020 Results
All financial comparisons stated below are versus Q3 2019, unless otherwise noted. Complete financial tables appear at the end of this letter.
Q3 2020 Financial Results:
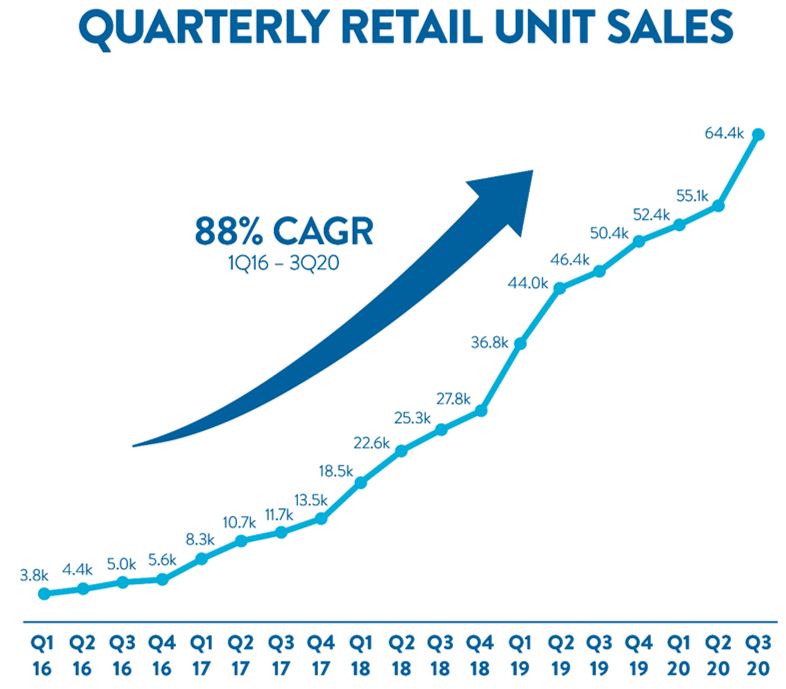
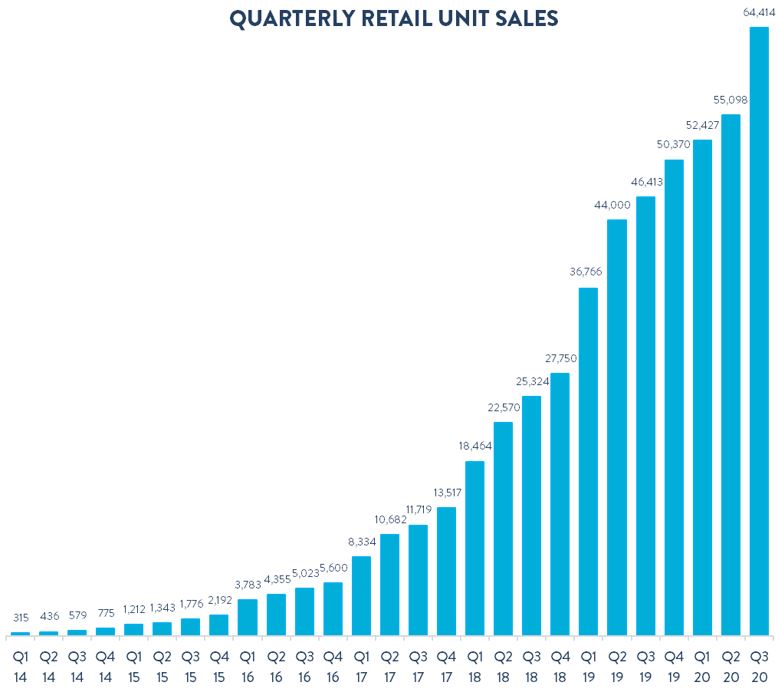
•Retail units sold totaled 64,414, an increase of 39%
•Revenue totaled $1.544 billion, an increase of 41%
•Total gross profit was $261 million, an increase of 90%
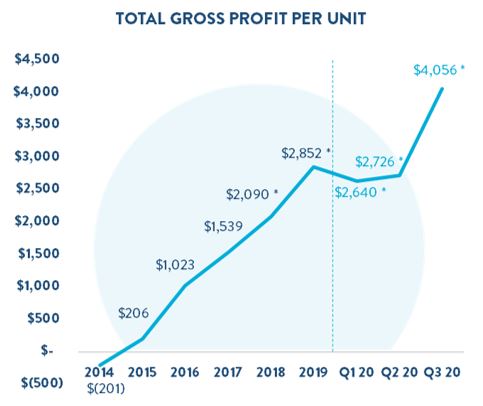
•Total gross profit per unit (GPU) was $4,056, an increase of $1,0931
•Net loss was $18 million, an improvement from $92 million
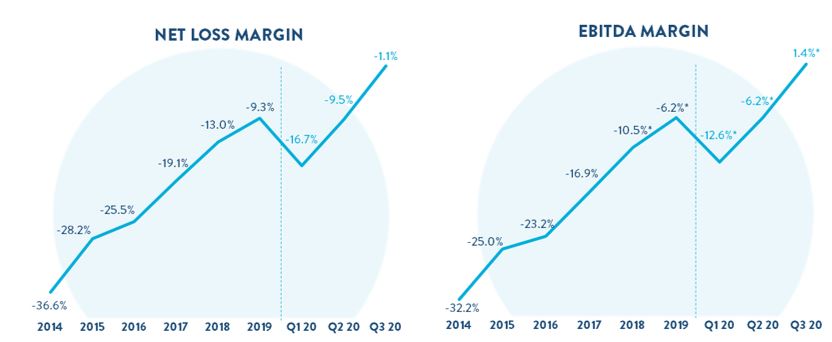
•EBITDA margin was 1.4%, an improvement from (5.5%)2
•Basic and diluted net loss, per Class A share was $0.10 based on 70.0 million shares of Class A common stock outstanding
Q3 2020 Other Results:
•Opened our 9th inspection and reconditioning center (IRC) near Columbus, Ohio
•Opened one vending machine in Louisville, Kentucky, bringing our end-of-quarter total to 25
•Increased our March 2020 forward flow agreement with Ally to a total purchase commitment of $3 billion
Recent Events
We would also like highlight the following recent accomplishments:
•Opened our 10th IRC near Orlando, Florida
•Opened our 26th vending machine near Detroit, Michigan
•Increased our floor plan facility with Ally to $1.25 billion from $950 million and extended its maturity through March 2023
•Closed a $1.1 billion senior notes offering ($500 million 5.625% Senior Notes due 2025 and $600 million 5.875% Senior Notes due 2028) and redeemed $600 million 8.875% Senior Notes due 2023
1 Includes a $0 and $33 impact for the current and prior year period, respectively from the 100k Milestone Gift.
2 Includes a 0.0% and 0.4% impact for the current and prior year period, respectively from the 100k Milestone Gift.
1
Outlook
In light of the uncertainty surrounding COVID-19 and its economic repercussions we are not providing guidance at this time. Instead, we are providing directional color.
Following our significant progress on production capacity, GPU, and EBITDA margin this quarter, we are positioning the business for strong growth in 2021.
In the fourth quarter, we expect seasonal patterns across major line items to be similar to past years, with a few adjustments noted below.
First, we have elected not to run our usual Cyber Monday promotion this year as we continue to focus on building inventory. As a result, we expect retail unit growth to face a headwind around the time of Cyber Monday and a tailwind as we continue building selection on the website. Over the course of the third quarter we significantly grew the number of vehicles available for immediate purchase, but ended the quarter at just half the level we had prior to the pandemic. During the fourth quarter we expect to make significant additional progress in growing our inventory.
Second, we expect the market to transition to a more normalized depreciation environment in Q4 accentuating normal seasonal trends in wholesale GPU.
Lastly, we expect Retail GPU to have a seasonal change that more closely resembles 2018, as Q4 2019 was impacted by early iterations in our customer-sourced bidding and pricing that offset a normal seasonal shape.
For more information regarding the non-GAAP financial measures discussed in this letter, please see the reconciliations of our non-GAAP measurements to their most directly comparable GAAP-based financial measurements included at the end of this letter.
2
Clear Progress Toward Our Long-Term Goals
Our management team has always focused on delivering an exceptional and unparalleled customer experience while simultaneously growing the business rapidly and achieving our financial objectives. To realize our long-term vision, our three primary financial objectives are: (1) Grow Retail Units and Revenue; (2) Increase Total Gross Profit Per Unit; and, (3) Demonstrate Operating Leverage.
At our Analyst Day in November 2018, we laid out our long-term goals of selling 2 million+ units per year and achieving 15% to 19% gross margin, 6% to 8% SG&A as a percent of revenue, and 8% to 13.5% EBITDA margin.
In only two years, we have made tremendous progress toward these goals.
That progress starts with growth, which is rooted in our industry leading customer experiences. Since Q3 2018, we have increased the number of cars we sold to customers 2.5x and increased the number of cars we bought from customers an incredible 8x.
Growth has been and will continue to be our first financial objective due to the enormous size of our opportunity and the significant positive feedback in our model. As we grow—by expanding geographically, building accumulated awareness, improving our customer experience, and broadening our customer offering—our business becomes stronger. Growth in customers allows us to hold more inventory, increasing selection and conversion. Growth allows us to add more IRCs, increasing the density of our logistics network and lowering average delivery times, which further increases conversion. Growth also enables economies of scale, creating value to further invest in the customer experience. All these dynamics create a flywheel that drives even more growth.
3
We have paired our rapid growth over the past several years with significant increases in gross margin, reaching the middle of our long-term target range in Q3. Our gains in gross margin have been broad-based, including buying more cars from customers, lowering average days to sale, and enhancing monetization of our finance platform and ancillary products. Despite all this progress, we still see significant opportunities for further gains, giving us the flexibility to either drive additional margin expansion or further enhance our customer offering.
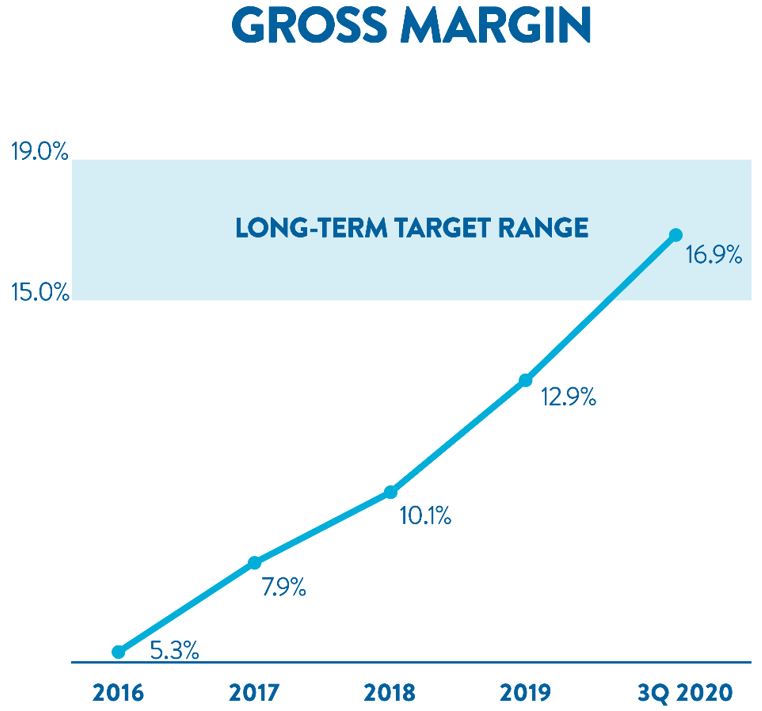
*2018, 2019, and Q3 2020 include a 0.2%, 0.1%, and 0.0% impact from the 100k Milestone Gift, respectively.
4
We have also paired our rapid growth with meaningful SG&A leverage. Our progress on SG&A has come while making significant investments to support our continued growth, building an industry-leading supply chain, and continually improving the customer experience.
In 2019, for example, we made the decision to invest meaningfully in building our offering of buying cars from customers, and those investments are paying significant dividends today. In Q3, we sourced 56% of the cars we retailed from customers which exceeded the top end of our long-term target range of sourcing 38% to 52%.
We expect to make similar investments in the future when we believe they serve our long-term goals, while demonstrating SG&A leverage as we continue to scale.
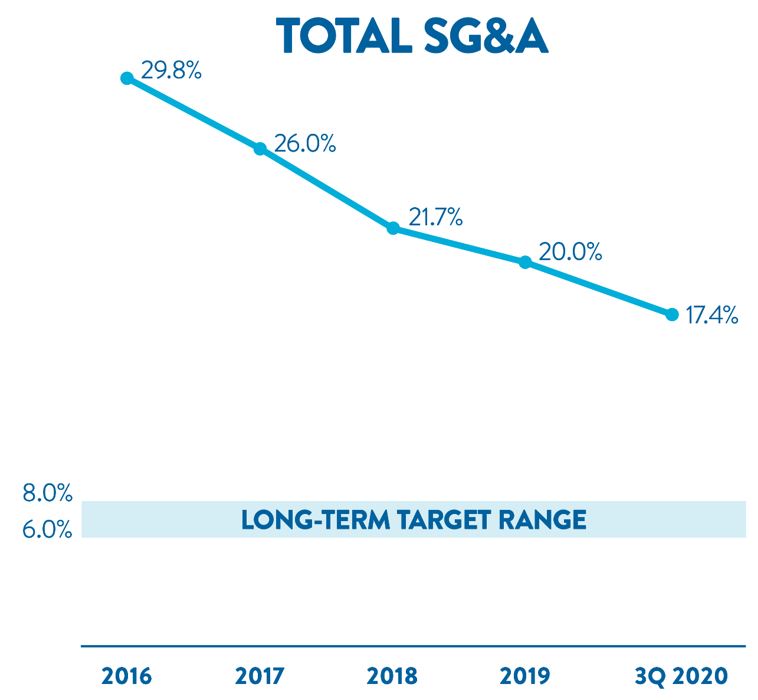
*2018, 2019, and Q3 2020 include a 0.4%, 0.2%, and 0.0% impact from the 100k Milestone Gift, respectively.
5
Our progress on our three key financial objectives led to our first EBITDA positive quarter in Q3, a significant milestone on the path toward building the largest and most profitable auto retailer. We are excited about this achievement, what it means for our trajectory, and what it says about the quality of our business model and team.
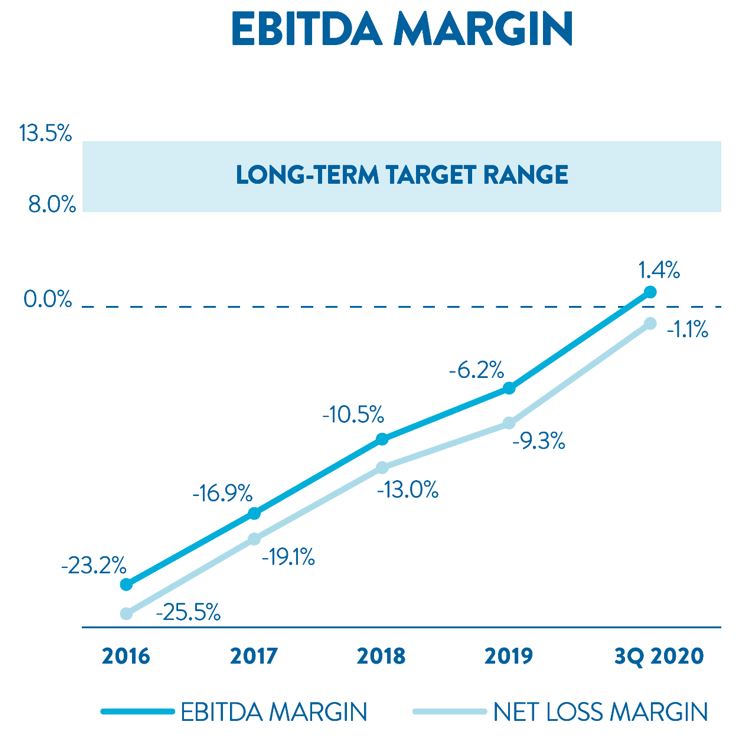
*2018, 2019, and Q3 2020 include a 0.6%, 0.4%, and 0.0% impact from the 100k Milestone Gift, respectively.
Our cohorts also demonstrate our progress toward profitability. In Q3, our five oldest cohorts were solidly EBITDA positive, with our two oldest cohorts approaching our long-term target EBITDA margin range. While our cohorts generally have similar gross margins, older cohorts have much lower SG&A as a percent of revenue due to lower advertising expenses as a percent of revenue, lower logistics expenses as a percent of revenue due to closer geographic proximity to existing IRCs, and greater scale.
Our progress over the past two years leaves us more excited than ever about our opportunity to change the way people buy cars.
We believe that our focus on growth should reflect the size of the opportunity in front of us as well as our operational and financial capacity to make the investments necessary to achieve that growth. Over the last nine months, customer preference migration, our team’s successful execution, and our financial strength bolster the argument for growth as our top priority. Looking forward, we expect to continue investing in growth while maintaining strong gross margins and demonstrating SG&A leverage.
6
Buying Cars from Customers
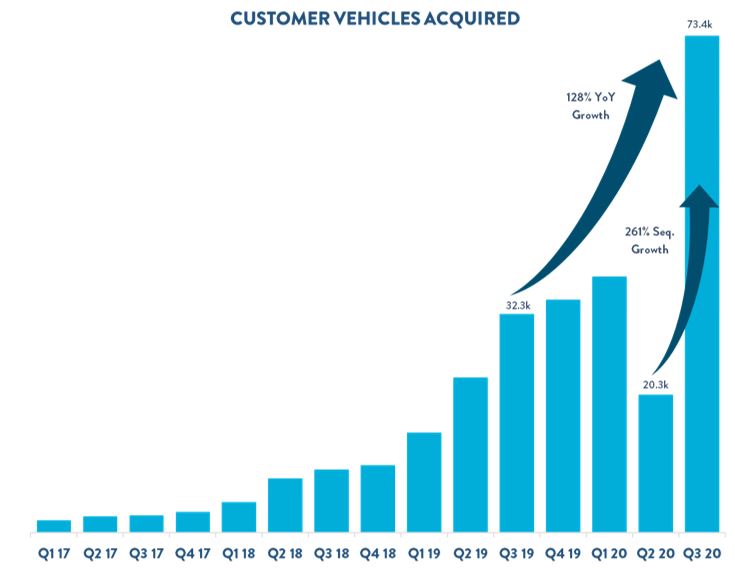
In Q3, for the first time in our history we bought more cars from our customers than we sold to them.
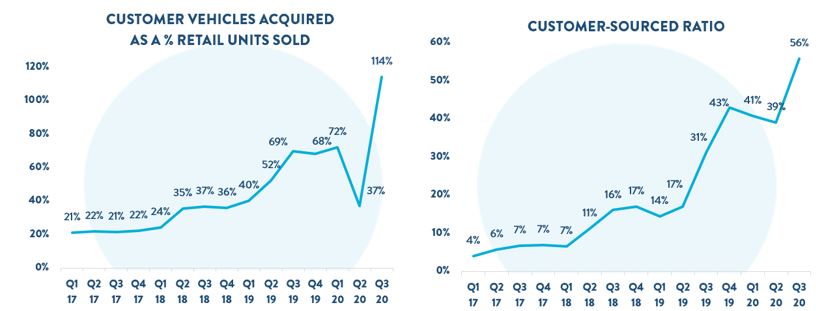
We acquired 73.4k vehicles from our customers, an increase of 128% year-over-year, which resulted in buying 114% as many cars as we sold, up from 69% a year ago. Two primary drivers powered this exceptional growth. The first was the unprecedented demand we saw after resuming purchasing vehicles from our customers in May. The second was our operating teams’ incredible response to this increase in demand. For perspective on the scale of the operational challenges our team overcame, we more than tripled the number of cars we bought from our customers quarter-over-quarter, reaching a level nearly double our previous high all while delivering to customers the best experience available when selling a car.
Our rapid acceleration in buying cars from customers fueled our inventory growth lifting our customer sourced retail units. In Q3, we sourced 56% of our retail units sold from customers, up from 31% a year ago. This number eclipsed the top end of the long-term target range of 38%-52% that we outlined at our analyst day just two years ago.
7
Expansion
The unprecedented demand that we’ve seen for buying and selling cars online has underscored the importance of our expansion strategy. We believe, now more than ever, in our approach of developing infrastructure well ahead of demand, and we remain committed to building out our IRC pipeline and logistics network capacity to meet future demand.
In Q3, we further demonstrated progress in this regard, opening our 9th inspection and reconditioning center (IRC) near Columbus, Ohio. Since quarter-end, we’ve opened our 10th IRC, also a four-line facility, near Orlando, Florida. Additionally, we expect to open our 11th IRC by year-end, increasing our annual production capacity to approximately 600k vehicles at full utilization.
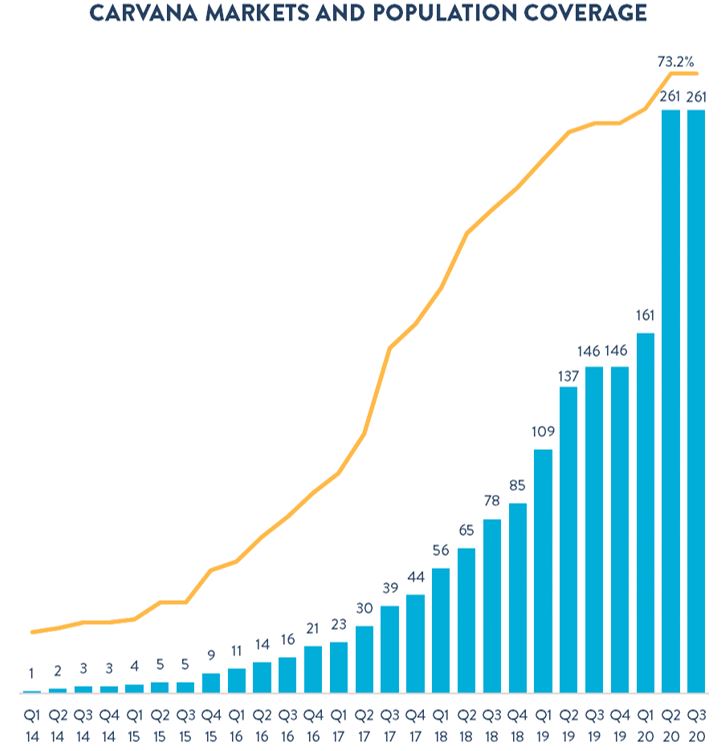
We now operate 26 vending machines and serve 261 markets covering 73.2% of the population. We will continue to open smaller markets to fill out our footprint in the immediate term. From there, our path to 95% population coverage will primarily involve balancing the benefits of serving a broader population with our goal to alleviate constraints in our supply chain.
8
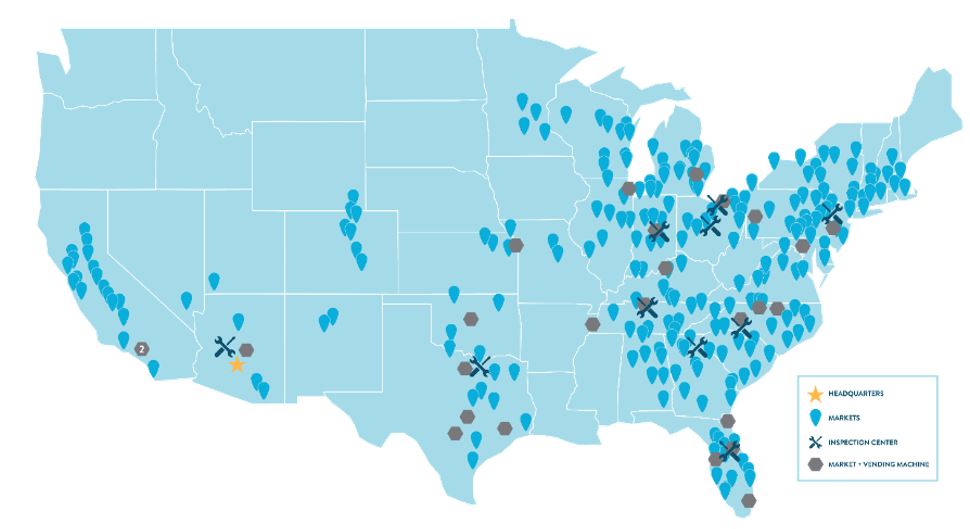
*Represents facilities and markets as of October 29, 2020
For a complete list of our market opening history, estimated populations, and estimated total industry used vehicle sales by market, along with details on our IRCs, please see: investors.carvana.com/resources/investor-materials.
9
Management Objectives
Our three primary financial objectives are: (1) Grow Retail Units and Revenue; (2) Increase Total Gross Profit Per Unit; and, (3) Demonstrate Operating Leverage. We believe continued focus on these goals will lead to a strong long-term financial model.
Below we present our long-term financial model that we introduced at our Analyst Day on November 29, 2018. We believe this is the appropriate frame through which to evaluate our results and progress towards each of our financial objectives.
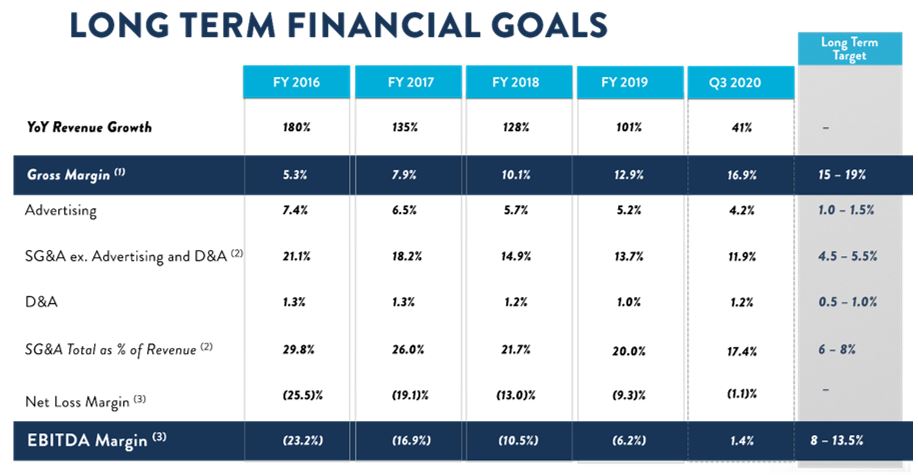
(1) Gift impact of 0.2%, 0.1%, and 0.0% in 2018, 2019, and Q3 2020, respectively.
(2) Gift impact of 0.4%, 0.2%, and 0.0% in 2018, 2019, and Q3 2020, respectively.
(3) Gift impact of 0.6%, 0.4%, and 0.0% in 2018, 2019, and Q3 2020, respectively.
Note: Numbers may not foot due to rounding.
10
Objective #1: Grow Retail Units and Revenue
Q3 2020 marked another quarter of strong year-over-year growth across retail units sold and revenue. For the quarter, retail units sold increased to 64,414, up 39% from 46,413 in Q3 2019. Q3 revenue grew to $1.544 billion, up 41% from $1.095 billion.
As in Q2, inventory constraints impacted growth in retail units sold, and we are continuing to focus on growing inventory to meet demand. We ended the quarter with 26,897 website units and 11,900 available for immediate purchase, up from 5,914 at the end of Q2 but still only half as many as pre-pandemic levels.
11
Objective #2: Increase Total Gross Profit Per Unit
Total GPU reached a record in Q3 at over $4,000, driving our gross margin to the midpoint of our long-term model. The year-over-year and sequential GPU growth was driven primarily by strength in Retail and Finance GPU.
For Q3 2020:
•Total
◦Total GPU was $4,056 vs. $2,963 in Q3 2019 and $2,726 in Q2 20203
•Retail
◦Retail GPU was $1,857 vs. $1,305 in Q3 2019 and $1,190 in Q2 20203
◦Year-over-year changes in retail vehicle GPU were primarily driven by more customer-sourced vehicles, which generally have higher margins. Sequential changes were primarily driven by more customer-sourced vehicles, a reduction in average days to sale to 58 from 89, and lower reconditioning costs per unit as production utilization normalized.
•Wholesale
◦Wholesale GPU was $266 vs. $120 in Q3 2019 and $137 in Q2 20203
◦Year-over-year changes in wholesale GPU were driven by record wholesale volume (units +31% YoY to 15,375) and record gross profit per wholesale unit sold of $1,113, an increase from $476 in Q3 2019. Increased wholesale volume came from the growth in vehicles purchased from customers, while gross profit per wholesale unit benefited from the strength in wholesale market values.
•Other
◦Other GPU was $1,934 vs. $1,539 in Q3 2019 and $1,399 in Q2 2020
◦Year-over-year changes in Other GPU were driven by higher finance GPU and increased attachment of VSC. Finance GPU was $1,415 in Q3 compared to $1,078 in Q3 2019 and $865 in Q2 2020. The YoY increase was primarily due to tightened credit standards and lower benchmark interest rates, while the sequential gain was also due to improved market conditions.
*2018, 2019, Q1 2020, Q2 2020, and Q3 2020 include a $43, $31, $10, $0, and $0 impact from the 100k Milestone Gift, respectively.
3 Total GPU includes a $0, $33, and $0 impact in Q3 2020, Q3 2019, and Q2 2020, respectively, from the 100k Milestone Gift. This includes a $0, $30, and $0 impact, respectively, in retail GPU, and a $0, $3, and $0 impact, respectively, in wholesale GPU.
12
Objective #3: Demonstrate Operating Leverage
We achieved positive EBITDA for the first time in Q3 driven by strong GPU performance along with continued SG&A leverage while resuming incremental investments required to prepare for another year of significant growth. Net loss margin levered by 7.3% to (1.1%) versus the prior year and EBITDA margin levered by 6.9% in Q3 to reach positive 1.4%.
For Q3 2020, as a percentage of revenue:
•Total SG&A levered by 1.6%, primarily reflecting benefits from scale and sustained cost efficiencies through the pandemic, moderated by investments to support the growth in the business into 2021.4
•Compensation and benefits levered by 0.6%, Advertising levered by 0.8%, Logistics and market occupancy were approximately flat, and Other SG&A levered by 0.2%
*2018, 2019, Q1 2020, Q2 2020, and Q3 2020 include a 0.6%, 0.4%, 0.0%, 0.0% and 0.0% impact from the 100k Milestone Gift, respectively.
4 Prior year period includes a 0.3% impact from the 100k Milestone Gift, contained within Compensation and Benefits.
13
Summary
In the third quarter we hit several significant milestones on the path to fulfilling our mission of changing the way people buy cars.
We achieved these milestones because of the quality of the team we get to work with every day, because of their obsession with our customer experience, and because of the foundation we have laid over the last 7 years as a result of our long-term focus.
We are in the best position we have ever been as a company.
Our offering has never been more appealing to car buyers and sellers. The path to our long-term financial model has never been more clearly visible. Our financial position has never been stronger. Our team has never been closer or more battle tested. And our ambition and focus on our customers have never wavered.
The march continues.
Sincerely,
Ernie Garcia, III, Chairman and CEO
Mark Jenkins, CFO
14
Appendix
Conference Call Details
Carvana will host a conference call today, October 29, 2020, at 5:30 p.m. EDT (2:30 p.m. PDT) to discuss financial results. To participate in the live call, analysts and investors should dial (833) 255-2830 or (412) 902-6715, and ask for “Carvana Earnings.” A live audio webcast of the conference call along with supplemental financial information will also be accessible on the company's website at investors.carvana.com. Following the webcast, an archived version will also be available on the Investor Relations section of the company’s website. A telephonic replay of the conference call will be available until November 5, 2020, by dialing (877) 344-7529 or (412) 317-0088 and entering passcode 10148378#.
Forward Looking Statements
This letter contains forward-looking statements within the meaning of the Private Securities Litigation Reform Act of 1995. These forward-looking statements reflect Carvana’s current expectations and projections with respect to, among other things, its financial condition, results of operations, plans, objectives, future performance, and business. These statements may be preceded by, followed by or include the words "aim," "anticipate," "believe," "estimate," "expect," "forecast," "intend," "likely," "outlook," "plan," "potential," "project," "projection," "seek," "can," "could," "may," "should," "would," "will," the negatives thereof and other words and terms of similar meaning.
Forward-looking statements include all statements that are not historical facts. Such forward-looking statements are subject to various risks and uncertainties. Accordingly, there are or will be important factors that could cause actual outcomes or results to differ materially from those indicated in these statements. Among these factors are risks related to the “Risk Factors” identified in our Annual Report on Form 10-K for 2019 and our Quarterly Report on Form 10-Q for Q1 2020, Q2 2020, and Q3 2020.
There is no assurance that any forward-looking statements will materialize. You are cautioned not to place undue reliance on forward-looking statements, which reflect expectations only as of this date. Carvana does not undertake any obligation to publicly update or review any forward-looking statement, whether as a result of new information, future developments, or otherwise.
Use of Non-GAAP Financial Measures
As appropriate, we supplement our results of operations determined in accordance with U.S. generally accepted accounting principles (“GAAP”) with certain non-GAAP financial measurements that are used by management, and which we believe are useful to investors, as supplemental operational measurements to evaluate our financial performance. These measurements should not be considered in isolation or as a substitute for reported GAAP results because they may include or exclude certain items as compared to similar GAAP-based measurements, and such measurements may not be comparable to similarly-titled measurements reported by other companies. Rather, these measurements should be considered as an additional way of viewing aspects of our operations that provide a more complete understanding of our business. We strongly encourage investors to review our consolidated financial statements included in publicly filed reports in their entirety and not rely solely on any one, single financial measurement or communication.
Reconciliations of our non-GAAP measurements to their most directly comparable GAAP-based financial measurements are included at the end of this letter.
Investor Relations Contact Information: Mike Levin, investors@carvana.com
15
CARVANA CO. AND SUBSIDIARIES
CONDENSED CONSOLIDATED BALANCE SHEETS
(Unaudited)
(In thousands)
| September 30, 2020 | December 31, 2019 | ||||||||||
| ASSETS | |||||||||||
| Current assets: | |||||||||||
| Cash and cash equivalents | $ | 173,704 | $ | 76,016 | |||||||
| Restricted cash | 22,619 | 42,443 | |||||||||
| Accounts receivable, net | 82,932 | 39,864 | |||||||||
| Finance receivables held for sale, net | 316,972 | 286,969 | |||||||||
| Vehicle inventory | 967,547 | 762,696 | |||||||||
| Beneficial interests in securitizations | 112,134 | 98,780 | |||||||||
Other current assets, including $5,437 and $0, respectively, due from related parties | 71,196 | 52,654 | |||||||||
| Total current assets | 1,747,104 | 1,359,422 | |||||||||
| Property and equipment, net | 800,181 | 543,471 | |||||||||
Operating lease right-of-use assets, including $22,483 and $44,583, respectively, from leases with related parties | 141,657 | 123,420 | |||||||||
| Intangible assets, net | 5,990 | 7,232 | |||||||||
| Goodwill | 9,353 | 9,353 | |||||||||
Other assets, including $4,908 and $6,138, respectively, due from related parties | 28,513 | 14,850 | |||||||||
| Total assets | $ | 2,732,798 | $ | 2,057,748 | |||||||
| LIABILITIES & STOCKHOLDERS' EQUITY | |||||||||||
| Current liabilities: | |||||||||||
Accounts payable and accrued liabilities, including $12,845 and $9,549, respectively, due to related parties | $ | 355,876 | $ | 234,443 | |||||||
| Short-term revolving facilities | 126,981 | 568,840 | |||||||||
| Current portion of long-term debt | 54,313 | 48,731 | |||||||||
Other current liabilities, including $3,442 and $4,518, respectively, from leases with related parties | 11,616 | 12,856 | |||||||||
| Total current liabilities | 548,786 | 864,870 | |||||||||
Long-term debt, excluding current portion, including $15,000 held by a related party | 1,080,929 | 883,060 | |||||||||
Operating lease liabilities, excluding current portion, including $19,482 and $41,829, respectively, from leases with related parties | 140,010 | 116,071 | |||||||||
| Other liabilities | 1,497 | 1,808 | |||||||||
| Total liabilities | 1,771,222 | 1,865,809 | |||||||||
| Commitments and contingencies | |||||||||||
| Stockholders' equity: | |||||||||||
Preferred stock, $0.01 par value - 50,000 shares authorized; none issued and outstanding as of September 30, 2020 and December 31, 2019 | — | — | |||||||||
Class A common stock, $0.001 par value - 500,000 shares authorized; 70,538 and 50,507 shares issued and outstanding as of September 30, 2020 and December 31, 2019, respectively | 71 | 51 | |||||||||
Class B common stock, $0.001 par value - 125,000 shares authorized; 101,200 and 101,219 shares issued and outstanding as of September 30, 2020 and December 31, 2019, respectively | 101 | 101 | |||||||||
| Additional paid-in capital | 721,174 | 280,994 | |||||||||
| Accumulated deficit | (290,836) | (183,034) | |||||||||
| Total stockholders' equity attributable to Carvana Co. | 430,510 | 98,112 | |||||||||
| Non-controlling interests | 531,066 | 93,827 | |||||||||
| Total stockholders' equity | 961,576 | 191,939 | |||||||||
| Total liabilities & stockholders' equity | $ | 2,732,798 | $ | 2,057,748 | |||||||
16
CARVANA CO. AND SUBSIDIARIES
CONDENSED CONSOLIDATED STATEMENTS OF OPERATIONS
(Unaudited)
(In thousands, except per share amounts)
| Three Months Ended September 30, | Nine Months Ended September 30, | ||||||||||||||||||||||
| 2020 | 2019 | 2020 | 2019 | ||||||||||||||||||||
| Sales and operating revenues: | |||||||||||||||||||||||
| Used vehicle sales, net | $ | 1,289,128 | $ | 931,016 | $ | 3,245,209 | $ | 2,470,630 | |||||||||||||||
Wholesale vehicle sales, including $1,323, $0, $1,365, and $0, respectively, from related parties | 129,925 | 92,430 | 258,965 | 188,474 | |||||||||||||||||||
Other sales and revenues, including $26,141, $15,824, $69,423, and $40,386, respectively, from related parties | 124,556 | 71,408 | 255,985 | 177,205 | |||||||||||||||||||
| Net sales and operating revenues | 1,543,609 | 1,094,854 | 3,760,159 | 2,836,309 | |||||||||||||||||||
Cost of sales, including $931, $997, $2,664, and $3,487, respectively, to related parties | 1,282,336 | 957,311 | 3,210,258 | 2,472,441 | |||||||||||||||||||
| Gross profit | 261,273 | 137,543 | 549,901 | 363,868 | |||||||||||||||||||
Selling, general and administrative expenses, including $4,712, $4,264, $13,630, and $9,884, respectively, to related parties | 267,842 | 207,970 | 783,487 | 545,054 | |||||||||||||||||||
Interest expense, including $332, $332, $998, and $998 to related parties | 20,276 | 20,990 | 69,053 | 55,953 | |||||||||||||||||||
| Other (income) expense, net | (9,201) | 827 | 5,126 | 1,760 | |||||||||||||||||||
| Net loss before income taxes | (17,644) | (92,244) | (307,765) | (238,899) | |||||||||||||||||||
| Income tax provision | 76 | — | (162) | — | |||||||||||||||||||
| Net loss | (17,720) | (92,244) | (307,603) | (238,899) | |||||||||||||||||||
| Net loss attributable to non-controlling interests | (10,635) | (62,156) | (199,801) | (165,373) | |||||||||||||||||||
| Net loss attributable to Carvana Co. | $ | (7,085) | $ | (30,088) | $ | (107,802) | $ | (73,526) | |||||||||||||||
| Net loss per share of Class A common stock, basic and diluted | $ | (0.10) | $ | (0.60) | $ | (1.73) | $ | (1.61) | |||||||||||||||
Weighted-average shares of Class A common stock, basic and diluted (1) | 70,005 | 49,787 | 62,244 | 45,726 | |||||||||||||||||||
(1) Weighted-average shares of Class A common stock outstanding have been adjusted for unvested restricted stock awards.
17
CARVANA CO. AND SUBSIDIARIES
CONDENSED CONSOLIDATED STATEMENTS OF CASH FLOWS
(Unaudited)
(In thousands)
| Nine Months Ended September 30, | |||||||||||
| 2020 | 2019 | ||||||||||
| Cash Flows from Operating Activities: | |||||||||||
| Net loss | $ | (307,603) | $ | (238,899) | |||||||
| Adjustments to reconcile net loss to net cash used in operating activities: | |||||||||||
| Depreciation and amortization expense | 52,076 | 27,505 | |||||||||
| Loss on disposal of property and equipment | 5,708 | 1,046 | |||||||||
| Provision for bad debt and valuation allowance | 10,752 | 7,030 | |||||||||
| Gain on loan sales | (129,041) | (99,408) | |||||||||
| Equity-based compensation expense | 18,011 | 25,366 | |||||||||
| Amortization and write-off of debt issuance costs and bond premium | 5,745 | 3,569 | |||||||||
| Originations of finance receivables | (2,492,741) | (1,877,336) | |||||||||
| Proceeds from sale of finance receivables, net | 2,478,931 | 2,027,689 | |||||||||
| Purchase of finance receivables | — | (161,781) | |||||||||
| Principal payments received on finance receivables held for sale | 60,113 | 54,623 | |||||||||
| Unrealized (gain) loss on beneficial interests in securitization | (4,021) | 219 | |||||||||
| Changes in assets and liabilities: | |||||||||||
| Accounts receivable | (45,575) | (27,907) | |||||||||
| Vehicle inventory | (197,962) | (213,762) | |||||||||
| Other assets | (17,743) | (25,755) | |||||||||
| Accounts payable and accrued liabilities | 112,495 | 65,452 | |||||||||
| Operating lease right-of-use assets | (18,237) | (18,896) | |||||||||
| Operating lease liabilities | 22,699 | 16,952 | |||||||||
| Other liabilities | (311) | (382) | |||||||||
| Net cash used in operating activities | (446,704) | (434,675) | |||||||||
| Cash Flows from Investing Activities: | |||||||||||
Purchases of property and equipment, including $21,657 and $6,282, respectively, from related parties | (270,486) | (151,380) | |||||||||
| Principal payments received on beneficial interests in securitizations | 8,782 | 2,577 | |||||||||
| Net cash used in investing activities | (261,704) | (148,803) | |||||||||
| Cash Flows from Financing Activities: | |||||||||||
| Proceeds from short-term revolving facilities | 3,425,755 | 3,093,039 | |||||||||
| Payments on short-term revolving facilities | (3,867,614) | (3,133,186) | |||||||||
| Proceeds from issuance of long-term debt | 203,047 | 367,349 | |||||||||
| Payments on long-term debt | (18,414) | (11,087) | |||||||||
| Payments of debt issuance costs | (11,730) | (8,423) | |||||||||
| Net proceeds from issuance of Class A common stock | 1,058,940 | 297,611 | |||||||||
| Proceeds from exercise of stock options | 4,907 | 1,492 | |||||||||
| Tax withholdings related to restricted stock awards | (8,619) | (3,552) | |||||||||
| Net cash provided by financing activities | 786,272 | 603,243 | |||||||||
| Net increase in cash, cash equivalents and restricted cash | 77,864 | 19,765 | |||||||||
| Cash, cash equivalents and restricted cash at beginning of period | 118,459 | 88,709 | |||||||||
| Cash, cash equivalents and restricted cash at end of period | $ | 196,323 | $ | 108,474 | |||||||
18
CARVANA CO. AND SUBSIDIARIES
OUTSTANDING SHARES AND LLC UNITS
(Unaudited)
LLC Units (adjusted for the exchange ratio and participation thresholds) are considered potentially dilutive shares of Class A common stock because they are exchangeable into shares of Class A common stock, if the Company elects not to settle exchanges in cash. Weighted-average shares of Class A common stock and as-exchanged LLC Units, which were evaluated for potentially dilutive effects and were determined to be anti-dilutive, are as follows:
| Three Months Ended September 30, | Nine Months Ended September 30, | ||||||||||||||||||||||
| 2020 | 2019 | 2020 | 2019 | ||||||||||||||||||||
| (in thousands) | |||||||||||||||||||||||
| Weighted-average shares of Class A common stock outstanding | 70,005 | 49,787 | 62,244 | 45,726 | |||||||||||||||||||
| Weighted-average as-exchanged LLC Units for shares of Class A common stock | 104,406 | 105,733 | 104,907 | 107,016 | |||||||||||||||||||
| 174,411 | 155,520 | 167,151 | 152,742 | ||||||||||||||||||||
19
CARVANA CO. AND SUBSIDIARIES
RECONCILIATION OF GAAP TO NON-GAAP FINANCIAL MEASURES
(Unaudited)
In prior periods we calculated non-GAAP measures including Gross Profit ex-Gift, Gross Profit per Unit ex-Gift, EBITDA ex-Gift, EBITDA Margin ex-Gift, Adjusted Net Loss and Adjusted Net Loss per Share, to exclude the impact of the 100k Milestone Gift program. As this program has concluded it is not material to current or future years and the adjustment is no longer included within similar calculations. For the three and nine months ended September 30, 2020, there was approximately $0.0 million and $0.5 million, respectively, of stock based compensation related to the 100k Milestone Gift program within cost of sales, which would impact all measures. For the three and nine months ended September 30, 2019, there was approximately $4.4 million and $10.7 million, respectively, of stock based compensation related to the 100k Milestone Gift program impacting the calculation of EBITDA ex-Gift, EBITDA Margin ex-Gift, Adjusted Net Loss, and Adjusted Net Loss per Share, including approximately $1.5 million and $4.2 million, respectively, within cost of sales impacting the calculation of Gross Profit ex-Gift and Gross Profit per Unit ex-Gift.
EBITDA and EBITDA Margin
EBITDA and EBITDA Margin are supplemental measures of operating performance that do not represent and should not be considered an alternative to net loss or cash flow from operations, as determined by GAAP. EBITDA is defined as net loss before interest expense, income tax expense, and depreciation and amortization expense. EBITDA Margin is EBITDA as a percentage of total revenues. We use EBITDA to measure the operating performance of our business and EBITDA Margin to measure our operating performance relative to our total revenues. We believe that EBITDA and EBITDA Margin are useful measures to us and to our investors because they exclude certain financial and capital structure items that we do not believe directly reflect our core operations and may not be indicative of our recurring operations, in part because they may vary widely across time and within our industry independent of the performance of our core operations. We believe that excluding these items enables us to more effectively evaluate our performance period-over-period and relative to our competitors. EBITDA and EBITDA Margin may not be comparable to similarly titled measures provided by other companies due to potential differences in methods of calculations. A reconciliation of EBITDA to net loss is the most directly comparable GAAP measure, and calculation of EBITDA Margin is as follows:
| Three Months Ended | |||||||||||||||||||||||||||||
| Sep 30, 2019 | Dec 31, 2019 | Mar 31, 2020 | Jun 30, 2020 | Sep 30, 2020 | |||||||||||||||||||||||||
| (dollars in thousands) | |||||||||||||||||||||||||||||
Net loss (1) | $ | (92,244) | $ | (125,740) | $ | (183,557) | $ | (106,326) | $ | (17,720) | |||||||||||||||||||
| Depreciation and amortization expense | 10,675 | 13,760 | 15,811 | 17,629 | 18,636 | ||||||||||||||||||||||||
| Interest expense | 20,990 | 24,653 | 28,862 | 19,915 | 20,276 | ||||||||||||||||||||||||
| Income tax provision | — | — | — | (238) | 76 | ||||||||||||||||||||||||
| EBITDA | $ | (60,579) | $ | (87,327) | $ | (138,884) | $ | (69,020) | $ | 21,268 | |||||||||||||||||||
| Total revenues | $ | 1,094,854 | $ | 1,103,587 | $ | 1,098,216 | $ | 1,118,334 | $ | 1,543,609 | |||||||||||||||||||
| Net loss margin | (8.4) | % | (11.4) | % | (16.7) | % | (9.5) | % | (1.1) | % | |||||||||||||||||||
EBITDA Margin (2) | (5.5) | % | (7.9) | % | (12.6) | % | (6.2) | % | 1.4 | % | |||||||||||||||||||
(1) Includes $4.4 million, $2.5 million, $0.5 million, $0.0 million, and $0.0 million, respectively, related to the 100k Milestone Gift.
(2) Includes 0.4%, 0.2%, 0.0%, 0.0%, and 0.0%, respectively, related to the 100k Milestone Gift.
| Years Ended December 31, | |||||||||||||||||||||||||||||||||||
| 2014 | 2015 | 2016 | 2017 | 2018 | 2019 | ||||||||||||||||||||||||||||||
| (dollars in thousands) | |||||||||||||||||||||||||||||||||||
Net loss (1) | $ | (15,238) | $ | (36,780) | $ | (93,112) | $ | (164,316) | $ | (254,745) | $ | (364,639) | |||||||||||||||||||||||
| Depreciation and amortization expense | 1,705 | 2,800 | 4,658 | 11,568 | 23,539 | 41,265 | |||||||||||||||||||||||||||||
| Interest expense | 108 | 1,412 | 3,587 | 7,659 | 25,018 | 80,606 | |||||||||||||||||||||||||||||
| EBITDA | $ | (13,425) | $ | (32,568) | $ | (84,867) | $ | (145,089) | $ | (206,188) | $ | (242,768) | |||||||||||||||||||||||
| Total revenues | $ | 41,679 | $ | 130,392 | $ | 365,148 | $ | 858,870 | $ | 1,955,467 | $ | 3,939,896 | |||||||||||||||||||||||
| Net loss margin | (36.6) | % | (28.2) | % | (25.5) | % | (19.1) | % | (13.0) | % | (9.3) | % | |||||||||||||||||||||||
EBITDA Margin (2) | (32.2) | % | (25.0) | % | (23.2) | % | (16.9) | % | (10.5) | % | (6.2) | % | |||||||||||||||||||||||
(1) Includes $0.0 million, $0.0 million, $0.0 million, $0.0 million, $11.8 million, and $13.2 million, respectively, related to the 100k Milestone Gift.
(2) Includes 0.0%, 0.0%, 0.0%, 0.0%, 0.6%, and 0.4%, respectively, related to the 100k Milestone Gift.
20
CARVANA CO. AND SUBSIDIARIES
RESULTS OF OPERATIONS
(Unaudited)
| Three Months Ended September 30, | Nine Months Ended September 30, | |||||||||||||||||||||||||||||||||||||
| 2020 | 2019 | Change | 2020 | 2019 | Change | |||||||||||||||||||||||||||||||||
| (dollars in thousands, except per unit amounts) | (dollars in thousands, except per unit amounts) | |||||||||||||||||||||||||||||||||||||
| Net sales and operating revenues: | ||||||||||||||||||||||||||||||||||||||
| Used vehicle sales, net | $ | 1,289,128 | $ | 931,016 | 38.5 | % | $ | 3,245,209 | $ | 2,470,630 | 31.4 | % | ||||||||||||||||||||||||||
Wholesale vehicle sales (1) | 129,925 | 92,430 | 40.6 | % | 258,965 | 188,474 | 37.4 | % | ||||||||||||||||||||||||||||||
Other sales and revenues (2) | 124,556 | 71,408 | 74.4 | % | 255,985 | 177,205 | 44.5 | % | ||||||||||||||||||||||||||||||
| Total net sales and operating revenues | $ | 1,543,609 | $ | 1,094,854 | 41.0 | % | $ | 3,760,159 | $ | 2,836,309 | 32.6 | % | ||||||||||||||||||||||||||
| Gross profit: | ||||||||||||||||||||||||||||||||||||||
Used vehicle gross profit (3) | $ | 119,607 | $ | 60,563 | 97.5 | % | $ | 268,035 | $ | 171,063 | 56.7 | % | ||||||||||||||||||||||||||
Wholesale vehicle gross profit (1)(4) | 17,110 | 5,572 | 207.1 | % | 25,881 | 15,600 | 65.9 | % | ||||||||||||||||||||||||||||||
Other gross profit (2) | 124,556 | 71,408 | 74.4 | % | 255,985 | 177,205 | 44.5 | % | ||||||||||||||||||||||||||||||
| Total gross profit | $ | 261,273 | $ | 137,543 | 90.0 | % | $ | 549,901 | $ | 363,868 | 51.1 | % | ||||||||||||||||||||||||||
| Market information: | ||||||||||||||||||||||||||||||||||||||
| Markets, beginning of period | 261 | 137 | 90.5 | % | 146 | 85 | 71.8 | % | ||||||||||||||||||||||||||||||
| Market launches | — | 9 | (100.0) | % | 115 | 61 | 88.5 | % | ||||||||||||||||||||||||||||||
| Markets, end of period | 261 | 146 | 78.8 | % | 261 | 146 | 78.8 | % | ||||||||||||||||||||||||||||||
| Unit sales information: | ||||||||||||||||||||||||||||||||||||||
| Used vehicle unit sales | 64,414 | 46,413 | 38.8 | % | 171,939 | 127,179 | 35.2 | % | ||||||||||||||||||||||||||||||
| Wholesale vehicle unit sales | 15,375 | 11,698 | 31.4 | % | 33,406 | 29,155 | 14.6 | % | ||||||||||||||||||||||||||||||
| Per unit selling prices: | ||||||||||||||||||||||||||||||||||||||
| Used vehicles | $ | 20,013 | $ | 20,059 | (0.2) | % | $ | 18,874 | $ | 19,426 | (2.8) | % | ||||||||||||||||||||||||||
| Wholesale vehicles | $ | 8,450 | $ | 7,901 | 6.9 | % | $ | 7,752 | $ | 6,465 | 19.9 | % | ||||||||||||||||||||||||||
Per unit gross profit: (5) | ||||||||||||||||||||||||||||||||||||||
Used vehicle gross profit (3) | $ | 1,857 | $ | 1,305 | 42.3 | % | $ | 1,559 | $ | 1,345 | 15.9 | % | ||||||||||||||||||||||||||
Wholesale vehicle gross profit (4) | $ | 1,113 | $ | 476 | 133.8 | % | $ | 775 | $ | 535 | 44.9 | % | ||||||||||||||||||||||||||
| Other gross profit | $ | 1,934 | $ | 1,539 | 25.7 | % | $ | 1,489 | $ | 1,393 | 6.9 | % | ||||||||||||||||||||||||||
| Total gross profit | $ | 4,056 | $ | 2,963 | 36.9 | % | $ | 3,198 | $ | 2,861 | 11.8 | % | ||||||||||||||||||||||||||
(1) Includes $1,323 and $0 for the three months ended September 30, 2020 and 2019, respectively, and $1,365 and $0 for the nine months ended September 30, 2020 and 2019, respectively, of wholesale revenue from related parties.
(2) Includes $26,141 and $15,824 for the three months ended September 30, 2020 and 2019, respectively, and $69,423 and $40,386 for the nine months ended September 30, 2020 and 2019, respectively, of other sales and revenues from related parties.
(3) Includes $0, $1,381, $510, and $3,953, or $0, $30, $3, and $31 per unit, related to the 100k Milestone Gift.
(4) Includes $0, $142, $17, and $267, or $0, $12, $0, and $9 per wholesale unit, related to the 100k Milestone Gift.
(5) All gross profit per unit amounts are per used vehicle sold, except wholesale vehicle gross profit, which is per wholesale vehicle sold.
21
CARVANA CO. AND SUBSIDIARIES
COMPONENTS OF SG&A
(Unaudited)
| Three Months Ended | ||||||||||||||||||||||||||||||||
| Sep 30, 2019 | Dec 31, 2019 | Mar 31, 2020 | Jun 30, 2020 | Sep 30, 2020 | ||||||||||||||||||||||||||||
| (in thousands) | ||||||||||||||||||||||||||||||||
Compensation and benefits (1) | $ | 60,655 | $ | 72,939 | $ | 84,250 | $ | 74,202 | $ | 80,248 | ||||||||||||||||||||||
| 100k Milestone Gift | 2,903 | 1,263 | — | — | — | |||||||||||||||||||||||||||
| Advertising | 55,264 | 58,867 | 74,788 | 62,330 | 65,148 | |||||||||||||||||||||||||||
Market occupancy (2) | 5,517 | 6,644 | 8,103 | 8,019 | 9,733 | |||||||||||||||||||||||||||
Logistics (3) | 14,068 | 18,090 | 18,914 | 16,699 | 18,073 | |||||||||||||||||||||||||||
Other (4) | 69,563 | 83,860 | 89,656 | 78,684 | 94,640 | |||||||||||||||||||||||||||
| Total | $ | 207,970 | $ | 241,663 | $ | 275,711 | $ | 239,934 | $ | 267,842 | ||||||||||||||||||||||
(1) Compensation and benefits includes all payroll and related costs, including benefits, payroll taxes, and equity-based compensation, except those related to preparing vehicles for sale, which are included in cost of sales, those related to the development of software products for internal use, which are capitalized to software and depreciated over the estimated useful lives of the related assets, and those related to the 100k Milestone Gift.
(2) Market occupancy costs includes occupancy costs of our vending machine and hubs. It excludes occupancy costs related to reconditioning vehicles which are included in cost of sales and the portion related to corporate occupancy which are included in other costs.
(3) Logistics includes fuel, maintenance and depreciation related to operating our own transportation fleet, and third party transportation fees, except the portion related to inbound transportation, which is included in cost of sales.
(4) Other costs include all other selling, general and administrative expenses such as IT expenses, corporate occupancy, professional services and insurance, limited warranty, and title and registration.
22
CARVANA CO. AND SUBSIDIARIES
LIQUIDITY RESOURCES
(Unaudited)
| September 30, 2020 | December 31, 2019 | ||||||||||
| (in thousands) | |||||||||||
| Cash and cash equivalents | $ | 173,704 | $ | 76,016 | |||||||
Availability under short-term revolving facilities (1) | 975,264 | 279,080 | |||||||||
Availability under sale-leaseback agreements (2)(3) | 101,233 | 104,680 | |||||||||
| Committed liquidity resources available | $ | 1,250,201 | $ | 459,776 | |||||||
(1) Based on pledging all eligible vehicles and finance receivables under the available capacity in the Floor Plan Facility and Finance Receivable Facilities, excluding the impact to restricted cash requirements.
(2) We have $75.0 million available for sale and leaseback transactions under the Master Sale-Leaseback Agreement with VMRE, and an additional $26.2 million and $29.7 million as of September 30, 2020 and December 31, 2019, respectively, available under sale-leaseback agreements with other parties.
(3) We have $197.7 million and $158.7 million of total unfunded gross real estate assets as of September 30, 2020 and December 31, 2019, respectively.
As of September 30, 2020 and December 31, 2019, the short-term revolving facilities had total capacity of $1.9 billion and $1.6 billion, an outstanding balance of $127.0 million and $568.8 million, and unused capacity of $1.7 billion and $1.0 billion, respectively.
We also had $19.9 million and $137.7 million of committed funds for future construction costs of IRCs with unfinished construction as of September 30, 2020 and December 31, 2019, respectively.
In addition, we had $36.6 million and $13.5 million of total unpledged beneficial interests in securitizations as of September 30, 2020 and December 31, 2019, respectively.
On October 2, 2020, we issued $500.0 million principal amount of 5.625% Senior Notes due 2025 and $600.0 million principal amount of 5.875% Senior Notes due 2028 and used approximately $626.8 million of the proceeds to redeem in full the outstanding $600.0 million principal amount of our 8.875% Senior Notes due 2023 resulting in net proceeds of approximately $455.9 million.
23