Attached files
| file | filename |
|---|---|
| EX-99.1 - EXHIBIT 99.1 - Bancorp, Inc. | ex99-1.htm |
| 8-K - THE BANCORP, INC. FORM 8-K - Bancorp, Inc. | bancorp8k.htm |
Exhibit 99.2

OC T OB E R 2 9 th , 20 20 THE BANCORP INVESTOR PRESENTATION

2 FORWARD LOOKING STATEMENTS & OTHER D I S C L O S U RE S D I S C L O S U R E S Statements in this presentation regarding The Bancorp, Inc.’s business that are not historical facts are “forward - looking statements”. These statements may be identified by the use of forward - looking terminology, including the words “may,” “believe,” “will,” “expect,” “anticipate,” “estimate,” “intend,” “plan," or similar words, and are based on current expectations about important economic, political, and technological factors, among others, and are subject to risks and uncertainties, which could cause the actual results, events or achievements to differ materially from those set forth in or implied by the forward - looking statements and related assumptions. These risks and uncertainties include those relating to the on - going COVID - 19 pandemic, the impact it will have on the company’s business and the industry as a whole, and the resulting governmental and societal responses. For further discussion of these risks and uncertainties, see the “risk factors” sections contained, in The Bancorp, Inc.’s Annual Report on Form 10 - K for the year ended December 31, 2019 and in its other public filings with the SEC. In addition, these forward - looking statements are based upon assumptions with respect to future strategies and decisions that are subject to change. Actual results may differ materially from the anticipated results discussed in these forward - looking statements. The forward - looking statements speak only as of the date of this presentation. The Bancorp, Inc. does not undertake to publicly revise or update forward - looking statements in this presentation to reflect events or circumstances that arise after the date of this presentation, except as may be required under applicable law. This presentation contains information regarding financial results that is calculated and presented on the basis of methodologies other than in accordance with accounting principles generally accepted in the United States (“GAAP”). This presentation may contain statistics and other data that in some cases has been obtained from or compiled from information made available by third - party service providers. The Bancorp, Inc. makes no representation or warranty, express or implied, with respect to the accuracy, reasonableness or completeness of such information. Past performance is not indicative nor a guarantee of future results. Copies of the documents filed by The Bancorp, Inc. with the SEC are available free of charge from the website of the SEC at www.sec.gov as well as on The Bancorp, Inc.’s website at www.thebancorp.com . This presentation is for information purposes only and shall not constitute an offer to sell or the solicitation of an offer to buy any securities. Neither the SEC nor any other regulatory body has approved or disapproved of the securities of The Bancorp, Inc. or passed upon the accuracy or adequacy of this presentation. Any representation to the contrary is a criminal offense.

3 ACROSS OUR BUSINESS LINES, THE BANCORP PARTNERS WITH SOME OF THE WORLD’S MOST SUCCESSFUL COMPANIES K E Y P L A Y E R I N T H E P A Y M E N T S & B A N K I N G E C O S Y S T E M $ 6 . 2 B I N A SSE T S # 1 P R E P A I D C A R D I S S U I NG B A NK 1 PR E P AI D C A R D S I N U . S . D I S T R I BUT I O N > 10 0 MM 1 Per Nilsen Ratings and measured by Gross Dollar Volume.

4 WE HAVE NOW RECORDED 15 STRAIGHT QUARTERS OF POSITIVE PRE - TAX INCOME E S T A B L I S H E D E A R N I N G S M O M E N T U M 1 Q4 2019 pre - tax income excluding $7.5 million civil money penalty was $12.6 million. $9.7 $13.1 $ 8 .7 $19.6 $ 8 .3 $17.9 $1 0 .5 $24.2 $15.1 $2 8 .5 $5.1 $16.7 $26.8 $29.4 $0 $5 $ 10 $ 1 5 $13.0 $ 20 $ 25 $ 30 $ 40 $ 35 $ 45 Q 1 Q 2 Q 3 Q 4 Q 1 Q 2 Q 3 Q 4 Q 1 Q 2 Q 3 Q 1 $65M Gain from sale of Safe Harbor IRA P R E - T A X I N C O M E ( $ M I L L I O N S ) $ 8 2.9 2 0 1 7 $0.39 EPS $1.55 EPS $0.90 EPS 2 0 1 8 2 0 1 9 K E Y S T O E A R N I N G S G R O W T H & S U S T A I N A B I L I T Y x Clear strategic vision x Strong growth from core business x Investments in technology/innovation x Consistent execution of business plan Q 3 2 0 2 0 Y E A R T O D A T E R E S U L T S 14 % … ROE 1 . 3 % … ROA $0.96 EPS Q 2 Q 3 Q 3 2 0 2 0 Y T D Q 4 1
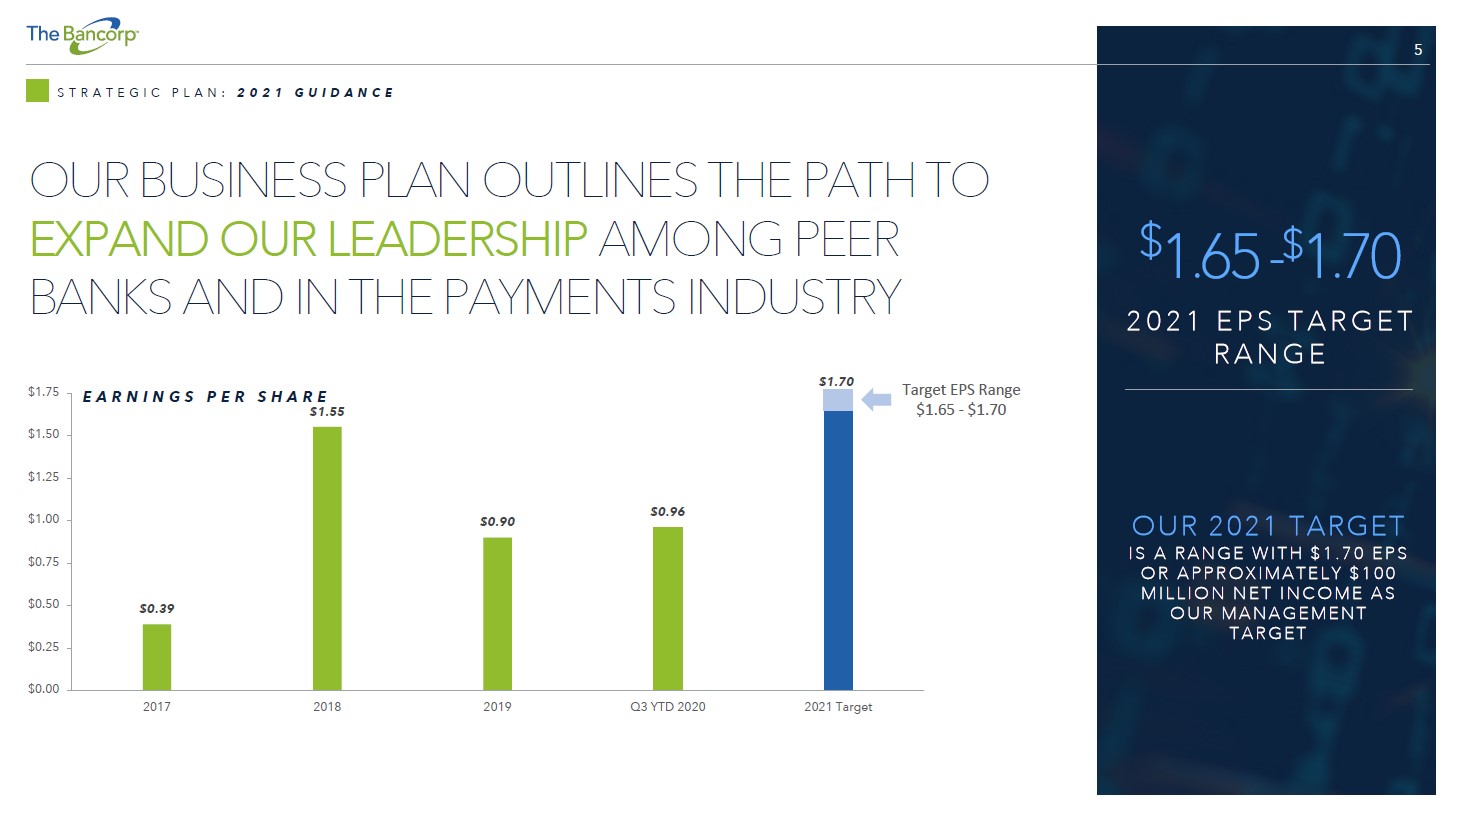
5 OUR BUSINESS PLAN OUTLINES THE PATH TO EXPAND OUR LEADERSHIP AMONG PEER BANKS AND IN THE PAYMENTS INDUSTRY S T R A T E G I C P L A N : 2 0 2 1 G U I D A N C E $ 1.65 - $ 1.70 2 0 2 1 E P S T A R G E T R A N GE OUR 2021 TARGET I S A R A NG E W I T H $ 1 . 7 0 E P S O R A P P R O X I M A T E L Y $ 1 0 0 M I L L I ON N E T I N C OME A S O U R M A NA G E M E NT T A R G ET $ 0 .39 $ 0 .90 $ 0 .96 $ 0 .25 $ 0 .00 $ 0 .50 $ 0 .75 $ 1 .00 $ 1 .50 $ 1 .25 $ 1 .75 2 0 17 2 0 18 2 0 19 Q3 YTD 2020 2021 Target E A R N I N G S P E R S H A R E $1.55 Target EPS Range $1.65 - $1.70 $1.70

6 BY EXECUTING OUR STRATEGIC PLAN, WE EXPECT TO DELIVER MARKET - LEADING RETURNS & CREATE VALUE FOR SHAREHOLDERS S T R A T E G I C P L A N : F I N A N C I A L G O A L S K E Y S T O A C H I E V I N G F I N A N C I A L T A R G E T S x Establish a new Payments Ecosystem 2.0 x Invest in technology/innovation x Maintain an industry leading compliance & risk function x Expand salesforce and marketing function in key markets x Attract & retain the best talent P E R F O R M A N C E M E T R I C S 2 0 1 9 Q 3 2 0 2 0 Y T D L O N G - T E R M T A R G E T S ROE 11 . 6% 14.3% 20% ROA 1 . 1% 1.3% > 2.0% EPS $0 . 90 $0.96 Leverage Ratio 9 . 7% 8.6% 9% – 10% Total Assets $5 . 7B $6.2B ~$8.0B

7 WE ARE WORKING CLOSELY WITH OUR BORROWERS TO MEET THEIR NEEDS AS THE PANDEMIC UNFOLDS F I N A N C I A L R E V I E W : P A N D E M I C R E S P O N S E 1 At risk sectors include Hospitality and Retail. HI GHLIGHTS • Implemented procedures to support employees working from home • Team members deemed worksite essential continue to operate from our physical locations, while effectively employing social distancing standards • Loans deferred as of 9/30/20 were down to 1.2% of total loans due to the pandemic compared to 7.5% in Q2 and 6.5% in Q1 • We continue to closely monitor our borrowers needs as businesses begin reopening PAY CH E CK PR OTE CTION P RO G RA M • High focus on supporting existing clients • Originated approximately 1,250 loans, totaling approximately $208 million • Expect to generate approximately $5.5 million in fees and interest • Average loan size of $165,000 with 92% under $350,000 BUSINESS LINE DEFERRED LOAN P RI NC I P A L TOT A L P RI NC I P A L % TOTAL Real Estate Capital Markets (HFS) $ 30 $ 1,603 2% Institutional Banking - 1,455 0% Small Business Lending 18 836 2% Commercial Fleet Leasing 4 430 1% Discontinued Operations 2 103 2% Other - 6 0% Total $ 54 $ 4,433 1. 2 % LOAN DEFERRALS BY BUSINESS LINE ($MILLION S ) 9/ 3 0/ 2020

8 Note: Financial data for deposits is average for the quarter ended September 30, 2020 and loans for the quarter ended September 30, 2020. PAYMENTS BUSINESS GENERATES NON - INTEREST INCOME AND COLLECTS STABLE, LOWER COST DEPOSITS DEPLOYED INTO LOWER RISK ASSET BASE IN SPECIALIZED MARKETS PAYMENT ACCEPTANCE GROUP Merchant acquiring and ACH services PAYMENT SOLUTIONS GROUP Issuing bank for leading prepaid card and debit programs $5.6B D E P OSI T S Market - leading payments businesses generate stable deposits that fund our lending business lines COMMERCIAL LENDING A combination of Small Business Lending and Fleet Leasing to create opportunities and accelerate growth in the commercial lending space SMALL BUSINESS COMMERCIAL LENDING FLEET LEASING SBA and other Niche - vehicle fleet small business leasing solutions lending — Historically low loss business lines $4.3B L O AN S Highly specialized lending products in high growth markets I N S T I TU T I O N A L BANKING Securities and cash value insurance lending for wealth managers REAL ESTATE CAPITAL MARKETS Commercial real estate, primarily multifamily loans

DEPOSITS & FEES: PAYMENTS BUSINESS GENERATES NON - INTEREST INCOME AND STABLE, LOWER COST DEPOSITS

10 B U S I N E S S O V E R V I E W : P A Y M E N T S 1 # PR E P AI D C A R D I S S U I NG B A NK 2 39 % G R OS S D OL L A R V OL U ME G R OW T H 3 1. PAYMENT SOLUTIONS GROUP Issuing bank for leading prepaid card and debit programs B U S I N E S S O V E R V I E W : I S S U A N C E • Sponsorship of prepaid and other electronic access accounts across the payments space • Sponsorship of private label banking (e.g., checking account with a debit card) • 3Q’2020 Financial Highlights: • Average deposits: $4,038M • Non - interest income: $19.4M 2. PAYMENT ACCEPTANCE GROUP Rapid Funds, merchant acquiring and ACH services B U S I N E S S O V E R V I E W : A C C E P T A N C E • Rapid Funds payment technologies • ACH sponsorship of large - scale payment processors • VISA/MasterCard sponsorship of large credit card acquiring ISOs 1 and their merchants • 3Q’2020 Financial Highlights: • Average deposits: $835M • Non - interest income: $1.8M OUR PAYMENTS BUSINESS IS COMPRISED OF THE PAYMENT SOLUTIONS GROUP (ISSUANCE) & PAYMENT ACCEPTANCE GROUP (ACCEPTANCE) 1 Independent Sales Organization. 2 Per Nilson Ratings and based on Gross Dollar Volume. 3 Gross Dollar Volume for Q3 2020 vs Q3 2019. 4 Reflects fees for prepaid, debit card and related fees and ACH, card and other payment processing fees for the three quarters ending September 30, 2020 vs three quarters ending September 30, 2019. 12 % N ON - I N TE R E S T I N C OM E G R OW T H 4
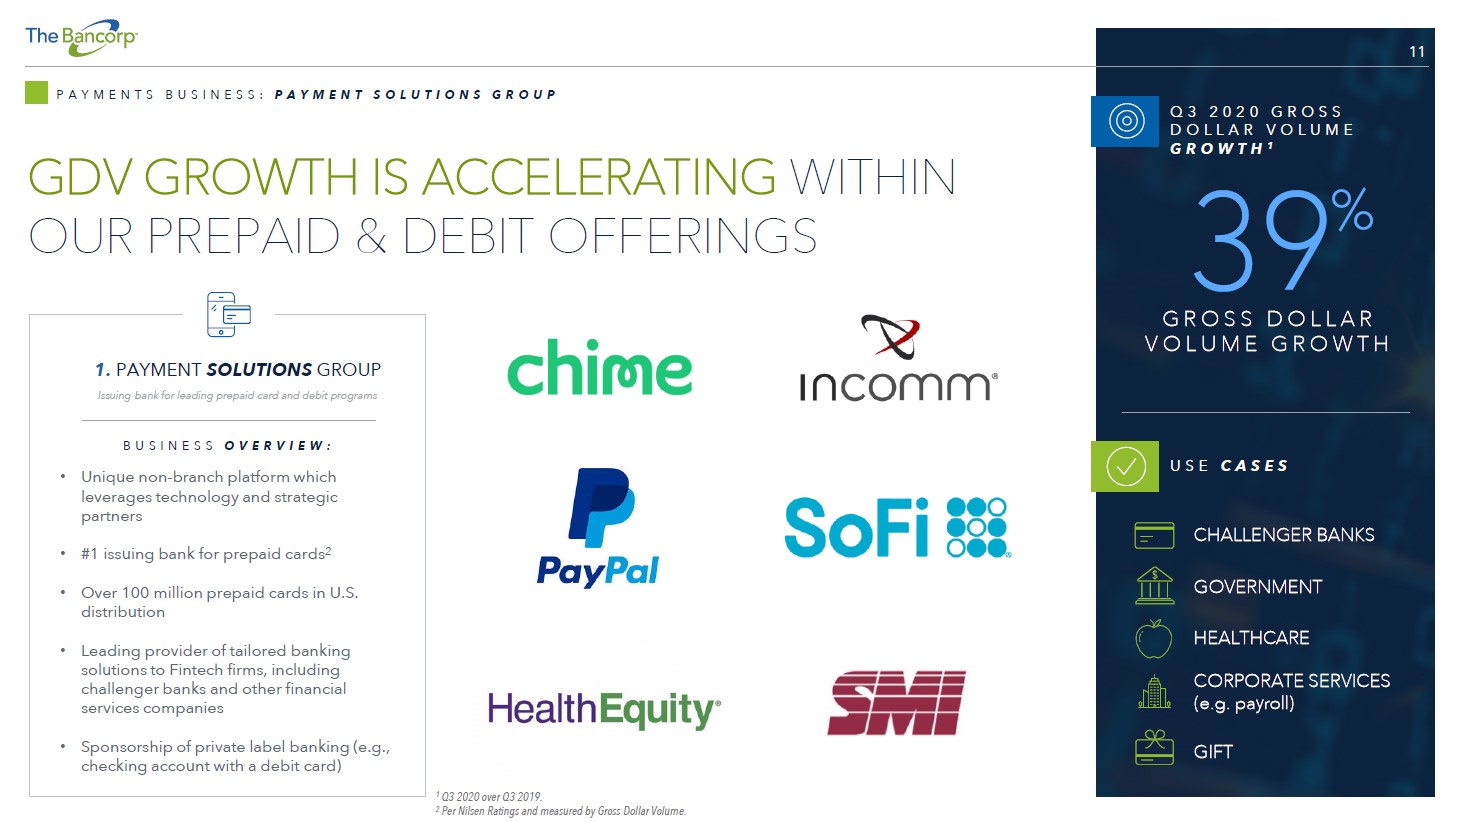
11 P A Y M E N T S B U S I N E S S : P A Y M E N T S O L U T I O N S G R O U P 39 % G R OS S D OL L A R V OL U ME G R OW T H 1. PAYMENT SOLUTIONS GROUP Issuing bank for leading prepaid card and debit programs B U S I N E S S O V E R V I E W : • Unique non - branch platform which leverages technology and strategic partners • #1 issuing bank for prepaid cards 2 • Over 100 million prepaid cards in U.S. distribution • Leading provider of tailored banking solutions to Fintech firms, including challenger banks and other financial services companies • Sponsorship of private label banking (e.g., checking account with a debit card) Q 3 2 0 2 0 G R O S S D O L L A R V O L U M E G R O W T H 1 U S E C A S E S CHALLENGER BANKS G O V E R NM E NT HEALTHCARE CORPORATE SERVICES (e.g. payroll) G I FT 1 Q3 2020 over Q3 2019. 2 Per Nilsen Ratings and measured by Gross Dollar Volume. GDV GROWTH IS ACCELERATING WITHIN OUR PREPAID & DEBIT OFFERINGS

12 P A Y M E N T S B U S I N E S S : P A Y M E N T A C C E P T A N C E G R O U P 2. PAYMENT ACCEPTANCE GROUP Rapid Funds, merchant acquiring and ACH services B U S I N E S S O V E R V I E W : • Pioneering real - time payments offering has recognized consistent and significant growth • 2018 VISA Innovation Adoption Award winner • Non - interest income and deposit generation • “Direct 1 ” Rapid Funds model delivers a highly scalable, low cost offering that disrupts legacy payment methods for corporate disbursements • ACH sponsorship of large - scale payment processors • VISA/MasterCard sponsorship of large credit card acquiring ISOs 2 and their merchants LAUNCHED IN LATE 2017, RAPID FUNDS HAS GATHERED STRONG MOMENTUM U S E C A S E S EARNED WAGE ACCESS GIG ECONOMY INSURANCE CLAIM PAYOUTS WE’RE EXPANDING ON OUR EARLY SUCCESS & adding new partners across various use cases 1 “Direct” is comprised of corporations with which The Bancorp contracts directly. 2 Independent sales organization.

13 CONSISTENT DEPOSIT GROWTH FROM PAYMENTS BUSINESSES P A Y M E N T S B U S I N E S S : S T A B L E , L O W E R C O S T D E P O S I T G E N E R A T O R 1 Time deposits have rarely been used due to lower cost deposit growth and previous balances are included in “Other”. 2 Average for the quarter ended September 30, 2020. $ 3 , 8 1 9 $ 3 , 8 12 $ 3 , 862 $ 4 , 025 $ 5 , 564 $ 6 , 000 $ 5, 5 00 $ 5, 0 00 $ 4 , 500 $ 4 , 000 $ 3 , 500 $ 3 , 000 $ 2, 5 00 $ 2, 0 00 $ 1 , 500 $ 1 , 000 $ 500 $0 2016 2017 2018 2019 Q3 2020 A V E R A G E D E P O S I T S B Y P E R I O D ( M I L L I O N S ) Payment Solutions Group (Prepaid and Debit Issuance) Institutional Banking (checking and money market for higher net worth individuals) Payment Acceptance Group (ACH, Push to Card, Merchant Acceptance) Other (Includes time deposits 1 and other legacy deposit programs) COST OF DEPOSITS 0.30% 0.38% 0.67% 0.85% 0.12% HI GHLIGHTS • Stable, low cost deposit base anchored by multi - year, contractual relationships in our Prepaid and Debit issuance business • Payment Solutions growth driven by increased transactional volume due to favorable tailwinds from stimulus, electronic banking migration and overall savings increases among consumers • Low cost of funds declining in 2020 due to Fed rate cuts to ~zero in March DEPOSIT TYPE ( AVG.) B A L A NC E % TOTAL Demand & Int. checking 5 , 079 , 711 91% Savings & Money Market 484 , 32 3 9% Time Deposits 1 - 0% Total 2 $5.6B 1 00% Savings & Money Market 9% Time Deposits 0% Demand & Int. checking 91%

LOANS & LEASES: HIGHLY SPECIALIZED LENDING WITH LOW LOSS HISTORIES

15 LOWER CREDIT RISK LOAN PORTFOLIO L O A N S & L E A S E S : S T R O N G C O L L A T E R A L A N D G O V E R N M E N T G U A R A N T E E S BUSINESS LINE BALANCE SHEET CATEGORY Q 3 2020 PRINCIPAL BALANCE ($ MILLIONS) % OF TOTAL PO R T F O L I O Multifamily - commercial real estate (A) $ 1 , 463 3 4% Real Estate Capital Markets Hospitality - commercial real estate 63 1% Retail - commercial real estate 52 1% Other 25 0% Total 1,6 0 3 36% Securities backed lines of credit (SBLOC) (B) 1 , 069 2 5% Institutional Banking Insurance backed lines of credit (IBLOC) (C) 3 59 8% Advisor Financing 27 1% Total 1,455 34% U.S. government guaranteed portion of SBA loans (D) 334 8% Paycheck Protection Program Loans (PPP) (D) 2 08 5% Small Business Lending Commercial mortgage SBA (E) 165 4% Unguaranteed portion of U.S. govn’t guaranteed loans 98 2% Non - SBA small business loans 18 0% Construction SBA 13 0% Total 8 36 2 0 % Commercial Fleet Leasing Leasing (F) 4 31 10% Other Other 13 0% Total principal $ 4,338 1 00% LOWER C R E D I T L O S S NICHES A. Nationally recognized CRE analytics firm projects cumulative 1.2% COVID stress credit loss for multifamily. Loans are on books at 99 dollar price B. SBLOC loans backed by marketable securities with no incurred credit losses C. IBLOC loans are backed by the cash value of life insurance policies with no incurred credit losses D. Portion of small business loans fully guaranteed by the U.S. government E. 50% - 60% loan to value ratios at origination F. Recourse to vehicles and relatively low historical charge - offs

16 INSTITUTIONAL BANKING L O A N S & L E A S E S : I N S T I T U T I O N A L B A N K I N G B U S I N E S S O V E R V I E W : • Automated loan application platform, Talea, provides industry leading speed and delivery • Securities - backed lines of credit provide fast and flexible liquidity for investment portfolios • Insurance - backed lines of credit provide fast and flexible borrowing against the cash value of life insurance • Launched Advisor Finance product to provide capital to transitioning financial advisors to facilitate M&A, debt restructuring, and the development of succession plans • Deposit accounts for wealth management clients • No historical credit losses H I G H L I G H T S : • Loan growth of 58% year over year with significant additional market opportunity • Launched Talea™ loan automation platform and implemented with key partners • Market dynamics support business model • Advisors shifting from large broker/dealers to independent platforms • Sector shift to fee - based accounts • Emergence of new wealth management providers Lending and banking services for wealth managers The Bancorp’s Business Model allows us to build banking solutions to “spec” without competing directly with our partner firms. We do not have any associated asset managers, proprietary advisory programs, or related programs. Our singular focus is to help our partner firms stay competitive in the marketplace and to grow and retain assets. A L W AYS A P A R T NE R , NE VE R A C O M PE T I T O R $ 1.5 B P OR T F OL I O SI Z E 2.5 % 9/ 30/ 20 20 ES T . Y I E L D

17 INSTITUTIONAL BANKING PRIMARILY COMPRISED OF SECURITIES & CASH VALUE LIFE INSURANCE LENDING L O A N S & L E A S E S : I N S T I T U T I O N A L B A N K I N G L O A N P O R T F O L I O LOAN TYPE PRINCIPAL BALANCE % OF PORTFOLIO Securities backed lines of credit (SBLOC) $ 1, 0 6 9 7 3% Insurance backed lines of credit (IBLOC) 359 25% Advisor Financing 27 2% Total $ 1, 455 100% INSTITU TIONAL BANKING LOANS ( $ M ILL ION S ) 9/ 30/ 2020 SECURITIES BACKED LINES OF CREDIT • No historical credit losses • Underwriting standards of generally 50% to equities and 80% or more to fixed income securities PORTFOLIO ATTRIBUTES PRINCIPAL BALANCE % PRINCIPAL TO COLLATERAL $ 33 30% 17 39% 14 22% 1 2 33% 1 0 47% 1 0 3 1 % 9 23% 9 7 5% 9 4 9% 8 22% Total $ 1 3 1 35% T OP 10 S BLO C LO ANS ( $ M ILL IONS) 9/ 30/ 2020 INSURANCE BACKED LINES OF CREDIT • No historical credit losses • Loans backed by the cash value of whole life insurance policies

18 SMALL BUSINESS LENDING L O A N S & L E A S E S : S M A L L B U S I N E S S L E N D I N G B U S I N E S S O V E R V I E W : • Established a distinct platform within the fragmented SBA market • National portfolio approach allows pricing and client flexibility • Solid credit performance demonstrated over time • Client segment strategy tailored by market H I G H L I G H T S : • Loan growth of 13% year over year driven by increased origination productivity • Developed the SBAlliance™ program to provide lending support to banks and financial institutions who need SBA lending capabilities through products such as: • Wholesale loan purchases • Interim bridge financing for small business owners • Participated in the Payroll Protection Program (PPP) and originated $208M in short term loans, not included in the $628M above SBA and other small business lending $ 628 M P OR T F OL I O SI Z E 4.9 % 9/ 30/ 20 20 ES T . Y I E L D ~$ 700 K A V E R AG E 7 ( a) L O A N S I Z E

19 L O A N S & L E A S E S : S T R O N G C O L L A T E R A L & G O V E R N M E N T G U A R A N T E E S S MALL BUS INESS LO ANS BY T YP E 1 ( $ M I L LIO N S ) 9/ 30/ 2020 1 Excludes $334M of SBA loans that are government guaranteed and $208M PPP loans. TYPE DISTRIBUTION • Diverse product mix • Commercial mortgage and construction are generally originated with 50% - 60% LTV’s GEOGRAPHIC DISTRIBUTION • Diverse geographic mix • Largest concentration in Florida representing 17% of total PORTFOLIO ATTRIBUTES TYPE S B L C OMMER C I A L MORT G A GE S B L C O NS TR UC T I O N SBL NON - REAL E S TATE TOTAL Hotels $ 66 $ 2 $ - $ 68 Professional services offices 21 - 3 24 Full - service restaurants 15 1 4 20 Child day care and youth services 15 - 1 16 Bakeries 4 - 12 16 Fitness/rec centers and instruction 2 8 2 12 General warehousing and storage 11 - - 11 Limited - service restaurants and catering 7 - 3 10 Elderly assisted living facilities 7 - 2 9 Amusement and recreation industries 4 2 3 9 Car washes 5 3 - 8 Funeral homes 7 - - 7 New and used car dealers 4 - - 4 Automotive servicing 3 - - 3 Other 51 - 26 77 Total $ 222 $ 16 $ 56 $ 294 S MALL BUS INESS LO ANS BY STATE 1 ( $ M ILLI ON S) 9/ 30/ 2020 STATE S B L C OMMER C I A L MORT G A GE S B L C O NS TR UC T I O N SBL NON - REAL E S TATE TOTAL Florida $ 35 $ 8 $ 8 $ 51 California 36 2 5 43 Pennsylvania 30 - 4 34 Illinois 26 - 3 29 North Carolina 19 3 3 25 New York 10 2 5 17 Texas 11 - 5 16 Tennessee 11 - 1 12 New Jersey 3 1 7 11 Virginia 9 - 2 11 Georgia 5 - 2 7 Colorado 3 - 1 4 Michigan 3 - 1 4 Washington 3 - - 3 Ohio 2 - 1 3 Other states 16 - 8 24 Total $ 222 $ 16 $ 56 $ 294 SMALL BUSINESS LENDING

20 L O A N S & L E A S E S : C O M M E R C I A L F L E E T L E A S I N G B U S I N E S S O V E R V I E W : • Niche provider of vehicle leasing solutions • Focus on smaller fleets (less that 150 vehicles) • Direct lessor (The Bancorp Bank sources opportunities directly and provides value - add services such as outfitting police cars) • Historical acquisitions of small leasing companies have contributed to growth • Mix of commercial (~80%) and government - related business (~20%) H I G H L I G H T S : • Reengineering the operating platform to enable sustained and efficient growth • Enhancing sales process and support functions • Pursuing technology enhancements to scale business with efficiency • Constantly evaluating organic and inorganic growth opportunities in the vehicle space Niche - vehicle fleet leasing solutions COMMERCIAL FLEET LEASING $ 4 3 1 M P OR T F OL I O SI Z E 6.3 % 9/ 30/ 20 20 ES T . Y I E L D

21 L O A N S & L E A S E S : C O M M E R C I A L F L E E T L E A S I N G P O R T F O L I O OVERVIEW • Largest concentration is government sector • Of the $431M total portfolio, $401M is vehicle leases with the remaining $30M made up of equipment leases PORTFOLIO ATTRIBUTES TYPE B A L A NCE TOTAL Government agencies and public institutions $ 76 18% Construction 74 18% Waste management and remediation services 61 14% Real estate, rental and leasing 44 10% Retail trade 36 8% Transportation and warehousing 35 8% Health care and social assistance 26 6% Professional, scientific, and technical services 19 4% Wholesale trade 14 3% Manufacturing 14 3% Educational services 9 2% Arts, entertainment, and recreation 5 1% Other 18 5% Total $ 431 1 00% DIR ECT LEASE F INANCING BY STATE ( $ M ILL ION S ) 9/ 30/ 2020 COMMERCIAL FLEET LEASING STATE B A L A NCE TOTAL Florida $ 92 2 0% California 30 7% New Jersey 29 7% Pennsylvania 26 6% New York 25 6% North Carolina 22 5% Utah 21 5% Maryland 20 5% Washington 16 4% Georgia 12 3% Missouri 12 3% Connecticut 12 3% Texas 12 3% Alabama 11 3% South Carolina 9 2% Other states 82 18% Total $ 431 1 00% DIR ECT LEASE F INANCING BY T YP E ( $ M ILLI ON S) 9/ 30/ 2020

22 REAL ESTATE CAPITAL MARKETS L O A N S & L E A S E S : R E A L E S T A T E C A P I T A L M A R K E T S TYPE # LOANS B A L ANCE O RI GI N A T I O N DATE LTV WEIGHTED AVG MIN INTEREST RATE % TOTAL Multifamily (apartments) 173 $ 1,463 76% 4 . 8% 91% Hospitality (hotels and lodging) 11 63 65% 5 . 7% 4% Retail 8 52 70% 4 . 6% 3% Other 7 25 70% 5 . 2% 2% Total 199 $ 1,603 75% 4. 8 % 1 00% COMMERCIAL R EAL ES T AT E LO ANS BY T YP E ( $ M I LL ION S ) 9/ 30/ 2020 B U S I N E S S O V E R V I E W : • Strategic determination made in Q3 to discontinue future securitization activity • We expect income from the portfolio to be stable over the next 2 years • Entire portfolio is at LIBOR interest rate floors and yields 4.8% as of Q3 2020 Commercial real estate loans STATE B A L ANCE O RI GI N A T I O N DATE LTV Texas $ 3 96 76% Georgia 2 52 78% Arizona 1 23 76% North Carolina 111 77% Nevada 56 80% Alabama 54 76% Other states each <$50 million 611 7 3% Total $ 1,6 0 3 75% COMMERCIAL R EAL ES T AT E LO ANS BY STATE ( $ M ILL ION S ) 9/ 30/ 2020 MULTI - FAMILY – 91% LODGING – 4% RETAIL – 3% OTHER - 2% A S S E T C L A S S E S - % P O R T F O L I O OVERVIEW • Vast majority of loans are multifamily including all of the top 15 exposures • Commercial real estate loans are in “Commercial loans, at fair value” category on balance sheet PORTFOLIO ATTRIBUTES

FINANCIAL REVIEW

24 3.4% NIM & SIGNIFICANT NET INTEREST INCOME GROWTH IN Q3 DESPITE 0% FRB RATE ENVIRONMENT 1 F I N A N C I A L R E V I E W : I N T E R E S T R A T E S E N S I T I V I T Y 1 In the unlikely event of negative interest rates, $1.1B of demand securities loans and $0.4B of cash value insurance loans would be repriced with floors to maintain adequate margins. 2 Loans are as of September 30, 2020 and deposits are average balance for Q3 2020. 3 Institutional Banking substantially comprised of securities backed loans and insurance backed loans. 4 Excludes $208M of short - term PPP loans which are fully government guaranteed and deferred costs and fees. Q3 BALANCE 2 ( $ MIL L ION S ) RATE SENSITIVITY Real Estate Capital M ark e ts $ 1 , 60 3 4.8% avg. floor and yield will increase as rates exceed floors Institutional Banking 3 $ 1 , 455 Majority of loan yields will increase as rates increase Small Business 4 $62 8 Majority of loan yields will increase as rates increase L e a s i n g $ 4 3 1 Fixed rates but short average lives T otal $ 4 , 117 Core Lending businesses account for 95% of the total $4,338 loans Total Deposits $ 5 , 5 6 4 Adjusts to a portion of rate increases in line with partner contracts C o r e L e n d i n g Bu s i n e s s e s HI GHLIGHTS x Floating rate lending businesses include Real Estate Capital Markets, SBLOC, IBLOC and Small Business x Deposits primarily comprised of prepaid and debit accounts and anchored by multi - year, contractual relationships x Interest income should increase in higher interest rate environments
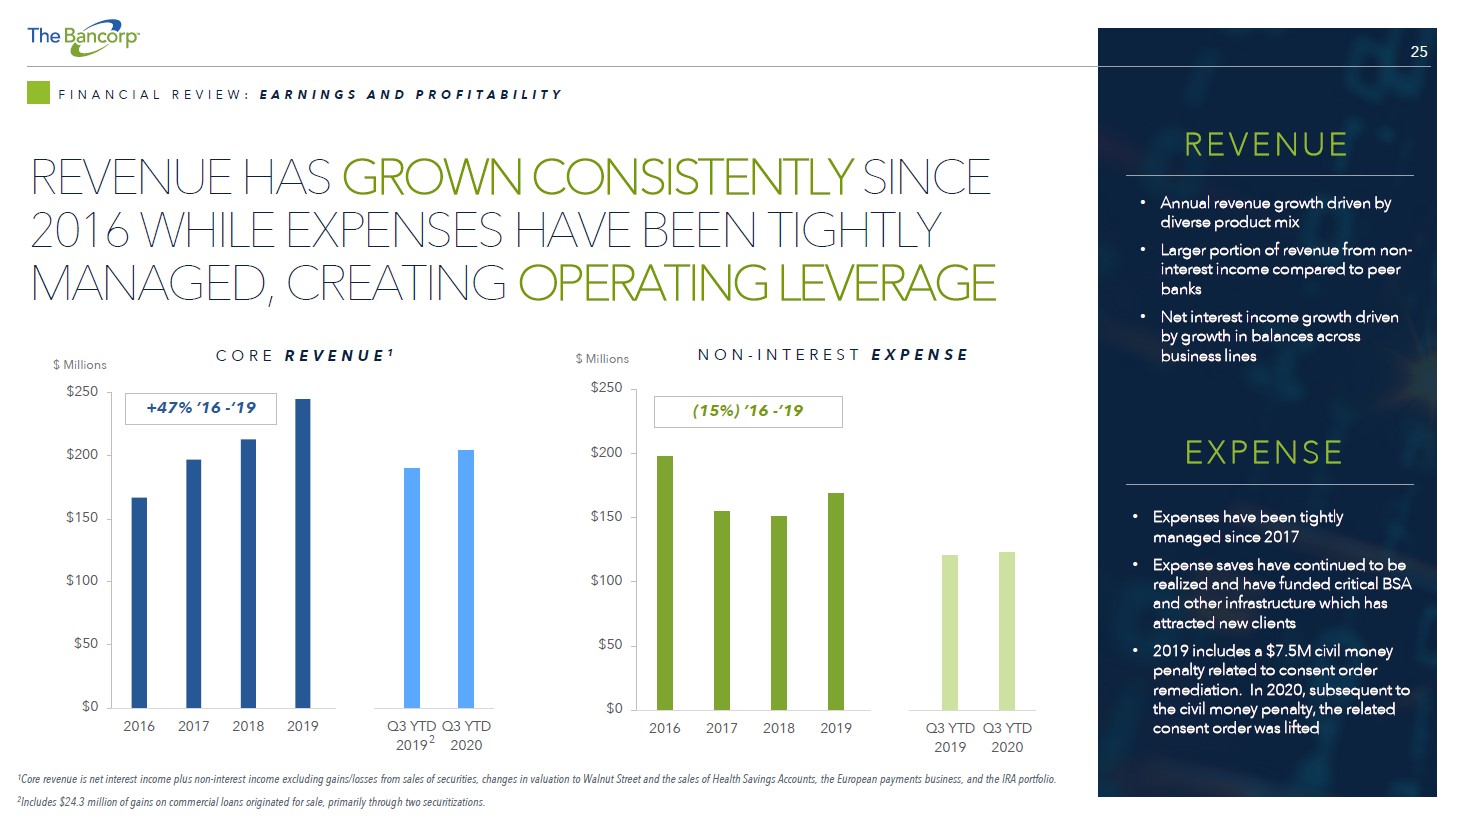
25 REVENUE HAS GROWN CONSISTENTLY SINCE 2016 WHILE EXPENSES HAVE BEEN TIGHTLY MANAGED, CREATING OPERATING LEVERAGE F I N A N C I A L R E V I E W : E A R N I N G S A N D P R O F I T A B I L I T Y 1 Core revenue is net interest income plus non - interest income excluding gains/losses from sales of securities, changes in valuation to Walnut Street and the sales of Health Savings Accounts, the European payments business, and the IRA portfolio. 2 Includes $24.3 million of gains on commercial loans originated for sale, primarily through two securitizations. $0 $ 50 $ 100 $ 150 $ 200 2 0 1 6 2 0 1 7 2 0 1 8 2 0 19 $0 $ 50 $ 100 $ 150 $ 200 2 0 1 6 2 0 1 7 2 0 1 8 2 0 19 Q3 YTD Q3 YTD 2019 2020 N O N - I N T E R E S T E X P E N S E C O R E R E V E N U E 1 $ Millions $ 250 $ Millions $250 R EV E NU E • Annual revenue growth driven by diverse product mix • Larger portion of revenue from non - interest income compared to peer banks • Net interest income growth driven by growth in balances across business lines E X PE NS E • Expenses have been tightly managed since 2017 • Expense saves have continued to be realized and have funded critical BSA and other infrastructure which has attracted new clients • 2019 includes a $7.5M civil money penalty related to consent order remediation. In 2020, subsequent to the civil money penalty, the related consent order was lifted +47% ’16 - ‘19 (15%) ’16 - ’19 Q3 YTD Q3 YTD 2019 2 2020

26 $0 $2 $4 $6 $8 $ 10 $ 12 $ 14 $ 16 2 0 17 2 0 18 2 0 19 Q3 2020 ALLOWANCE FOR CREDIT LOSSES REFLECTS OUR LOWER RISK LOAN PORTFOLIO F I N A N C I A L R E V I E W : L O A N L O S S R E S E R V E A L L O W A N C E F O R C R E D I T L O S S E S ( $ M I L L I O N S ) Small Business SBLOC/IBLOC/Advisor Financing HELOC/Consumer/Other Allowance for credit losses as % of loan b a l a n c e 0.6% 0.6% 0 .6% 0.6% Allowance for credit losses as % of loan balance (excluding SBLOC & IBLOC) 1.2% 1.2% 1.2% 1.4% HI GHLIGHTS CONTINUING OPERATIONS • Increases in allowance for credit losses driven partially by CECL adoption in Q1 and potential COVID impact • Fair value adjustments to the capital markets commercial real estate portfolio in 2020 were driven by potential COVID - related unrealized losses DISCONTINUED OPERATIONS • Discontinued portfolio only 2% of total loans • Minimal losses in Discontinued Operations line item and Walnut Street through Q3 2020 Leasing

27 CAPITAL POSITION F I N A N C I A L R E V I E W : H I S T O R I C A L C A P I T A L P O S I T I O N HI GHLIGHTS • Corporate governance requires periodic assessment of capital minimums • Financial and strategic planning emphasize capital • Capital planning includes stress testing for unexpected conditions and events 0% 5% 1 0% 1 5% 2 0 % 2 5 % 2 0 17 2 0 18 2 0 19 Q3 2020 Tier 1 Leverage Ratio 7.9% 10.1% 9.6% 8 .6% Tier 1 Risk - based Capital Ratio (RBC) 1 16% 20% 19% 14% Total Risk - based Capital Ratio 17% 21% 19% 15% Tier1 Capital Ratio (8% - Well - capitalized minimum) Total RBC Ratio (10% - Well - capitalized minimum) Tier 1 Leverage Ratio (5% - Well - capitalized minimum) T H E B A N C O R P I N C . C A P I T A L R A T I O S 2020 Q3 1 Tier 1 risk - based ratio is identical to Common Equity Tier 1 to risk weighted assets and has a 6.5% well capitalized minimum

28 F I N A N C I A L R E V I E W : E A R N I N G S A N D P R O F I T A B I L I T Y K E Y S T O A C H I E V I N G F I N A N C I A L T A R G E T S x Established a new Payments Ecosystem 2 . 0 which satisfies regulators and i s scalable x Invested in technology/innovation x Maintained an industry leading compliance & r i sk function x Expanded salesforce and marketing function in key markets x Attracted & retain the best talent x Build upon strong capital base through retained earnings x Lifted consent order: the 2014 consent order was l i f ted in May 2020 and the 2015 consent order i s pending review by regulators P E R F O R M A N C E M E T R I C S 2 0 1 7 2 0 1 8 2 0 1 9 Q 3 2 0 2 0 L O N G - T E R M T A R G E T S ROAE 7.0% 24.3% 11.6% 16.9% 1 20% ROAA 0.52% 2.07% 1.09% 1.48% 1 > 2.0% EPS $0.39 $1.55 $0.90 $0.40 Leverage Ratio 7.9% 10.1% 9.6% 8.6% 9% – 10% Total Assets $4.7B $4.4B $5.7B $6.2B ~$8.0B Efficiency Ratio 2 79% 71% 65% 57% 1 1 Annualized for the three months ended September 30, 2020. 2 Efficiency ratio calculated by dividing non - interest expense by the total of net interest income and non - interest income. Non - interest income excludes gains/losses from sales of securities, changes in valuation to Walnut Street, and the sales of the Health Savings Account portfolio, the European payments business and the IRA portfolio. Expense excludes $8.9 million of total civil money penalties in 2019. BY EXECUTING OUR STRATEGIC PLAN, WE EXPECT TO DELIVER MARKET - LEADING RETURNS & CREATE VALUE FOR SHAREHOLDERS