Attached files
| file | filename |
|---|---|
| EX-99.1 - EX-99.1 - TE Connectivity Ltd. | tel-20201028xex99d1.htm |
| 8-K - 8-K - TE Connectivity Ltd. | tel-20201028x8k.htm |
Exhibit 99.2
| EVERY CONNECTION COUNTS TE Connectivity Fourth Quarter 2020 Earnings October 28, 2020 |

| © 2020 TE Connectivity. Confidential & Proprietary. Do not reproduce or distribute externally including non-authorized representatives and distributors. Create a sustainable future by limiting print copies, and recycling paper. Forward-Looking Statements This presentation contains certain "forward-looking statements" within the meaning of the U.S. Private Securities Litigation Reform Act of 1995. These statements are based on management's current expectations and are subject to risks, uncertainty and changes in circumstances, which may cause actual results, performance, financial condition or achievements to differ materially from anticipated results, performance, financial condition or achievements. All statements contained herein that are not clearly historical in nature are forward-looking and the words "anticipate," "believe," "expect," "estimate," "plan," and similar expressions are generally intended to identify forward-looking statements. We have no intention and are under no obligation to update or alter (and expressly disclaim any such intention or obligation to do so) our forward-looking statements whether as a result of new information, future events or otherwise, except to the extent required by law. The forward-looking statements in this presentation include statements addressing our future financial condition and operating results, and the impact on our operations resulting from the coronavirus disease 2019 (“COVID-19”). Examples of factors that could cause actual results to differ materially from those described in the forward-looking statements include, among others, the extent, severity and duration of COVID- 19 negatively affecting our business operations; business, economic, competitive and regulatory risks, such as conditions affecting demand for products in the automotive and other industries we serve; competition and pricing pressure; fluctuations in foreign currency exchange rates and commodity prices; natural disasters and political, economic and military instability in countries in which we operate; developments in the credit markets; future goodwill impairment; compliance with current and future environmental and other laws and regulations; and the possible effects on us of changes in tax laws, tax treaties and other legislation, including the effects of Swiss tax reform. In addition, the extent to which COVID-19 will impact our business and our financial results will depend on future developments, which are highly uncertain and cannot be predicted. Such developments may include the geographic spread of the virus, the severity of the virus, the duration of the outbreak, the impact on our suppliers’ and customers’ supply chains, the actions that may be taken by various governmental authorities in response to the outbreak in jurisdictions in which we operate, and the possible impact on the global economy and local economies in which we operate. More detailed information about these and other factors is set forth in TE Connectivity Ltd.'s Annual Report on Form 10-K for the fiscal year ended Sept. 27, 2019 as well as in our Quarterly Reports on Form 10-Q, Current Reports on Form 8-K and other reports filed by us with the U.S. Securities and Exchange Commission. Non-GAAP Financial Measures Where we have used non-GAAP financial measures, reconciliations to the most comparable GAAP measure are provided, along with a disclosure on the usefulness of the non-GAAP financial measure, in this presentation. Forward-Looking Statements and Non-GAAP Financial Measures 2 |
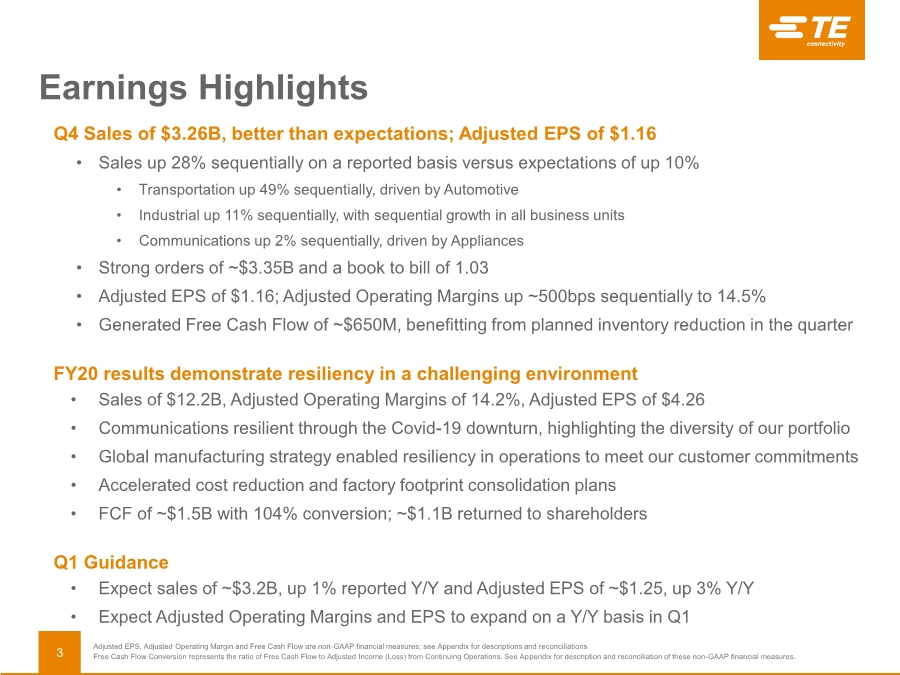
| © 2020 TE Connectivity. Confidential & Proprietary. Do not reproduce or distribute externally including non-authorized representatives and distributors. Create a sustainable future by limiting print copies, and recycling paper. Earnings Highlights Q4 Sales of $3.26B, better than expectations; Adjusted EPS of $1.16 • Sales up 28% sequentially on a reported basis versus expectations of up 10% • Transportation up 49% sequentially, driven by Automotive • Industrial up 11% sequentially, with sequential growth in all business units • Communications up 2% sequentially, driven by Appliances • Strong orders of ~$3.35B and a book to bill of 1.03 • Adjusted EPS of $1.16; Adjusted Operating Margins up ~500bps sequentially to 14.5% • Generated Free Cash Flow of ~$650M, benefitting from planned inventory reduction in the quarter FY20 results demonstrate resiliency in a challenging environment • Sales of $12.2B, Adjusted Operating Margins of 14.2%, Adjusted EPS of $4.26 • Communications resilient through the Covid-19 downturn, highlighting the diversity of our portfolio • Global manufacturing strategy enabled resiliency in operations to meet our customer commitments • Accelerated cost reduction and factory footprint consolidation plans • FCF of ~$1.5B with 104% conversion; ~$1.1B returned to shareholders Q1 Guidance • Expect sales of ~$3.2B, up 1% reported Y/Y and Adjusted EPS of ~$1.25, up 3% Y/Y • Expect Adjusted Operating Margins and EPS to expand on a Y/Y basis in Q1 Adjusted EPS, Adjusted Operating Margin and Free Cash Flow are non-GAAP financial measures; see Appendix for descriptions and reconciliations Free Cash Flow Conversion represents the ratio of Free Cash Flow to Adjusted Income (Loss) from Continuing Operations. See Appendix for description and reconciliation of these non-GAAP financial measures. 3 |
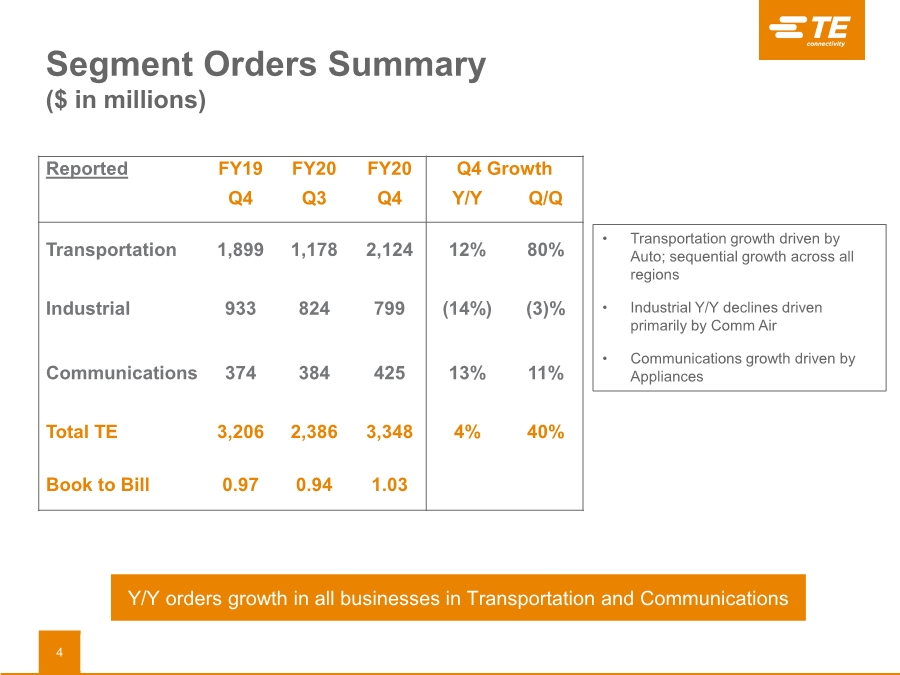
| © 2020 TE Connectivity. Confidential & Proprietary. Do not reproduce or distribute externally including non-authorized representatives and distributors. Create a sustainable future by limiting print copies, and recycling paper. Reported FY19 FY20 FY20 Q4 Growth Q4 Q3 Q4 Y/Y Q/Q Transportation 1,899 1,178 2,124 12% 80% Industrial 933 824 799 (14%) (3)% Communications 374 384 425 13% 11% Total TE 3,206 2,386 3,348 4% 40% Book to Bill 0.97 0.94 1.03 Segment Orders Summary ($ in millions) 4 • Transportation growth driven by Auto; sequential growth across all regions • Industrial Y/Y declines driven primarily by Comm Air • Communications growth driven by Appliances Y/Y orders growth in all businesses in Transportation and Communications |
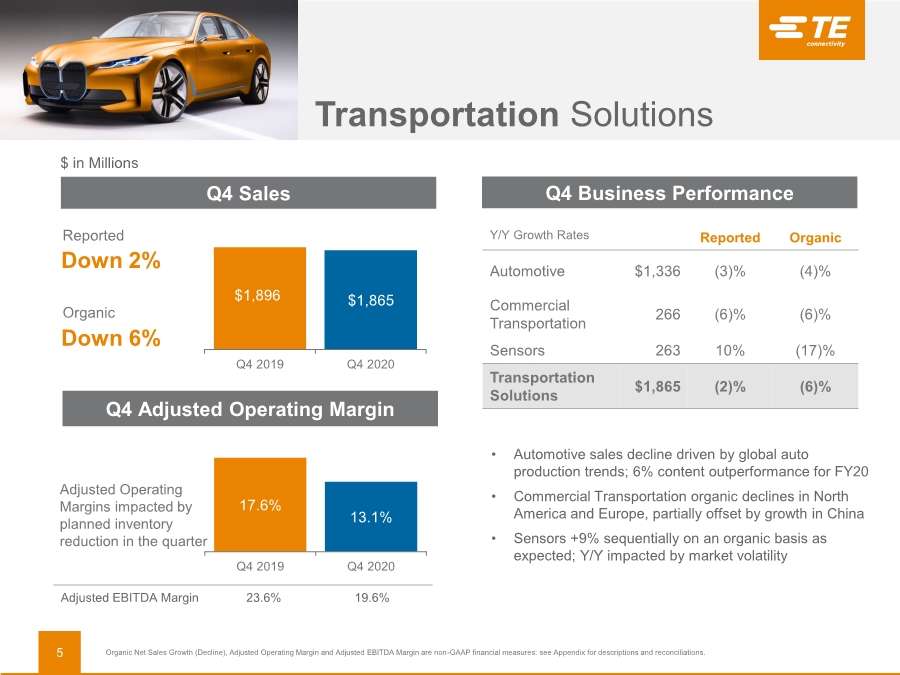
| © 2020 TE Connectivity. Confidential & Proprietary. Do not reproduce or distribute externally including non-authorized representatives and distributors. Create a sustainable future by limiting print copies, and recycling paper. Transportation Solutions $1,896 $1,865 Q4 2019 Q4 2020 • Automotive sales decline driven by global auto production trends; 6% content outperformance for FY20 • Commercial Transportation organic declines in North America and Europe, partially offset by growth in China • Sensors +9% sequentially on an organic basis as expected; Y/Y impacted by market volatility Y/Y Growth Rates Reported Organic Automotive $1,336 (3)% (4)% Commercial Transportation 266 (6)% (6)% Sensors 263 10% (17)% Transportation Solutions $1,865 (2)% (6)% Organic Net Sales Growth (Decline), Adjusted Operating Margin and Adjusted EBITDA Margin are non-GAAP financial measures: see Appendix for descriptions and reconciliations. Q4 Sales Q4 Business Performance Q4 Adjusted Operating Margin $ in Millions Reported Down 2% Organic Down 6% Adjusted Operating Margins impacted by planned inventory reduction in the quarter Adjusted EBITDA Margin 23.6% 19.6% 5 17.6% 13.1% Q4 2019 Q4 2020 |
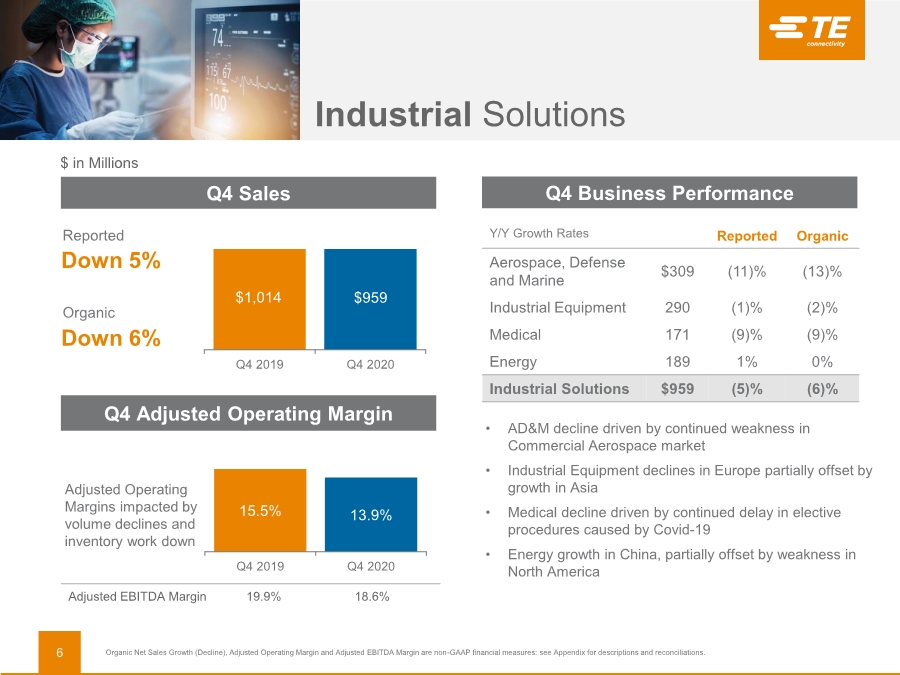
| © 2020 TE Connectivity. Confidential & Proprietary. Do not reproduce or distribute externally including non-authorized representatives and distributors. Create a sustainable future by limiting print copies, and recycling paper. Industrial Solutions $1,014 $959 Q4 2019 Q4 2020 Y/Y Growth Rates Reported Organic Aerospace, Defense and Marine $309 (11)% (13)% Industrial Equipment 290 (1)% (2)% Medical 171 (9)% (9)% Energy 189 1% 0% Industrial Solutions $959 (5)% (6)% Adjusted Operating Margins impacted by volume declines and inventory work down 15.5% 13.9% Q4 2019 Q4 2020 Adjusted EBITDA Margin 19.9% 18.6% • AD&M decline driven by continued weakness in Commercial Aerospace market • Industrial Equipment declines in Europe partially offset by growth in Asia • Medical decline driven by continued delay in elective procedures caused by Covid-19 • Energy growth in China, partially offset by weakness in North America $ in Millions Q4 Sales Q4 Business Performance Q4 Adjusted Operating Margin Reported Down 5% Organic Down 6% 6 Organic Net Sales Growth (Decline), Adjusted Operating Margin and Adjusted EBITDA Margin are non-GAAP financial measures: see Appendix for descriptions and reconciliations. |
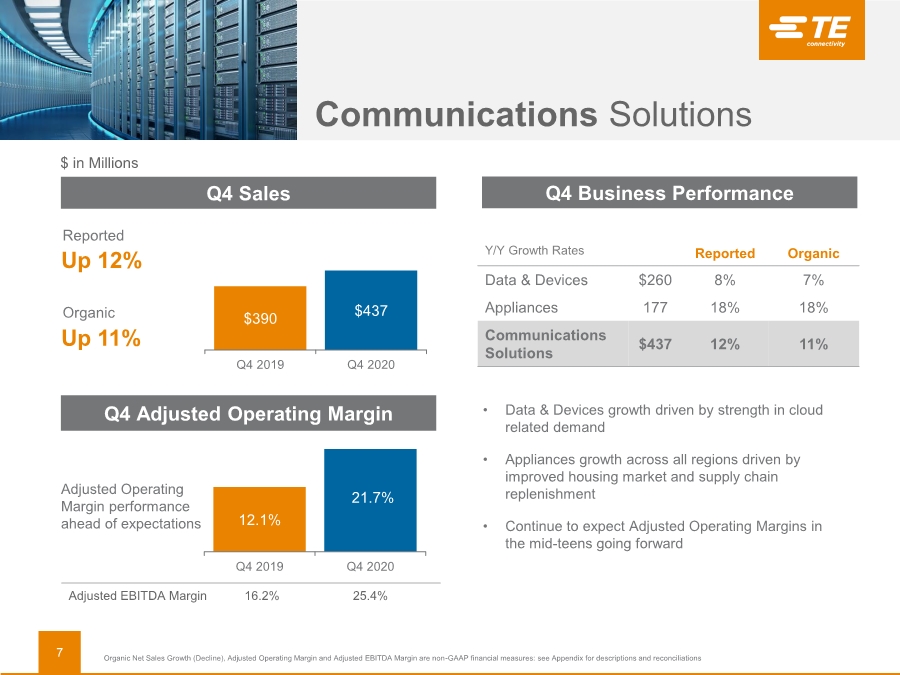
| © 2020 TE Connectivity. Confidential & Proprietary. Do not reproduce or distribute externally including non-authorized representatives and distributors. Create a sustainable future by limiting print copies, and recycling paper. $390 $437 Q4 2019 Q4 2020 Reported Up 12% Organic Up 11% Y/Y Growth Rates Reported Organic Data & Devices $260 8% 7% Appliances 177 18% 18% Communications Solutions $437 12% 11% • Data & Devices growth driven by strength in cloud related demand • Appliances growth across all regions driven by improved housing market and supply chain replenishment • Continue to expect Adjusted Operating Margins in the mid-teens going forward 12.1% 21.7% Q4 2019 Q4 2020 Adjusted Operating Margin performance ahead of expectations Organic Net Sales Growth (Decline), Adjusted Operating Margin and Adjusted EBITDA Margin are non-GAAP financial measures: see Appendix for descriptions and reconciliations Communications Solutions Q4 Sales Q4 Adjusted Operating Margin Q4 Business Performance $ in Millions Adjusted EBITDA Margin 16.2% 25.4% 7 |
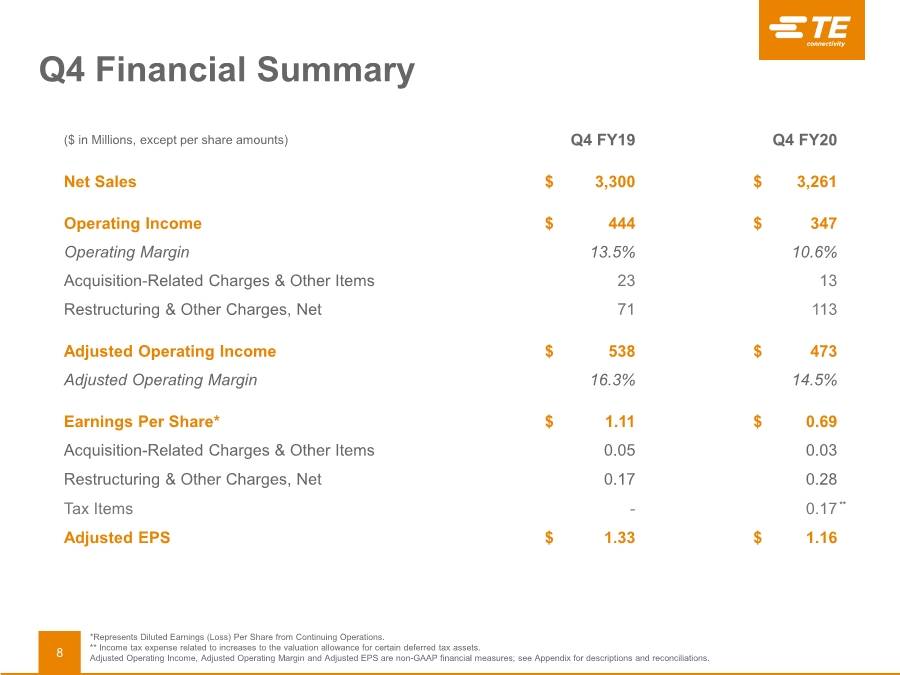
| © 2020 TE Connectivity. Confidential & Proprietary. Do not reproduce or distribute externally including non-authorized representatives and distributors. Create a sustainable future by limiting print copies, and recycling paper. Q4 Financial Summary ($ in Millions, except per share amounts) Q4 FY19 Q4 FY20 Net Sales $ 3,300 $ 3,261 Operating Income $ 444 $ 347 Operating Margin 13.5% 10.6% Acquisition-Related Charges & Other Items 23 13 Restructuring & Other Charges, Net 71 113 Adjusted Operating Income $ 538 $ 473 Adjusted Operating Margin 16.3% 14.5% Earnings Per Share* $ 1.11 $ 0.69 Acquisition-Related Charges & Other Items 0.05 0.03 Restructuring & Other Charges, Net 0.17 0.28 Tax Items - 0.17 Adjusted EPS $ 1.33 $ 1.16 *Represents Diluted Earnings (Loss) Per Share from Continuing Operations. ** Income tax expense related to increases to the valuation allowance for certain deferred tax assets. Adjusted Operating Income, Adjusted Operating Margin and Adjusted EPS are non-GAAP financial measures; see Appendix for descriptions and reconciliations. 8 ** |
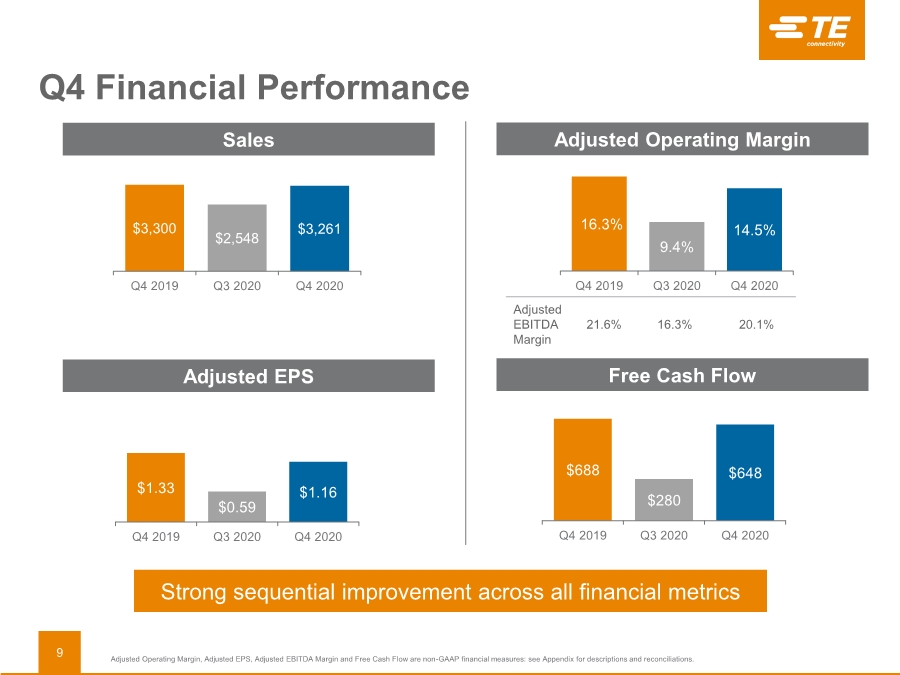
| © 2020 TE Connectivity. Confidential & Proprietary. Do not reproduce or distribute externally including non-authorized representatives and distributors. Create a sustainable future by limiting print copies, and recycling paper. Q4 Financial Performance $3,300 $2,548 $3,261 Q4 2019 Q3 2020 Q4 2020 $1.33 $0.59 $1.16 Q4 2019 Q3 2020 Q4 2020 Adjusted EBITDA Margin 21.6% 16.3% 20.1% 16.3% 9.4% 14.5% Q4 2019 Q3 2020 Q4 2020 Adjusted Operating Margin, Adjusted EPS, Adjusted EBITDA Margin and Free Cash Flow are non-GAAP financial measures: see Appendix for descriptions and reconciliations. Sales Adjusted Operating Margin Free Cash Flow Adjusted EPS Strong sequential improvement across all financial metrics 9 $688 $280 $648 Q4 2019 Q3 2020 Q4 2020 |
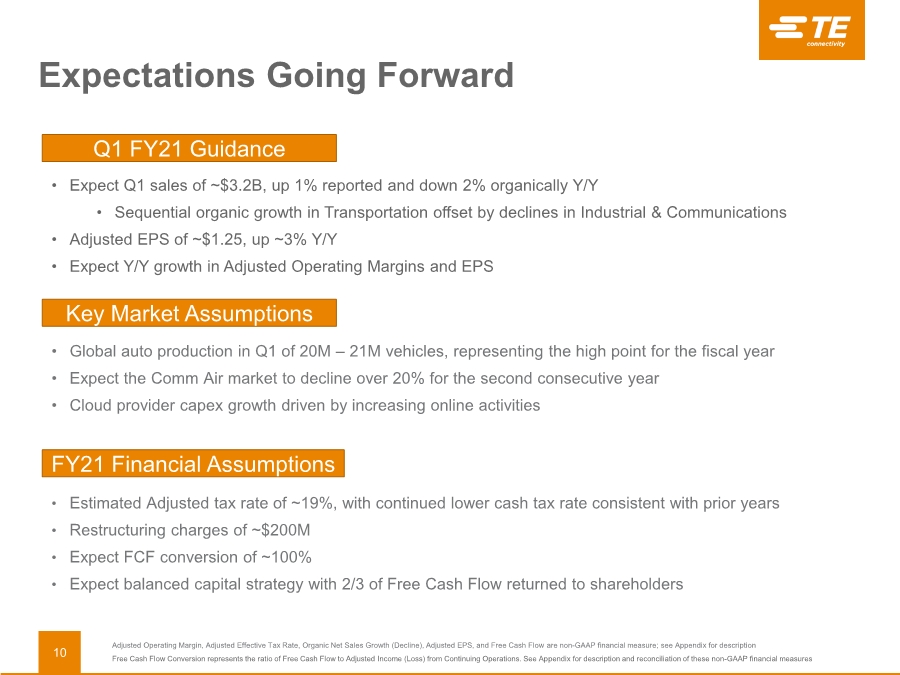
| © 2020 TE Connectivity. Confidential & Proprietary. Do not reproduce or distribute externally including non-authorized representatives and distributors. Create a sustainable future by limiting print copies, and recycling paper. Expectations Going Forward • Global auto production in Q1 of 20M – 21M vehicles, representing the high point for the fiscal year • Expect the Comm Air market to decline over 20% for the second consecutive year • Cloud provider capex growth driven by increasing online activities Adjusted Operating Margin, Adjusted Effective Tax Rate, Organic Net Sales Growth (Decline), Adjusted EPS, and Free Cash Flow are non-GAAP financial measure; see Appendix for description Free Cash Flow Conversion represents the ratio of Free Cash Flow to Adjusted Income (Loss) from Continuing Operations. See Appendix for description and reconciliation of these non-GAAP financial measures 10 • Estimated Adjusted tax rate of ~19%, with continued lower cash tax rate consistent with prior years • Restructuring charges of ~$200M • Expect FCF conversion of ~100% • Expect balanced capital strategy with 2/3 of Free Cash Flow returned to shareholders • Expect Q1 sales of ~$3.2B, up 1% reported and down 2% organically Y/Y • Sequential organic growth in Transportation offset by declines in Industrial & Communications • Adjusted EPS of ~$1.25, up ~3% Y/Y • Expect Y/Y growth in Adjusted Operating Margins and EPS Q1 FY21 Guidance Key Market Assumptions FY21 Financial Assumptions |
| EVERY CONNECTION COUNTS Additional Information |

| © 2020 TE Connectivity. Confidential & Proprietary. Do not reproduce or distribute externally including non-authorized representatives and distributors. Create a sustainable future by limiting print copies, and recycling paper. Y/Y Q4 2020 Adjusted EPS is a non-GAAP financial measure; See Appendix for description and reconciliation. Sales (in millions) Adjusted EPS Q4 2019 Results $3,300 $1.33 Operational Performance (78) (0.19) FX Impact 39 0.04 Tax Rate Impact -(0.02) Q4 2020 Results $3,261 $1.16 12 |

| © 2020 TE Connectivity. Confidential & Proprietary. Do not reproduce or distribute externally including non-authorized representatives and distributors. Create a sustainable future by limiting print copies, and recycling paper. Y/Y FY 2020 Adjusted EPS is a non-GAAP financial measure; See Appendix for description and reconciliation. Sales (in millions) Adjusted EPS 2019 Results $13,448 $5.55 Operational Performance (1,177) (1.23) FX Impact (99) 0.02 Tax Rate Impact -(0.08) 2020 Results $12,172 $4.26 13 |

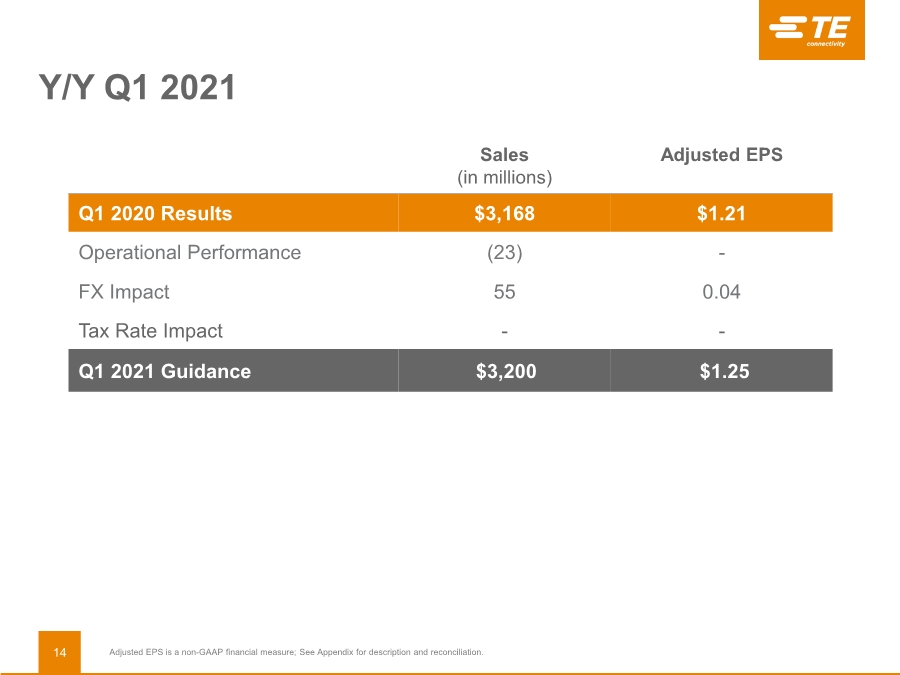
| © 2020 TE Connectivity. Confidential & Proprietary. Do not reproduce or distribute externally including non-authorized representatives and distributors. Create a sustainable future by limiting print copies, and recycling paper. Y/Y Q1 2021 Adjusted EPS is a non-GAAP financial measure; See Appendix for description and reconciliation. Sales (in millions) Adjusted EPS Q1 2020 Results $3,168 $1.21 Operational Performance (23) - FX Impact 55 0.04 Tax Rate Impact -- Q1 2021 Guidance $3,200 $1.25 14 |
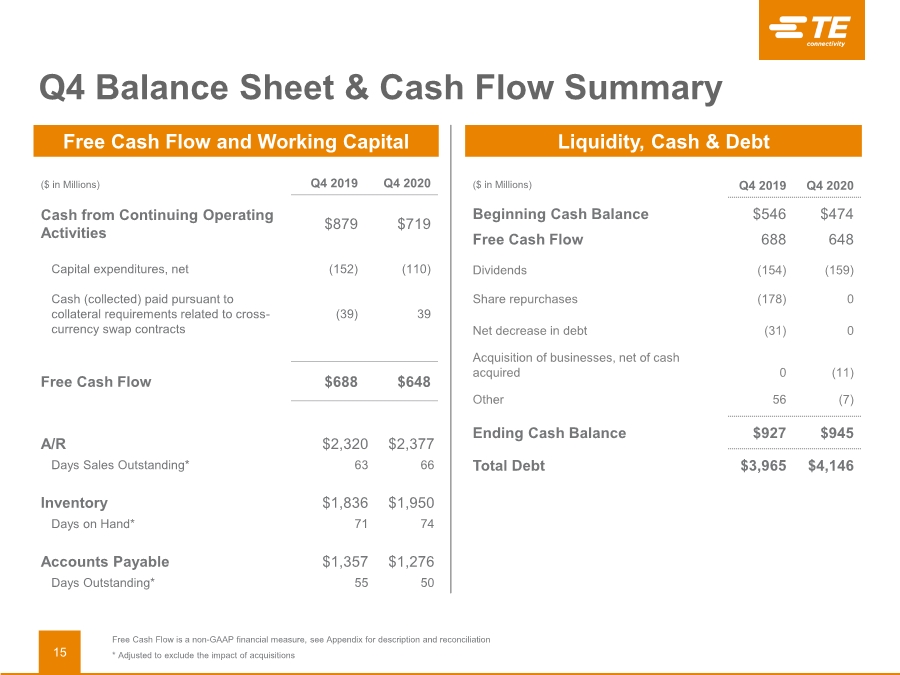
| © 2020 TE Connectivity. Confidential & Proprietary. Do not reproduce or distribute externally including non-authorized representatives and distributors. Create a sustainable future by limiting print copies, and recycling paper. ($ in Millions) Q4 2019 Q4 2020 Beginning Cash Balance $546 $474 Free Cash Flow 688 648 Dividends (154) (159) Share repurchases (178) 0 Net decrease in debt (31) 0 Acquisition of businesses, net of cash acquired 0 (11) Other 56 (7) Ending Cash Balance $927 $945 Total Debt $3,965 $4,146 A/R $2,320 $2,377 Days Sales Outstanding* 63 66 Inventory $1,836 $1,950 Days on Hand* 71 74 Accounts Payable $1,357 $1,276 Days Outstanding* 55 50 Free Cash Flow and Working Capital Liquidity, Cash & Debt ($ in Millions) Q4 2019 Q4 2020 Cash from Continuing Operating Activities $879 $719 Capital expenditures, net Cash (collected) paid pursuant to collateral requirements related to cross- currency swap contracts (152) (39) (110) 39 Free Cash Flow $688 $648 Free Cash Flow is a non-GAAP financial measure, see Appendix for description and reconciliation * Adjusted to exclude the impact of acquisitions Q4 Balance Sheet & Cash Flow Summary 15 |
| EVERY CONNECTION COUNTS Appendix |

| © 2020 TE Connectivity. Confidential & Proprietary. Do not reproduce or distribute externally including non-authorized representatives and distributors. Create a sustainable future by limiting print copies, and recycling paper. 17 Non-GAAP Financial Measures We present non-GAAP performance and liquidity measures as we believe it is appropriate for investors to consider adjusted financial measures in addition to results in accordance with accounting principles generally accepted in the U.S. (“GAAP”). These non-GAAP financial measures provide supplemental information and should not be considered replacements for results in accordance with GAAP. Management uses non-GAAP financial measures internally for planning and forecasting purposes and in its decision-making processes related to the operations of our company. We believe these measures provide meaningful information to us and investors because they enhance the understanding of our operating performance, ability to generate cash, and the trends of our business. Additionally, we believe that investors benefit from having access to the same financial measures that management uses in evaluating our operations. The primary limitation of these measures is that they exclude the financial impact of items that would otherwise either increase or decrease our reported results. This limitation is best addressed by using these non-GAAP financial measures in combination with the most directly comparable GAAP financial measures in order to better understand the amounts, character, and impact of any increase or decrease in reported amounts. These non-GAAP financial measures may not be comparable to similarly-titled measures reported by other companies. The following provides additional information regarding our non-GAAP financial measures: • Organic Net Sales Growth (Decline) – represents net sales growth (decline) (the most comparable GAAP financial measure) excluding the impact of foreign currency exchange rates, and acquisitions and divestitures that occurred in the preceding twelve months, if any. Organic Net Sales Growth (Decline) is a useful measure of our performance because it excludes items that are not completely under management’s control, such as the impact of changes in foreign currency exchange rates, and items that do not reflect the underlying growth of the company, such as acquisition and divestiture activity. This measure is a significant component in our incentive compensation plans. • Adjusted Operating Income (Loss) and Adjusted Operating Margin – represent operating income (loss) and operating margin, respectively, (the most comparable GAAP financial measures) before special items including restructuring and other charges, acquisition-related charges, impairment of goodwill, and other income or charges, if any. We utilize these adjusted measures in combination with operating income (loss) and operating margin to assess segment level operating performance and to provide insight to management in evaluating segment operating plan execution and market conditions. Adjusted Operating Income (Loss) is a significant component in our incentive compensation plans. • Adjusted Other Income (Expense), Net – represents net other income (expense) (the most comparable GAAP financial measure) before special items including tax sharing income related to adjustments to prior period tax returns and other items, if any. • Adjusted Income Tax (Expense) Benefit and Adjusted Effective Tax Rate – represent income tax (expense) benefit and effective tax rate, respectively, (the most comparable GAAP financial measures) after adjusting for the tax effect of special items including restructuring and other charges, acquisition-related charges, impairment of goodwill, other income or charges, and certain significant tax items, if any. • Adjusted Income (Loss) from Continuing Operations – represents income (loss) from continuing operations (the most comparable GAAP financial measure) before special items including restructuring and other charges, acquisition-related charges, impairment of goodwill, tax sharing income related to adjustments to prior period tax returns and other tax items, other income or charges, and certain significant tax items, if any, and, if applicable, the related tax effects. • Adjusted Earnings (Loss) Per Share – represents diluted earnings (loss) per share from continuing operations (the most comparable GAAP financial measure) before special items including restructuring and other charges, acquisition-related charges, impairment of goodwill, tax sharing income related to adjustments to prior period tax returns and other tax items, other income or charges, and certain significant tax items, if any, and, if applicable, the related tax effects. This measure is a significant component in our incentive compensation plans. |
| © 2020 TE Connectivity. Confidential & Proprietary. Do not reproduce or distribute externally including non-authorized representatives and distributors. Create a sustainable future by limiting print copies, and recycling paper. 18 • Adjusted EBITDA and Adjusted EBITDA Margin - represent net income (loss) and net income (loss) as a percentage of net sales, respectively, (the most comparable GAAP financial measures) before interest expense, interest income, income taxes, depreciation, and amortization, as adjusted for net other income, income from discontinued operations, and special items including restructuring and other charges, acquisition-related charges, impairment of goodwill, and other income or charges, if any. • Free Cash Flow (FCF) – is a useful measure of our ability to generate cash. The difference between net cash provided by continuing operating activities (the most comparable GAAP financial measure) and Free Cash Flow consists mainly of significant cash outflows and inflows that we believe are useful to identify. We believe Free Cash Flow provides useful information to investors as it provides insight into the primary cash flow metric used by management to monitor and evaluate cash flows generated from our operations. Free Cash Flow is defined as net cash provided by continuing operating activities excluding voluntary pension contributions and the cash impact of special items, if any, minus net capital expenditures. Voluntary pension contributions are excluded from the GAAP financial measure because this activity is driven by economic financing decisions rather than operating activity. Certain special items, including net payments related to pre-separation tax matters and cash paid (collected) pursuant to collateral requirements related to cross-currency swap contracts, are also excluded by management in evaluating Free Cash Flow. Net capital expenditures consist of capital expenditures less proceeds from the sale of property, plant, and equipment. These items are subtracted because they represent long-term commitments. In the calculation of Free Cash Flow, we subtract certain cash items that are ultimately within management’s and the Board of Directors’ discretion to direct and may imply that there is less or more cash available for our programs than the most comparable GAAP financial measure indicates. It should not be inferred that the entire Free Cash Flow amount is available for future discretionary expenditures, as our definition of Free Cash Flow does not consider certain non-discretionary expenditures, such as debt payments. In addition, we may have other discretionary expenditures, such as discretionary dividends, share repurchases, and business acquisitions, that are not considered in the calculation of Free Cash Flow. • Free Cash Flow Conversion – represents the ratio of Free Cash Flow to Adjusted Income (Loss) from Continuing Operations. We use Free Cash Flow Conversion as an indicator of our ability to convert earnings to cash. • Adjusted Return on Invested Capital (ROIC) – represents adjusted net operating profit after tax divided by average invested capital. We use Adjusted Return on Invested Capital as an indicator of our capital efficiency. Adjusted Return on Invested Capital is not a measure defined by GAAP. It is calculated by us, in part, using non-GAAP financial measures. We are providing our calculation of Adjusted Return on Invested Capital as this measure may not be defined and calculated by other companies in the same manner. Non-GAAP Financial Measures (cont.) |
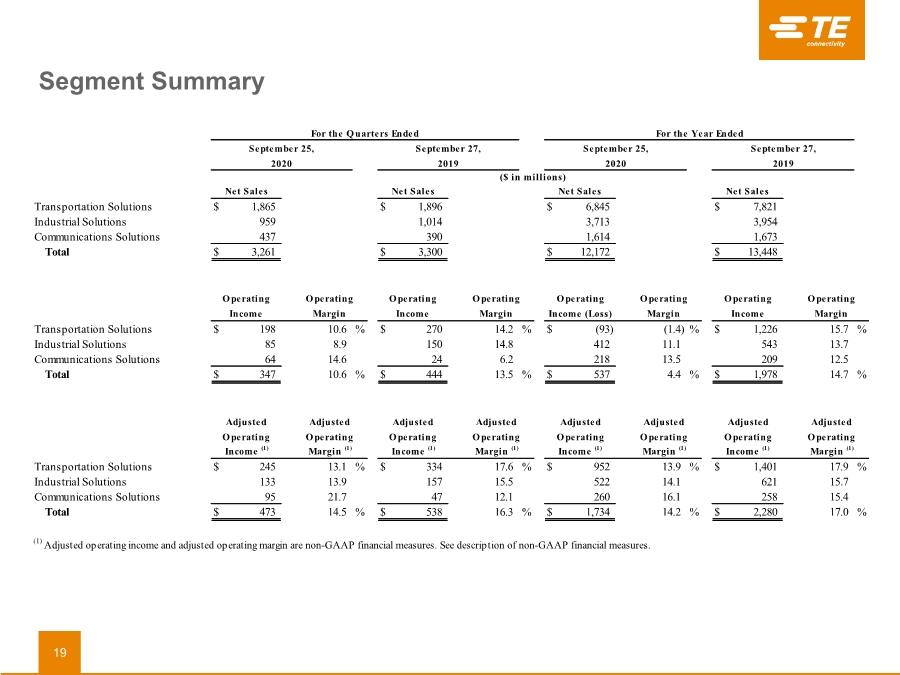
| © 2020 TE Connectivity. Confidential & Proprietary. Do not reproduce or distribute externally including non-authorized representatives and distributors. Create a sustainable future by limiting print copies, and recycling paper. Segment Summary 19 Transportation Solutions $ 1,865 $ 1,896 $ 6,845 $ 7,821 Industrial Solutions 959 1,014 3,713 3,954 Communications Solutions 437 390 1,614 1,673 Total $ 3,261 $ 3,300 $ 12,172 $ 13,448 Transportation Solutions $ 198 10.6 % $ 270 14.2 % $ (93) (1.4) % $ 1,226 15.7 % Industrial Solutions 85 8.9 150 14.8 412 11.1 543 13.7 Communications Solutions 64 14.6 24 6.2 218 13.5 209 12.5 Total $ 347 10.6 % $ 444 13.5 % $ 537 4.4 % $ 1,978 14.7 % Transportation Solutions $ 245 13.1 % $ 334 17.6 % $ 952 13.9 % $ 1,401 17.9 % Industrial Solutions 133 13.9 157 15.5 522 14.1 621 15.7 Communications Solutions 95 21.7 47 12.1 260 16.1 258 15.4 Total $ 473 14.5 % $ 538 16.3 % $ 1,734 14.2 % $ 2,280 17.0 % 2020 For the Year Ended 2019 For the Quarters Ended September 25, September 27, September 25, September 27, Net Sales Operating Income Net Sales Net Sales Net Sales Income (1) Adjusted Operating Income (1) Income Operating Operating Income Operating Income (Loss) (1) Adjusted operating income and adjusted operating margin are non-GAAP financial measures. See description of non-GAAP financial measures. 2020 2019 ($ in millions) Operating Margin (1) Adjusted Operating Margin (1) Adjusted Operating Income (1) Adjusted Operating Adjusted Operating Income (1) Operating Margin Operating Margin Operating Margin Operating Margin Adjusted Operating Margin (1) Adjusted Operating Margin (1) Adjusted |
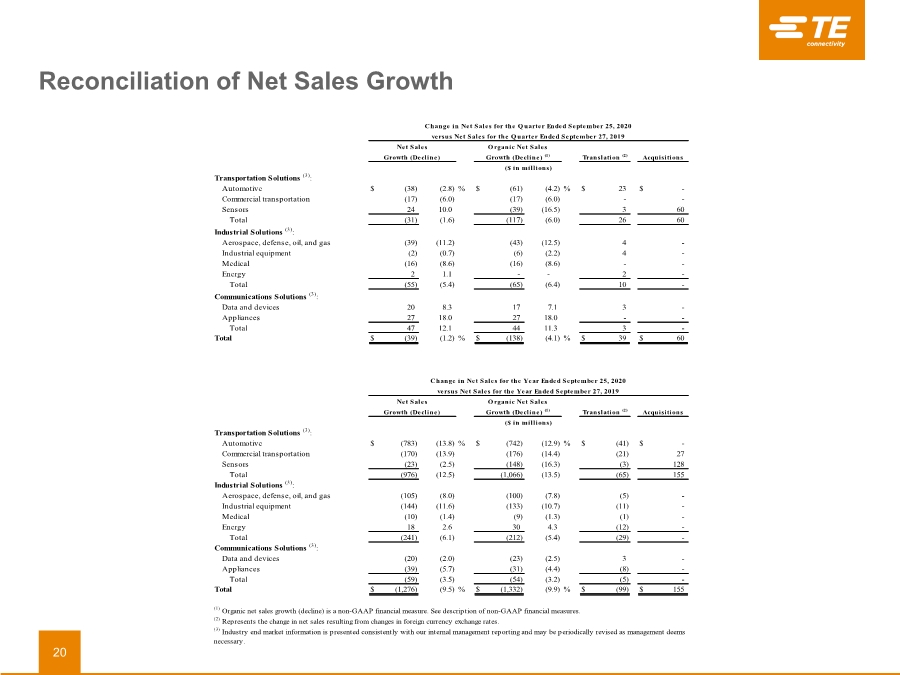
| © 2020 TE Connectivity. Confidential & Proprietary. Do not reproduce or distribute externally including non-authorized representatives and distributors. Create a sustainable future by limiting print copies, and recycling paper. Reconciliation of Net Sales Growth 20 Transportation Solutions (3): Automotive $ (38) (2.8) % $ (61) (4.2) % $ 23 $ - Commercial transportation (17) (6.0) (17) (6.0) - - Sensors 24 10.0 (39) (16.5) 3 60 Total (31) (1.6) (117) (6.0) 26 60 Industrial Solutions (3): Aerospace, defense, oil, and gas (39) (11.2) (43) (12.5) 4 - Industrial equipment (2) (0.7) (6) (2.2) 4 - Medical (16) (8.6) (16) (8.6) - - Energy 2 1.1 - - 2 - Total (55) (5.4) (65) (6.4) 10 - Communications Solutions (3): Data and devices 20 8.3 17 7.1 3 - Appliances 27 18.0 27 18.0 - - Total 47 12.1 44 11.3 3 - Total $ (39) (1.2) % $ (138) (4.1) % $ 39 $ 60 Transportation Solutions (3): Automotive $ (783) (13.8) % $ (742) (12.9) % $ (41) $ - Commercial transportation (170) (13.9) (176) (14.4) (21) 27 Sensors (23) (2.5) (148) (16.3) (3) 128 Total (976) (12.5) (1,066) (13.5) (65) 155 Industrial Solutions (3): Aerospace, defense, oil, and gas (105) (8.0) (100) (7.8) (5) - Industrial equipment (144) (11.6) (133) (10.7) (11) - Medical (10) (1.4) (9) (1.3) (1) - Energy 18 2.6 30 4.3 (12) - Total (241) (6.1) (212) (5.4) (29) - Communications Solutions (3): Data and devices (20) (2.0) (23) (2.5) 3 - Appliances (39) (5.7) (31) (4.4) (8) - Total (59) (3.5) (54) (3.2) (5) - Total $ (1,276) (9.5) % $ (1,332) (9.9) % $ (99) $ 155 (1) Organic net sales growth (decline) is a non-GAAP financial measure. See description of non-GAAP financial measures. (2) Represents the change in net sales resulting from changes in foreign currency exchange rates. (3) Industry end market information is presented consistently with our internal management reporting and may be periodically revised as management deems necessary. ($ in millions) Net Sales Growth (Decline) Organic Net Sales Growth (Decline) (1) Change in Net Sales for the Quarter Ended September 25, 2020 versus Net Sales for the Quarter Ended September 27, 2019 Net Sales Organic Net Sales Growth (Decline) Growth (Decline) (1) Translation (2) Acquisitions Change in Net Sales for the Year Ended September 25, 2020 versus Net Sales for the Year Ended September 27, 2019 ($ in millions) Translation (2) Acquisitions |
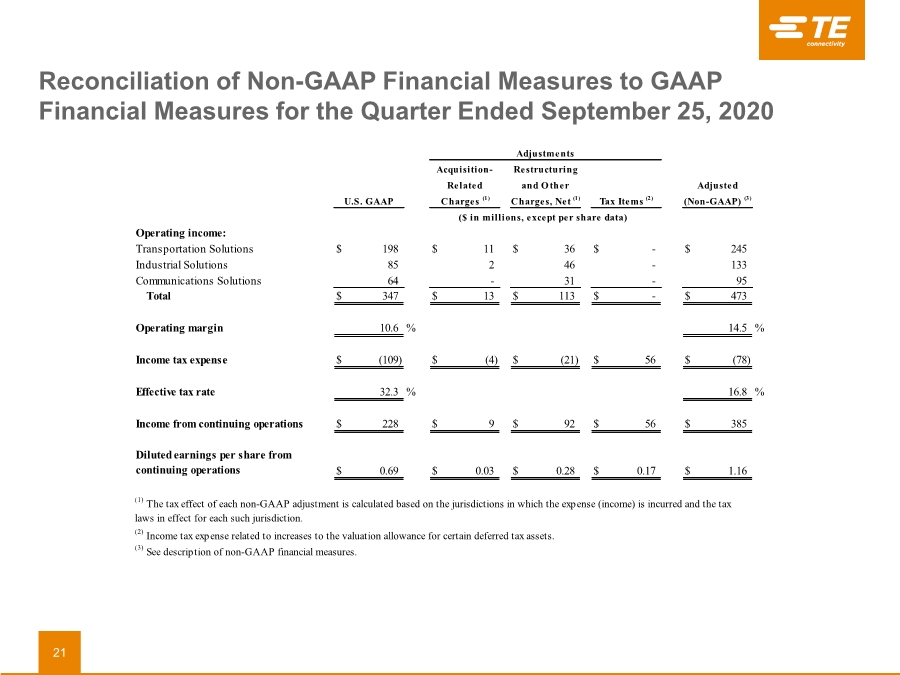
| © 2020 TE Connectivity. Confidential & Proprietary. Do not reproduce or distribute externally including non-authorized representatives and distributors. Create a sustainable future by limiting print copies, and recycling paper. Reconciliation of Non-GAAP Financial Measures to GAAP Financial Measures for the Quarter Ended September 25, 2020 21 Operating income: Transportation Solutions $ 198 $ 11 $ 36 $ - $ 245 Industrial Solutions 85 2 46 - 133 Communications Solutions 64 - 31 - 95 Total $ 347 $ 13 $ 113 $ - $ 473 Operating margin 10.6 % 14.5 % Income tax expense $ (109) $ (4) $ (21) $ 56 $ (78) Effective tax rate 32.3 % 16.8 % Income from continuing operations $ 228 $ 9 $ 92 $ 56 $ 385 Diluted earnings per share from continuing operations $ 0.69 $ 0.03 $ 0.28 $ 0.17 $ 1.16 (3) See description of non-GAAP financial measures. (1) The tax effect of each non-GAAP adjustment is calculated based on the jurisdictions in which the expense (income) is incurred and the tax laws in effect for each such jurisdiction. U.S. GAAP Charges (1) (Non-GAAP) (3) Charges, Net (1) Tax Items (2) ($ in millions, except per share data) (2) Income tax expense related to increases to the valuation allowance for certain deferred tax assets. Adjustments and Other Adjusted Related Acquisition- Restructuring |
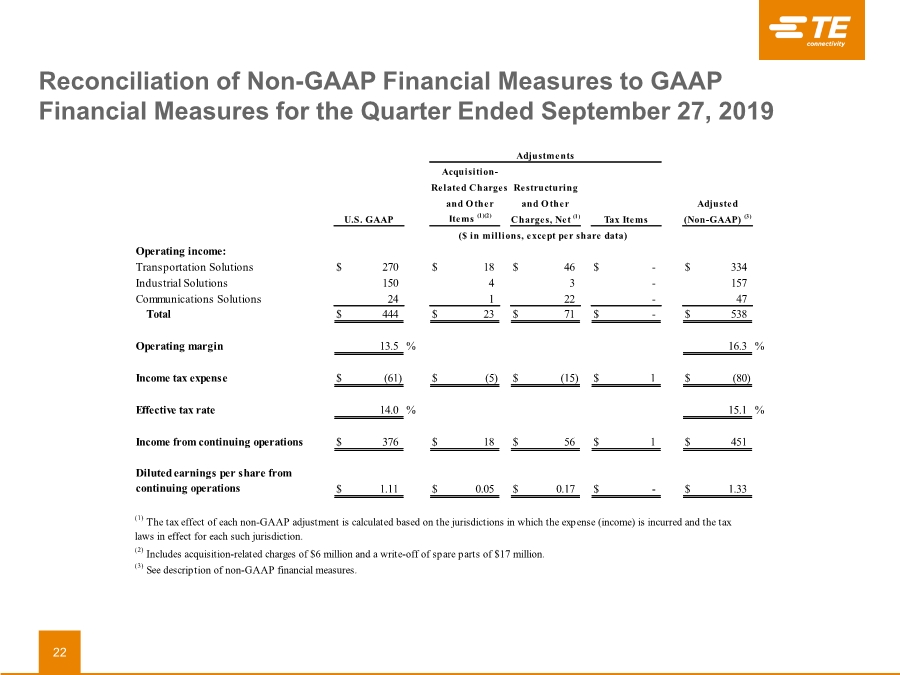
| © 2020 TE Connectivity. Confidential & Proprietary. Do not reproduce or distribute externally including non-authorized representatives and distributors. Create a sustainable future by limiting print copies, and recycling paper. Reconciliation of Non-GAAP Financial Measures to GAAP Financial Measures for the Quarter Ended September 27, 2019 22 Acquisition- Related Charges and Other Items (1)(2) Operating income: Transportation Solutions $ 270 $ 18 $ 46 $ - $ 334 Industrial Solutions 150 4 3 - 157 Communications Solutions 24 1 22 - 47 Total $ 444 $ 23 $ 71 $ - $ 538 Operating margin 13.5 % 16.3 % Income tax expense $ (61) $ (5) $ (15) $ 1 $ (80) Effective tax rate 14.0 % 15.1 % Income from continuing operations $ 376 $ 18 $ 56 $ 1 $ 451 Diluted earnings per share from continuing operations $ 1.11 $ 0.05 $ 0.17 $ - $ 1.33 and Other Restructuring Tax Items (3) See description of non-GAAP financial measures. (2) Includes acquisition-related charges of $6 million and a write-off of spare parts of $17 million. (1) The tax effect of each non-GAAP adjustment is calculated based on the jurisdictions in which the expense (income) is incurred and the tax laws in effect for each such jurisdiction. U.S. GAAP Adjustments Adjusted (Non-GAAP) (3) ($ in millions, except per share data) Charges, Net (1) |
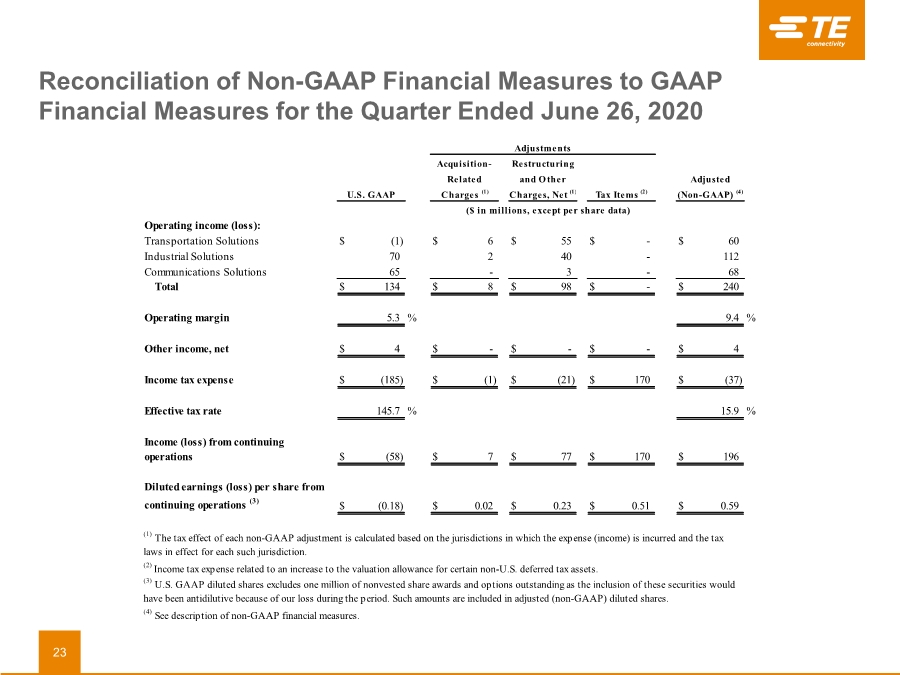
| © 2020 TE Connectivity. Confidential & Proprietary. Do not reproduce or distribute externally including non-authorized representatives and distributors. Create a sustainable future by limiting print copies, and recycling paper. Reconciliation of Non-GAAP Financial Measures to GAAP Financial Measures for the Quarter Ended June 26, 2020 23 Operating income (loss): Transportation Solutions $ (1) $ 6 $ 55 $ - $ 60 Industrial Solutions 70 2 40 - 112 Communications Solutions 65 - 3 - 68 Total $ 134 $ 8 $ 98 $ - $ 240 Operating margin 5.3 % 9.4 % Other income, net $ 4 $ - $ - $ - $ 4 Income tax expense $ (185) $ (1) $ (21) $ 170 $ (37) Effective tax rate 145.7 % 15.9 % Income (loss) from continuing operations $ (58) $ 7 $ 77 $ 170 $ 196 Diluted earnings (loss) per share from continuing operations (3) $ (0.18) $ 0.02 $ 0.23 $ 0.51 $ 0.59 Restructuring ($ in millions, except per share data) U.S. GAAP Acquisition- Related Charges (1) Charges, Net (1) Adjustments (2) Income tax expense related to an increase to the valuation allowance for certain non-U.S. deferred tax assets. (3) U.S. GAAP diluted shares excludes one million of nonvested share awards and options outstanding as the inclusion of these securities would have been antidilutive because of our loss during the period. Such amounts are included in adjusted (non-GAAP) diluted shares. (4) See description of non-GAAP financial measures. Adjusted (Non-GAAP) (4) (1) The tax effect of each non-GAAP adjustment is calculated based on the jurisdictions in which the expense (income) is incurred and the tax laws in effect for each such jurisdiction. Tax Items (2) and Other |
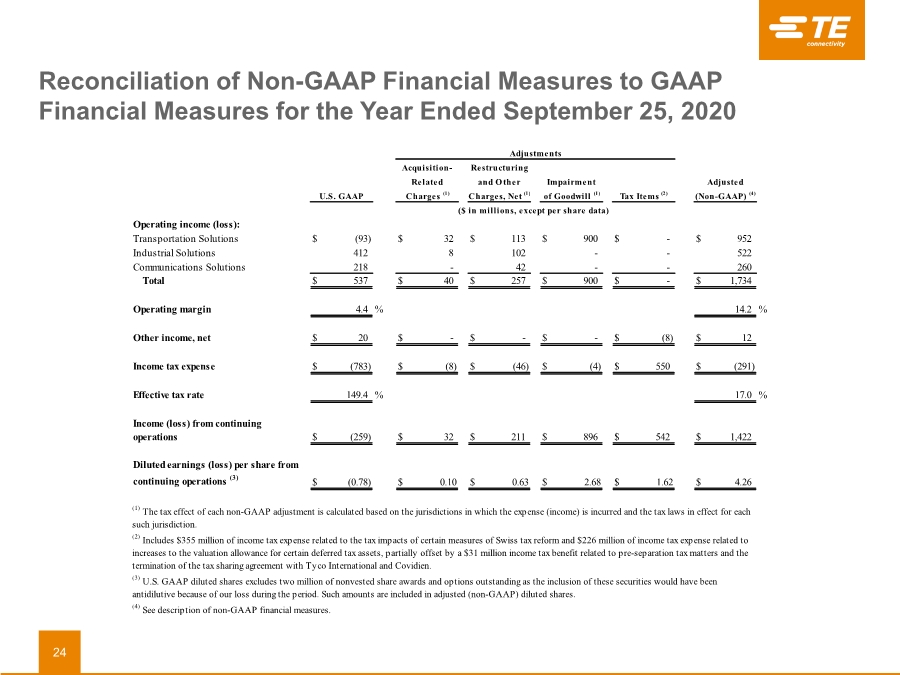
| © 2020 TE Connectivity. Confidential & Proprietary. Do not reproduce or distribute externally including non-authorized representatives and distributors. Create a sustainable future by limiting print copies, and recycling paper. Reconciliation of Non-GAAP Financial Measures to GAAP Financial Measures for the Year Ended September 25, 2020 24 Operating income (loss): Transportation Solutions $ (93) $ 32 $ 113 $ 900 $ - $ 952 Industrial Solutions 412 8 102 - - 522 Communications Solutions 218 - 42 - - 260 Total $ 537 $ 40 $ 257 $ 900 $ - $ 1,734 Operating margin 4.4 % 14.2 % Other income, net $ 20 $ - $ - $ - $ (8) $ 12 Income tax expense $ (783) $ (8) $ (46) $ (4) $ 550 $ (291) Effective tax rate 149.4 % 17.0 % Income (loss) from continuing operations $ (259) $ 32 $ 211 $ 896 $ 542 $ 1,422 Diluted earnings (loss) per share from continuing operations (3) $ (0.78) $ 0.10 $ 0.63 $ 2.68 $ 1.62 $ 4.26 ($ in millions, except per share data) (4) See description of non-GAAP financial measures. U.S. GAAP Adjustments Charges (1) Restructuring and Other Charges, Net (1) Related Tax Items (2) (Non-GAAP) (4) Adjusted (1) The tax effect of each non-GAAP adjustment is calculated based on the jurisdictions in which the expense (income) is incurred and the tax laws in effect for each such jurisdiction. (2) Includes $355 million of income tax expense related to the tax impacts of certain measures of Swiss tax reform and $226 million of income tax expense related to increases to the valuation allowance for certain deferred tax assets, partially offset by a $31 million income tax benefit related to pre-separation tax matters and the termination of the tax sharing agreement with Tyco International and Covidien. Acquisition- Impairment of Goodwill (1) (3) U.S. GAAP diluted shares excludes two million of nonvested share awards and options outstanding as the inclusion of these securities would have been antidilutive because of our loss during the period. Such amounts are included in adjusted (non-GAAP) diluted shares. |
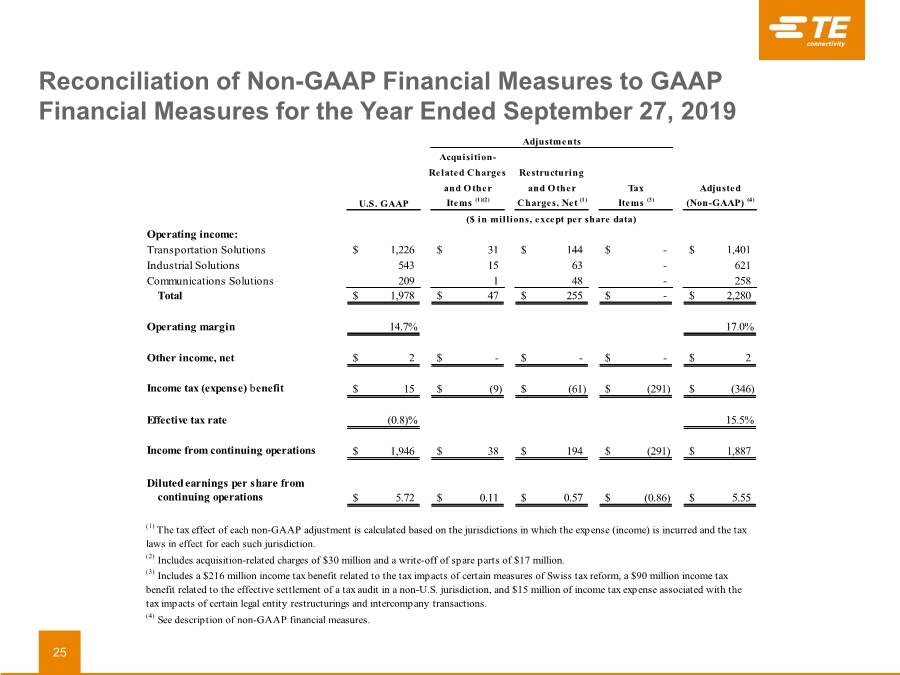
| © 2020 TE Connectivity. Confidential & Proprietary. Do not reproduce or distribute externally including non-authorized representatives and distributors. Create a sustainable future by limiting print copies, and recycling paper. Acquisition- Related Charges Restructuring and Other and Other Tax Adjusted U.S. GAAP Items (1)(2) Charges, Net (1) Items (3) (Non-GAAP) (4) Operating income: Transportation Solutions 1,226 $ 31 $ 144 $ - $ 1,401 $ Industrial Solutions 543 15 63 - 621 Communications Solutions 209 1 48 - 258 Total 1,978 $ 47 $ 255 $ - $ 2,280 $ Operating margin 14.7% 17.0% Other income, net 2 $ - $ - $ - $ 2 $ Income tax (expense) benefit 15 $ (9) $ (61) $ (291) $ (346) $ Effective tax rate (0.8)% 15.5% Income from continuing operations 1,946 $ 38 $ 194 $ (291) $ 1,887 $ Diluted earnings per share from continuing operations 5.72 $ 0.11 $ 0.57 $ (0.86) $ 5.55 $ Adjustments (4) See description of non-GAAP financial measures. ($ in millions, except per share data) (1) The tax effect of each non-GAAP adjustment is calculated based on the jurisdictions in which the expense (income) is incurred and the tax laws in effect for each such jurisdiction. (3) Includes a $216 million income tax benefit related to the tax impacts of certain measures of Swiss tax reform, a $90 million income tax benefit related to the effective settlement of a tax audit in a non-U.S. jurisdiction, and $15 million of income tax expense associated with the tax impacts of certain legal entity restructurings and intercompany transactions. (2) Includes acquisition-related charges of $30 million and a write-off of spare parts of $17 million. Reconciliation of Non-GAAP Financial Measures to GAAP Financial Measures for the Year Ended September 27, 2019 25 |
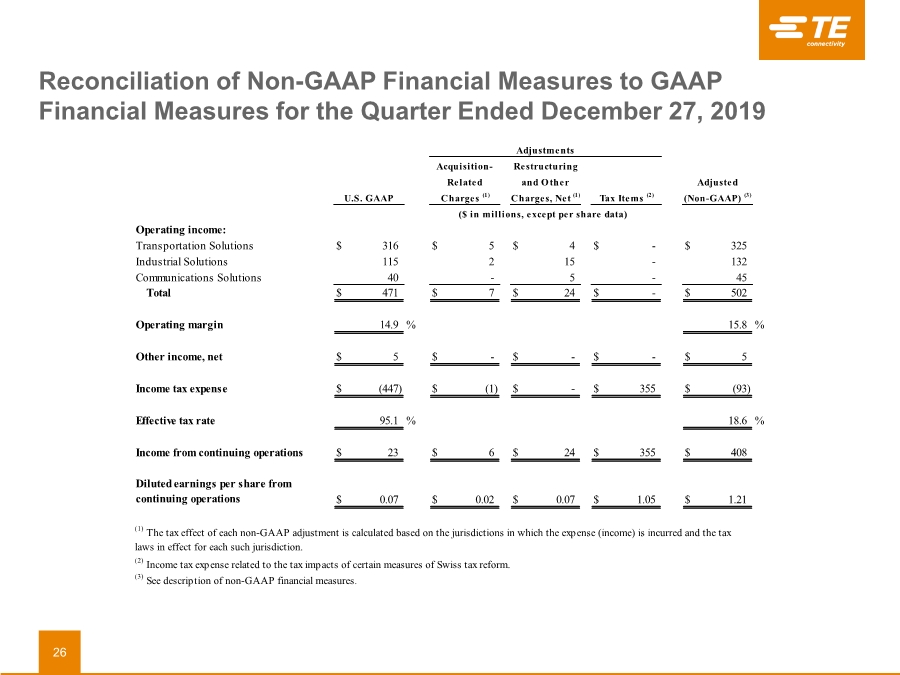
| © 2020 TE Connectivity. Confidential & Proprietary. Do not reproduce or distribute externally including non-authorized representatives and distributors. Create a sustainable future by limiting print copies, and recycling paper. Reconciliation of Non-GAAP Financial Measures to GAAP Financial Measures for the Quarter Ended December 27, 2019 26 Operating income: Transportation Solutions $ 316 $ 5 $ 4 $ - $ 325 Industrial Solutions 115 2 15 - 132 Communications Solutions 40 - 5 - 45 Total $ 471 $ 7 $ 24 $ - $ 502 Operating margin 14.9 % 15.8 % Other income, net $ 5 $ - $ - $ - $ 5 Income tax expense $ (447) $ (1) $ - $ 355 $ (93) Effective tax rate 95.1 % 18.6 % Income from continuing operations $ 23 $ 6 $ 24 $ 355 $ 408 Diluted earnings per share from continuing operations $ 0.07 $ 0.02 $ 0.07 $ 1.05 $ 1.21 U.S. GAAP Acquisition- Related Charges (1) Adjustments (3) See description of non-GAAP financial measures. (1) The tax effect of each non-GAAP adjustment is calculated based on the jurisdictions in which the expense (income) is incurred and the tax laws in effect for each such jurisdiction. (2) Income tax expense related to the tax impacts of certain measures of Swiss tax reform. Adjusted (Non-GAAP) (3) ($ in millions, except per share data) Restructuring and Other Charges, Net (1) Tax Items (2) |
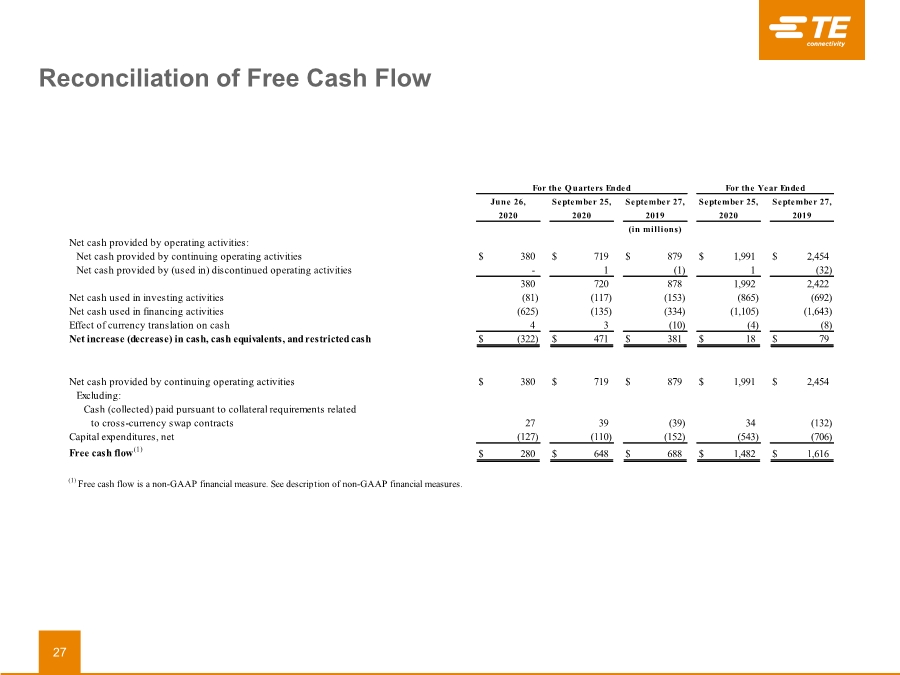
| © 2020 TE Connectivity. Confidential & Proprietary. Do not reproduce or distribute externally including non-authorized representatives and distributors. Create a sustainable future by limiting print copies, and recycling paper. Reconciliation of Free Cash Flow 27 Net cash provided by operating activities: Net cash provided by continuing operating activities $ 380 $ 719 $ 879 $ 1,991 $ 2,454 Net cash provided by (used in) discontinued operating activities - 1 (1) 1 (32) 380 720 878 1,992 2,422 Net cash used in investing activities (81) (117) (153) (865) (692) Net cash used in financing activities (625) (135) (334) (1,105) (1,643) Effect of currency translation on cash 4 3 (10) (4) (8) Net increase (decrease) in cash, cash equivalents, and restricted cash $ (322) $ 471 $ 381 $ 18 $ 79 Net cash provided by continuing operating activities $ 380 $ 719 $ 879 $ 1,991 $ 2,454 Excluding: Cash (collected) paid pursuant to collateral requirements related to cross-currency swap contracts 27 39 (39) 34 (132) Capital expenditures, net (127) (110) (152) (543) (706) Free cash flow (1) $ 280 $ 648 $ 688 $ 1,482 $ 1,616 September 25, 2020 September 27, 2019 September 25, (1) Free cash flow is a non-GAAP financial measure. See description of non-GAAP financial measures. For the Year Ended 2020 2019 September 27, (in millions) June 26, 2020 For the Quarters Ended |
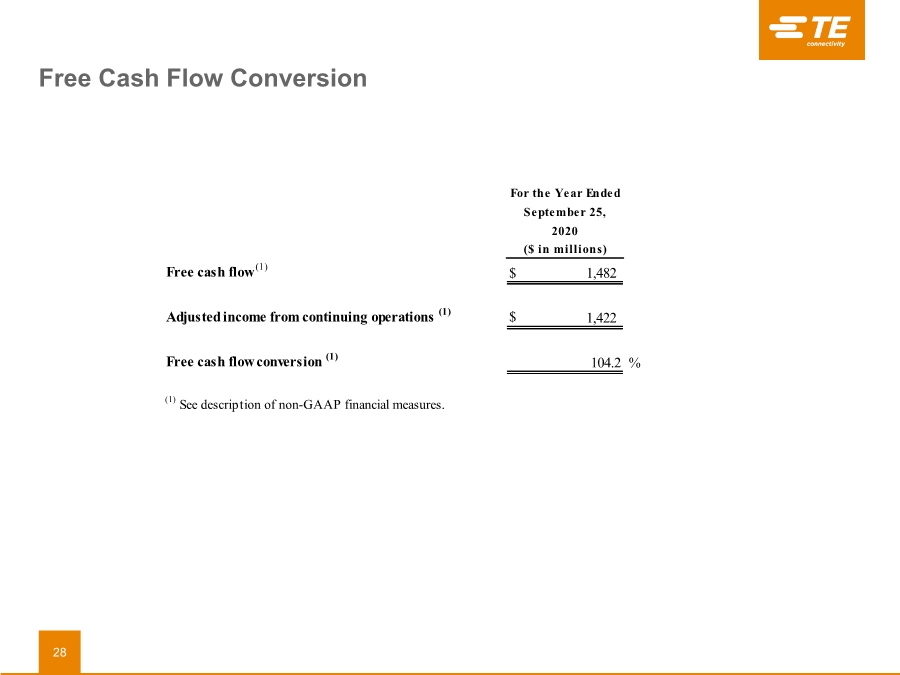
| © 2020 TE Connectivity. Confidential & Proprietary. Do not reproduce or distribute externally including non-authorized representatives and distributors. Create a sustainable future by limiting print copies, and recycling paper. Free Cash Flow Conversion 28 Free cash flow (1) $ 1,482 Adjusted income from continuing operations (1) $ 1,422 Free cash flow conversion (1) 104.2 % For the Year Ended September 25, 2020 ($ in millions) (1) See description of non-GAAP financial measures. |
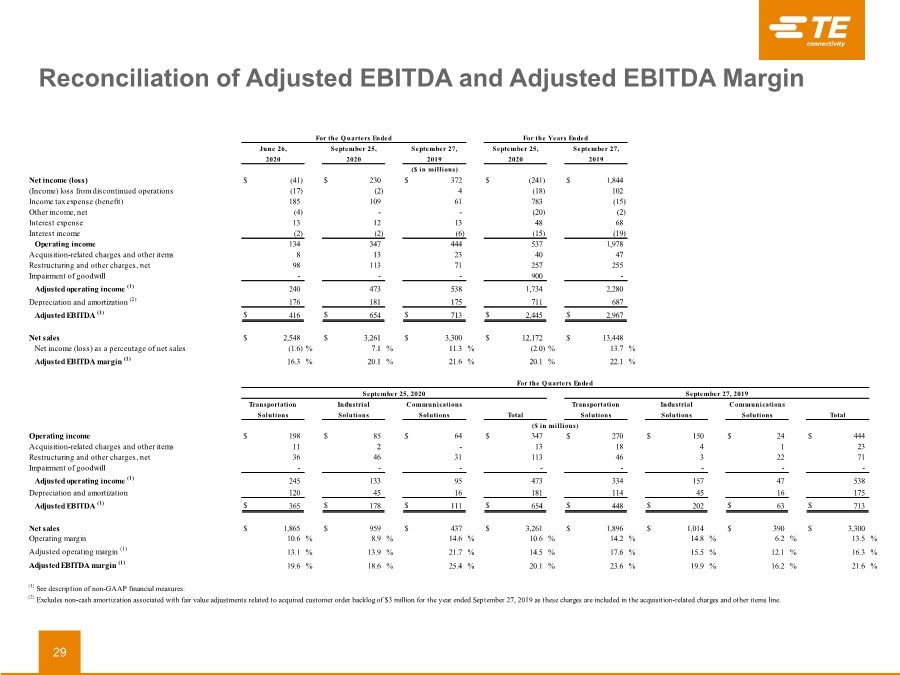
| © 2020 TE Connectivity. Confidential & Proprietary. Do not reproduce or distribute externally including non-authorized representatives and distributors. Create a sustainable future by limiting print copies, and recycling paper. Reconciliation of Adjusted EBITDA and Adjusted EBITDA Margin 29 Net income (loss) $ (41) $ 230 $ 372 $ (241) $ 1,844 (Income) loss from discontinued operations (17) (2) 4 (18) 102 Income tax expense (benefit) 185 109 61 783 (15) Other income, net (4) - - (20) (2) Interest expense 13 12 13 48 68 Interest income (2) (2) (6) (15) (19) Operating income 134 347 444 537 1,978 Acquisition-related charges and other items 8 13 23 40 47 Restructuring and other charges, net 98 113 71 257 255 Impairment of goodwill - - - 900 - Adjusted operating income (1) 240 473 538 1,734 2,280 Depreciation and amortization (2) 176 181 175 711 687 Adjusted EBITDA (1) $ 416 $ 654 $ 713 $ 2,445 $ 2,967 Net sales $ 2,548 $ 3,261 $ 3,300 $ 12,172 $ 13,448 Net income (loss) as a percentage of net sales (1.6) % 7.1 % 11.3 %(2.0) % 13.7 % Adjusted EBITDA margin (1) 16.3 % 20.1 % 21.6 % 20.1 % 22.1 % Operating income $ 198 $ 85 $ 64 $ 347 $ 270 $ 150 $ 24 $ 444 Acquisition-related charges and other items 11 2 - 13 18 4 1 23 Restructuring and other charges, net 36 46 31 113 46 3 22 71 Impairment of goodwill - - - - - - - - Adjusted operating income (1) 245 133 95 473 334 157 47 538 Depreciation and amortization 120 45 16 181 114 45 16 175 Adjusted EBITDA (1) $ 365 $ 178 $ 111 $ 654 $ 448 $ 202 $ 63 $ 713 Net sales $ 1,865 $ 959 $ 437 $ 3,261 $ 1,896 $ 1,014 $ 390 $ 3,300 Operating margin 10.6 % 8.9 % 14.6 % 10.6 % 14.2 % 14.8 % 6.2 % 13.5 % Adjusted operating margin (1) 13.1 % 13.9 % 21.7 % 14.5 % 17.6 % 15.5 % 12.1 % 16.3 % Adjusted EBITDA margin (1) 19.6 % 18.6 % 25.4 % 20.1 % 23.6 % 19.9 % 16.2 % 21.6 % ($ in millions) For the Quarters Ended For the Years Ended June 26, September 25, September 27, September 25, September 27, 2020 2020 2019 2020 2019 For the Quarters Ended September 25, 2020 September 27, 2019 Transportation Industrial Communications Transportation Industrial ($ in millions) (1) See description of non-GAAP financial measures. (2) Excludes non-cash amortization associated with fair value adjustments related to acquired customer order backlog of $3 million for the year ended September 27, 2019 as these charges are included in the acquisition-related charges and other items line. Communications Solutions Solutions Solutions Total Solutions Solutions Solutions Total |
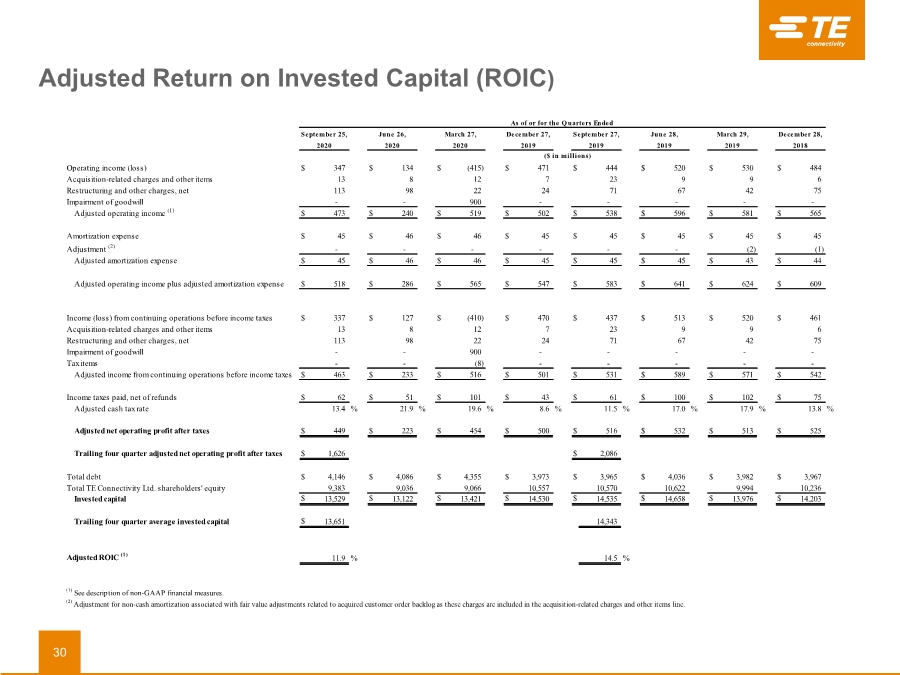
| © 2020 TE Connectivity. Confidential & Proprietary. Do not reproduce or distribute externally including non-authorized representatives and distributors. Create a sustainable future by limiting print copies, and recycling paper. Adjusted Return on Invested Capital (ROIC) 30 Operating income (loss) $ 347 $ 134 $ (415) $ 471 $ 444 $ 520 $ 530 $ 484 Acquisition-related charges and other items 13 8 12 7 23 9 9 6 Restructuring and other charges, net 113 98 22 24 71 67 42 75 Impairment of goodwill - - 900 - - - - - Adjusted operating income (1) $ 473 $ 240 $ 519 $ 502 $ 538 $ 596 $ 581 $ 565 Amortization expense $ 45 $ 46 $ 46 $ 45 $ 45 $ 45 $ 45 $ 45 Adjustment (2) - - - - - - (2) (1) Adjusted amortization expense $ 45 $ 46 $ 46 $ 45 $ 45 $ 45 $ 43 $ 44 Adjusted operating income plus adjusted amortization expense $ 518 $ 286 $ 565 $ 547 $ 583 $ 641 $ 624 $ 609 Income (loss) from continuing operations before income taxes $ 337 $ 127 $ (410) $ 470 $ 437 $ 513 $ 520 $ 461 Acquisition-related charges and other items 13 8 12 7 23 9 9 6 Restructuring and other charges, net 113 98 22 24 71 67 42 75 Impairment of goodwill - - 900 - - - - - Tax items - - (8) - - - - - Adjusted income from continuing operations before income taxes $ 463 $ 233 $ 516 $ 501 $ 531 $ 589 $ 571 $ 542 Income taxes paid, net of refunds $ 62 $ 51 $ 101 $ 43 $ 61 $ 100 $ 102 $ 75 Adjusted cash tax rate 13.4 % 21.9 % 19.6 % 8.6 % 11.5 % 17.0 % 17.9 % 13.8 % Adjusted net operating profit after taxes $ 449 $ 223 $ 454 $ 500 $ 516 $ 532 $ 513 $ 525 Trailing four quarter adjusted net operating profit after taxes $ 1,626 $ 2,086 Total debt $ 4,146 $ 4,086 $ 4,355 $ 3,973 $ 3,965 $ 4,036 $ 3,982 $ 3,967 Total TE Connectivity Ltd. shareholders' equity 9,383 9,036 9,066 10,557 10,570 10,622 9,994 10,236 Invested capital $ 13,529 $ 13,122 $ 13,421 $ 14,530 $ 14,535 $ 14,658 $ 13,976 $ 14,203 Trailing four quarter average invested capital $ 13,651 14,343 Adjusted ROIC (1) 11.9 % 14.5 % 2018 June 26, 2020 (1) See description of non-GAAP financial measures. September 25, 2020 ($ in millions) As of or for the Quarters Ended (2) Adjustment for non-cash amortization associated with fair value adjustments related to acquired customer order backlog as these charges are included in the acquisition-related charges and other items line. March 27, 2020 December 27, 2019 September 27, 2019 June 28, 2019 March 29, 2019 December 28, |
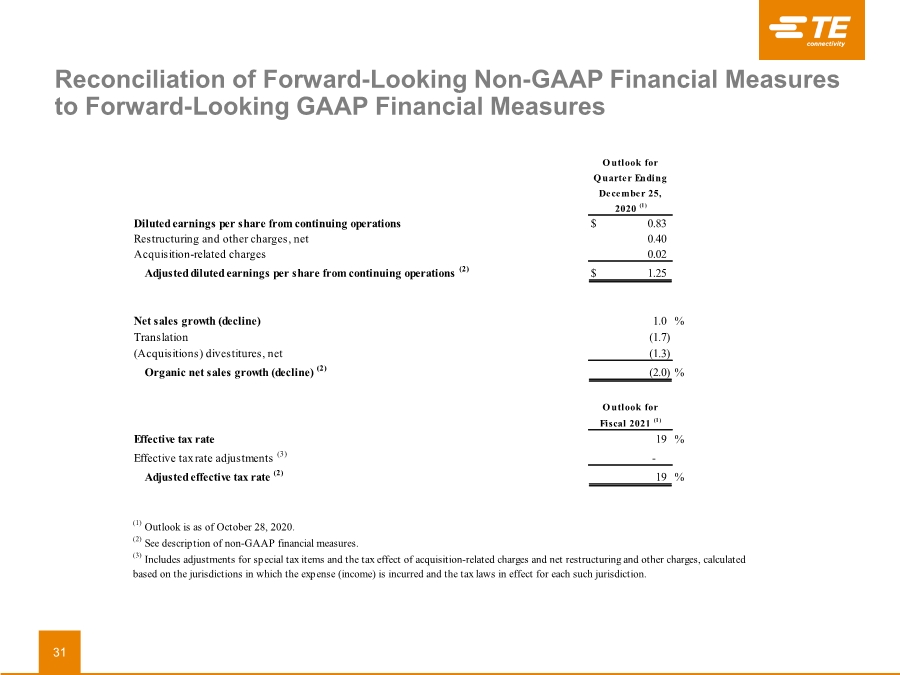
| © 2020 TE Connectivity. Confidential & Proprietary. Do not reproduce or distribute externally including non-authorized representatives and distributors. Create a sustainable future by limiting print copies, and recycling paper. Reconciliation of Forward-Looking Non-GAAP Financial Measures to Forward-Looking GAAP Financial Measures 31 Diluted earnings per share from continuing operations $ 0.83 Restructuring and other charges, net 0.40 Acquisition-related charges 0.02 Adjusted diluted earnings per share from continuing operations (2) $ 1.25 Net sales growth (decline) 1.0 % Translation (1.7) (Acquisitions) divestitures, net (1.3) Organic net sales growth (decline) (2) (2.0) % Effective tax rate 19 % Effective tax rate adjustments (3) - Adjusted effective tax rate (2) 19 % (2) See description of non-GAAP financial measures. (3) Includes adjustments for special tax items and the tax effect of acquisition-related charges and net restructuring and other charges, calculated based on the jurisdictions in which the expense (income) is incurred and the tax laws in effect for each such jurisdiction. December 25, 2020 (1) Outlook for Fiscal 2021 (1) (1) Outlook is as of October 28, 2020. Quarter Ending Outlook for |