Attached files
| file | filename |
|---|---|
| EX-99.1 - EX-99.1 - MERIT MEDICAL SYSTEMS INC | mmsi-20201028xex99d1.htm |
| 8-K - 8-K - MERIT MEDICAL SYSTEMS INC | mmsi-20201028x8k.htm |
Exhibit 99.2
| Third Quarter 2020 Results; Updated 2020 Financial Guidance FRED LAMPROPOULOS Chairman & CEO Raul Parra CFO |

| CAUTIONARY STATEMENT REGARDING FORWARD-LOOKING STATEMENTS This presentation and any accompanying management commentary include “forward-looking statements,” as defined within applicable securities laws and regulations. All statements in this presentation, other than statements of historical fact, are “forward-looking statements”, including without limitation estimates and statements regarding Merit's forecasted plans, net sales, net income or loss (GAAP and non-GAAP), gross and operating margins (GAAP and non-GAAP), earnings per share (GAAP and non-GAAP), free cash flow, effective tax rate and other financial results, the potential impact, scope and duration of, and Merit’s response to, the coronavirus (COVID-19) pandemic, consolidation of Merit’s facilities or other expense reduction initiatives, future growth and profit expectations, the consequences of existing or future regulatory approvals, or the development and commercialization of new products. In some cases, forward-looking statements can be identified by the use of terminology such as “may,” “will,” “likely,” “expects,” “plans,” “anticipates,” “intends,” “believes,” “estimates,” “projects,” ”forecast,” “potential,” “plan,” or other comparable terminology. Merit’s future financial and operating results and condition, as well as any forward-looking statements, are subject to inherent risks and uncertainties such as those described in its Annual Report on Form 10-K for the year ended December 31, 2019 (as amended by Amendment No. 1 to Annual Report on Form 10-K/A, the “2019 Annual Report”), its subsequent Quarterly Reports on Form 10-Q, and other filings with the U.S. Securities and Exchange Commission. Such risks and uncertainties include inherent risks and uncertainties relating to Merit’s internal models or the projections in this presentation; risks and uncertainties associated with the COVID-19 pandemic and Merit’s response thereto; risks relating to Merit’s potential inability to successfully manage growth through acquisitions generally, including the inability to effectively integrate acquired operations or products or commercialize technology developed internally or acquired through completed, proposed or future transactions; negative changes in economic and industry conditions in the United States or other countries; expenditures relating to research, development, testing and regulatory approval or clearance of Merit’s products and risks that such products may not be developed successfully or approved for commercial use; governmental scrutiny and regulation of the medical device industry, including governmental inquiries, investigations and proceedings involving Merit; litigation and other judicial proceedings affecting Merit; restrictions on Merit’s liquidity or business operations resulting from its debt agreements; infringement of Merit’s technology or the assertion that Merit’s technology infringes the rights of other parties; actions of activist shareholders; product recalls and product liability claims; changes in customer purchasing patterns or the mix of products Merit sells; risks and uncertainties associated with Merit’s information technology systems, including the potential for breaches of security and evolving regulations regarding privacy and data protection; increases in the prices of commodity components; the potential of fines, penalties or other adverse consequences if Merit’s employees or agents violate the U.S. Foreign Corrupt Practices Act or other laws or regulations; laws and regulations targeting fraud and abuse in the healthcare industry; potential for significant adverse changes in governing regulations, including reforms to the procedures for approval or clearance of Merit’s products by the U.S. Food & Drug Administration or comparable regulatory authorities in other jurisdictions; changes in tax laws and regulations in the United States or other countries; termination or interruption of relationships with Merit’s suppliers, or failure of such suppliers to perform; fluctuations in exchange rates; concentration of a substantial portion of Merit’s revenues among a few products and procedures; development of new products and technology that could render Merit’s existing or future products obsolete; market acceptance of new products; volatility in the market price of Merit’s common stock; modification or limitation of governmental or private insurance reimbursement policies; changes in healthcare policies or markets related to healthcare reform initiatives; failure to comply with applicable environmental laws; changes in key personnel; work stoppage or transportation risks; introduction of products in a timely fashion; price and product competition; availability of labor and materials; fluctuations in and obsolescence of inventory; and other factors referenced in the 2019 Annual Report and other materials filed with the Securities and Exchange Commission. All forward-looking statements in this presentation or subsequent forward-looking statements attributable to Merit or persons acting on its behalf are expressly qualified in their entirety by these cautionary statements. Actual results will likely differ, and may differ materially, from those projected or assumed in the forward-looking statements. Financial estimates are subject to change and are not intended to be relied upon as predictions of future operating results. All forward-looking statements, including financial estimates, included in this presentation are made as of the date of this presentation, and are based on information available to Merit as of such date, and Merit assumes no obligation to update or disclose revisions to any forward-looking statement, except as required by law or regulation. |
| NON-GAAP FINANCIAL MEASURES Although Merit’s financial statements are prepared in accordance with accounting principles generally accepted in the United States of America (“GAAP”), Merit’s management believes that certain non-GAAP financial measures provide investors with useful information regarding the underlying business trends and performance of Merit’s ongoing operations and can be useful for period- over-period comparisons of such operations. Certain financial measures included in this presentation, or which may be referenced in management’s discussion of Merit’s historical and future operations and financial results, have not been calculated in accordance with GAAP, and, therefore, are referenced as non-GAAP financial measures. Readers should consider non-GAAP measures used in this presentation in addition to, not as a substitute for, financial reporting measures prepared in accordance with GAAP. These non-GAAP financial measures generally exclude some, but not all, items that may affect Merit's net income. In addition, they are subject to inherent limitations as they reflect the exercise of judgment by management about which items are excluded. Additionally, non- GAAP financial measures used in this presentation may not be comparable with similarly titled measures of other companies. Merit urges investors and potential investors to review the reconciliations of its non-GAAP financial measures to the comparable GAAP financial measures, and not to rely on any single financial measure to evaluate Merit’s business or results of operations. Please refer to “Notes to Non-GAAP Financial Measures” at the end of these materials for more information. TRADEMARKS Unless noted otherwise, trademarks used in this presentation are the property of Merit Medical Systems, Inc., in the United States and other jurisdictions. 3 |
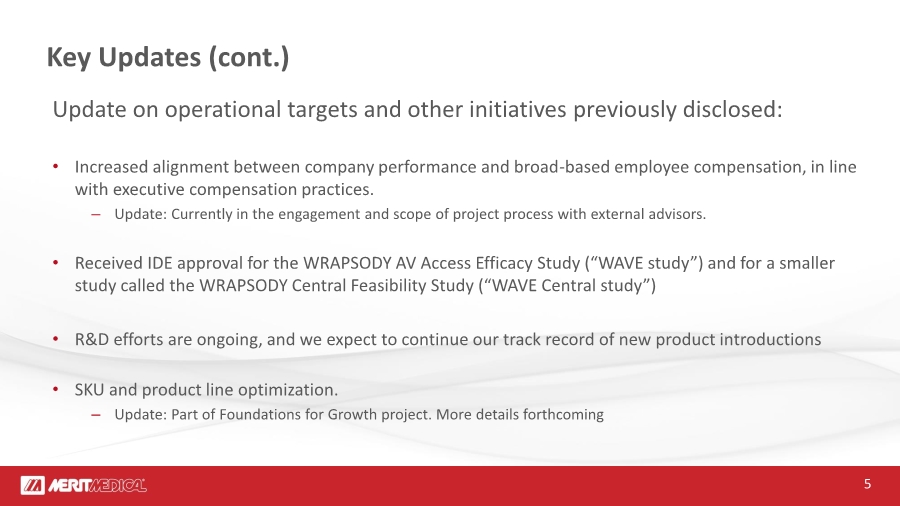
| Key Updates Update on operational targets and other initiatives previously disclosed: • $6-10 million annualized cost savings (savings beginning in second half of 2021, based on current inventory levels): 14 product line transfers to Tijuana, Mexico and Pearland, Texas and site consolidations: – Update: Transfer of product lines is on track to be completed by end of 2020. – Update: Temecula, CA site has been closed – Update: Malvern, PA on track to be closed • Closure of procedure pack manufacturing site in Melbourne, Australia (from our 2017 ITL acquisition) on track for end of 2020. Sublease of manufacturing facility in process. – Approximately $9M of sales in 2020 • Executive compensation tied to free cash flow and performance relative to Russell 2000. 4 * See "Notes to Non-GAAP Financial Measures" below for definition of Non-GAAP measures used in this presentation |
| Key Updates (cont.) Update on operational targets and other initiatives previously disclosed: • Increased alignment between company performance and broad-based employee compensation, in line with executive compensation practices. – Update: Currently in the engagement and scope of project process with external advisors. • Received IDE approval for the WRAPSODY AV Access Efficacy Study (“WAVE study”) and for a smaller study called the WRAPSODY Central Feasibility Study (“WAVE Central study”) • R&D efforts are ongoing, and we expect to continue our track record of new product introductions • SKU and product line optimization. – Update: Part of Foundations for Growth project. More details forthcoming 5 |
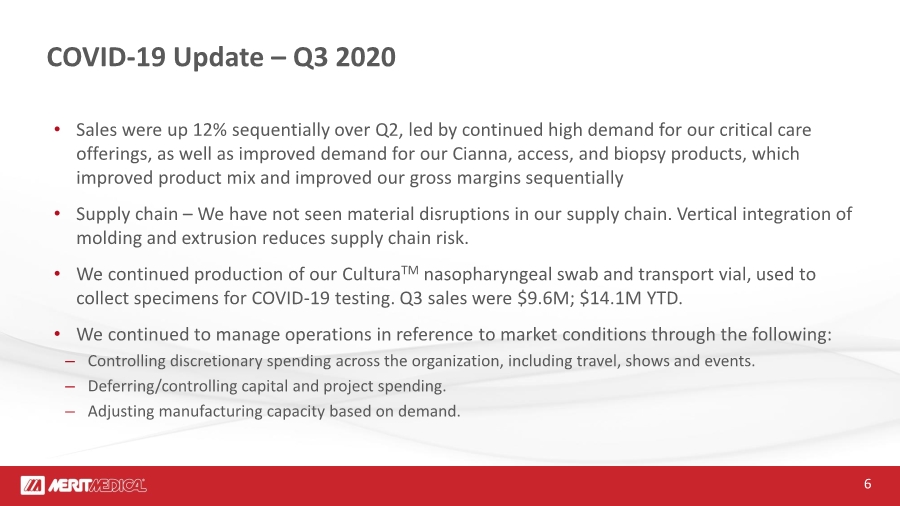
| COVID-19 Update – Q3 2020 • Sales were up 12% sequentially over Q2, led by continued high demand for our critical care offerings, as well as improved demand for our Cianna, access, and biopsy products, which improved product mix and improved our gross margins sequentially • Supply chain – We have not seen material disruptions in our supply chain. Vertical integration of molding and extrusion reduces supply chain risk. • We continued production of our CulturaTM nasopharyngeal swab and transport vial, used to collect specimens for COVID-19 testing. Q3 sales were $9.6M; $14.1M YTD. • We continued to manage operations in reference to market conditions through the following: – Controlling discretionary spending across the organization, including travel, shows and events. – Deferring/controlling capital and project spending. – Adjusting manufacturing capacity based on demand. 6 |
| Foundations for Growth Management will host an investor call, “Foundations for Growth”, on Tuesday, November 10, 2020 at 5:00 p.m. Eastern (4:00 p.m. Central, 3:00 p.m. Mountain, and 2:00 p.m. Pacific) to introduce Merit’s multi-year financial targets for growth and improved profitability and will host a question- and-answer session. • Those who would like to participate may dial 844-578-9672 (508-637-5656 for international callers) and provide the conference ID 2887092. • A live webcast of the call will also be available on the investor relations section of Merit’s website at www.merit.com. • For those unable to participate, a replay of the call will be available for two weeks at 855-859- 2056 (404-537-3406 for international callers); conference ID 2887092. The webcast will be archived on the investor relations section of Merit’s website at www.merit.com. 7 |
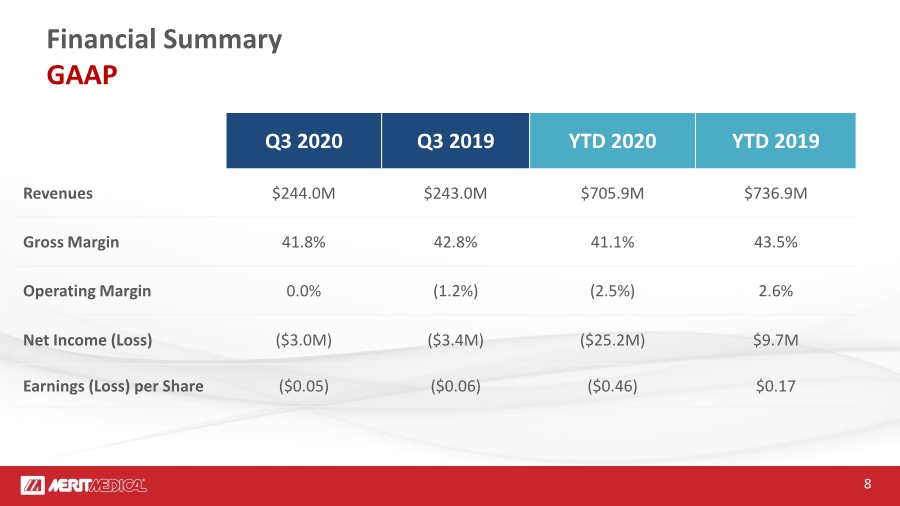
| Financial Summary GAAP Q3 2020 Q3 2019 YTD 2020 YTD 2019 Revenues $244.0M $243.0M $705.9M $736.9M Gross Margin 41.8% 42.8% 41.1% 43.5% Operating Margin 0.0% (1.2%) (2.5%) 2.6% Net Income (Loss) ($3.0M) ($3.4M) ($25.2M) $9.7M Earnings (Loss) per Share ($0.05) ($0.06) ($0.46) $0.17 8 |
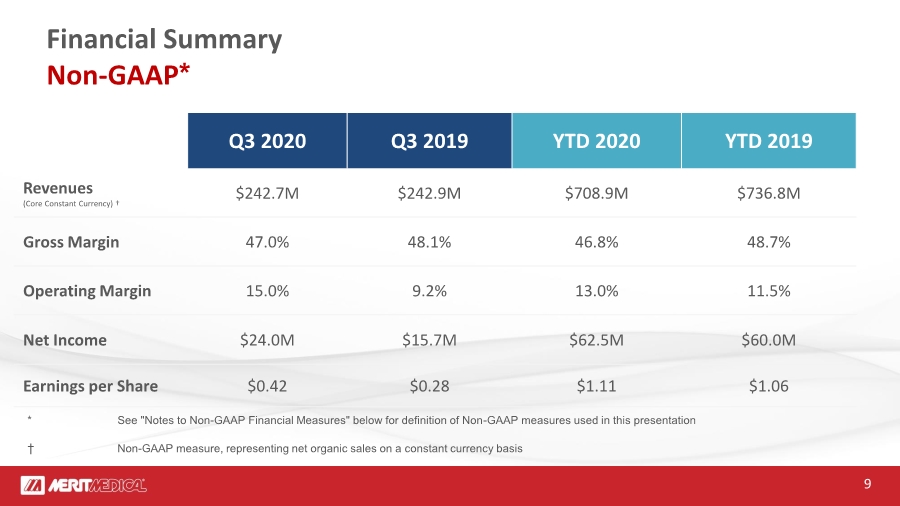
| * See "Notes to Non-GAAP Financial Measures" below for definition of Non-GAAP measures used in this presentation † Non-GAAP measure, representing net organic sales on a constant currency basis Financial Summary Non-GAAP* 9 Q3 2020 Q3 2019 YTD 2020 YTD 2019 Revenues (Core Constant Currency) † $242.7M $242.9M $708.9M $736.8M Gross Margin 47.0% 48.1% 46.8% 48.7% Operating Margin 15.0% 9.2% 13.0% 11.5% Net Income $24.0M $15.7M $62.5M $60.0M Earnings per Share $0.42 $0.28 $1.11 $1.06 |
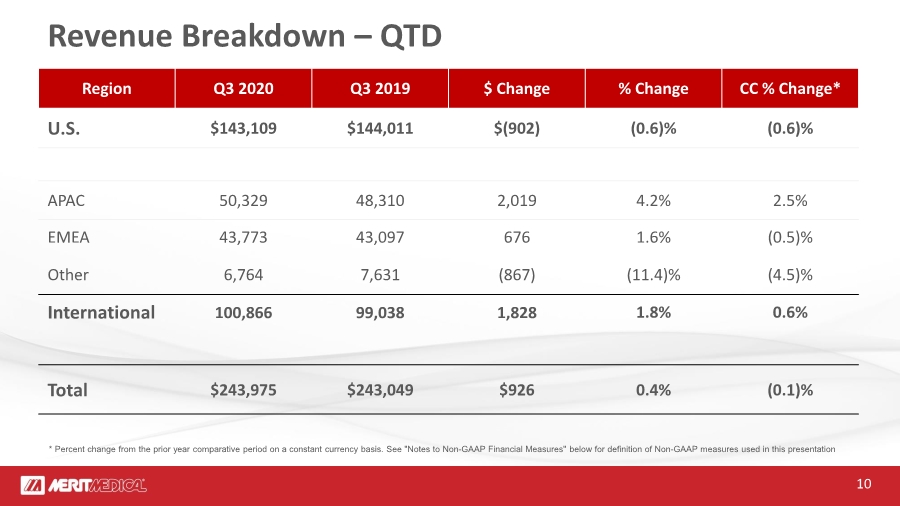
| 10 Revenue Breakdown – QTD Region Q3 2020 Q3 2019 $ Change % Change CC % Change* U.S. $143,109 $144,011 $(902) (0.6)% (0.6)% APAC 50,329 48,310 2,019 4.2% 2.5% EMEA 43,773 43,097 676 1.6% (0.5)% Other 6,764 7,631 (867) (11.4)% (4.5)% International 100,866 99,038 1,828 1.8% 0.6% Total $243,975 $243,049 $926 0.4% (0.1)% * Percent change from the prior year comparative period on a constant currency basis. See "Notes to Non-GAAP Financial Measures" below for definition of Non-GAAP measures used in this presentation |
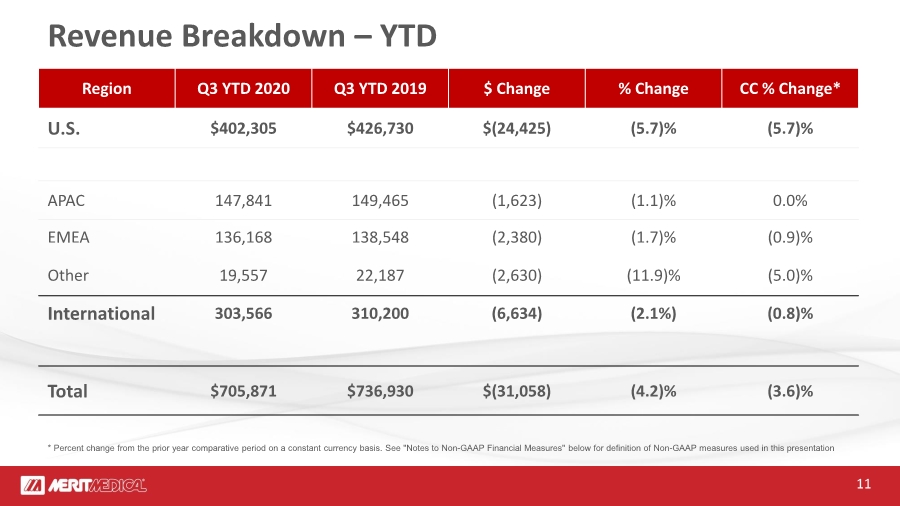
| 11 Revenue Breakdown – YTD Region Q3 YTD 2020 Q3 YTD 2019 $ Change % Change CC % Change* U.S. $402,305 $426,730 $(24,425) (5.7)% (5.7)% APAC 147,841 149,465 (1,623) (1.1)% 0.0% EMEA 136,168 138,548 (2,380) (1.7)% (0.9)% Other 19,557 22,187 (2,630) (11.9)% (5.0)% International 303,566 310,200 (6,634) (2.1%) (0.8)% Total $705,871 $736,930 $(31,058) (4.2)% (3.6)% * Percent change from the prior year comparative period on a constant currency basis. See "Notes to Non-GAAP Financial Measures" below for definition of Non-GAAP measures used in this presentation |
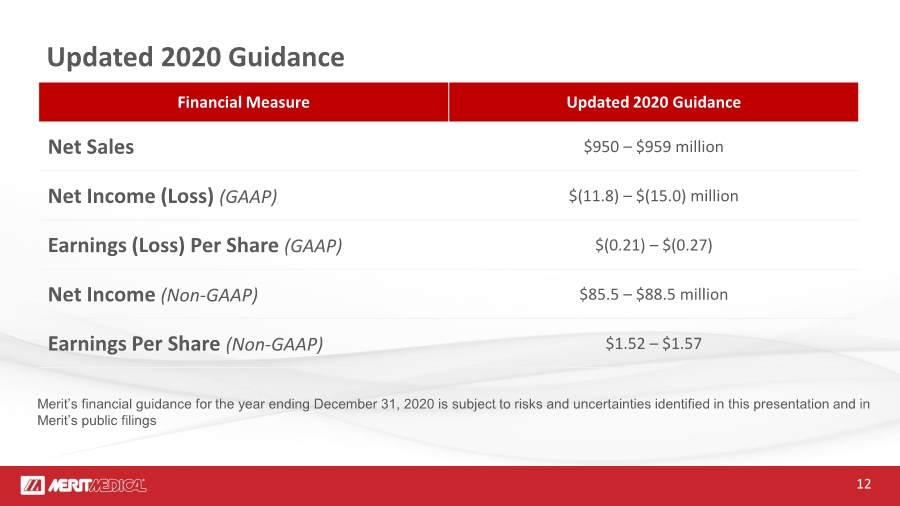
| Updated 2020 Guidance Financial Measure Updated 2020 Guidance Net Sales $950 – $959 million Net Income (Loss) (GAAP) $(11.8) – $(15.0) million Earnings (Loss) Per Share (GAAP) $(0.21) – $(0.27) Net Income (Non-GAAP) $85.5 – $88.5 million Earnings Per Share (Non-GAAP) $1.52 – $1.57 Merit’s financial guidance for the year ending December 31, 2020 is subject to risks and uncertainties identified in this presentation and in Merit’s public filings 12 |
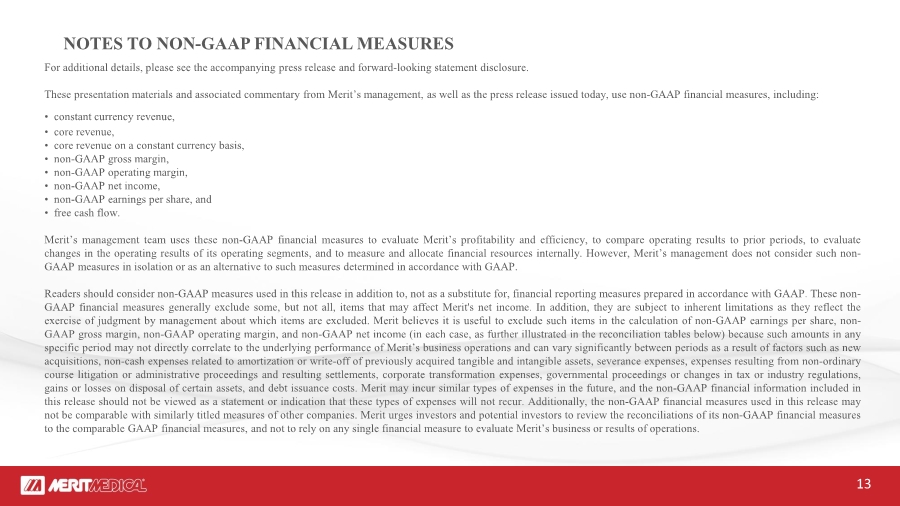
| NOTES TO NON-GAAP FINANCIAL MEASURES For additional details, please see the accompanying press release and forward-looking statement disclosure. These presentation materials and associated commentary from Merit’s management, as well as the press release issued today, use non-GAAP financial measures, including: • constant currency revenue, • core revenue, • core revenue on a constant currency basis, • non-GAAP gross margin, • non-GAAP operating margin, • non-GAAP net income, • non-GAAP earnings per share, and • free cash flow. Merit’s management team uses these non-GAAP financial measures to evaluate Merit’s profitability and efficiency, to compare operating results to prior periods, to evaluate changes in the operating results of its operating segments, and to measure and allocate financial resources internally. However, Merit’s management does not consider such non- GAAP measures in isolation or as an alternative to such measures determined in accordance with GAAP. Readers should consider non-GAAP measures used in this release in addition to, not as a substitute for, financial reporting measures prepared in accordance with GAAP. These non- GAAP financial measures generally exclude some, but not all, items that may affect Merit's net income. In addition, they are subject to inherent limitations as they reflect the exercise of judgment by management about which items are excluded. Merit believes it is useful to exclude such items in the calculation of non-GAAP earnings per share, non- GAAP gross margin, non-GAAP operating margin, and non-GAAP net income (in each case, as further illustrated in the reconciliation tables below) because such amounts in any specific period may not directly correlate to the underlying performance of Merit’s business operations and can vary significantly between periods as a result of factors such as new acquisitions, non-cash expenses related to amortization or write-off of previously acquired tangible and intangible assets, severance expenses, expenses resulting from non-ordinary course litigation or administrative proceedings and resulting settlements, corporate transformation expenses, governmental proceedings or changes in tax or industry regulations, gains or losses on disposal of certain assets, and debt issuance costs. Merit may incur similar types of expenses in the future, and the non-GAAP financial information included in this release should not be viewed as a statement or indication that these types of expenses will not recur. Additionally, the non-GAAP financial measures used in this release may not be comparable with similarly titled measures of other companies. Merit urges investors and potential investors to review the reconciliations of its non-GAAP financial measures to the comparable GAAP financial measures, and not to rely on any single financial measure to evaluate Merit’s business or results of operations. 13 |
| NOTES TO NON-GAAP FINANCIAL MEASURES (cont.) Constant Currency Revenue Merit’s revenue on a constant currency basis is prepared by translating the current-period reported revenue of subsidiaries whose functional currency is a currency other than the U.S. dollar at the applicable foreign exchange rates in effect during the comparable prior-year period. The constant currency revenue adjustments of $(1.2) million and $4.3 million to reported revenue and to core revenue for the three and nine-month periods ended September 30, 2020, respectively, were calculated using the applicable average foreign exchange rates for the three and nine-month periods ended September 30, 2019, respectively. Core Revenue and Core Revenue on a Constant Currency Basis Merit’s core revenue is defined, with respect to prior fiscal year periods, as GAAP revenue less revenue from certain dispositions. For the three and nine-month periods ended September 30, 2019, Merit’s core revenue excludes revenues attributable to the disposition of the assets related to the manufacturing of Merit’s Hypotube product in August 2020 (excluded September 2019 only). With respect to current fiscal year periods, core revenue is defined as GAAP revenue, less revenue from certain acquisitions. For the three and nine-month periods ended September 30, 2020, Merit’s core revenue excludes revenues attributable to the acquisition of (1) Brightwater Medical, Inc. in June 2019 (excluded through May 2020 only), and (2) Fibrovein Holdings Limited in August 2019 (excluded through July 2020 only). Core revenue on a constant currency basis is defined as core revenue (as described above) adjusted to eliminate the foreign exchange impact related to that core revenue for the relevant period, using the applicable average foreign exchange rates in effect for the comparable prior-year periods presented. Non-GAAP Gross Margin Non-GAAP gross margin is calculated by reducing GAAP cost of sales by amounts recorded for amortization of intangible assets, certain inventory write-offs and inventory mark-up related to acquisitions. Non-GAAP Operating Margin Non-GAAP operating margin is calculated by adjusting GAAP operating income (loss) for certain items which are deemed by Merit’s management to be outside of core operations and vary in amount and frequency among periods, such as expenses related to new acquisitions, non-cash expenses related to amortization or write-off of previously acquired tangible and intangible assets, severance expenses, performance-based stock compensation expenses, corporate transformation expenses, expenses resulting from non-ordinary course litigation or administrative proceedings and resulting settlements, governmental proceedings or changes in industry regulations, as well as other items set forth in the tables below. Non-GAAP Net Income Non-GAAP net income is calculated by adjusting GAAP net income (loss) for the items set forth in the definition of non-GAAP operating margin above, as well as for expenses related to debt issuance costs, gains or losses on disposal of certain assets, changes in tax regulations, as well as other items set forth in the tables below. Non-GAAP EPS Non-GAAP EPS is defined as non-GAAP net income divided by the diluted shares outstanding for the corresponding period. Free Cash Flow Free cash flow is defined as cash flow from operations calculated in accordance with GAAP less capital expenditures calculated in accordance with GAAP, as set forth in the consolidated statement of cash flows. Other Non-GAAP Financial Measure Reconciliation The following tables set forth supplemental financial data and corresponding reconciliations of non-GAAP net income and non-GAAP earnings per share to Merit’s net income and earnings per share prepared in accordance with GAAP, in each case, for the three and nine-month periods ended September 30, 2020 and 2019. The non-GAAP income adjustments referenced in the following tables do not reflect non-performance-based stock compensation expense of approximately $3.0 million and $2.6 million for the three-month periods ended September 30, 2020 and 2019, respectively, and approximately $7.6 million and $6.9 million for the nine-month periods ended September 30, 2020 and 2019, respectively. 14 |
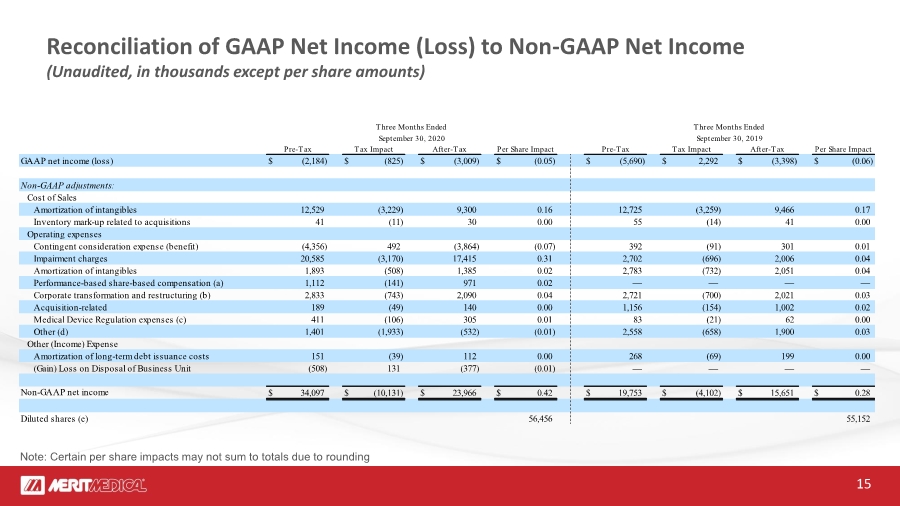
| GAAP net income (loss) $ (2,184) $ (825) $ (3,009) $ (0.05) $ (5,690) $ 2,292 $ (3,398) $ (0.06) Non-GAAP adjustments: Cost of Sales Amortization of intangibles 12,529 (3,229) 9,300 0.16 12,725 (3,259) 9,466 0.17 Inventory mark-up related to acquisitions 41 (11) 30 0.00 55 (14) 41 0.00 Operating expenses Contingent consideration expense (benefit) (4,356) 492 (3,864) (0.07) 392 (91) 301 0.01 Impairment charges 20,585 (3,170) 17,415 0.31 2,702 (696) 2,006 0.04 Amortization of intangibles 1,893 (508) 1,385 0.02 2,783 (732) 2,051 0.04 Performance-based share-based compensation (a) 1,112 (141) 971 0.02 — — — — Corporate transformation and restructuring (b) 2,833 (743) 2,090 0.04 2,721 (700) 2,021 0.03 Acquisition-related 189 (49) 140 0.00 1,156 (154) 1,002 0.02 Medical Device Regulation expenses (c) 411 (106) 305 0.01 83 (21) 62 0.00 Other (d) 1,401 (1,933) (532) (0.01) 2,558 (658) 1,900 0.03 Other (Income) Expense Amortization of long-term debt issuance costs 151 (39) 112 0.00 268 (69) 199 0.00 (Gain) Loss on Disposal of Business Unit (508) 131 (377) (0.01) — — — — Non-GAAP net income $ 34,097 $ (10,131) $ 23,966 $ 0.42 $ 19,753 $ (4,102) $ 15,651 $ 0.28 Diluted shares (e) 56,456 55,152 Three Months Ended Three Months Ended September 30, 2020 September 30, 2019 After-Tax Per Share Impact Pre-Tax Tax Impact After-Tax Per Share Impact Pre-Tax Tax Impact 15 Reconciliation of GAAP Net Income (Loss) to Non-GAAP Net Income (Unaudited, in thousands except per share amounts) Note: Certain per share impacts may not sum to totals due to rounding |
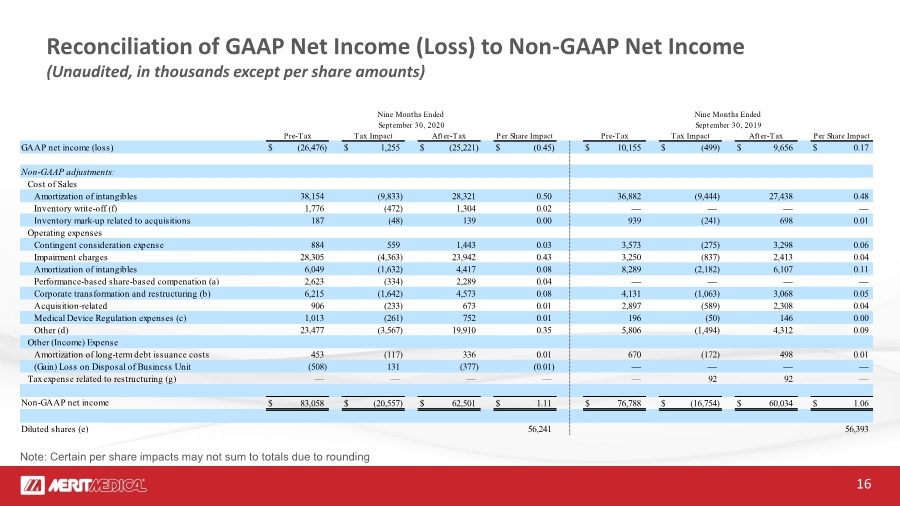
| GAAP net income (loss) $ (26,476) $ 1,255 $ (25,221) $ (0.45) $ 10,155 $ (499) $ 9,656 $ 0.17 Non-GAAP adjustments: Cost of Sales Amortization of intangibles 38,154 (9,833) 28,321 0.50 36,882 (9,444) 27,438 0.48 Inventory write-off (f) 1,776 (472) 1,304 0.02 — — — — Inventory mark-up related to acquisitions 187 (48) 139 0.00 939 (241) 698 0.01 Operating expenses Contingent consideration expense 884 559 1,443 0.03 3,573 (275) 3,298 0.06 Impairment charges 28,305 (4,363) 23,942 0.43 3,250 (837) 2,413 0.04 Amortization of intangibles 6,049 (1,632) 4,417 0.08 8,289 (2,182) 6,107 0.11 Performance-based share-based compenation (a) 2,623 (334) 2,289 0.04 — — — — Corporate transformation and restructuring (b) 6,215 (1,642) 4,573 0.08 4,131 (1,063) 3,068 0.05 Acquisition-related 906 (233) 673 0.01 2,897 (589) 2,308 0.04 Medical Device Regulation expenses (c) 1,013 (261) 752 0.01 196 (50) 146 0.00 Other (d) 23,477 (3,567) 19,910 0.35 5,806 (1,494) 4,312 0.09 Other (Income) Expense Amortization of long-term debt issuance costs 453 (117) 336 0.01 670 (172) 498 0.01 (Gain) Loss on Disposal of Business Unit (508) 131 (377) (0.01) — — — — Tax expense related to restructuring (g) — — — — — 92 92 — Non-GAAP net income $ 83,058 $ (20,557) $ 62,501 $ 1.11 $ 76,788 $ (16,754) $ 60,034 $ 1.06 Diluted shares (e) 56,241 56,393 Nine Months Ended Nine Months Ended September 30, 2020 September 30, 2019 After-Tax Per Share Impact Pre-Tax Tax Impact After-Tax Per Share Impact Pre-Tax Tax Impact 16 Reconciliation of GAAP Net Income (Loss) to Non-GAAP Net Income (Unaudited, in thousands except per share amounts) Note: Certain per share impacts may not sum to totals due to rounding |
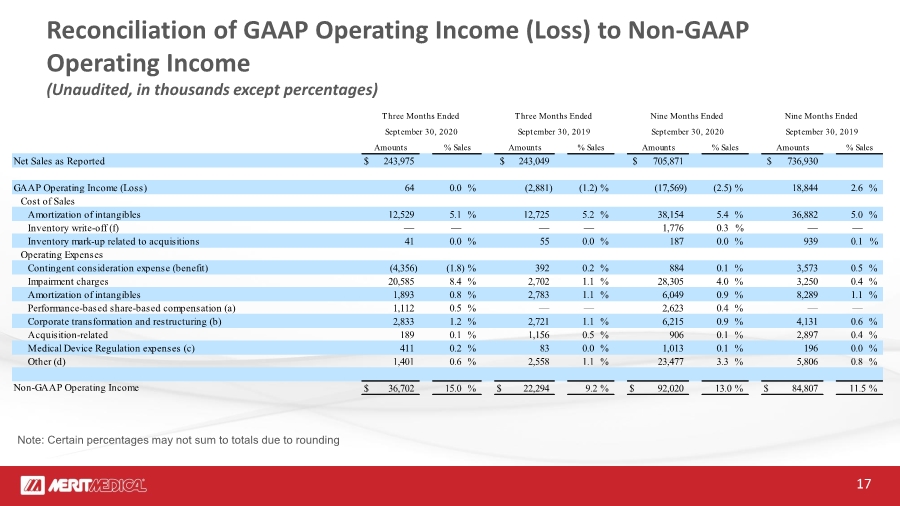
| Net Sales as Reported $ 243,975 $ 243,049 $ 705,871 $ 736,930 GAAP Operating Income (Loss) 64 0.0 %(2,881) (1.2) %(17,569) (2.5) % 18,844 2.6 % Cost of Sales Amortization of intangibles 12,529 5.1 % 12,725 5.2 % 38,154 5.4 % 36,882 5.0 % Inventory write-off (f) — — — — 1,776 0.3 %— — Inventory mark-up related to acquisitions 41 0.0 % 55 0.0 % 187 0.0 % 939 0.1 % Operating Expenses Contingent consideration expense (benefit) (4,356) (1.8) % 392 0.2 % 884 0.1 % 3,573 0.5 % Impairment charges 20,585 8.4 % 2,702 1.1 % 28,305 4.0 % 3,250 0.4 % Amortization of intangibles 1,893 0.8 % 2,783 1.1 % 6,049 0.9 % 8,289 1.1 % Performance-based share-based compensation (a) 1,112 0.5 %— — 2,623 0.4 %— — Corporate transformation and restructuring (b) 2,833 1.2 % 2,721 1.1 % 6,215 0.9 % 4,131 0.6 % Acquisition-related 189 0.1 % 1,156 0.5 % 906 0.1 % 2,897 0.4 % Medical Device Regulation expenses (c) 411 0.2 % 83 0.0 % 1,013 0.1 % 196 0.0 % Other (d) 1,401 0.6 % 2,558 1.1 % 23,477 3.3 % 5,806 0.8 % Non-GAAP Operating Income $ 36,702 15.0 % $ 22,294 9.2 % $ 92,020 13.0 % $ 84,807 11.5 % September 30, 2020 September 30, 2019 September 30, 2020 September 30, 2019 Three Months Ended Three Months Ended Nine Months Ended Nine Months Ended % Sales Amounts % Sales Amounts % Sales Amounts % Sales Amounts 17 Reconciliation of GAAP Operating Income (Loss) to Non-GAAP Operating Income (Unaudited, in thousands except percentages) Note: Certain percentages may not sum to totals due to rounding |
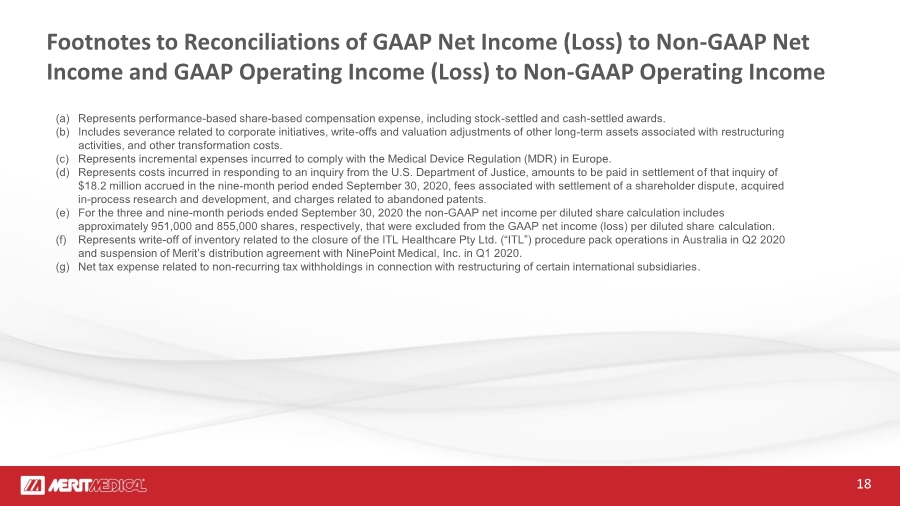
| (a) Represents performance-based share-based compensation expense, including stock-settled and cash-settled awards. (b) Includes severance related to corporate initiatives, write-offs and valuation adjustments of other long-term assets associated with restructuring activities, and other transformation costs. (c) Represents incremental expenses incurred to comply with the Medical Device Regulation (MDR) in Europe. (d) Represents costs incurred in responding to an inquiry from the U.S. Department of Justice, amounts to be paid in settlement of that inquiry of $18.2 million accrued in the nine-month period ended September 30, 2020, fees associated with settlement of a shareholder dispute, acquired in-process research and development, and charges related to abandoned patents. (e) For the three and nine-month periods ended September 30, 2020 the non-GAAP net income per diluted share calculation includes approximately 951,000 and 855,000 shares, respectively, that were excluded from the GAAP net income (loss) per diluted share calculation. (f) Represents write-off of inventory related to the closure of the ITL Healthcare Pty Ltd. (“ITL”) procedure pack operations in Australia in Q2 2020 and suspension of Merit’s distribution agreement with NinePoint Medical, Inc. in Q1 2020. (g) Net tax expense related to non-recurring tax withholdings in connection with restructuring of certain international subsidiaries. 18 Footnotes to Reconciliations of GAAP Net Income (Loss) to Non-GAAP Net Income and GAAP Operating Income (Loss) to Non-GAAP Operating Income |
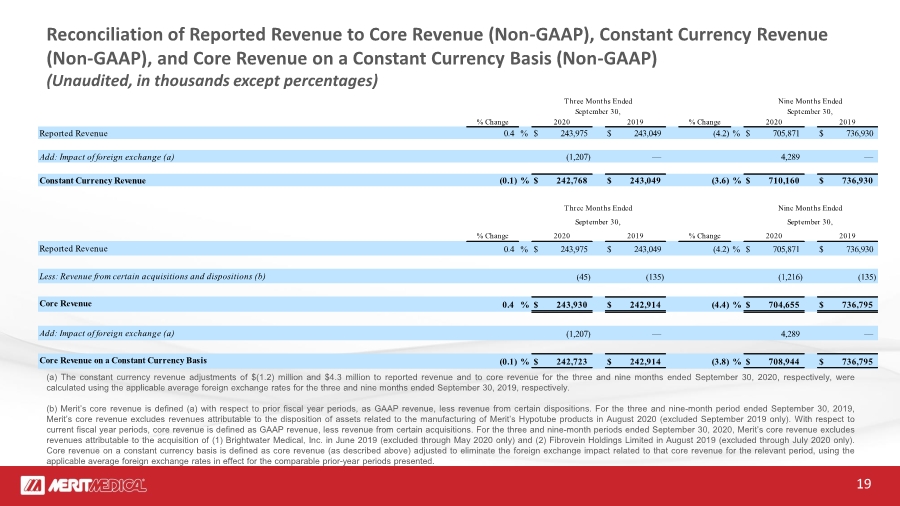
| % Change % Change Reported Revenue 0.4 % $ 243,975 $ 243,049 (4.2) % $ 705,871 $ 736,930 Add: Impact of foreign exchange (a) (1,207) — 4,289 — Constant Currency Revenue (0.1) % $ 242,768 $ 243,049 (3.6) % $ 710,160 $ 736,930 % Change % Change Reported Revenue 0.4 % $ 243,975 $ 243,049 (4.2) % $ 705,871 $ 736,930 Less: Revenue from certain acquisitions and dispositions (b) (45) (135) (1,216) (135) Core Revenue 0.4 % $ 243,930 $ 242,914 (4.4) % $ 704,655 $ 736,795 Add: Impact of foreign exchange (a) (1,207) — 4,289 — Core Revenue on a Constant Currency Basis (0.1) % $ 242,723 $ 242,914 (3.8) % $ 708,944 $ 736,795 September 30, September 30, Three Months Ended Nine Months Ended 2020 2019 2020 2019 Three Months Ended Nine Months Ended September 30, September 30, 2020 2019 2020 2019 (a) The constant currency revenue adjustments of $(1.2) million and $4.3 million to reported revenue and to core revenue for the three and nine months ended September 30, 2020, respectively, were calculated using the applicable average foreign exchange rates for the three and nine months ended September 30, 2019, respectively. (b) Merit’s core revenue is defined (a) with respect to prior fiscal year periods, as GAAP revenue, less revenue from certain dispositions. For the three and nine-month period ended September 30, 2019, Merit’s core revenue excludes revenues attributable to the disposition of assets related to the manufacturing of Merit’s Hypotube products in August 2020 (excluded September 2019 only). With respect to current fiscal year periods, core revenue is defined as GAAP revenue, less revenue from certain acquisitions. For the three and nine-month periods ended September 30, 2020, Merit’s core revenue excludes revenues attributable to the acquisition of (1) Brightwater Medical, Inc. in June 2019 (excluded through May 2020 only) and (2) Fibrovein Holdings Limited in August 2019 (excluded through July 2020 only). Core revenue on a constant currency basis is defined as core revenue (as described above) adjusted to eliminate the foreign exchange impact related to that core revenue for the relevant period, using the applicable average foreign exchange rates in effect for the comparable prior-year periods presented. 19 Reconciliation of Reported Revenue to Core Revenue (Non-GAAP), Constant Currency Revenue (Non-GAAP), and Core Revenue on a Constant Currency Basis (Non-GAAP) (Unaudited, in thousands except percentages) |
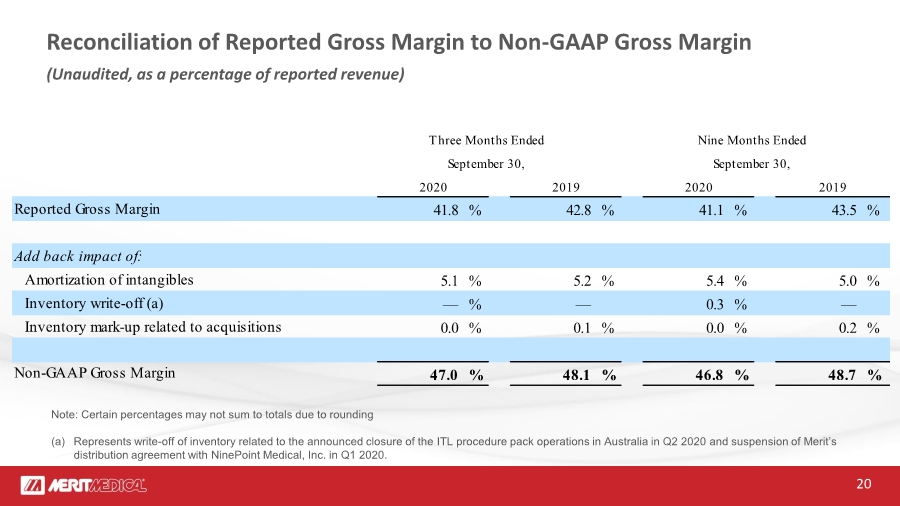
| Reported Gross Margin 41.8 % 42.8 % 41.1 % 43.5 % Add back impact of: Amortization of intangibles 5.1 % 5.2 % 5.4 % 5.0 % Inventory write-off (a) — % — 0.3 % — Inventory mark-up related to acquisitions 0.0 % 0.1 % 0.0 % 0.2 % Non-GAAP Gross Margin 47.0 % 48.1 % 46.8 % 48.7 % Three Months Ended Nine Months Ended September 30, September 30, 2020 2019 2020 2019 20 Reconciliation of Reported Gross Margin to Non-GAAP Gross Margin (Unaudited, as a percentage of reported revenue) Note: Certain percentages may not sum to totals due to rounding (a) Represents write-off of inventory related to the announced closure of the ITL procedure pack operations in Australia in Q2 2020 and suspension of Merit’s distribution agreement with NinePoint Medical, Inc. in Q1 2020. |
|