Attached files
| file | filename |
|---|---|
| EX-99.1 - PRESS RELEASE - BROOKLINE BANCORP INC | exh_991.htm |
| 8-K - FORM 8-K - BROOKLINE BANCORP INC | f8k_102820.htm |
Exhibit 99.2

Q3 2020 FINANCIAL RESULTS October 29, 2020 1

FORWARD LOOKING STATEMENTS 2 Certain statements in this presentation that are not historical facts may constitute forward - looking statements within the meaning of Section 27A of the Securities Act of 1933, as amended, and Section 21E of the Securities Exchange Act of 1934, as amended, and are intended to be covered by the safe harbor provisions of the Private Securities Litigation Reform Act of 1995. Statements contained in this presentation that do not describe historical or current facts are forward - looking statements, including statements regard the potential effects of the COVID - 19 pandemic on the Company’s business, credit quality, financial condition, liquidity and results of operations. Forward - looking statements made with regard to the potential effects of COVID - 19 on the Company’s business, credit quality, financial condition, liquidity and results of operation may differ, possibly materially, from what is included in this presentation due to factors and future developments that are uncertain and beyond the scope of the Company’s control. These included, but are not limited to the length and extent of the economic contraction as a result of the COVID - 19 pandemic; continued deterioration in employment levels, general business and economic conditions on a national basis and in the local markets in which the Company operates; changes in consumer behavior due to changing political, business and economic conditions or legislative or regulatory initiatives; the possibility that future credit losses may be higher than currently expected; reputational risk relating to the Company’s participation in the Paycheck Protection Program and other pandemic - related legislative and regulatory initiatives and programs; and turbulence in capital and debt markets. Forward - looking statements involve risks and uncertainties which are difficult to predict. Forward - looking statements involve risks and uncertainties. These statements include, among others, statements regarding our strategy, evaluations of future interest rate trends and liquidity, expectations as to growth in assets, deposits and results of operations, success of acquisitions, future operations, market position, financial position, and prospects, plans and objectives of management. You should not place undue reliance on the Company’s forward - looking statements. You should exercise caution in interpreting and relying on forward - looking statements because they are subject to significant risks, uncertainties and other factors which are, in some cases, beyond the Company’s control. Forward - looking statements are based on the current assumptions and beliefs of management and are only expectations of future results. The Company’s actual results could differ materially from those projected in the forward - looking statements as a result of, among other factors, changes in interest rates; competitive pressures from other financial institutions; the effects of continued weakness in general economic conditions and the impact of the COVID - 19 pandemic on a national basis or in the local markets in which the Company operates, including changes that adversely affect borrowers’ ability to service and repay our loans; changes in the value of securities in the Company’s investment portfolio, changes in loan default and charge - off rates, the adequacy of loan loss reserves, decreases in deposit levels necessitating increased borrowing to fund loans and investments; changes in government regulation, as well as the other risks and uncertainties detailed in the Company’s Annual Report on Form 10 - K, as updated by the Company’s Quarterly Reports on Form 10 - Q and other filings submitted to the Securities and Exchange Commission. Forward looking statements speak only as of the date on which they are made. The Company does not undertake any obligation to update any forward - looking statement to reflect circumstances or events that occur after the date the forward - looking statements are made.

OVERVIEW 3 • All bank facilities are open with our corporate and operations centers operating under “Work From Home” protocols. • Our credit quality remained stable during the quarter with strong return to payment activity – as of quarter end there were 910 credits totaling $280 million with outstanding loan modifications under the CARES Act. • We continued to maintain our reserve for credit losses in the quarter with a coverage ratio of 176 basis points on outstanding non - PPP loans. • Deposit and Lending activity is increasing and pipelines are gradually improving with quality credits. • Our margin stabilized at 3.08% as net interest income increased $1.6 million from Q2. • Net income of $18.7 million resulted in earnings per share of $0.24. • Our Board approved a dividend of $0.115 and the resumption of our stock buyback program which was suspended in March. The program expires on December 31, 2020 with $9.6 million in previously authorized funding remaining.

SUMMARY INCOME STATEMENT 4 ▪ Net Income of $18.7 million or $0.24 per share. ▪ Stable Total Revenue as declines in fee income were offset by increases in net interest income . Net interest income increased due to the growth in average interest earning assets and a stable net interest margin. ▪ Operating expenses were higher on a linked quarter basis driven by compensation expense, due to lower Avg diluted shares (000s) 79,056 79 , 015 41 0% 79,884 (828) - 1% ▪ Return on Assets 0.83% 0 . 88% - 0 . 05% 1.17% - 0.34% Return on Tangible Equity 9.70% 10 . 28% - 0 . 58% 9.74% - 0.04% Net Interest Margin 3.08% 3 . 09% - 0 . 01% 3.45% - 0.37% Efficiency Ratio 57.83% 55 . 46% 2 . 37% 56.48% 1.35% The Provision for credit losses modestly declined from Q2 as economic forecasts have marginally improved while there remains significant uncertainty and volatility related to the COVID - 19 pandemic. $m, except per share amts 3 Q 20 2 Q 20 Δ %Δ 3 Q 19 Δ %Δ Net interest income $ 65 . 9 $ 64 . 3 $ 1 . 6 2% $ 63 . 2 $ 2 . 7 4% Noninterest income 4 . 7 5 . 6 ( 0 . 9) - 16% 8 . 1 ( 3 . 4) - 42% Security gains (losses) 0 . 1 0 . 6 ( 0 . 5) - 83% ( 0 . 1) 0 . 2 - 200% Total Revenue Noninterest expense 70.7 40.9 70.5 39.1 0.2 1.8 0% 5% 71.2 40.2 (0.5) 0.7 - 1% 2% ▪ Pretax, Preprov. Net Rev. 29 . 8 31 . 4 (1.6) - 5% 31 . 0 (1.2) - 4% Provision for credit losses 4 . 5 5 . 3 (0.8) - 15% 0 . 9 3.6 400% Pretax income 25 . 3 26 . 1 ( 0 . 8) - 3% 30 . 1 (4.8) - 16% Provision for taxes 6 . 6 6 . 5 0 . 1 2% 7 . 5 (0.9) - 12% Net Income $ 18 . 7 $ 19.6 $ (0.9) - 5% $ 22.6 $ (3.9) - 17% deferred loan origination costs, and EPS $ 0 . 2 4 $ 0.25 $ (0.01) - 4 % $ 0.28 $ (0.04) - 14 % higher FDIC assessments. Linked Quarter (LQ) Year over Year (YoY)
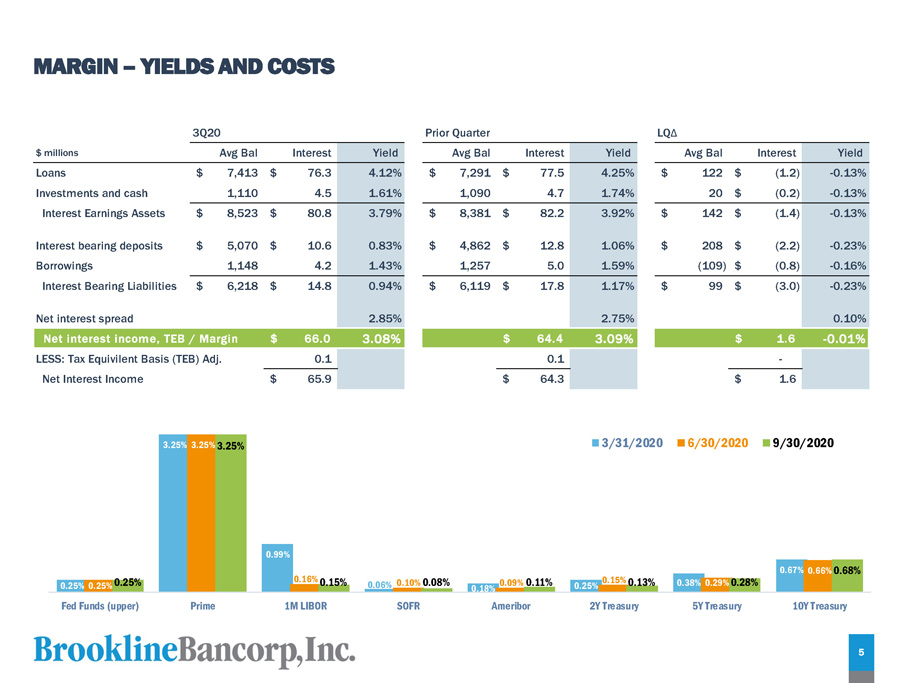
MARGIN – YIELDS AND COSTS 3Q20 Prior Quarter LQ Δ $ millions Avg Bal I n t e r e s t Y i e l d Avg Bal I n t e r e s t Y i e l d Avg Bal I n t e r e s t Y i e l d Loans $ 7,413 $ 76 . 3 4 . 12% $ 7 , 291 $ 77 . 5 4 . 25% $ 122 $ ( 1 . 2) - 0 . 13% Investments and cash 1 , 110 4 . 5 1 . 61% 1 , 090 4 . 7 1 . 74% 20 $ ( 0 . 2) - 0 . 13% Interest Earnings Assets $ 8,523 $ 80 . 8 3 . 79% $ 8 , 381 $ 82 . 2 3 . 92% $ 142 $ ( 1 . 4) - 0 . 13% Interest bearing deposits $ 5,070 $ 10 . 6 0 . 83% $ 4 , 862 $ 12 . 8 1 . 06% $ 208 $ ( 2 . 2) - 0 . 23% Borrowings 1 , 148 4 . 2 1 . 43% 1 , 257 5 . 0 1 . 59% ( 109) $ ( 0 . 8) - 0 . 16% Interest Bearing Liabilities $ 6,218 $ 14 . 8 0 . 94% $ 6 , 119 $ 17 . 8 1 . 17% $ 99 $ ( 3 . 0) - 0 . 23% Net interest spread 2 . 85% 2 . 75% 0 . 10% Net interest income, TEB / Margin $ 66 . 0 3 . 08% $ 64.4 3 . 09% $ 1.6 - 0 . 01% LESS: Tax Equivilent Basis (TEB) Adj. 0 . 1 0 . 1 - Net Interest Income $ 65 . 9 $ 64.3 $ 1.6 0 . 25 % 3 . 25 % 0.99% 0.25% 0 . 25 % 3 . 25 % 0.38% 0.29% 0.67% 0.66% 0.25% 3.25% 0.16% 0.15% 0.06% 0.10% 0.08% 0.18% 0.09% 0.11% 0.15% 0.13% 0.28% 0.68% Fed Funds (upper) Pr i me 1M LIBOR S O F R Ameribor 2Y Treasury 5Y Treasury 10Y Treasury 3 / 3 1 / 2 0 20 6 / 3 0 / 2 0 20 9 / 3 0 / 2 0 20 5

SUMMARY BALANCE SHEET Gross Loans, investment $ 7 , 396 $ 7 , 408 $ ( 12) - 1% $ 6 , 647 $ 749 11% ▪ Allowance for loan losses ( 120) ( 120) - 0% ( 59) ( 61) 103% Net Loans 7 , 276 7 , 288 ( 12) - 1% 6 , 588 688 10% Stable Allowance for Loan Losses. While economic forecasts are improving and there is better than anticipated reduction in loan Securities 784 856 (72) - 34% 567 217 38% modifications, significant Cash & equivalents 317 255 62 97% 179 138 77% uncertainty remains. Linked Quarter (LQ) Year over Year (YoY) ▪ Loan growth flat in Q3. $m, except per share amts 3Q20 2Q20 Δ %Δ annual. 3Q19 Δ %Δ ▪ ALLL coverage increased to 1.76% (excluding PPP loans). ▪ Shift from Cash to Securities providing significant near term on - balance sheet liquidity. ▪ Deposit growth of $353 million driven by a shift to low cost brokered deposits from FHLB advances. Equity increased $9 million in Q3 driven by continued strong pre - tax, pre - provision earnings net of our quarterly stable dividend to Intangibles 164 164 - 0% 165 ( 1) - 1% Other assets 459 507 ( 48) - 38% 379 80 21% Total Assets $ 9 , 000 $ 9 , 070 $ ( 70) - 3% $ 7 , 878 $ 1 , 122 14% Deposits $ 6 , 793 $ 6 , 440 $ 353 22% $ 5 , 729 $ 1 , 064 19% Borrowings 1 , 005 1 , 407 ( 402) - 114% 986 19 2% Reserve for unfunded loans 14 15 ( 1) - 27% 2 12 600% Other Liabilities 252 281 ( 29) - 41% 229 23 10% Total Liabilities 8 , 064 8 , 143 ( 79) - 4% 6 , 946 1 , 118 16% Stockholders Equity 936 927 9 4% 932 4 0% Total Liabilities & Equity $ 9 , 000 $ 9 , 070 $ ( 70) - 3% $ 7 , 878 $ 943 12% ▪ TBV per share $ 9 . 77 $ 9 . 67 $ 0 . 10 4% $ 9 . 63 $ 0 . 14 1% Actual shares outstanding (000) 79 , 002 78 , 854 148 1% 79 , 674 ( 672) - 1% shareholders. Tang. Equity / Tang. Assets 8 . 73% 8 . 56% 0.17% 9 . 94% - 1.21% Loans / Deposits 108 . 88% 115 . 03% - 6.15% 116 . 02% - 7.14% ALLL / Gross Loans 1 . 62% 1 . 61% 0.01% 0 . 89% 0.73% ALLL / Loans excl PPP 1 . 7 6% 1 . 7 5% 0.01% 0 . 8 9% 0.87% 6

LOAN AND DEPOSIT COMPOSITION 52% 8% 9% L oans Demand deposits 1 , 550 1 , 603 ( 53) - 13% 1 , 107 443 40% NOW 460 418 42 40% 340 120 35% IT S Savings 717 658 59 36% 605 112 19% P O S Money market 1 , 878 1 , 810 68 15% 1 , 666 212 13% D E CDs 1 , 493 1 , 601 ( 108) - 27% 1 , 673 (180) - 11% Brokered deposits 695 350 345 394% 338 357 106% Total Deposits $ 6 , 793 $ 6 , 440 $ 353 22% $ 5 , 729 $1,064 19% Co ns u m e r 7% 10% 28% 22% CRE C&I PPP Equipment Deposits 10% 23% D D A N O W Sa v i n g s MMk t C D s B rkd Linked Quarter (LQ) Year over Year (YoY) $ millions 3Q20 2 Q 20 Δ %Δ an. 3 Q 19 Δ %Δ CRE 3,835 3 , 838 (3) 0% 3 , 589 246 7% Commercial 703 709 (6) - 3% 821 (118) - 14% PPP Loans 568 566 2 1% - 568 - Equipment Finance 1,084 1,086 (2) - 1% 1,029 55 5% Consumer 1,206 1,209 (3) - 1% 1,207 (1) 0% Total Loans $ 7 , 39 6 $ 7 , 40 8 $ ( 12) - 1% $ 6,646 $ 750 11% NS 16% L O A 15% ▪ Total loans declined $12 million in the quarter and were relatively flat across all categories. 7 ▪ Total deposits increased $353 million primarily driven by funding shifts from FHLB advances into lower cost brokered deposits. ▪ Shifts in deposits from demand accounts and certificates of deposits to NOW, savings and money market products.

CUSTOMER AND COMMUNITY SUPPORT – MODIFIED PAYMENTS $ millions 3Q20 # Loans Modified % of Port CRE $ 3 , 273 72 $ 124 3 . 8% Commercial** 1 , 199 150 18 1 . 5% Equipment Finance** 1 , 150 678 134 11 . 7% Consumer 1 , 206 10 4 0 . 3% Subtotal $ 6 , 828 91 0 $ 280 4 . 1% SBA - PPP Loans 56 8 - - 0 . 0% Total Gross Loans $ 7 , 396 91 0 $ 280 3 . 8% 3 . 8 % As of: 9/30/2020 Portfolio Current CARES Modifications ** Includes Owner Occupied Commercial Real Estate. 8
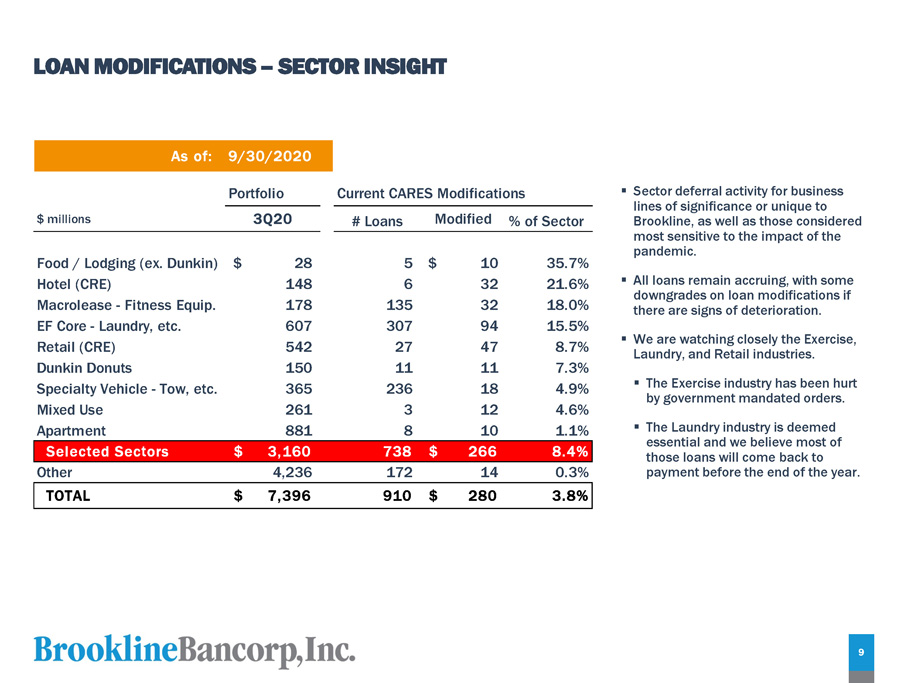
LOAN MODIFICATIONS – SECTOR INSIGHT As of: 9/30/2020 P o r t fo li o Current CARES Modifications $ millions 3 Q 2 0 Modified # Loans % of Sector Food / Lodging (ex. Dunkin) $ 28 5 $ 10 35 . 7% Hotel (CRE) 148 6 32 21 . 6% Macrolease - Fitness Equip. 178 135 32 18 . 0% EF Core - Laundry, etc. 607 307 94 15 . 5% Retail (CRE) 542 27 47 8 . 7% Dunkin Donuts 150 11 11 7 . 3% Specialty Vehicle - Tow, etc. 365 236 18 4 . 9% Mixed Use 261 3 12 4 . 6% Apartment 881 8 10 1 . 1% Selected Sectors $ 3 , 160 73 8 $ 26 6 8 . 4 % ▪ Sector deferral activity for business lines of significance or unique to Brookline, as well as those considered most sensitive to the impact of the pandemic. ▪ All loans remain accruing, with some downgrades on loan modifications if there are signs of deterioration . 9 ▪ We are watching closely the Exercise, Laundry, and Retail industries. ▪ The Exercise industry has been hurt by government mandated orders. ▪ The Laundry industry is deemed essential and we believe most of those loans will come back to Other 4 , 236 172 14 0 . 3% payment before the end of the year. TOTAL $ 7 , 396 91 0 $ 28 0 3 . 8 %

CAPITAL STRENGTH 10 * Regulatory capital ratios are preliminary estimates and may differ from numbers calculated in final Regulatory filings. ▪ As of September 30, 2020, the Company had capital well above regulatory “well capitalized” requirements. ▪ The Company repurchased 848,319 shares of stock for $10.4 million during Q1 2020 under an approved $20 million stock buyback program which expires on December 31, 2020. On March 24, 2020, the Company suspended further purchases. ▪ On October 28, 2020, the Board of Directors approved resuming the stock buyback program, which expires on December 31, 2020, with $9.6 million in previously authorized funding remaining. p r e limi na r y e s t im a t e s * Regulatory BASEL III Requirements Brookline Board Policy Limits Regulatory "Well Capitalized" Buffer $ millions Sep - 20 Minimum "Well C ap i t a li ze d " Policy M i n i m u m s Op e r a t i n g Targets "Well Cap" Buffer E x c e ss C ap i t al Tier 1 Common / RWA 10.7% ≥ 4.5% ≥ 6.5% ≥ 7.5% ≥ 8.0% 4.2% $ 294 . 5 Tier 1 / RWA 10.8% ≥ 6.0% ≥ 8.0% ≥ 9.0% ≥ 9.5% 2.8% $ 197 . 8 Total Risk Based Capital 13.1% ≥ 8.0% ≥ 10.0% ≥ 11.0% ≥ 11.5% 3.1% $ 218 . 7 Leverage Ratio 8.4% ≥ 5.0% ≥ 5.0% ≥ 5.5% ≥ 6.0% 3.4% $ 304 . 5

REGULAR DIVIDENDS PER SHARE Board of Directors announced a dividend of $0.115 per share payable November 27, 2020 to stockholders of record on November 13, 2020. $0 . 0 4 6 $0 . 0 9 6 $0 . 1 1 0 $0 . 2 1 0 $0 . 3 1 6 $0 . 3 4 0 $0 . 3 4 0 $0 . 3 4 0 $0 . 3 4 0 $0 . 3 4 0 $0 . 3 4 0 $0 . 3 4 0 $0 . 3 4 0 $0 . 3 4 0 $0 . 3 4 0 $0 . 3 4 0 $0 . 3 4 0 $0 . 3 5 5 $0 . 3 6 0 $0 . 3 6 0 $0 . 3 9 5 $0 . 4 4 0 $0 . 1 1 5 $0 . 1 1 5 $0 . 1 1 5 $0 . 1 1 5 1998 1999 2000 2001 2002 2003 2004 2005 2006 2007 2008 2009 2010 2011 2012 2013 2014 2015 2016 2017 2018 2019 Q1'20 Q2'20 Q3'20 Q 4'20 $0 . 46 11

QUESTIONS Paul A. Perrault, President and Chief Executive Officer Carl M. Carlson, Chief Financial Officer M. Robert Rose, Chief Credit Officer 12 12

APPENDIX 12 13

NON PERFORMING ASSETS NON PERFORMING ASSETS (NPAs), in millions CRE $ 10.8 $ 10.1 $ 0.7 28% $ 3.0 $ 7 . 8 260% C&I 21 . 2 25 . 7 ( 4 . 5) - 70% 16 . 1 5 . 1 32% Consumer 5 . 9 5 . 5 0.4 29% 2 . 5 3 . 4 136% Total Non Performing Loans (NPLs) 37 . 9 41 . 3 ( 3 . 4) - 33% 21 . 6 16 . 3 75% Other real estate owned - - - - 0 . 2 ( 0 . 2) n m Other repossessed assets 1 . 4 1 . 5 ( 0 . 1) - 27% 1 . 9 ( 0 . 5) - 26% Total NPAs $ 39.3 $ 42.8 $ (3.5) - 33% $ 23.7 $ 15 . 6 66% NPLs / Total Loans 0 . 51% 0 . 56% - 0 . 05% 0 . 33% 0 . 18% NPAs / Total Assets 0 . 44% 0 . 47% - 0 . 03% 0 . 30% 0 . 14% NET CHARGE OFFS (NCOs), in millions CRE loans $ 0.1 $ (0.1) $ 0.2 n m $ - $ 0 . 1 - C&I loans 4 . 9 1 . 5 3.4 n m 0 . 4 4 . 5 n m Consumer loans - - - - - - - Total Net Charge Offs $ 5.0 $ 1.4 $ 3.6 n m $ 0.4 $ 4 . 6 n m NCOs / Loans (annualized) 0 . 27% 0 . 08% 0 . 19% 0 . 02% 0 . 25% Linked Quarter (LQ) 3 Q 2 0 2 Q 20 Δ %Δ ann. 3 Q 19 Δ %Δ Year over Year (YoY) 14

MAJOR LOAN SEGMENTS WITH INDUSTRY BREAKDOWN 3Q20 $3,273 $1,199 $1,150 $1,206 Loans outstanding ($millions) – Excludes PPP Loans Apartment $ 881 $ 63 $ 94 4 29% Food & Lodging $ 17 9 15% Residential $ 803 67% Office 619 7 62 6 19% Manufacturing 12 0 10% Home Equity 360 30% Retail 542 17 55 9 17% Finance and Ins 12 8 11% Other Consumer 30 2% Industrial 344 - 34 4 11% Wholesale Trade 10 2 9% Purchase Mtge 13 1% Mixed Use 262 40 30 2 9% Professional 10 1 8% Total $ 1,206 100% 1 - 4 Family 11 26 3 7 1% RE Agents/Brokers 11 6 10% Hotel 128 19 14 7 4% Health Care/Social 8 3 7% Land - 26 2 6 1% Construction 5 7 5% Other 245 43 28 8 9% Retail 7 7 6% Total $ 3,032 $ 241 $ 3,273 100% Arts/Entertainmt/Rec 5 5 5% Condo 5 2 4% Transp/Warehousing 2 9 2% Other Services 10 0 8% Fitness - Macrolease 178 15% 15 Total $ 1,199 100% Total $ 1,150 100% Eastern Funding Core Laundry $ 43 9 38% Grocery 4 7 4% Dry Cleaning 1 6 1% Restaurant 1 4 1% Car Wash 1 3 1% EF CRE 6 7 6% Other EF 1 2 1% Specialty Vehicle Tow Truck 19 2 17% Heavy Tow 6 7 6% FedEx 3 7 3% Trailer 1 9 2% Other Vehicle 4 9 4% Investment CRE 48% Commercial 18% Equipment Finance 16% C o n s um e r 18% Perm Constr Total % T o t al % T o t al % Total % Loans, excluding PPP SBA - PPP Loans Total Loans Outstanding $ 6,828 568 $ 7,396 Owner Occupied CRE included in Commercial and Equipment Finance
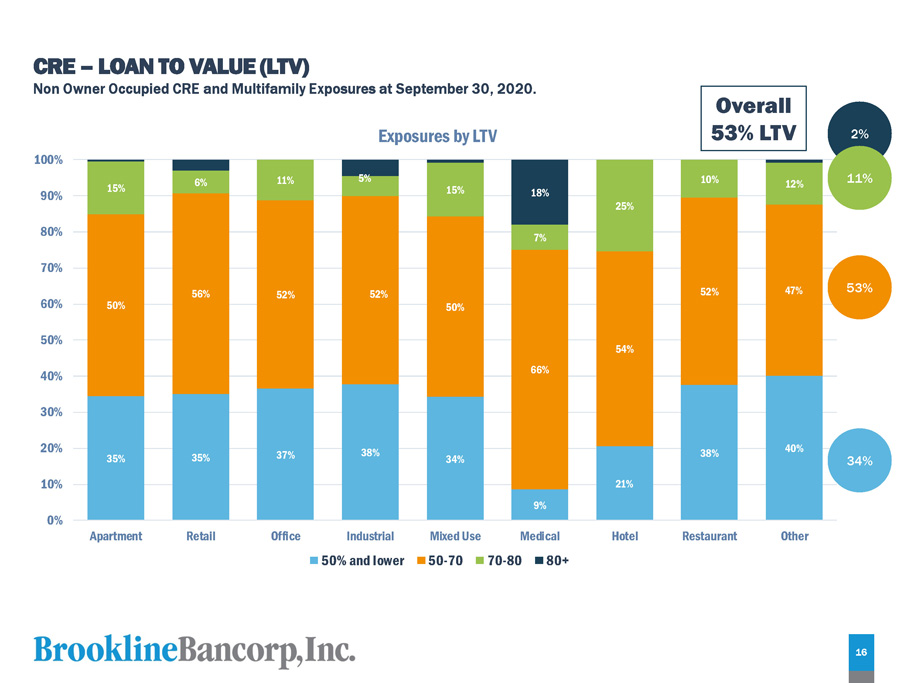
CRE – LOAN TO VALUE (LTV) Non Owner Occupied CRE and Multifamily Exposures at September 30, 2020. 35% 35% 37% 38% 34% 9% 21% 38% 40% 50% 56% 52% 52% 50% 66% 54% 52% 4 7 % 15% 6% 11% 5% 15% 7% 25% 10% 12% 18% 0% 1 0 % 2 0 % 3 0 % 4 0 % 5 0 % 6 0 % 7 0 % 8 0 % 9 0 % 1 0 0% A p a rt m e nt R e t a i l O f f i c e Medical H o t e l R e s t au r a n t O t h e r Exposures by LTV Industrial 50% and lower Mixed Use 50 - 70 70 - 8 0 80+ 34% 53% 2% 11% 16 Overall 53% LTV

CRE - VINTAGE Non Owner Occupied CRE and Multifamily Exposures at September 30, 2020. 37% 59% 38% 29% 3 1 % 3 1 % 61% 43% 13% 8% 10% 12% 12% 0% 15% 30% 4% 3% 11% 15% 11% 5% 5% 1% 6% 9% 11% 7% 15% 9% 20% 24% 7% 2% 15% 8% 18% 8% 19% 25% 23% 13% 26% 11% 12% 10% 3% 6% 20% 9% 46% 4% 2% 25% 0% 1 0 % 2 0 % 3 0 % 4 0 % 5 0 % 6 0 % 7 0 % 8 0 % 9 0 % 1 0 0% Apartment R e t a i l O f f i c e Industrial M e d i c a l Restaurant O t h e r Exposures by Year of Origination 201 5 an d B e f o r e 2016 M i x e d U s e H o t e l 2017 2018 2019 2020 10 % 18 % 12 % 10 % 11 % 39 % 17

Consumer Loans – LTV / FICO 3Q20 700+ 84% 18 650 - 699 8% 600 - 649 2% 599 - 1% N/A 5% 50% or less 27% 50 % - 69% 41% 70 % - 80% 29% 80 %+ 3% 700+ 92% 50% or less 39% 50 % - 69% 28% 70 % - 80% 22% 80 % + 11% Resid. 1 - 4 59% LTV Resid. 1 - 4 FICO Home Equity FICO Home Equity 56% LTV

SECURITIES PORTFOLIO 3Q20 ▪ Highly liquid, risk averse securities portfolio. ▪ The Investment portfolio shrank $72 million during the quarter. $ in millions Current Par Book Value Fair Value Unreal. G/L Book Yield D u r a t i o n Agency Debentures $ 262 $ 274 $ 280 $ 6 1 . 73% 4 . 0 Agency CMO 51 51 52 1 1 . 72% 1 . 7 Agency RMBS 352 356 368 12 1 . 91% 0 . 5 Corp Bonds 22 22 24 1 2 . 53% 2 . 4 UST 54 56 59 4 1 . 79% 5 . 7 Other 1 1 1 - 1 . 59% 0 . 6 Total $ 742 $ 760 $ 784 $ 24 1 . 84% 2 . 3 RM BS 47% 19 A g e n c y 36% C MO 6% U S T 8% Co r p 3% Oth e r 0 . 1%
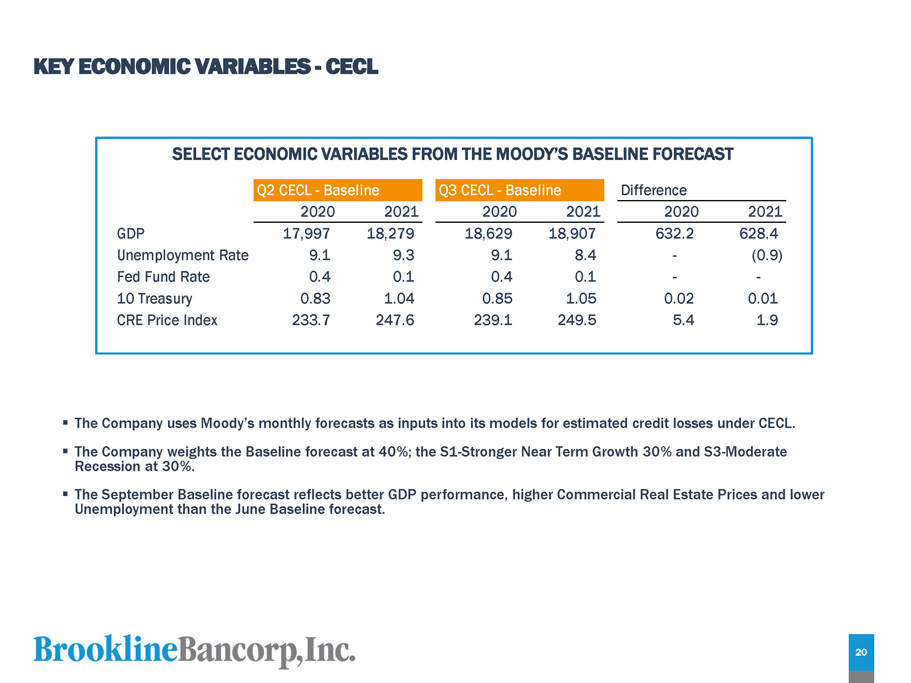
KEY ECONOMIC VARIABLES - CECL SELECT EC ONOMIC VARIABLES F Q2 CECL - Baseline ROM THE MOODY’S BASE Q3 CECL - Baseline LINE FORECAST Difference 2020 2021 2020 2021 2020 2021 GDP 17,997 18,279 18,629 18,907 632 . 2 628.4 Unemployment Rate 9 . 1 9 . 3 9 . 1 8 . 4 - ( 0 . 9) Fed Fund Rate 0 . 4 0 . 1 0 . 4 0 . 1 - - 10 Treasury 0 . 83 1 . 04 0 . 85 1 . 05 0 . 02 0.01 CRE Price Index 233 . 7 247 . 6 239 . 1 249 . 5 5 . 4 1.9 20 ▪ The Company uses Moody’s monthly forecasts as inputs into its models for estimated credit losses under CECL. ▪ The Company weights the Baseline forecast at 40%; the S1 - Stronger Near Term Growth 30% and S3 - Moderate Recession at 30%. ▪ The September Baseline forecast reflects better GDP performance, higher Commercial Real Estate Prices and lower Unemployment than the June Baseline forecast.