Attached files
| file | filename |
|---|---|
| EX-99.1 - EX-99.1 - ARMSTRONG WORLD INDUSTRIES INC | awi-ex991_7.htm |
| 8-K/A - 8-K/A - ARMSTRONG WORLD INDUSTRIES INC | awi-8ka_20201027.htm |
Correction - Earnings Call Presentation 3rd Quarter 2020 October 27, 2020 Exhibit 99.2
Our disclosures in this presentation, including without limitation, those relating to future financial results market conditions and guidance, and in our other public documents and comments contain forward-looking statements within the meaning of the Private Securities Litigation Reform Act. Those statements provide our future expectations or forecasts and can be identified by our use of words such as “anticipate,” “estimate,” “expect,” “project,” “intend,” “plan,” “believe,” “outlook,” “target,” “predict,” “may,” “will,” “would,” “could,” “should,” “seek,” and other words or phrases of similar meaning in connection with any discussion of future operating or financial performance. Forward-looking statements, by their nature, address matters that are uncertain and involve risks because they relate to events and depend on circumstances that may or may not occur in the future. As a result, our actual results may differ materially from our expected results and from those expressed in our forward-looking statements. A more detailed discussion of the risks and uncertainties that may affect our ability to achieve the projected performance is included in the “Risk Factors” and “Management’s Discussion and Analysis” sections of our reports on Forms 10-K and 10-Q filed with the U.S. Securities and Exchange Commission (“SEC”). Forward-looking statements speak only as of the date they are made. We undertake no obligation to update any forward-looking statements beyond what is required under applicable securities law. In addition, we will be referring to non-GAAP financial measures within the meaning of SEC Regulation G. A reconciliation of the differences between these measures with the most directly comparable financial measures calculated in accordance with GAAP are included within this presentation and available on the Investor Relations page of our website at www.armstrongceilings.com. The guidance in this presentation is only effective as of the date given, October 27, 2020 and will not be updated or affirmed unless and until we publicly announce updated or affirmed guidance Safe Harbor Statement
All figures throughout the presentation are in $ millions unless otherwise noted. Figures may not add due to rounding. When reporting our financial results within this presentation, we make adjustments to normalize the results. Management uses these non-GAAP measures in managing the business and believes the adjustments provide meaningful comparisons of operating performance between periods. As reported results will be footnoted throughout the presentation. Basis of Presentation Explanation Results throughout this presentation are presented on a normalized basis with the exception of cash flow. We remove the impact of certain discrete expenses and income. Examples include plant closures, restructuring actions, separation costs, environmental site expenses and related insurance recoveries, and other large unusual items. We also adjust for our U.S. pension plan (credit) expense(1). Our tax rate is adjusted for certain discrete items which are identified in the footnotes Investors should not consider non-GAAP measures as a substitute for GAAP measures. U.S. pension (credit) expense represents the actuarial net periodic benefit cost expected to be recorded as a component of earnings from continuing operations. For all periods presented, we were not required and did not make cash contributions to our U.S. Retirement Income Plan based on guidelines established by the Pension Benefit Guaranty Corporation.
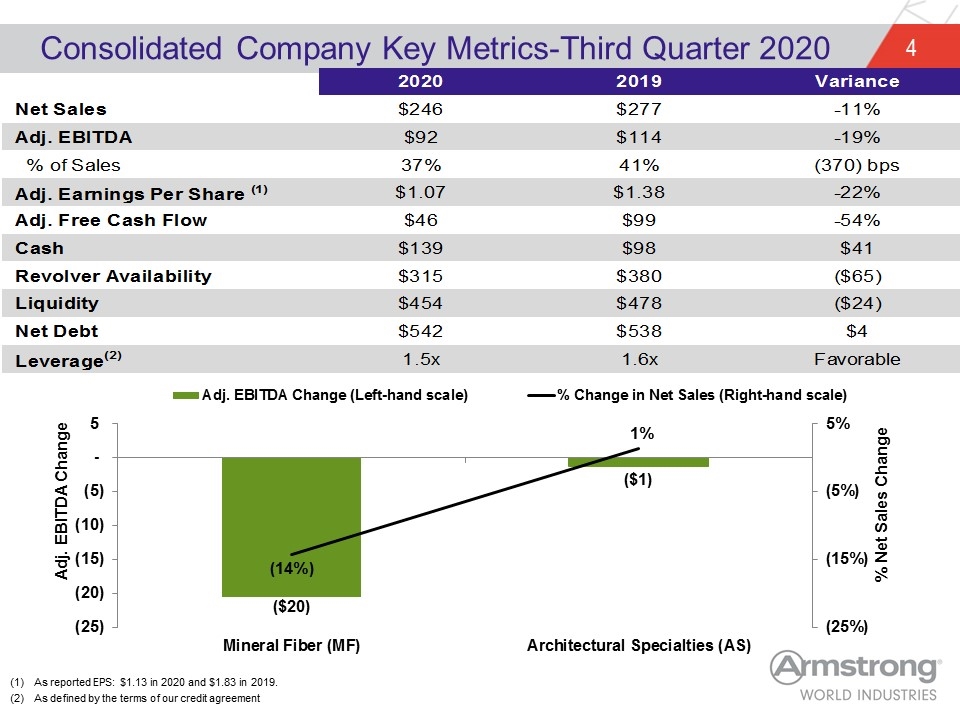
Consolidated Company Key Metrics-Third Quarter 2020 As reported EPS: $1.13 in 2020 and $1.83 in 2019. As defined by the terms of our credit agreement 2020 2019 Variance Net Sales $246.3 $0 $277.10000000000002 -0.11115120894983765 Adj. EBITDA $91.745457000000002 $0 $113.5 $0 -0.19166998237885458 % of Sales 0.37249475030450668 0.40959942259112231 -370 bps hardcode watchout Adj. Earnings Per Share (1) $1.072229055775697 $1.3800238847777779 -0.223035870898455 Adj. Free Cash Flow $46 $99 -0.53535353535353536 Cash $138.80000000000001 $98 $40.800000000000011 Revolver Availability $315 $380 $-65 Liquidity $453.8 $478 $-24.199999999999989 Net Debt $542 $538 $4 Leverage(2) 1.5x 1.6x Favorable
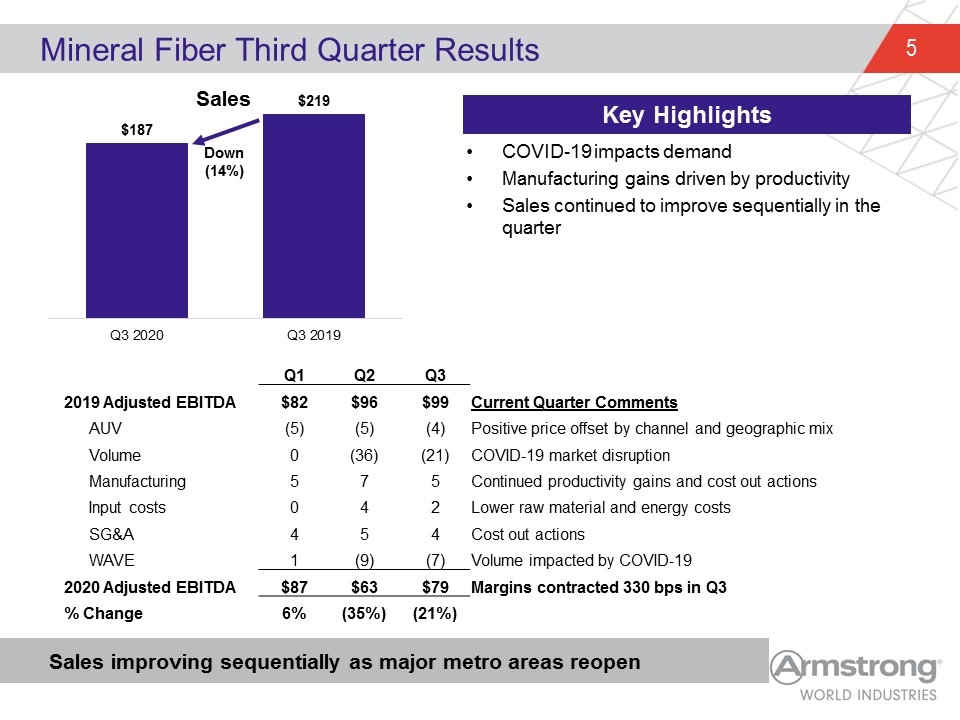
COVID-19 impacts demand Manufacturing gains driven by productivity Sales continued to improve sequentially in the quarter Mineral Fiber Third Quarter Results Sales improving sequentially as major metro areas reopen Key Highlights Q1 Q2 Q3 2019 Adjusted EBITDA $82 $96 $99 Current Quarter Comments AUV (5) (5) (4) Positive price offset by channel and geographic mix Volume 0 (36) (21) COVID-19 market disruption Manufacturing 5 7 5 Continued productivity gains and cost out actions Input costs 0 4 2 Lower raw material and energy costs SG&A 4 5 4 Cost out actions WAVE 1 (9) (7) Volume impacted by COVID-19 2020 Adjusted EBITDA $87 $63 $79 Margins contracted 330 bps in Q3 % Change 6% (35%) (21%)
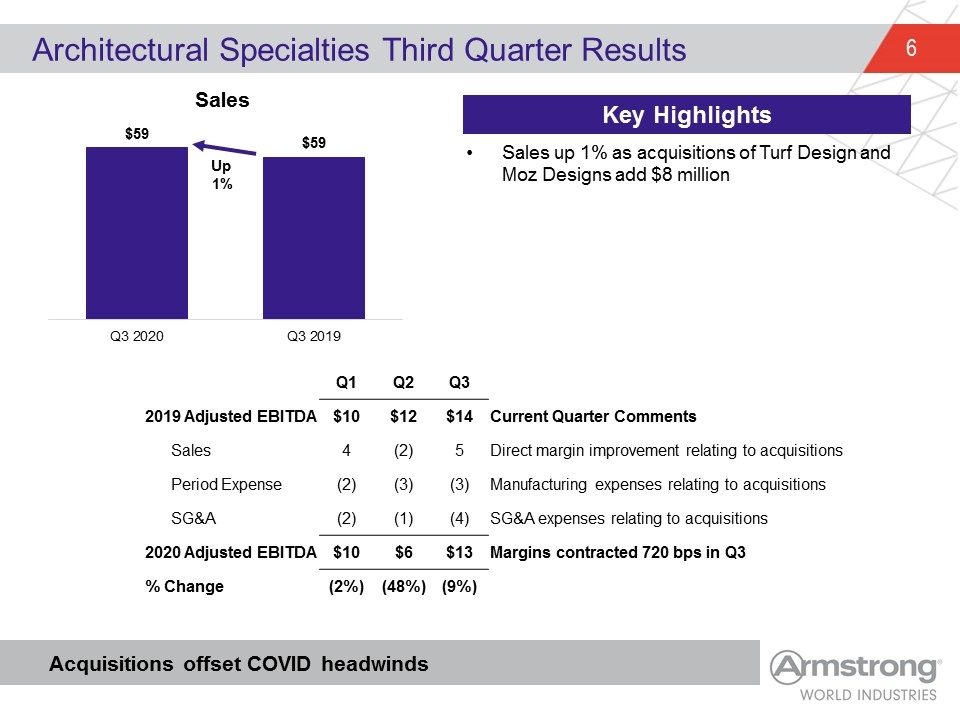
Sales up 1% as acquisitions of Turf Design and Moz Designs add $8 million Architectural Specialties Third Quarter Results Acquisitions offset COVID headwinds Key Highlights Q1 Q2 Q3 2019 Adjusted EBITDA $10 $12 $14 Current Quarter Comments Sales 4 (2) 5 Direct margin improvement relating to acquisitions Period Expense (2) (3) (3) Manufacturing expenses relating to acquisitions SG&A (2) (1) (4) SG&A expenses relating to acquisitions 2020 Adjusted EBITDA $10 $6 $13 Margins contracted 720 bps in Q3 % Change (2%) (48%) (9%)
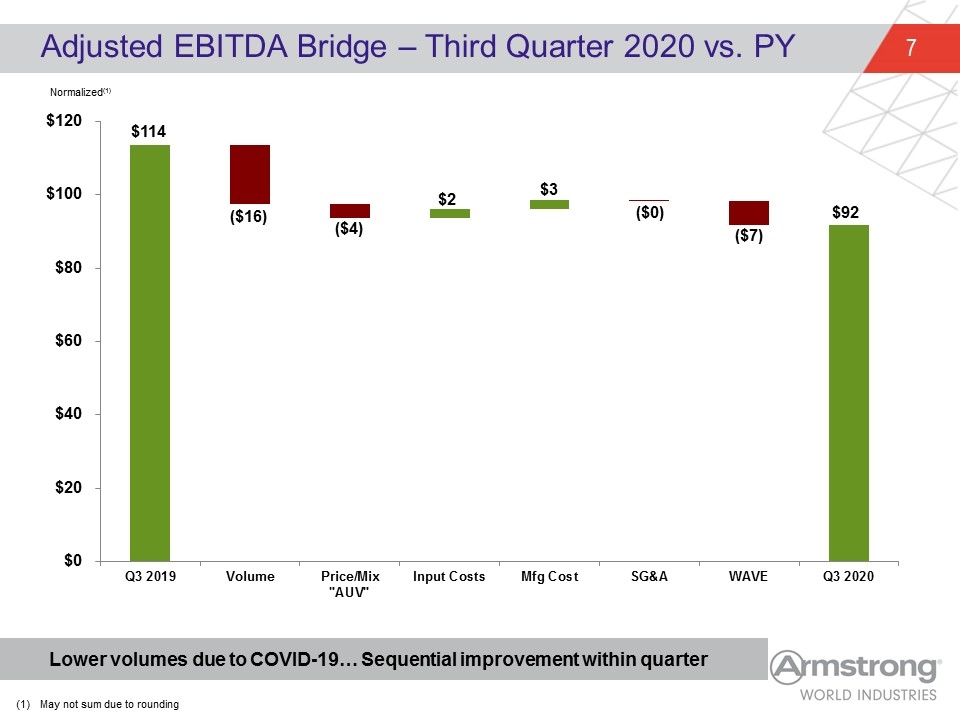
Adjusted EBITDA Bridge – Third Quarter 2020 vs. PY ($16) ($4) $2 ($0) $3 ($7) Lower volumes due to COVID-19… Sequential improvement within quarter Normalized(1) May not sum due to rounding
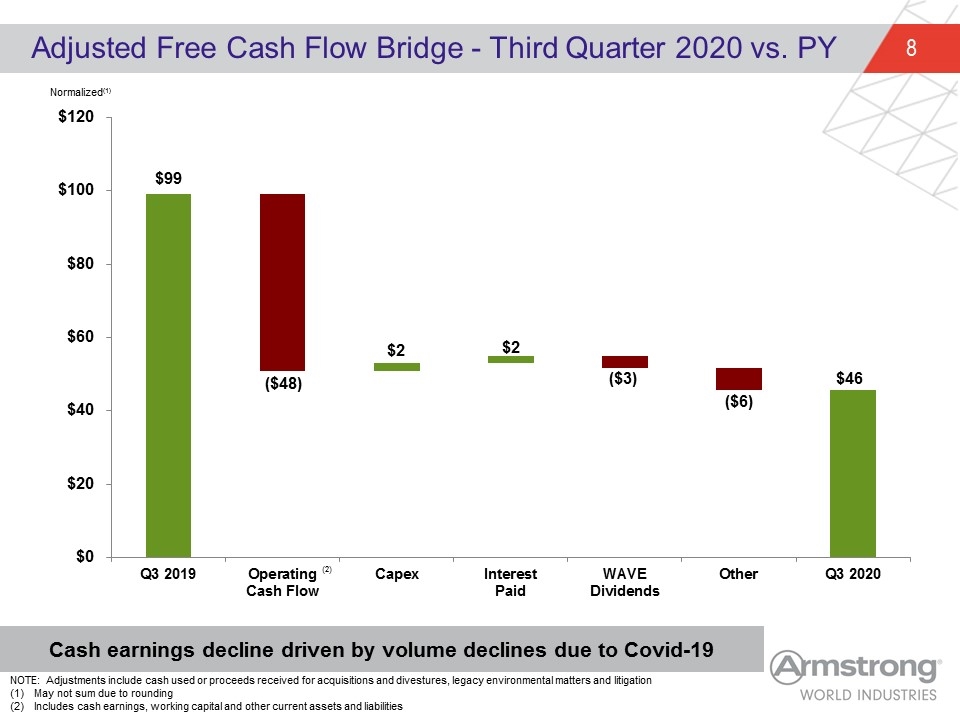
Adjusted Free Cash Flow Bridge - Third Quarter 2020 vs. PY $2 Cash earnings decline driven by volume declines due to Covid-19 ($48) $2 ($6) (2) NOTE: Adjustments include cash used or proceeds received for acquisitions and divestures, legacy environmental matters and litigation May not sum due to rounding Includes cash earnings, working capital and other current assets and liabilities Normalized(1) $46 ($3)
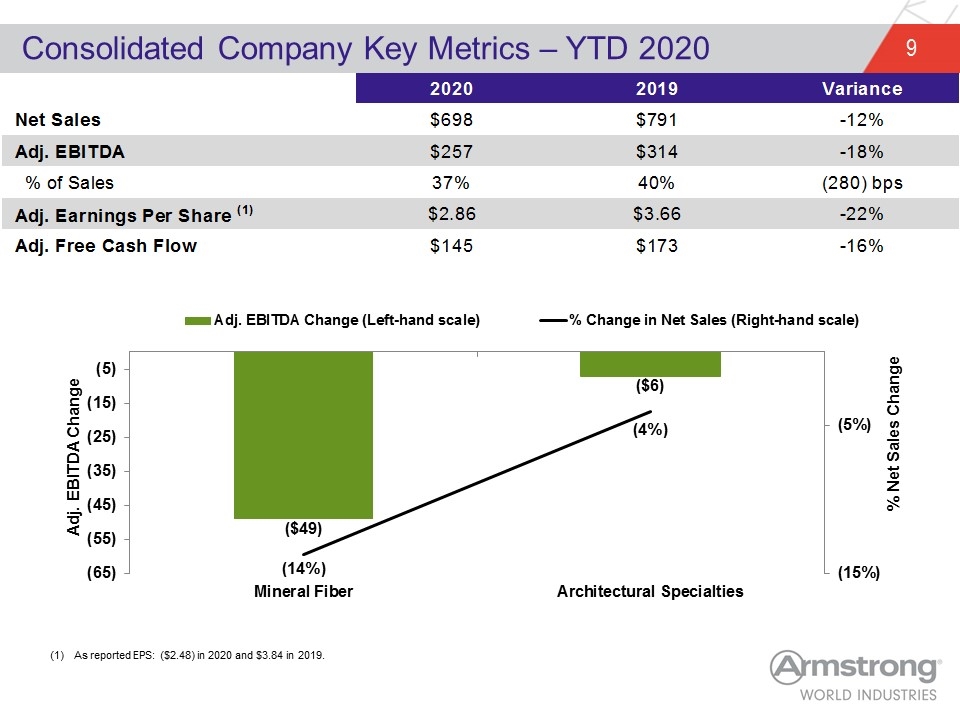
Consolidated Company Key Metrics – YTD 2020 As reported EPS: ($2.48) in 2020 and $3.84 in 2019. 2020 2019 Variance Net Sales $698.2 $0 $791.2 -0.1175429726996966 Adj. EBITDA $257.29755599999999 $0 $313.53100000000001 $0 -0.17935529182122345 % of Sales 0.36851554855342306 0.39627275025278058 -280 Adj. Earnings Per Share (1) $2.86 $3.66 -0.21857923497267762 Adj. Free Cash Flow $145 $173 -0.16184971098265896
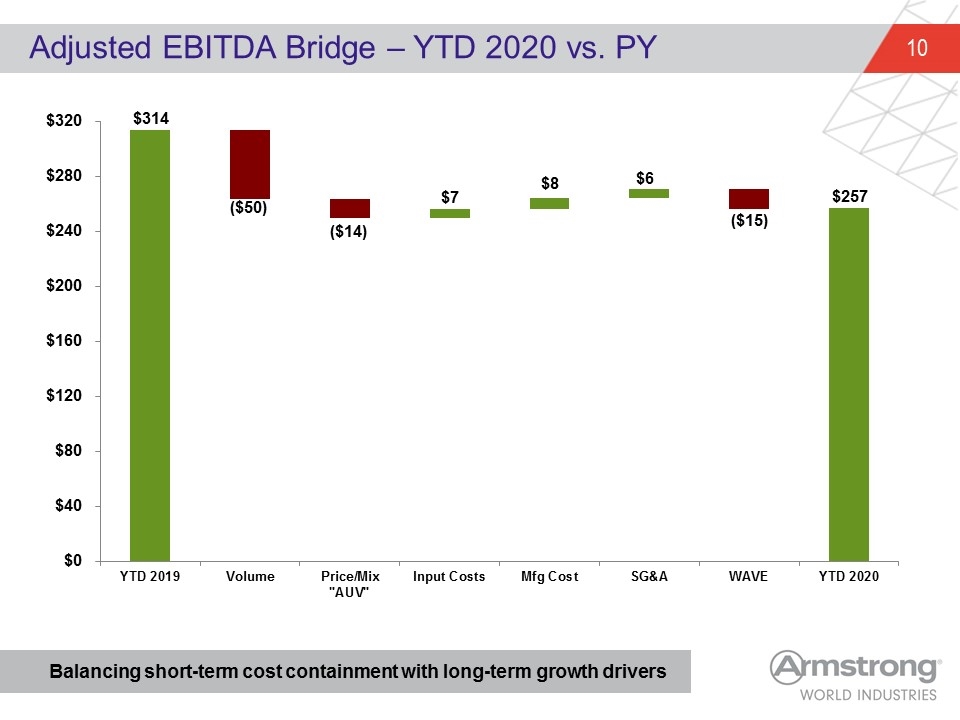
Adjusted EBITDA Bridge – YTD 2020 vs. PY ($50) ($14) $7 $6 $8 ($15) Balancing short-term cost containment with long-term growth drivers
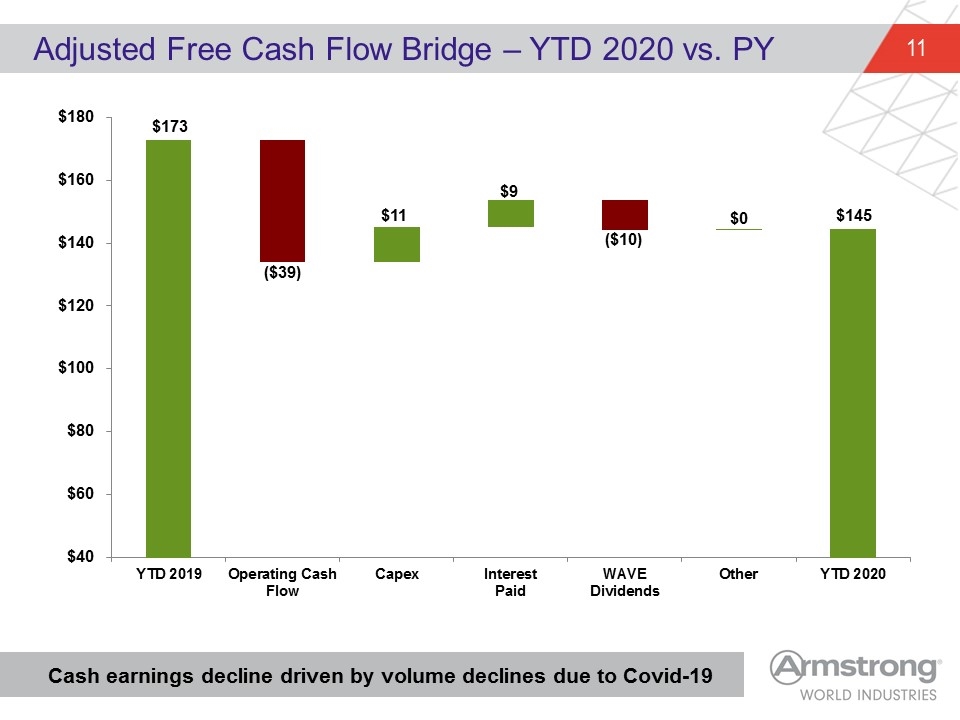
Adjusted Free Cash Flow Bridge – YTD 2020 vs. PY ($39) Cash earnings decline driven by volume declines due to Covid-19 $11 $9 ($10) $0
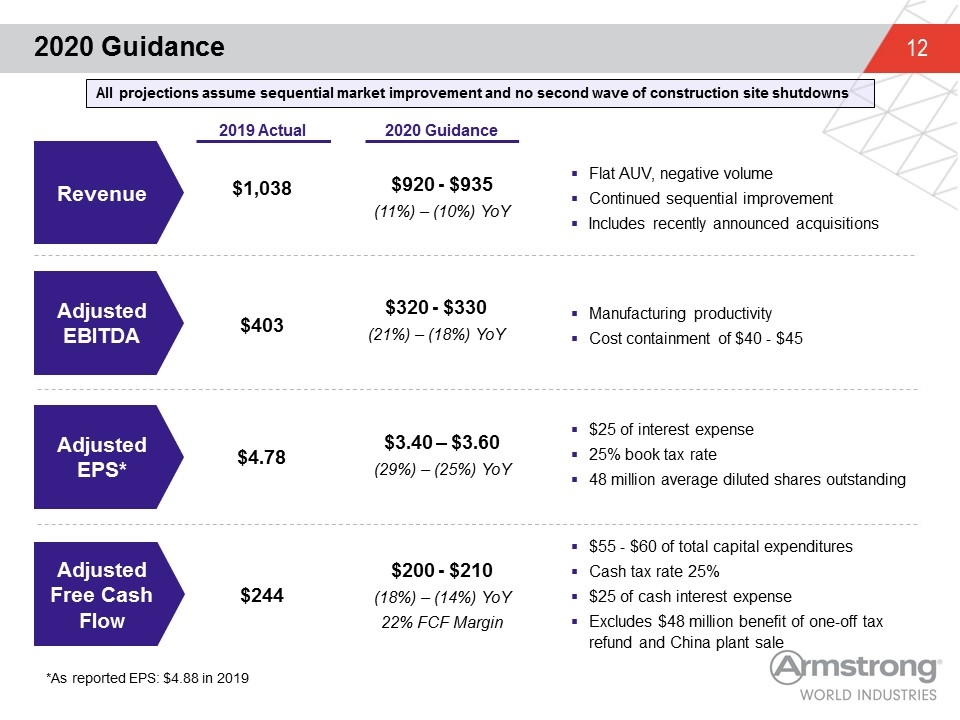
2020 Guidance $3.40 – $3.60 (29%) – (25%) YoY $4.78 Adjusted EBITDA Adjusted EPS* Adjusted Free Cash Flow Revenue $1,038 $403 $920 - $935 (11%) – (10%) YoY $320 - $330 (21%) – (18%) YoY Flat AUV, negative volume Continued sequential improvement Includes recently announced acquisitions Manufacturing productivity Cost containment of $40 - $45 $55 - $60 of total capital expenditures Cash tax rate 25% $25 of cash interest expense Excludes $48 million benefit of one-off tax refund and China plant sale 2019 Actual 2020 Guidance $25 of interest expense 25% book tax rate 48 million average diluted shares outstanding $200 - $210 (18%) – (14%) YoY 22% FCF Margin $244 *As reported EPS: $4.88 in 2019 All projections assume sequential market improvement and no second wave of construction site shutdowns
Appendix
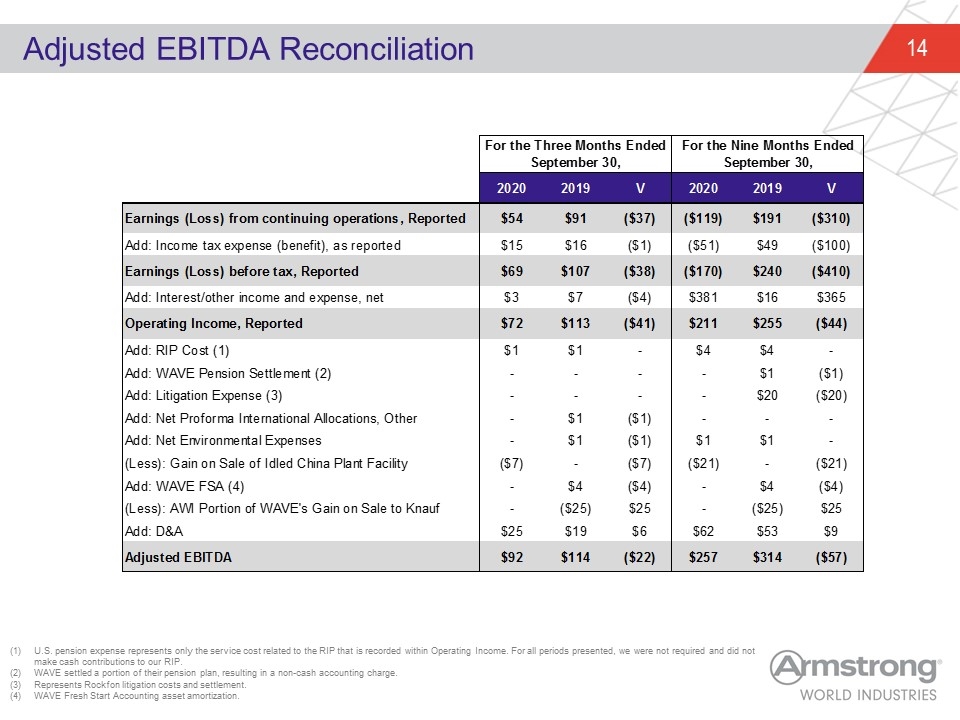
Adjusted EBITDA Reconciliation U.S. pension expense represents only the service cost related to the RIP that is recorded within Operating Income. For all periods presented, we were not required and did not make cash contributions to our RIP. WAVE settled a portion of their pension plan, resulting in a non-cash accounting charge. Represents Rockfon litigation costs and settlement. WAVE Fresh Start Accounting asset amortization. CONSOLIDATED For the Three Months Ended September 30, For the Nine Months Ended September 30, qtr YTD 2020 2019 V 2020 2019 V Earnings (Loss) from continuing operations, Reported 54 91 -37 -119 191 -310 rounding Add: Income tax expense (benefit), as reported 15 16 -1 -51 49 -100 Earnings (Loss) before tax, Reported 69 107 -38 -170 240 -410 rounding Add: Interest/other income and expense, net 3 7 -4 381 16 365 Operating Income, Reported 72 113 -41 211 255 -44 Add: RIP Cost (1) 1 1 0 4 4 0 Add: WAVE Pension Settlement (2) 0 0 0 0 1 -1 Add: Litigation Expense (3) 0 0 0 0 20 -20 Add: Net Proforma International Allocations, Other 0 1 -1 0 0 0 Add: Net Environmental Expenses 0 1 -1 1 1 0 (Less): Gain on Sale of Idled China Plant Facility -7 0 -7 -21 0 -21 Add: WAVE FSA (4) 0 4 -4 0 4 -4 (Less): AWI Portion of WAVE's Gain on Sale to Knauf 0 -25 25 0 -25 25 Add: D&A 25 19 6 62 53 9 Adjusted EBITDA 92 114 -22 257 314 -57 rounding -0.19298245614035092 -0.18152866242038215
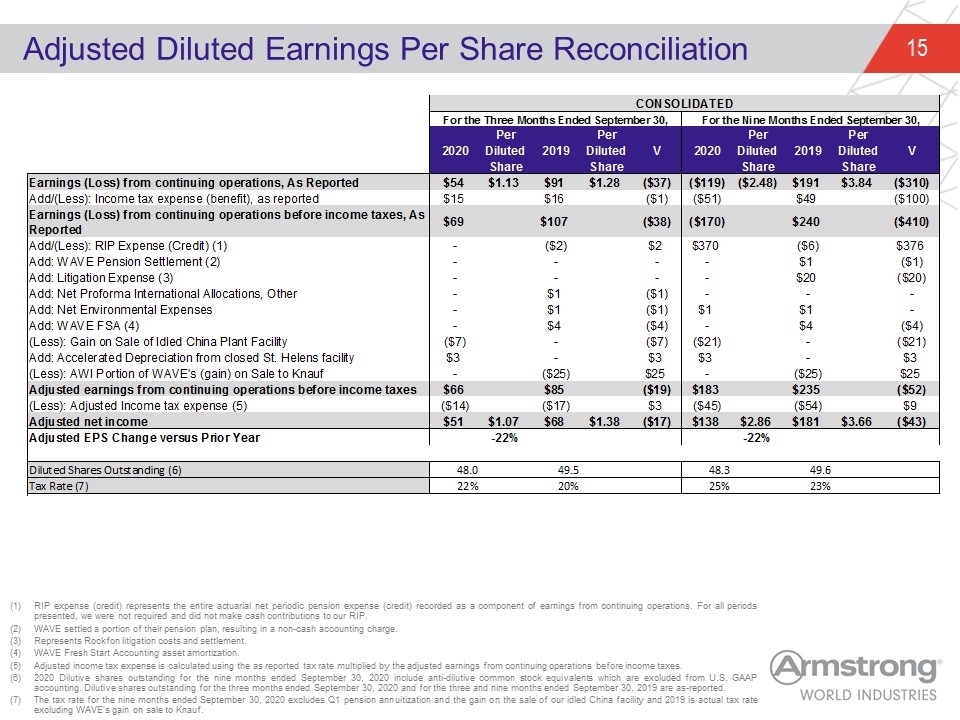
Adjusted Diluted Earnings Per Share Reconciliation RIP expense (credit) represents the entire actuarial net periodic pension expense (credit) recorded as a component of earnings from continuing operations. For all periods presented, we were not required and did not make cash contributions to our RIP. WAVE settled a portion of their pension plan, resulting in a non-cash accounting charge. Represents Rockfon litigation costs and settlement. WAVE Fresh Start Accounting asset amortization. Adjusted income tax expense is calculated using the as reported tax rate multiplied by the adjusted earnings from continuing operations before income taxes. 2020 Dilutive shares outstanding for the nine months ended September 30, 2020 include anti-dilutive common stock equivalents which are excluded from U.S. GAAP accounting. Dilutive shares outstanding for the three months ended September 30, 2020 and for the three and nine months ended September 30, 2019 are as-reported. The tax rate for the nine months ended September 30, 2020 excludes Q1 pension annuitization and the gain on the sale of our idled China facility and 2019 is actual tax rate excluding WAVE’s gain on sale to Knauf. CONSOLIDATED For the Three Months Ended September 30, For the Nine Months Ended September 30, 2020 Per Diluted 2019 Per Diluted V 2020 Per Diluted 2019 Per Diluted V Share Share Share Share Earnings (Loss) from continuing operations, As Reported $54 $1.1299999999999999 $91 $1.28 $-37 $-,119 $-2.48 $191 $3.84 $-,310 Add/(Less): Income tax expense (benefit), as reported $15 $16 $-1 $-51 $49 $-,100 Earnings (Loss) from continuing operations before income taxes, As Reported $69 $107 $-38 $-,170 $240 $-,410 Add/(Less): RIP Expense (Credit) (1) 0 $-2 $2 $370 $-6 $376 Add: WAVE Pension Settlement (2) 0 0 0 0 $1 $-1 Add: Litigation Expense (3) 0 0 0 0 $20 $-20 Add: Net Proforma International Allocations, Other 0 $1 $-1 0 0 0 Add: Net Environmental Expenses 0 $1 $-1 $1 $1 0 Add: WAVE FSA (4) 0 $4 $-4 0 $4 $-4 $0 (Less): Gain on Sale of Idled China Plant Facility $-7 0 $-7 $-21 0 $-21 0 Add: Accelerated Depreciation from closed St. Helens facility $3.2 0 $3.2 $3.2 0 $3.2 (Less): AWI Portion of WAVE's (gain) on Sale to Knauf 0 $-25 $25 0 $-25 $25 Adjusted earnings from continuing operations before income taxes $65.900543000000027 $85 $-19.099456999999973 $183.14378000000002 $235 $-51.856219999999979 (Less): Adjusted Income tax expense (5) $-14.433548322766573 $-17 $2.5664516772334274 $-45.053369880000005 $-54 $8.9466301199999947 Adjusted net income $51.466994677233458 $1.072229055775697 $68 $1.38 $-16.533005322766542 $138.09041012 $2.86 $181 $3.66 $-42.909589879999999 Adjusted EPS Change versus Prior Year -0.22303587089845506 -0.21857923497267767 Diluted Shares Outstanding (6) 48 49.5 48.3 49.6 Tax Rate (7) 0.22 0.2 0.246 0.23
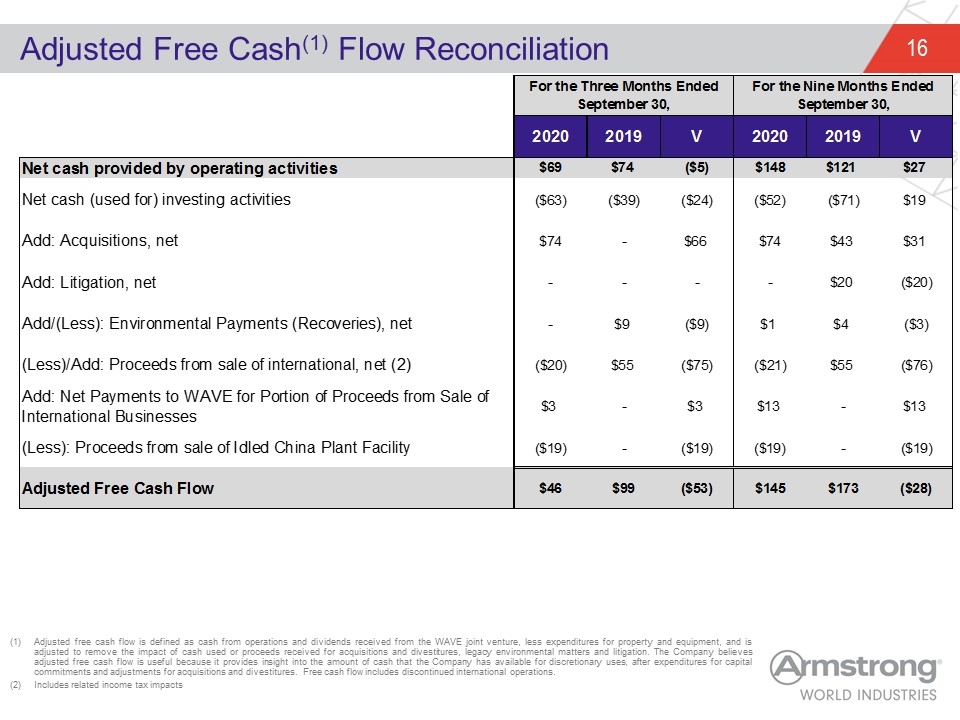
Adjusted Free Cash(1) Flow Reconciliation Adjusted free cash flow is defined as cash from operations and dividends received from the WAVE joint venture, less expenditures for property and equipment, and is adjusted to remove the impact of cash used or proceeds received for acquisitions and divestitures, legacy environmental matters and litigation. The Company believes adjusted free cash flow is useful because it provides insight into the amount of cash that the Company has available for discretionary uses, after expenditures for capital commitments and adjustments for acquisitions and divestitures. Free cash flow includes discontinued international operations. Includes related income tax impacts For the Three Months Ended September 30, For the Nine Months Ended September 30, 2020 2019 V 2020 2019 V Net cash provided by operating activities $69 $74 $-5 $148 $121 $27 Net cash (used for) investing activities $-63 $-39 $-24 $-52 $-71 $19 Add: Acquisitions, net $74 - $66 $74 $43 $31 Add: Litigation, net - - - - $20 $-20 Add/(Less): Environmental Payments (Recoveries), net - $9 $-9 $1 $4 $-3 (Less)/Add: Proceeds from sale of international, net (2) $-20 $55 $-75 $-21 $55 $-76 Add: Net Payments to WAVE for Portion of Proceeds from Sale of International Businesses $3 - $3 $13 - $13 (Less): Proceeds from sale of Idled China Plant Facility $-19 - $-19 $-19 - $-19 Adjusted Free Cash Flow $46 $99 $-53 $145 $173 $-28 -0.53535353535353536 -0.16184971098265896
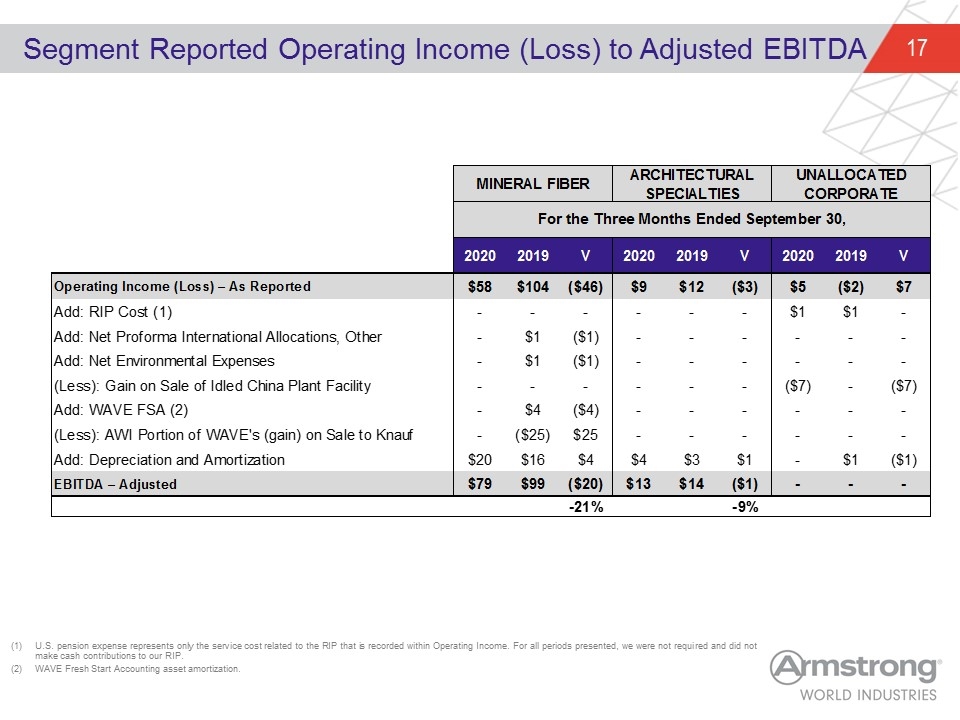
Segment Reported Operating Income (Loss) to Adjusted EBITDA U.S. pension expense represents only the service cost related to the RIP that is recorded within Operating Income. For all periods presented, we were not required and did not make cash contributions to our RIP. WAVE Fresh Start Accounting asset amortization. MINERAL FIBER ARCHITECTURAL SPECIALTIES UNALLOCATED CORPORATE For the Three Months Ended September 30, 2016 V 2020 2019 V 2020 2019 V 2020 2019 V Operating Income (Loss) – As Reported 58 104 -46 9 12 -3 5 -2.1 7.1 Add: RIP Cost (1) 0 0 0 0 0 0 1.3660650000000001 1.1902507499999999 0 Add: Net Proforma International Allocations, Other 0 1 -1 0 0 0 0 0 0 Add: Net Environmental Expenses 0 1 -1 0 0 0 0 0 0 (Less): Gain on Sale of Idled China Plant Facility 0 0 0 0 0 0 -7 0 -7 Add: WAVE FSA (2) 0 4 -4 0 0 0 0 0 0 (Less): AWI Portion of WAVE's (gain) on Sale to Knauf 0 -25 25 0 0 0 0 0 0 Add: Depreciation and Amortization 20 16 4 4 3 1 0 0.90974925000000018 -0.90974925000000018 EBITDA – Adjusted 78.84 99.3 -20.459999999999994 12.9 14.2 -1.2999999999999989 0 0 0 -0.20604229607250746 -9.1549295774647765E-2
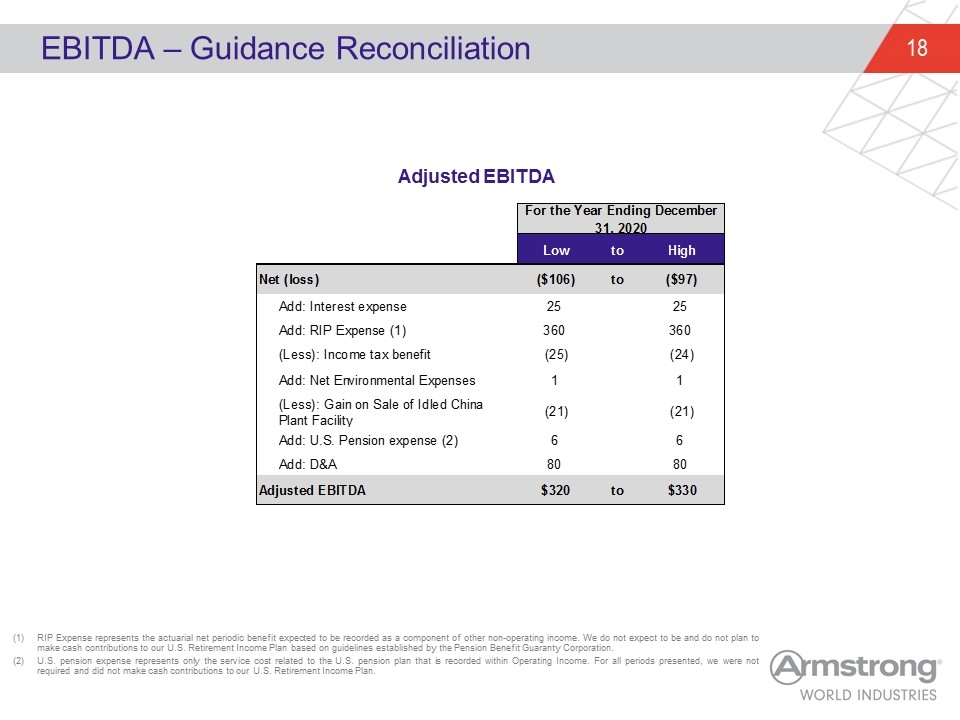
EBITDA – Guidance Reconciliation Adjusted EBITDA RIP Expense represents the actuarial net periodic benefit expected to be recorded as a component of other non-operating income. We do not expect to be and do not plan to make cash contributions to our U.S. Retirement Income Plan based on guidelines established by the Pension Benefit Guaranty Corporation. U.S. pension expense represents only the service cost related to the U.S. pension plan that is recorded within Operating Income. For all periods presented, we were not required and did not make cash contributions to our U.S. Retirement Income Plan. For the Year Ending December 31, 2020 Low to High Net (loss) $-,106 to $-97 Add: Interest expense 25 25 Add: RIP Expense (1) 360 360 (Less): Income tax benefit -25 -24 Add: Net Environmental Expenses 1 1 (Less): Gain on Sale of Idled China Plant Facility -21 -21 Add: U.S. Pension expense (2) 6 6 Add: D&A 80 80 Adjusted EBITDA $320 to $330
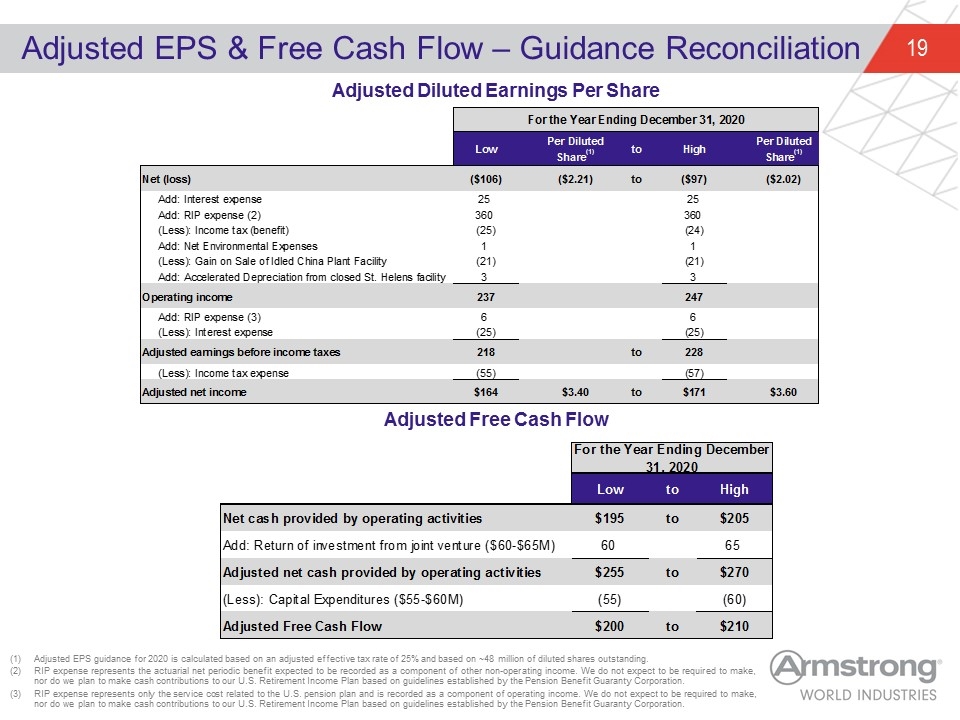
Adjusted EPS & Free Cash Flow – Guidance Reconciliation Adjusted Diluted Earnings Per Share Adjusted Free Cash Flow Adjusted EPS guidance for 2020 is calculated based on an adjusted effective tax rate of 25% and based on ~48 million of diluted shares outstanding. RIP expense represents the actuarial net periodic benefit expected to be recorded as a component of other non-operating income. We do not expect to be required to make, nor do we plan to make cash contributions to our U.S. Retirement Income Plan based on guidelines established by the Pension Benefit Guaranty Corporation. RIP expense represents only the service cost related to the U.S. pension plan and is recorded as a component of operating income. We do not expect to be required to make, nor do we plan to make cash contributions to our U.S. Retirement Income Plan based on guidelines established by the Pension Benefit Guaranty Corporation. For the Year Ending December 31, 2020 Low to High Net cash provided by operating activities $195 to $205 Add: Return of investment from joint venture ($60-$65M) 60 65 Adjusted net cash provided by operating activities $255 to $270 (Less): Capital Expenditures ($55-$60M) -55 -60 Adjusted Free Cash Flow $200 to $210 For the Year Ending December 31, 2020 Low Per DilutedShare(1) to High Per DilutedShare(1) Net (loss) $-,106 $-2.21 to $-97 $-2.02 low high Add: Interest expense 25 25 Add: RIP expense (2) 360 360 (Less): Income tax (benefit) -25 -24 Add: Net Environmental Expenses 1 1 (Less): Gain on Sale of Idled China Plant Facility -21 -21 Add: Accelerated Depreciation from closed St. Helens facility 3.181 3.181 Operating income 237.18100000000001 247.18100000000001 Add: RIP expense (3) 6 6 (Less): Interest expense -25 -25 Adjusted earnings before income taxes 218.18100000000001 to 228.18100000000001 (Less): Income tax expense -55 -57 rate 0.25 0.25 Adjusted net income $164 $3.4 to $171.18100000000001 $3.6 shares 48 48 $226.25 $4.6173469387755102 to $241.3 $4.924489795918368 $40 $40 $-20 $-20 $68.775000000000006 $73.775000000000006 $315.10000000000002 $335.1 $5 $5 $-40 $-40 $280.10000000000002 to $300.10000000000002 $-70.025000000000006 $-75.025000000000006 $210.07500000000002 $4.3765625000000004 to $225.07500000000002 $4.6890625000000004
