Attached files
| file | filename |
|---|---|
| EX-99.1 - EX-99.1 - TransUnion | exhibit9919302020.htm |
| 8-K - 8-K - TransUnion | ck0001552033-20201027.htm |

v Exhibit 99.2 v v TransUnion Third Quarter 2020 Earnings Chris Cartwright, President and CEO Todd Cello, CFO

Forward-Looking Statement This presentation contains forward-looking statements within the meaning of the Private Securities Litigation Reform Act of 1995. These statements are based on the current beliefs and expectations of TransUnion’s management and are subject to significant risks and uncertainties. Actual results may differ materially from those described in the forward-looking statements. Factors that could cause TransUnion’s actual results to differ materially from those described in the forward-looking statements, including the effects of the COVID-19 pandemic and the timing of the recovery from the COVID-19 pandemic, can be found in TransUnion’s Annual Report on Form 10-K for the year ended December 31, 2019, as modified in any subsequent Quarterly Report on Form 10-Q or Current Report on Form 8-K, which are filed with the Securities and Exchange Commission and are available on TransUnion's website (www.transunion.com/tru) and on the Securities and Exchange Commission's website (www.sec.gov). TransUnion undertakes no obligation to update the forward-looking statements to reflect the impact of events or circumstances that may arise after the date of the forward-looking statements. Factors that could cause actual results to differ materially from those described in the forward-looking statements. Non-GAAP Financial Information This investor presentation includes certain non-GAAP measures that are more fully described in Exhibit 99.1, “Non-GAAP Financial Measures,” of our Current Report on Form 8-K filed on October 27, 2020. These financial measures should be reviewed in conjunction with the relevant GAAP financial measures and are not presented as alternative measures of GAAP. Other companies in our industry may define or calculate these measures differently than we do, limiting their usefulness as comparative measures. Because of these limitations, these non-GAAP financial measures should not be considered in isolation or as substitutes for performance measures calculated in accordance with GAAP. Reconciliations of these non-GAAP financial measures to their most directly comparable GAAP financial measures are presented in the tables of Exhibit 99.1 of our Current Report on Form 8-K filed on October 27, 2020. © 2020 Trans Union LLC All Rights Reserved | 2

• Focus on the welfare of our associates, customers, consumers and communities • Continue to work from home globally • Making progress against commitment to foster greater diversity and inclusion for all associates and promote greater financial inclusion © 2020 Trans Union LLC All Rights Reserved | 3

Review third quarter 2020 results 1 and current business trends Update on strategic long-term 2 investments Detail third quarter 2020 3 financial performance Discuss reinstated fourth quarter and 4 full year 2020 guidance © 2020 Trans Union LLC All Rights Reserved | 4

U.S. Markets – Financial Services Trend Online Credit Report Unit Volumes Total U.S. Markets Financial Services Volume Additional trend data since Q2 2020 Earnings Release +8% January February March April May June July August September Oct.(1) 2019 2020 © 2020 Trans Union LLC All Rights Reserved | 5 (1) Volume growth/decline reflects year-over-year change for 7-day period ended October 23rd.

U.S. Markets – Financial Services End-Market Trends Online Credit Report Unit Volumes Mortgage Auto Additional trend data since Additional trend data since Q2 2020 Earnings Release Q2 2020 Earnings Release +59% (4%) January February March April May June July August September Oct.(1) January February March April May June July August September Oct.(1) Consumer Lending Card and Banking Additional trend data since Additional trend data since Q2 2020 Earnings Release Q2 2020 Earnings Release +10% Participation in significant new card launch (3%) January February March April May June July August September Oct.(1) January February March April May June July August September Oct.(1) (1) Volume growth/decline reflects year-over-year 2019 2020 © 2020 Trans Union LLC All Rights Reserved | 6 change for 7-day period ended October 23rd.

Emerging Markets Vertical Trends Vertical Current Trends TransUnion Outlook Improved performance in front-end offset by Near-term soft volumes on front-end will impact back- Healthcare lower volumes on back-end end, but no long-term structural change to market Success with innovative products and continued benefit Expect continued solid performance Insurance from diversifying across other insurance end markets Government agencies largely continue to Expect continued strong performance Public Sector operate unabated Tenant: expect trends to persist Tenant and Tenant: solid performance as leasing companies remain active Employment: expect modest recovery as economies Employment: remains strained given increased unemployment Employment slowly re-open Continued improvement as retail stores have reopened and Expect trends to persist Telco consumers have resumed a more normal purchase cadence Volume declines due to collections moratoriums, Don’t expect to see any significant uptick Collections forbearance programs and government stimulus until at least early 2021 © 2020 Trans Union LLC All Rights Reserved | 7

Consumer Interactive Trends Consumers recognize value of credit and identity protection, credit monitoring and related financial education tools • Direct channel: ─ Revenue acceleration behind continued successful marketing to consumers focused on their credit health • Indirect channel: ─ Indirect partners curtailing marketing programs, resulting in a decline in subscribers; now expect this slightly larger decline to persist in future quarters ─ Continue to have meaningful discussions with potential new partners © 2020 Trans Union LLC All Rights Reserved | 8

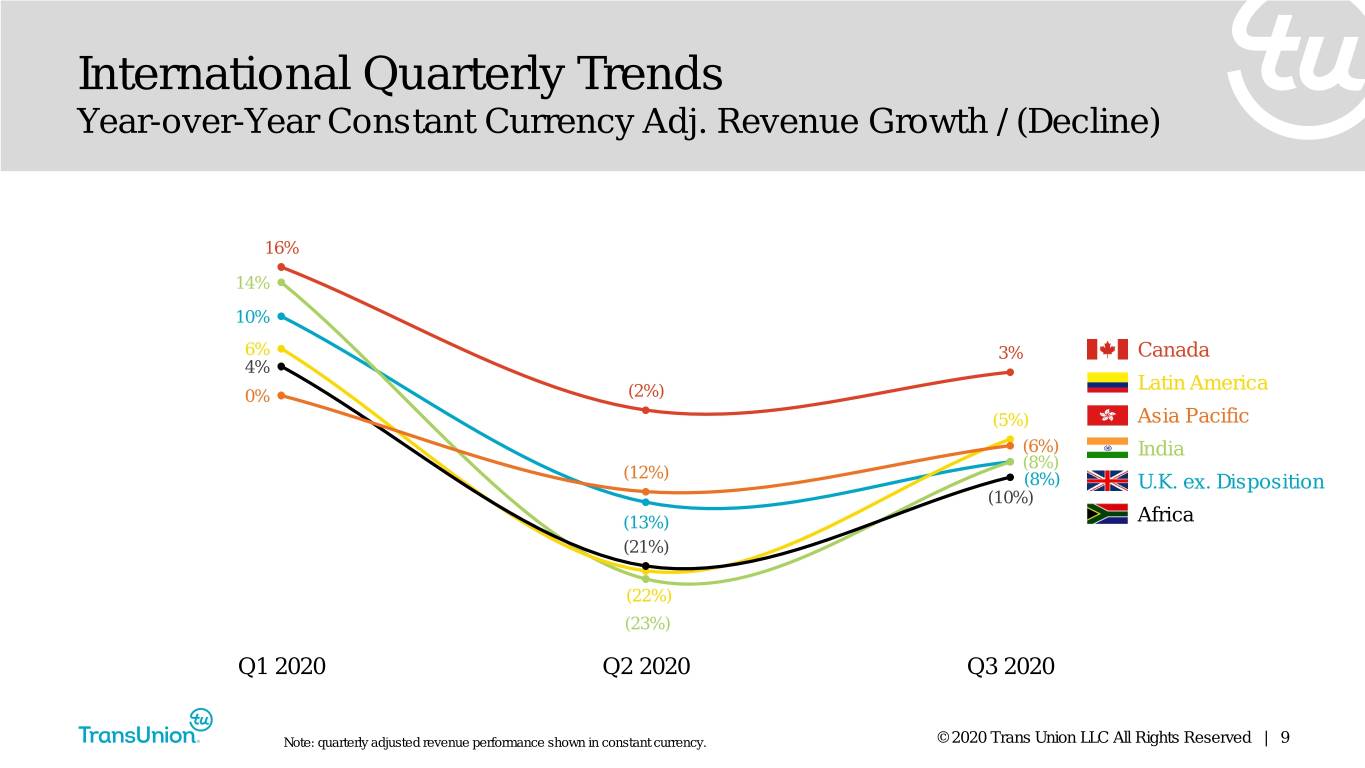
International Quarterly Trends Year-over-Year Constant Currency Adj. Revenue Growth / (Decline) 16% 14% 10% 6% 3% Canada 4% Latin America 0% (2%) (5%) Asia Pacific (6%) India (8%) (12%) (8%) U.K. ex. Disposition (10%) (13%) Africa (21%) (22%) (23%) Q1 2020 Q2 2020 Q3 2020 Note: quarterly adjusted revenue performance shown in constant currency. © 2020 Trans Union LLC All Rights Reserved | 9

International Trends Country or Portfolio Diversification Current Trends Region (Beyond Financial Services) Fraud solutions, government, Weak lending markets offset partially through U.K. gaming, affordability suite TU-specific strategies Fraud solutions, DTC offerings, Weak lending markets offset by Canada insurance and government verticals portfolio diversification Analytics and decisioning, fraud solutions, Progressive improvement India DTC offerings, commercial credit as the country has slowly re-opened Latin Improvement in Chile and Colombia from Q2; Data analytics business (Brazil) America limited in other countries Diversified portfolio with leading positions Economy remains challenged Africa in retail, auto information, insurance despite recent government stimulus Asia Portfolio and risk management, Hong Kong: market has stabilized Pacific fraud solutions, DTC offerings Philippines: facing significant headwinds © 2020 Trans Union LLC All Rights Reserved | 10

Global Operations Allows Us to Expand Our Core Capabilities, Enhancing the Customer Experience and Driving Greater Efficiencies Global Procurement: renegotiated largest supplier agreements, enabling us to better focus our spend and add new features or services to facilitate growth Global Capability Centers (GCC): opening second GCC in Pune, India by end of year ─ Primarily focused on Project Rise and other tech. initiatives Process Optimization: implementing tools to further enhance the customer experience © 2020 Trans Union LLC All Rights Reserved | 11

Global Solutions Will Improve Our Ability to Aggressively and Strategically Develop and Diffuse Innovation Globally Partnered with MX Technologies to incorporate consumer contributed data into our solutions Made minority equity investment and formed a commercial partnership agreement with FinLocker, a white label tool to facilitate online mortgage applications © 2020 Trans Union LLC All Rights Reserved | 12

We Have Built an Industry-leading Position in Media to Deliver Meaningful, Sustained Growth Acquisition May 2019 August 2020 October 2020 Date • Modern cloud-based platform • Products that allow us to work • Acquisition deepens our that marketers and media with clients to structure and understanding of connected Acquired companies use to build and activate their own audience consumers via a household distribute precisely defined intelligence identity graph, adding another Capabilities audience segments dimension to our ability to • Platform for real-time data match an individual to a broad and • Platform can be accessed collection and distribution that array of data as well as directly or integrated via API is already connected to Offerings persistent digital identifiers within other technology complementary advertising platforms and marketing technologies © 2020 Trans Union LLC All Rights Reserved | 13

Project Rise is Our Accelerated Technology Initiative to Ensure that We Are Even More Effective, Efficient, Secure, Reliable, and Performant Project Rise enables: Global Operations: migrating our consumer call center to the cloud in Q4 Global Solutions: partnerships benefit from modern technology stack and data architecture; Media vertical build would not have been possible without the cloud capabilities We remain confident in our timeline, anticipated investment and the benefits of Project Rise © 2020 Trans Union LLC All Rights Reserved | 14

Year-over-Year Change Revenue 1% Constant Currency Revenue 2% Consolidated Q3 2020 Organic Revenue 1% Highlights Organic Constant Currency Revenue 1% Adjusted EBITDA (4)% Constant Currency Adjusted EBITDA (3)% Organic Constant Currency Adjusted EBITDA (3)% Adjusted Diluted EPS 7% Note: For additional information, refer to the “Non-GAAP Financial Information” section on slide 2. © 2020 Trans Union LLC All Rights Reserved | 15

Inorganic Organic Constant Reported FX Impact Impact Currency U.S. Markets Q3 2020 Revenue 4% — — 4% Financial 11% — — 11% Year-over-Year Services Financial Emerging (3)% — (1)% (4)% Highlights Verticals Adjusted (2)% — — (2)% EBITDA Note: Rows may not foot due to rounding. For additional information, refer to the “Non-GAAP Financial Information” section on slide 2. © 2020 Trans Union LLC All Rights Reserved | 16

Organic Organic CC Inorganic Reported FX Impact Constant ex. Recipero Impact Currency Disposition International Revenue (9)% +3% — (7)% (6)% Q3 2020 Canada 2% +1% — 3% — Latin (18)% +13% — (5)% — Year-over-Year America Financial U.K. (7)% (4)% — (11)% (8)% Highlights Africa (22)% +12% — (10)% — India (13)% +5% — (8)% — Asia (4)% (2)% — (6)% — Pacific Adjusted (11)% +4% — (8)% — EBITDA Note: Rows may not foot due to rounding. For additional information, refer to the “Non-GAAP Financial Information” section on slide 2. © 2020 Trans Union LLC All Rights Reserved | 17

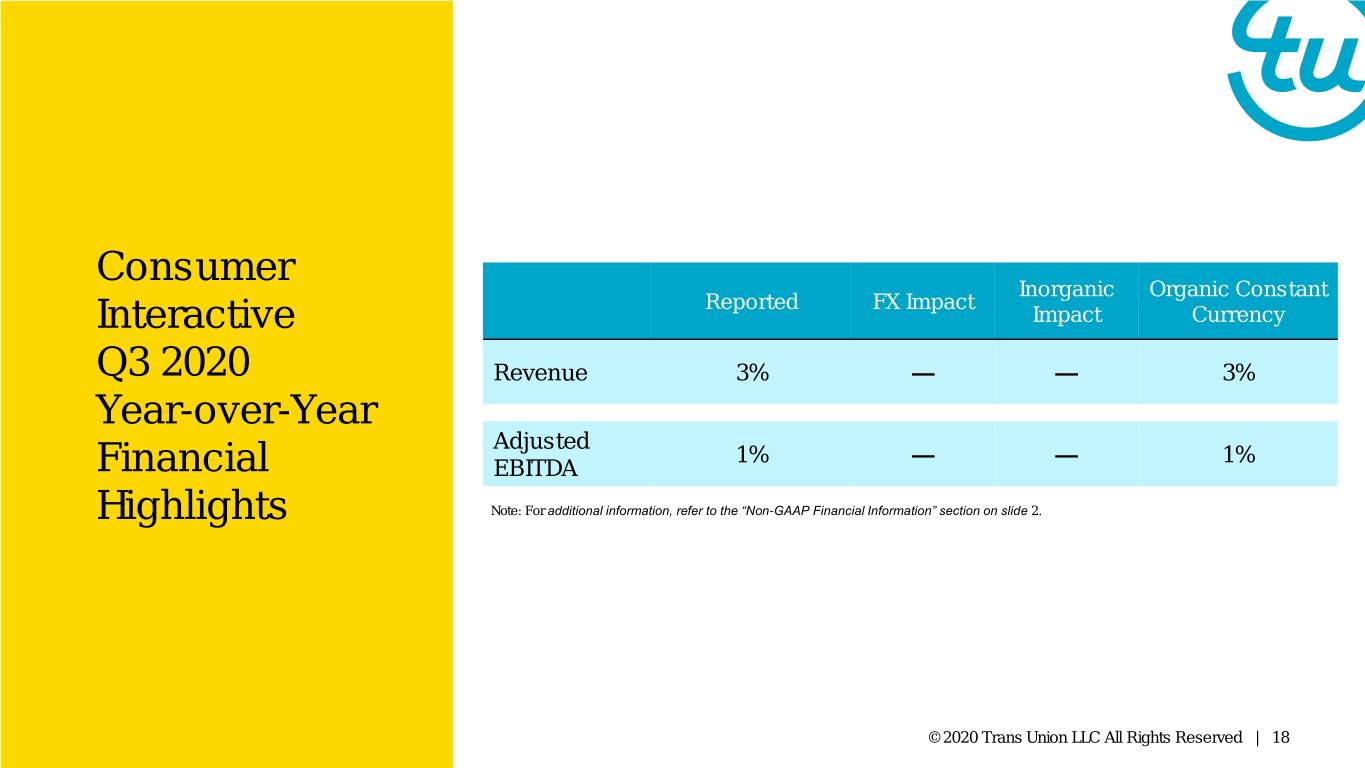
Consumer Inorganic Organic Constant Reported FX Impact Interactive Impact Currency Q3 2020 Revenue 3% — — 3% Year-over-Year Adjusted 1% — — 1% Financial EBITDA Highlights Note: For additional information, refer to the “Non-GAAP Financial Information” section on slide 2. © 2020 Trans Union LLC All Rights Reserved | 18

TransUnion Has a Strong Balance Sheet and the Ability to Rapidly Build Cash ($ in millions) $1,059 $1,083 $1,062 $1,032 $1,051 $996 $1,000 $953 $917 $864 6x $814 • Ended Q3 with $554M of cash $800 $779 on hand and have been able to 5x 4.9x avoid drawing on our revolver $600 4.5x • Significant de-levering since 4.2x 4x 4.0x completing meaningful $400 3.7x acquisitions in mid-2018 3.4x 3.2x 3x • Will continue to take prudent $200 3.1x 3.0x 2.9x approach to cash retention, but 2.9x actively pursuing additional $- 2x attractive investments Q1-18 Q2-18 Q3-18 Q4-18 Q1-19 Q2-19 Q3-19 Q4-19 Q1-20 Q2-20 Q3-20 TTM Adjusted EBITDA Net Leverage © 2020 Trans Union LLC All Rights Reserved | 19 Note: For additional information, refer to the “Non-GAAP Financial Information” section on slide 2.

Q4 2020 Financial Guidance Revenue $678M to $698M, down 1% to up 2% Reinstating • Organic CC down 1% to up 2% • Assumption: 1 point of M&A contribution, 1 point of Q4 and FY 2020 FX headwind Financial Adjusted EBITDA $255M to $271M, down 2 to 7% Guidance • Adjusted EBITDA margin down 140 to 260 bps • Assumption: 1 point of FX headwind Adjusted EPS of $0.74 to $0.80, down 1% to up 7% Note: For additional information, refer to the “Non-GAAP Financial Information” section on slide 2. © 2020 Trans Union LLC All Rights Reserved | 20

FY 2020 Financial Guidance Adjusted Revenue $2.696B to $2.715B, up 1 to 2% • Organic CC up 2 to 3% • Assumption: 1 point of FX headwind Adjusted EBITDA $1.031B to $1.047B, down 1 to 3% Reinstating • Adjusted EBITDA margin down 130 to 160 bps Q4 and FY 2020 • Assumption: 1 point of FX headwind Financial Adjusted EPS of $2.94 to $3.01, up 5 to 8% Guidance Adjusted Tax Rate: ~23% Total D&A: ~$365M • D&A ex. step-up from 2012 change in control and subsequent acquisitions: ~$170M Net Interest Exp.: ~$120M CapEx: ~7.5% of revenue Note: For additional information, refer to the “Non-GAAP Financial Information” section on slide 2. © 2020 Trans Union LLC All Rights Reserved | 21

• Continuing to effectively manage through the global stresses created by COVID-19 • Investing to position TransUnion for continued best-in-class growth • Prioritizing welfare of associates and broader communities © 2020 Trans Union LLC All Rights Reserved | 22

Q&A © 2020 Trans Union LLC All Rights Reserved | 23
