Attached files
| file | filename |
|---|---|
| EX-99.1 - EXHIBIT 99.1 - SOUTH PLAINS FINANCIAL, INC. | brhc10016261_ex99-1.htm |
| 8-K - 8-K - SOUTH PLAINS FINANCIAL, INC. | brhc10016261_8k.htm |
Exhibit 99.2

South Plains Financial Earnings Presentation Third Quarter, 2020 1

Safe Harbor Statement and Other Disclosures FORWARD-LOOKING STATEMENTSThis presentation contains, and
future oral and written statements of South Plains Financial, Inc. (“South Plains” or the “Company”) and City Bank (“or the “Bank”) may contain, statements about future events that constitute forward-looking statements within the meaning of the
Private Securities Litigation Reform Act of 1995. These forward-looking statements reflect South Plains’ current views with respect to, among other things, future events and South Plains’ financial performance. Any statements about South
Plains’ expectations, beliefs, plans, predictions, forecasts, objectives, assumptions or future events or performance are not historical facts and may be forward-looking. These statements are often, but not always, made through the use of words
or phrases such as “anticipate,” “believes,” “can,” “could,” “may,” “predicts,” “potential,” “should,” “will,” “estimate,” “plans,” “projects,” “continuing,” “ongoing,” “expects,” “intends” and similar words or phrases. Forward-looking
statements include, but are not limited to: (i) projections and estimates of revenues, expenses, income or loss, earnings or loss per share, and other financial items, including our estimated financial results for 2020, (ii) statements of
plans, objectives and expectations of South Plains or its management, (iii) statements of future economic performance, and (iv) statements of assumptions underlying such statements. Forward-looking statements should not be relied on because
they involve known and unknown risks, uncertainties and other factors, some of which are beyond the control of South Plains and City Bank. These risks, uncertainties and other factors may cause the actual results, performance, and achievements
of South Plains and City Bank to be materially different from the anticipated future results, performance or achievements expressed in, or implied by, the forward-looking statements. Factors that could cause such differences include, but are
not limited to, local, regional, national and international economic conditions, the extent of the impact of the COVID-19 pandemic, including the impact of actions taken by governmental and regulatory authorities in response to such pandemic,
such as the Coronavirus Aid, Relief, and Economic Security Act and subsequent related legislations, and the programs established thereunder, and City Bank’s participation in such programs, volatility of the financial markets, changes in
interest rates, regulatory considerations, competition and market expansion opportunities, changes in non-interest expenditures or in the anticipated benefits of such expenditures, the receipt of required regulatory approvals, changes in
non-performing assets and charge-offs, changes in tax laws, current or future litigation, regulatory examinations or other legal and/or regulatory actions, the impact of any tariffs, terrorist threats and attacks, acts of war or threats thereof
or other pandemics. Therefore, South Plains can give no assurance that the results contemplated in the forward-looking statements will be realized. For more information about these factors, please see South Plains’ reports filed with or
furnished to the SEC, including South Plains’ most recent Annual Report on Form 10-K and Quarterly Report on Form 10-Q on file with the U.S. Securities and Exchange Commission (the “SEC”), including the sections entitled "Risk Factors" and
"Management's Discussion and Analysis of Financial Condition and Results of Operations." Further, any forward-looking statement speaks only as of the date on which it is made and South Plains undertakes no obligation to update or revise any
forward-looking statement to reflect events or circumstances after the date on which the statement is made or to reflect the occurrence of unanticipated events, except as required by law. All forward-looking statements herein are qualified by
this cautionary statement.NON-GAAP FINANCIAL MEASURESManagement believes that certain non-GAAP performance measures used in this presentation provide meaningful information about underlying trends in its business and operations. Non-GAAP
financial measures should be viewed in addition to, and not as an alternative for, SPFI’s reported results prepared in accordance with GAAP. Numbers in this presentation may not sum due to rounding. 2

Today’s Speakers 3 Curtis C. GriffithChairman & Chief Executive Officer Elected to the board of
directors of First State Bank of Morton, Texas, in 1972 and employed by it in 1979Elected Chairman of the First State Bank of Morton board in 1984Chairman of the Board of City Bank and the Company since 1993 Steven B. CrockettChief Financial
Officer & Treasurer Began his career in public accounting in 1994 by serving for seven years with a local firm in Lubbock, TexasAppointed Chief Financial Officer in 2015Controller of the Bank and the Company for 14 and 5 years
respectively Cory T. NewsomPresident Entire banking career with the Company focused on lending and operationsAppointed President and Chief Executive Officer of the Bank in 2008Joined the Board in 2008 Brent A. BatesCity Bank’s Chief Credit
Officer Joined City Bank in February 2020Division Credit Officer for Simmons First National CorpEVP and Chief Credit Officer of Southwest Bancorp, Inc.

$3.5 Billion in Total Assets as of September 30, 2020 Parent Company of City Bank, a leading Texas-based
community bank headquartered in Lubbock, TX Third Quarter 2020 Highlights 4 Pre-Tax, Pre-Provision income of $26.9 million, compared to $20.1 million in 2Q’20 and $10.7 million in 3Q’19Net Income of $16.7 million, compared to $8.3 million in
3Q’19Earnings per share of $0.92, compared to $0.45 in 3Q’19Provision for loan loss of $6.1 million, compared to $420,000 in 3Q’19Nonperforming assets to total assets were 0.46% at September 30, 2020, compared to 0.33% at June 30, 2020 and
0.31% at September 30, 2019Average cost of deposits declined 64 basis points to 34 basis points, compared to 98 basis points in 3Q’19Net Interest Margin of 3.82%, compared to 3.79% in 2Q’20. Efficiency ratio was 56.90%, compared to 73.62% in
3Q’19Book value per share of $19.52, compared to $18.64 in 2Q’20 NASDAQ: SPFI 3Q'20 Highlights One of the largest independent banks headquartered in West Texas New Mexico Texas Dallas Bryan /College Station Houston Midland Odessa El
Paso Lubbock Ruidoso SanAntonio Ft. Worth Austin Albuquerque Santa Fe SPFI Branches (25)664 FTE Employees Note: Pre-tax, pre-provision income is a non-GAAP measure. See appendix for the reconciliation to GAAP as of Sep. 30,
2020 Source: Company documents

(Dollars in thousands) Total # of Active Active Mod % Loan Segment Balance Loan
Mods Mods of Segment Hospitality $ 119,360 35 $ 72,330 60.6% Hotels (Under Construction) 18,809 - - 0.0% All Other CRE 517,264 19 23,388 4.5% Oil & Gas 70,642 16 2,362
3.3% Restaurant & Retail - Owner Occ. 85,412 7 2,747 3.2% All Other Commercial 550,773 128 19,635 3.6% Residential Real Estate 372,114 15 2,469 0.7% Consumer 261,899 47
1,036 0.4% Residential Construction 80,149 - - 0.0% Paycheck Protection Program ("PPP") 211,812 - - 0.0% Total $ 2,288,234 267 $ 123,967 5.4% COVID-19 Loan Modifications –
Updated (As of September 30, 2020) 5 The Company has taken an aggressive and proactive approach to managing credit in light of the economic uncertaintyMost at-risk loans over $1 million have been assigned to the Bank’s Chairman, CEO, CLO,
or CCO for additional oversightAdditionally, customers were offered a range of loan modifications with six months interest only being the preferred option by the BankActive modifications do not include loans that were previously modified but
where the first scheduled payment post-modification has not been madeActive modifications as a percent of our loans held for investment have declined from 19.9% at June 30, 2020 to 5.4% at September 30, 2020 Highlights Active Loan
Modifications Source: Company documents
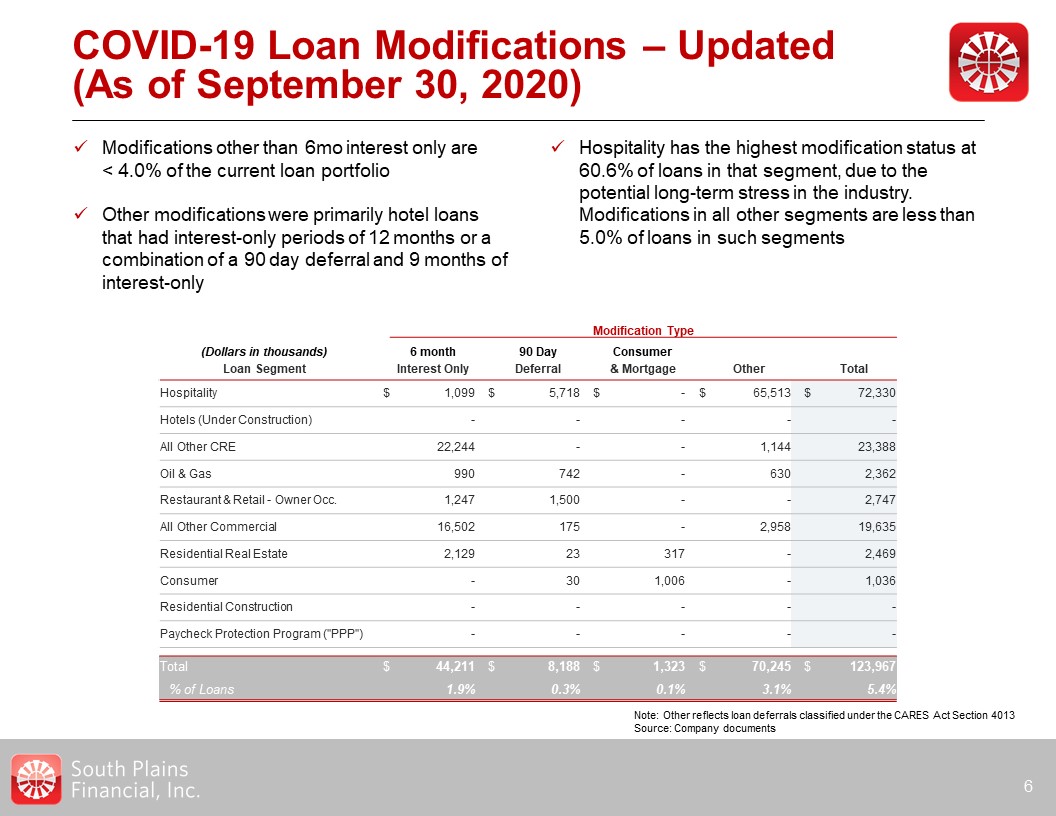
COVID-19 Loan Modifications – Updated (As of September 30, 2020) 6 Modifications other than 6mo
interest only are < 4.0% of the current loan portfolioOther modifications were primarily hotel loans that had interest-only periods of 12 months or a combination of a 90 day deferral and 9 months of interest-only Hospitality has the highest
modification status at 60.6% of loans in that segment, due to the potential long-term stress in the industry. Modifications in all other segments are less than 5.0% of loans in such segments Note: Other reflects loan deferrals classified under
the CARES Act Section 4013Source: Company documents Modification Type (Dollars in thousands) 6 month 90 Day Consumer Loan Segment Interest Only Deferral &
Mortgage Other Total Hospitality $ 1,099 $ 5,718 $ - $ 65,513 $ 72,330 Hotels (Under Construction) - - - - - All Other CRE 22,244 - - 1,144 23,388 Oil
& Gas 990 742 - 630 2,362 Restaurant & Retail - Owner Occ. 1,247 1,500 - - 2,747 All Other Commercial 16,502 175 - 2,958 19,635 Residential
Real Estate 2,129 23 317 - 2,469 Consumer - 30 1,006 - 1,036 Residential Construction - - - - - Paycheck Protection Program ("PPP") - -
- - - Total $ 44,211 $ 8,188 $ 1,323 $ 70,245 $ 123,967 % of Loans 1.9% 0.3% 0.1% 3.1% 5.4%

Loan Portfolio 7 Total Loans decreased $43.5 million compared to 2Q’20Decrease in total loans was due
primarily to:$18.1 million in pay downs on non-residential consumer loans and direct energy loansLower seasonal agricultural production loan funding Yield stabilized in 3Q’20 after 50bps drop in 2Q’20 3Q’20 Highlights Total Loans Held for
Investment$ in Millions Source: Company documents
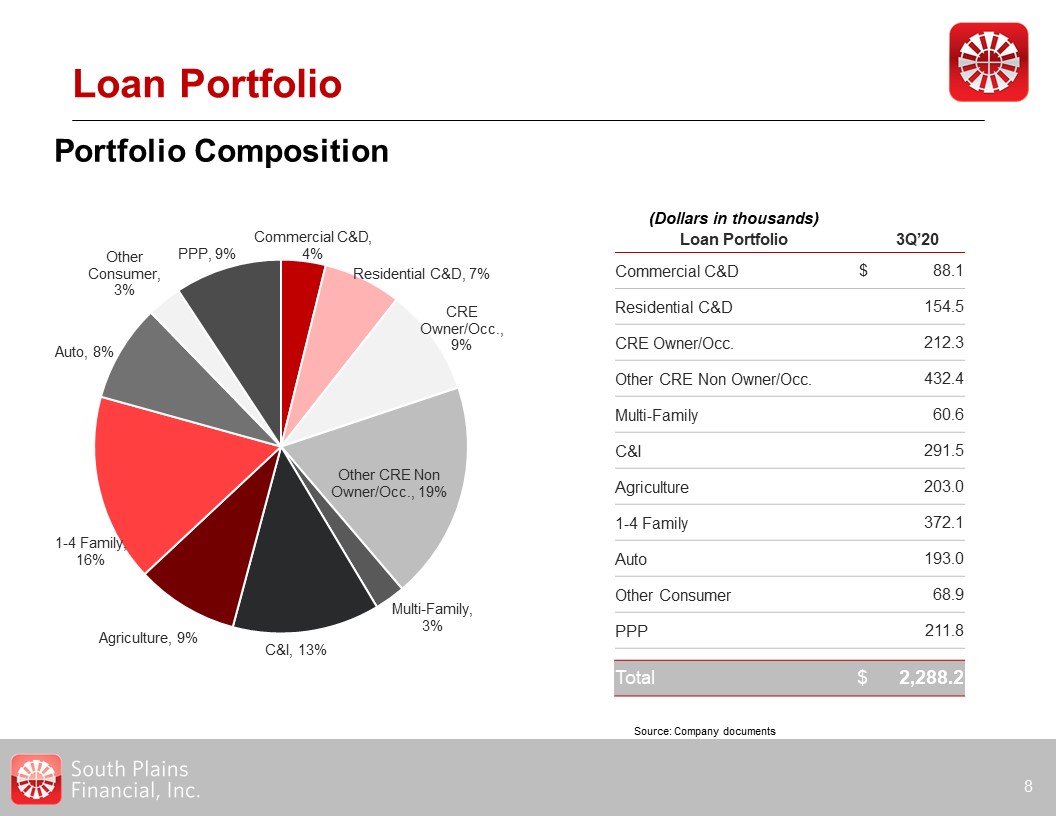
Loan Portfolio 8 Portfolio Composition (Dollars in thousands) Loan
Portfolio 3Q’20 Commercial C&D $ 88.1 Residential C&D 154.5 CRE Owner/Occ. 212.3 Other CRE Non Owner/Occ. 432.4 Multi-Family 60.6 C&I 291.5 Agriculture 203.0 1-4 Family 372.1
Auto 193.0 Other Consumer 68.9 PPP 211.8 Total $ 2,288.2 Source: Company documents

Hospitality Select Loan Industry Concentration Detail 9 As of September 30,
2020 DirectEnergy Total direct energy loans of $71 million93% support services, 7% upstreamNearly 100% Permian and Palo Duro Basins12% of energy sector classifiedALLL on energy sector is 5.3% Total operating hospitality loans of $119
million*$19 million in hotels under construction, with unfunded commitments of $10 million84% of balances are to limited service hotels39% of operating hospitality classified; 2% is nonaccrual; 0% are 30 days or more past dueALLL on operating
hospitality is 7.3%** Does not include loans reported in construction and development Energy Support Services by Type Hospitality by Geography Source: Company documents

Noninterest Income 10 Noninterest Income$ in Millions 3Q’20 Highlights Noninterest income is $31.7
million, compared to $14.1 million in 3Q’19Revenue from mortgage banking activities improved $14.4 million based on an increase of 110% in production in 3Q’20 compared to 3Q’19Fee income primarily driven by mortgage operations, debit card and
other bank service charge income, and income from insurance, trust and investment services business Source: Company documents

Diversified Revenue Stream Nine Months Ended September 30, 2020 11 Total Revenues$167.4
million Noninterest Income$75.4 million Source: Company documents

Net Interest Income and Margin 12 Net Interest Income & Margin$ in Millions 3Q’20
Highlights Net interest income of $31.3 million, compared to $26.6 million in 3Q’19The increase as compared to 3Q’19 was a result of:$414 million rise in average loans primarily from the WTSB acquisition and PPP loans partially offset by a
decrease in overall rates in 1Q’20 Source: Company documents

Deposit Portfolio 13 Total Deposits$ in Millions 3Q’20 Highlights Total Deposits of $2.94 billion at
3Q’20, which is a decrease of $4.0 million from 2Q’20Cost of interest-bearing deposits declined in 3Q’20 to 50bps from 130bps in 3Q’19Noninterest-bearing deposits represented 30.8% of deposits in 3Q’20, compared to 31.9% in 2Q’20 and 24.3% in
3Q’19 Source: Company documents

Credit Quality 14 3Q’20 Highlights Credit Quality Ratios Recorded a $6.1 million provision for loan
losses in 3Q’20 as compared to $13.1 million in 2Q’20 as the result of modest improvements in the economy Total classified loans decreased $3 million in 3Q’20Nonaccrual loans increased $6 million in 3Q’20 related to one customer in the
transportation industry Net Charge-Offs to Average Loans ALLL to Total Loans HFI Source: Company documents
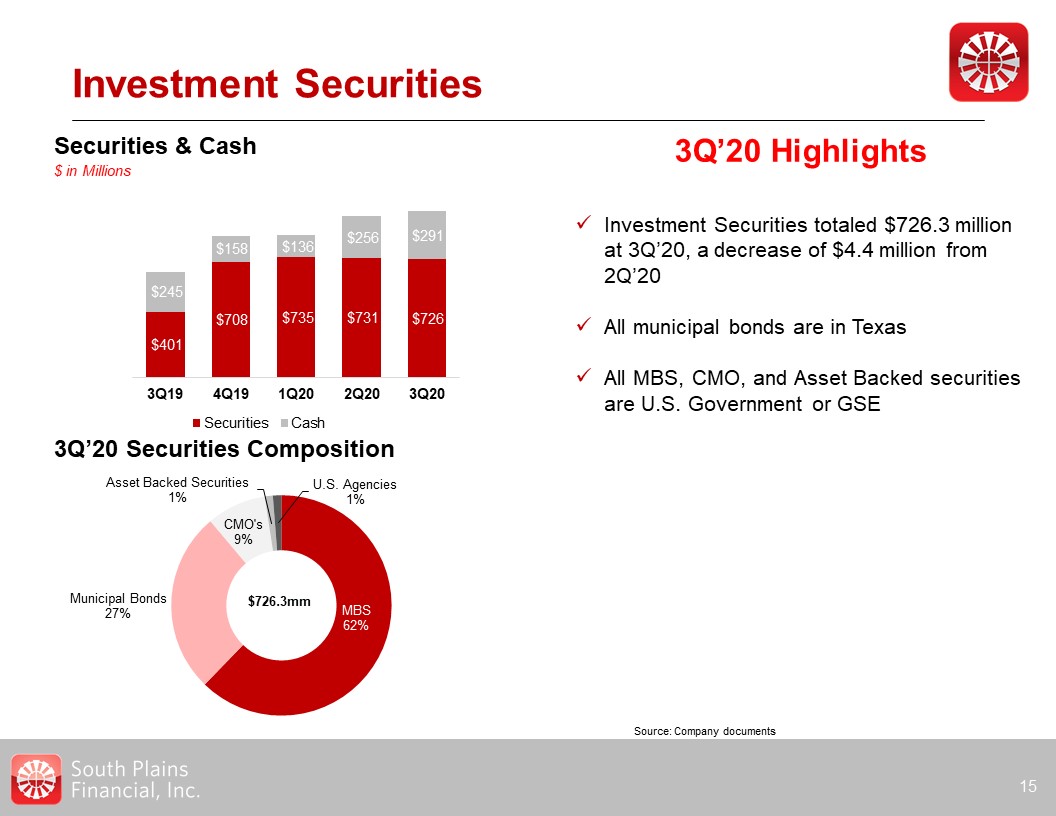
Investment Securities 15 3Q’20 Highlights Investment Securities totaled $726.3 million at 3Q’20, a
decrease of $4.4 million from 2Q’20All municipal bonds are in TexasAll MBS, CMO, and Asset Backed securities are U.S. Government or GSE 3Q’20 Securities Composition $726.3mm Securities & Cash$ in Millions Source: Company documents

Noninterest Expense and Efficiency 16 Noninterest Expense$ in Millions 3Q’20 Highlights Noninterest
expense for 3Q’20 increased from 3Q’19 due to an increase of $5.5 million in commissions and higher variable expenses related to strong mortgage activity3Q’20 includes a recovery of $303 thousand from the previously disclosed settlement of a
lawsuit as well as other expense reductionsManagement continues to focus on reducing fixed expenses to drive improved profitability Note: Adjusted Efficiency Ratio is a non-GAAP measure. See appendix for the reconciliation to GAAP Source:
Company documents

Balance Sheet Highlights$ in Millions Balance Sheet Growth and Development 17 Tangible Book Value
Per Share Note: Tangible book value per share is a non-GAAP measure. See appendix for the reconciliation to GAAP Source: Company documents
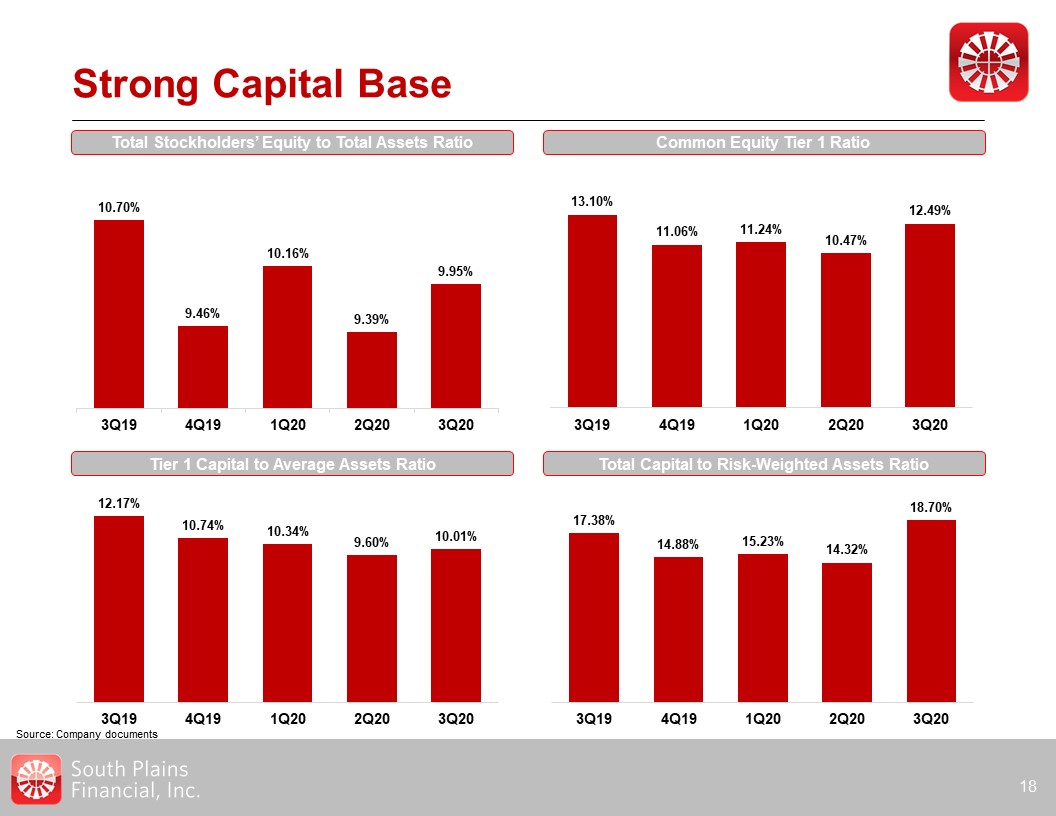
Strong Capital Base 18 Total Stockholders’ Equity to Total Assets Ratio Common Equity Tier 1
Ratio Tier 1 Capital to Average Assets Ratio Total Capital to Risk-Weighted Assets Ratio Source: Company documents

Appendix 19

Non-GAAP Financial Measures 20 As of and for the quarter ended
September 30,2020 June 30,2020 March 31,2020 December 31,2019 September 30,2019 Efficiency Ratio Noninterest expense $ 35,993 $ 35,207 $ 34,011 $ 31,714
$ 30,028 Net interest income $ 31,273 $ 30,448 $ 30,199 $ 28,624 $ 26,568 Tax equivalent yield adjustment 322 290 145 133 103 Noninterest
income 31,660 24,896 18,875 16,740 14,115 Total income $ 63,255 $ 55,634 $ 49,219 $ 45,497 $ 40,786 Efficiency ratio
56.90% 63.28% 69.10% 69.71% 73.62% Noninterest expense $ 35,993 $ 35,207 $ 34,011 $ 31,714 $ 30,028 Less: net loss on sale of securities - -
- (27) - Adjusted noninterest expense 35,993 35,207 34,011 31,687 30,028 Total income $ 63,255 $ 55,634 $ 49,219 $ 45,497
$ 40,786 Less: net gain on sale of securities - - (2,318) - - Adjusted total income $ 63,255 $ 55,634 $ 46,901 $ 45,497 $ 40,786
Adjusted efficiency ratio 56.90% 63.28% 72.52% 69.65% 73.62% Unaudited$ in Thousands Pre-Tax, Pre-Provision Income Net income $ 16,731 $ 5,615 $ 7,083
$ 10,109 $ 8,258 Income tax expense 4,147 1,389 1,746 2,645 1,977 Provision for loan losses 6,062 13,133 6,234 896 420
Pre-tax, pre-provision income $ 26,940 $ 20,137 $ 15,063 $ 13,650 $ 10,655 Source: Company documents

Non-GAAP Financial Measures 21 As of September 30,2020 December
31,2019 Tangible common equity Total common stockholders' equity $ 352,568 $ 306,182 Less: goodwill and other intangibles (27,502) (27,389) Tangible common equity $ 325,066
$ 278,793 Tangible assets Total assets $ 3,542,666 $ 3,237,167 Less: goodwill and other intangibles (27,502) (27,389) Tangible assets $ 3,515,164 $ 3,209,778
Shares outstanding 18,059,174 18,036,115 Total stockholders' equity to total assets 9.95% 9.46% Tangible common equity to tangible assets 9.25% 8.69% Book value per
share $ 19.52 $ 16.98 Tangible book value per share $ 18.00 $ 15.46 Unaudited$ in Thousands Source: Company documents