Attached files
| file | filename |
|---|---|
| 8-K - OKE Q3 2020 EARNINGS RELEASE - ONEOK INC /NEW/ | oke-20201027.htm |
Exhibit 99.1 October 27, 2020 Analyst Contact: Megan Patterson 918-561-5325 Media Contact: Brad Borror 918-588-7582 ONEOK Announces 14% Year-Over-Year Increase in Third Quarter 2020 Operating Income 55% Increase in Operating Income Compared with Second Quarter 2020 NGL Volumes Across All Operating Regions Exceeded Pre-Pandemic Levels TULSA, Okla. - Oct. 27, 2020 - ONEOK, Inc. (NYSE: OKE) today announced higher third quarter 2020 financial results, higher natural gas liquids (NGL) volumes and updated its 2020 outlook. Third Quarter 2020 Results, Compared With The Third Quarter 2019: • Net income of $312.3 million, resulting in 70 cents per diluted share. • 15% increase in adjusted EBITDA to $747.0 million. • 14% increase in operating income to $550.4 million. • 16% decrease in operating costs. • 1.30 times distributable cash flow coverage of dividend. • 7% increase in NGL raw feed throughput volumes. • 94 cents per MMBtu average fee rate in the natural gas gathering and processing segment. Third Quarter 2020 Results, Compared With The Second Quarter 2020: • 55% increase in operating income. • 40% increase in adjusted EBITDA. • 33% increase in Rocky Mountain Region NGL raw feed throughput volumes. • 25% increase in Rocky Mountain Region natural gas volumes processed. • 9% decrease in operating costs. Updated 2020 Outlook: Given the recovery of curtailed volumes in the regions where ONEOK operates, 2020 net income and adjusted earnings before interest, taxes, depreciation and amortization (adjusted EBITDA) are now expected to approach the midpoint of the ranges provided on April 28, 2020, of $500 million to $900 million, and $2,600 million to $3,000 million, respectively. -more-
ONEOK Announces 14% Year-Over-Year Increase in Third Quarter 2020 Operating Income Oct. 27, 2020 Page 2 “Third quarter results were driven by curtailed volume returning to our system resulting in improved earnings,” said Terry K. Spencer, ONEOK president and chief executive officer. “NGL volumes across all of our operating areas have exceeded pre-pandemic levels, and natural gas volumes processed in the Rocky Mountain region have exceeded 1.2 billion cubic feet per day. Volumes achieved in September were more in-line with our original pre-pandemic 2020 expectations. “We remain focused on operating safely and environmentally responsibly,” said Spencer. “Reliable service and value creation continue to guide our strategy as we evaluate the opportunities ahead of us.” THIRD QUARTER 2020 FINANCIAL PERFORMANCE Three Months Ended Nine Months Ended September 30, September 30, 2020 2019 2020 2019 (Millions of dollars, except per share and dividend coverage ratio amounts) Net income (a) $ 312.3 $ 309.2 $ 304.8 $ 958.3 Net income per diluted share (a) $ 0.70 $ 0.74 $ 0.71 $ 2.31 Adjusted EBITDA (b) (c) $ 747.0 $ 649.8 $ 1,981.7 $ 1,919.7 DCF (b) $ 540.9 $ 480.9 $ 1,363.8 $ 1,528.2 DCF in excess of dividends paid (b) $ 125.3 $ 113.0 $ 174.2 $ 448.8 Dividend coverage ratio (b) 1.30 1.31 1.15 1.42 Operating income (d) $ 550.4 $ 482.2 $ 822.7 $ 1,427.0 Operating costs $ 205.0 $ 245.1 $ 636.5 $ 723.6 Depreciation and amortization $ 153.2 $ 121.4 $ 426.0 $ 350.6 Equity in net earnings from investments $ 38.0 $ 37.6 $ 108.0 $ 115.2 Capital expenditures $ 380.0 $ 1,019.2 $ 1,924.0 $ 2,739.3 (a) Amounts for the three and nine months ended Sept. 30, 2020, include benefits of $2.2 million and $22.2 million, respectively, related to gains on open market repurchases of debt. Amounts for the nine months ended Sept. 30, 2020, also include noncash charges of $641.8 million, or $1.16 per diluted share after-tax, related primarily to impairments in the natural gas gathering and processing segment, a loss of $48.3 million, or $0.09 per diluted share after-tax, related to the settlement of interest-rate swaps, and a benefit of $16.9 million, or 3 cents per diluted share after-tax, related to the mark-to-market of ONEOK’s share-based deferred compensation plan. (b) Adjusted earnings before interest, taxes, depreciation and amortization (adjusted EBITDA), distributable cash flow (DCF) and dividend coverage ratio are non-GAAP measures. Reconciliations to relevant GAAP measures are included in this news release. (c) Amounts for the three and nine months ended Sept. 30, 2020, include benefits of $2.2 million and $22.2 million, respectively, related to gains on open market repurchases of debt. (d) Amount for the nine months ended Sept. 30, 2020, includes noncash impairment charges of $604.0 million. ONEOK’s operating income and adjusted EBITDA increased 14% and 15%, respectively, compared with the third quarter 2019. Higher results were driven primarily by increased NGL volumes across ONEOK’s operations, lower operating costs in all three of ONEOK’s business segments, and lower rail transportation and pipeline costs in the natural gas liquids segment due to the completion of ONEOK’s Elk Creek Pipeline, compared with the third quarter 2019. -more-
ONEOK Announces 14% Year-Over-Year Increase in Third Quarter 2020 Operating Income Oct. 27, 2020 Page 3 Results were partially offset by higher depreciation expense due to capital-growth projects placed in service, lower earnings from optimization and marketing in the natural gas liquids segment, lower natural gas volumes in the natural gas gathering and processing segment due to natural production declines in the Mid-Continent region and production curtailments in the Williston Basin, and lower interruptible transportation services in the natural gas pipelines segment, compared with the third quarter 2019. HIGHLIGHTS: • Third quarter adjusted EBITDA of $747.0 million, a 40% increase compared with the second quarter 2020 and a 7% increase compared with the first quarter 2020; • NGL projects completed in August 2020: ◦ The 75-mile Bakken NGL pipeline lateral connecting to a third-party natural gas processing plant in Williams County, North Dakota; and ◦ The Arbuckle II pipeline extension which increases connectivity from the Elk Creek Pipeline to the Arbuckle II Pipeline and additional Mid-Continent NGL gathering infrastructure. • Substantially completing all active announced capital-growth projects and maintaining an annual run rate of $300 million to $400 million of total capital expenditures until producer activity levels warrant additional infrastructure; • ESG highlights: ◦ Recognized as the industry leader in Energy Equipment & Services for the second year in a row by JUST Capital, an organization that ranks companies at the forefront of stakeholder-driven leadership; and ◦ Recipient of the 2020 Frank Condon Award for Environmental Excellence by the Environmental Federation of Oklahoma. • Declaring in October 2020 a quarterly dividend of 93.5 cents per share, or $3.74 per share on an annualized basis; • Net debt-to-EBITDA ratio of 4.6 times on an annualized run-rate basis as of Sept. 30, 2020; and • Having no borrowings outstanding under its $2.5 billion credit agreement and $447.1 million of cash and cash equivalents as of Sept. 30, 2020. BUSINESS-SEGMENT RESULTS: Natural Gas Liquids Segment The natural gas liquids segment’s third quarter 2020 adjusted EBITDA increased 23%, compared with the same period in 2019, due primarily to higher volumes across ONEOK’s operations and lower rail transportation and pipeline costs compared with the third quarter 2019. Third quarter 2020 NGL raw feed throughput volumes increased 7%, compared with the same period in 2019. -more-
ONEOK Announces 14% Year-Over-Year Increase in Third Quarter 2020 Operating Income Oct. 27, 2020 Page 4 Through the first nine months of 2020, the segment connected five natural gas processing plants to its system, including ONEOK’s Demicks Lake II plant, two third-party plants in the Rocky Mountain region and two third-party plants in the Permian Basin. Two third-party plant connections in the Rocky Mountain region and one third-party plant in the Mid-Continent were also expanded in the first nine months of 2020. Three Months Ended Nine Months Ended September 30, September 30, Natural Gas Liquids Segment 2020 2019 2020 2019 (Millions of dollars) Adjusted EBITDA $ 451.2 $ 367.5 $ 1,199.8 $ 1,091.9 Capital expenditures $ 298.9 $ 738.0 $ 1,504.9 $ 1,969.1 The increase in third quarter 2020 adjusted EBITDA, compared with the third quarter 2019, primarily reflects: • A $103.4 million increase in exchange services due primarily to $48.7 million in higher volumes across ONEOK’s operations, $43.5 million in lower rail transportation and pipeline costs and $17.9 million related to lower unfractionated NGLs held in inventory; and • A $12.3 million decrease in operating costs due primarily to reduced discretionary expenses; offset partially by • A $20.9 million decrease in optimization and marketing due primarily to $24.2 million in narrower location price differentials and lower optimization volumes, and lower marketing earnings of $13.1 million due to lower earnings from purity NGL inventory sales and changes in the value of NGLs held in inventory, offset partially by an increase of $16.7 million due to wider product price differentials; and • A $7.9 million decrease in equity in net earnings from investments due primarily to lower volumes on the Overland Pass Pipeline. The increase in adjusted EBITDA for the nine-month 2020 period, compared with the same period last year, primarily reflects: • A $208.8 million increase in exchange services due primarily to $91.8 million in higher volumes in the Rocky Mountain region and Permian Basin, $83.6 million in lower rail transportation and pipeline costs, $25.8 million related to lower unfractionated NGLs held in inventory, $24.1 million in higher average fee rates primarily in the Permian Basin, and $18.4 million in fees related to minimum volume obligations primarily in the Rocky Mountain region, offset partially by $21.8 million in lower volumes in the Mid- Continent region and $11.7 million in narrower product price differentials; and • A $32.3 million decrease in operating costs due primarily to reduced discretionary expenses; offset partially by -more-
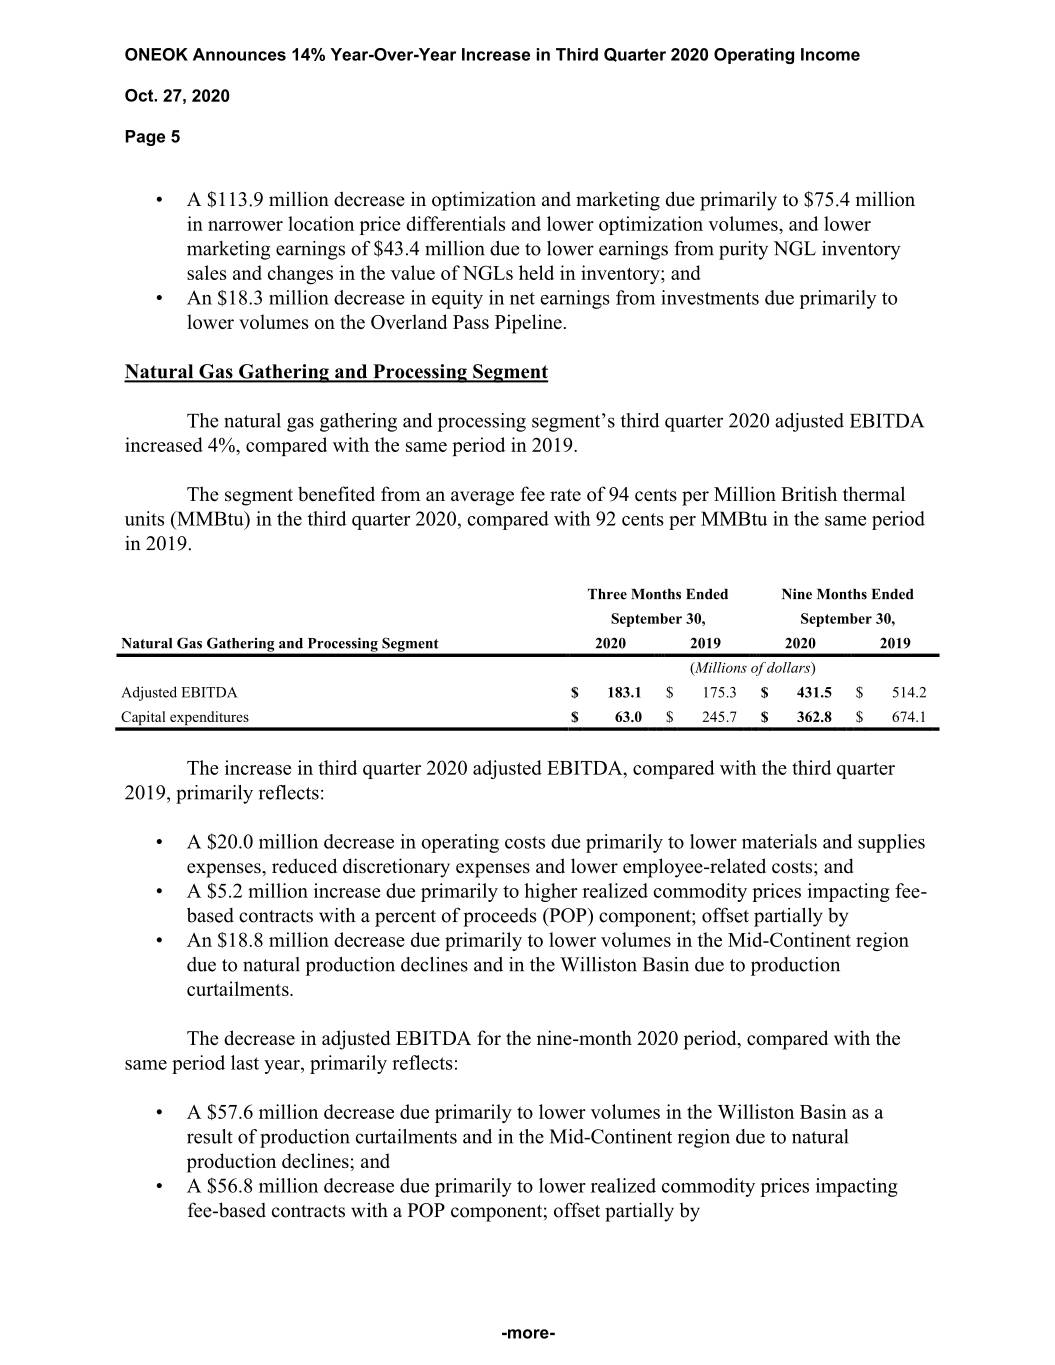
ONEOK Announces 14% Year-Over-Year Increase in Third Quarter 2020 Operating Income Oct. 27, 2020 Page 5 • A $113.9 million decrease in optimization and marketing due primarily to $75.4 million in narrower location price differentials and lower optimization volumes, and lower marketing earnings of $43.4 million due to lower earnings from purity NGL inventory sales and changes in the value of NGLs held in inventory; and • An $18.3 million decrease in equity in net earnings from investments due primarily to lower volumes on the Overland Pass Pipeline. Natural Gas Gathering and Processing Segment The natural gas gathering and processing segment’s third quarter 2020 adjusted EBITDA increased 4%, compared with the same period in 2019. The segment benefited from an average fee rate of 94 cents per Million British thermal units (MMBtu) in the third quarter 2020, compared with 92 cents per MMBtu in the same period in 2019. Three Months Ended Nine Months Ended September 30, September 30, Natural Gas Gathering and Processing Segment 2020 2019 2020 2019 (Millions of dollars) Adjusted EBITDA $ 183.1 $ 175.3 $ 431.5 $ 514.2 Capital expenditures $ 63.0 $ 245.7 $ 362.8 $ 674.1 The increase in third quarter 2020 adjusted EBITDA, compared with the third quarter 2019, primarily reflects: • A $20.0 million decrease in operating costs due primarily to lower materials and supplies expenses, reduced discretionary expenses and lower employee-related costs; and • A $5.2 million increase due primarily to higher realized commodity prices impacting fee- based contracts with a percent of proceeds (POP) component; offset partially by • An $18.8 million decrease due primarily to lower volumes in the Mid-Continent region due to natural production declines and in the Williston Basin due to production curtailments. The decrease in adjusted EBITDA for the nine-month 2020 period, compared with the same period last year, primarily reflects: • A $57.6 million decrease due primarily to lower volumes in the Williston Basin as a result of production curtailments and in the Mid-Continent region due to natural production declines; and • A $56.8 million decrease due primarily to lower realized commodity prices impacting fee-based contracts with a POP component; offset partially by -more-
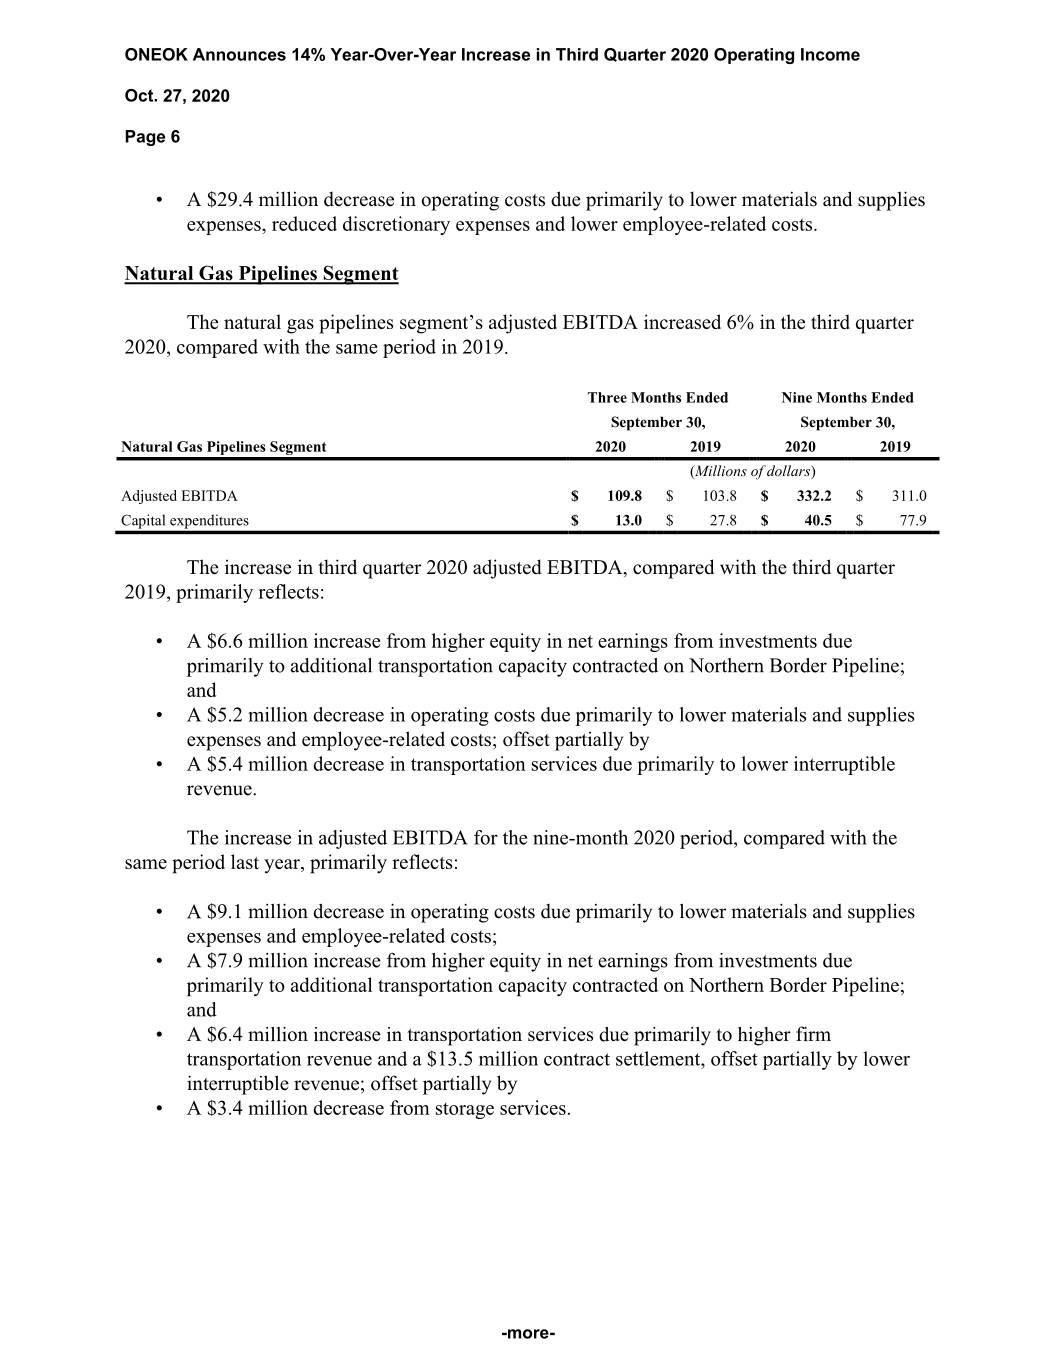
ONEOK Announces 14% Year-Over-Year Increase in Third Quarter 2020 Operating Income Oct. 27, 2020 Page 6 • A $29.4 million decrease in operating costs due primarily to lower materials and supplies expenses, reduced discretionary expenses and lower employee-related costs. Natural Gas Pipelines Segment The natural gas pipelines segment’s adjusted EBITDA increased 6% in the third quarter 2020, compared with the same period in 2019. Three Months Ended Nine Months Ended September 30, September 30, Natural Gas Pipelines Segment 2020 2019 2020 2019 (Millions of dollars) Adjusted EBITDA $ 109.8 $ 103.8 $ 332.2 $ 311.0 Capital expenditures $ 13.0 $ 27.8 $ 40.5 $ 77.9 The increase in third quarter 2020 adjusted EBITDA, compared with the third quarter 2019, primarily reflects: • A $6.6 million increase from higher equity in net earnings from investments due primarily to additional transportation capacity contracted on Northern Border Pipeline; and • A $5.2 million decrease in operating costs due primarily to lower materials and supplies expenses and employee-related costs; offset partially by • A $5.4 million decrease in transportation services due primarily to lower interruptible revenue. The increase in adjusted EBITDA for the nine-month 2020 period, compared with the same period last year, primarily reflects: • A $9.1 million decrease in operating costs due primarily to lower materials and supplies expenses and employee-related costs; • A $7.9 million increase from higher equity in net earnings from investments due primarily to additional transportation capacity contracted on Northern Border Pipeline; and • A $6.4 million increase in transportation services due primarily to higher firm transportation revenue and a $13.5 million contract settlement, offset partially by lower interruptible revenue; offset partially by • A $3.4 million decrease from storage services. -more-
ONEOK Announces 14% Year-Over-Year Increase in Third Quarter 2020 Operating Income Oct. 27, 2020 Page 7 EARNINGS CONFERENCE CALL AND WEBCAST: ONEOK executive management will conduct a conference call at 11 a.m. Eastern Daylight Time (10 a.m. Central Daylight Time) on Oct. 28, 2020. The call also will be carried live on ONEOK’s website. To participate in the telephone conference call, dial 888-254-3590, pass code 5700571, or log on to www.oneok.com. If you are unable to participate in the conference call or the webcast, the replay will be available on ONEOK’s website, www.oneok.com, for 30 days. A recording will be available by phone for seven days. The playback call may be accessed at 888-203-1112, pass code 5700571. LINK TO EARNINGS TABLES AND PRESENTATION: https://ir.oneok.com/financial-information/financial-reports/2020 NON-GAAP (GENERALLY ACCEPTED ACCOUNTING PRINCIPLES) FINANCIAL MEASURES: ONEOK has disclosed in this news release adjusted earnings before interest, taxes, depreciation and amortization (adjusted EBITDA), distributable cash flow and dividend coverage ratio, which are non-GAAP financial metrics, used to measure the company’s financial performance and are defined as follows: • Adjusted EBITDA is defined as net income adjusted for interest expense, depreciation and amortization, noncash impairment charges, income taxes, noncash compensation expense, allowance for equity funds used during construction (equity AFUDC), and other noncash items; • Distributable cash flow is defined as adjusted EBITDA, computed as described above, less interest expense, maintenance capital expenditures and equity earnings from investments, excluding noncash impairment charges, adjusted for cash distributions received from unconsolidated affiliates and certain other items; and • Dividend coverage ratio is defined as ONEOK’s distributable cash flow to ONEOK shareholders divided by the dividends paid in the period. These non-GAAP financial measures described above are useful to investors because they, and similar measures, are used by many companies in the industry as a measure of financial performance and are commonly employed by financial analysts and others to evaluate our financial performance and to compare our financial performance with the performance of other companies within our industry. Adjusted EBITDA, ONEOK distributable cash flow and dividend coverage ratio should not be considered in isolation or as a substitute for net income or any other measure of financial performance presented in accordance with GAAP. -more-
ONEOK Announces 14% Year-Over-Year Increase in Third Quarter 2020 Operating Income Oct. 27, 2020 Page 8 These non-GAAP financial measures exclude some, but not all, items that affect net income. Additionally, these calculations may not be comparable with similarly titled measures of other companies. Reconciliations of net income to adjusted EBITDA, distributable cash flow and coverage ratio are included in the tables. ONEOK, Inc. (pronounced ONE-OAK) (NYSE: OKE) is a leading midstream service provider and owner of one of the nation's premier natural gas liquids (NGL) systems, connecting NGL supply in the Rocky Mountain, Mid-Continent and Permian regions with key market centers and an extensive network of natural gas gathering, processing, storage and transportation assets. ONEOK is a FORTUNE 500 company and is included in the S&P 500. For information about ONEOK, visit the website: www.oneok.com For the latest news about ONEOK, find us on LinkedIn, Instagram, Facebook and Twitter. ONEOK’s news release issued on April 28, 2020, provided that, given the current environment, continued commodity price and market volatility, and uncertainty surrounding the COVID-19 pandemic, ONEOK was withdrawing its 2020 guidance expectations and 2021 outlook, originally provided on Feb. 24, 2020, as well as its prior dividend guidance, and that previously provided guidance and outlooks should no longer be relied upon. This news release contains certain "forward-looking statements" within the meaning of federal securities laws. Words such as “anticipates,” “believes,” “continues,” “could,” “estimates,” “expects,” “forecasts,” “goal,” “guidance,” “intends,” “may,” “might,” “outlook,” “plans,” “potential,” “projects,” “scheduled,” “should,” “will,” ‘would,” and similar expressions may be used to identify forward-looking statements. Forward-looking statements are not statements of historical fact and reflect our current views about future events. Such forward-looking statements include, but are not limited to, statements about the benefits of the transaction involving us, including future financial and operating results, our plans, objectives, expectations and intentions, and other statements that are not historical facts, including future results of operations, projected cash flow and liquidity, business strategy, expected synergies or cost savings, and other plans and objectives for future operations. No assurances can be given that the forward-looking statements contained in this news release will occur as projected and actual results may differ materially from those projected. Forward-looking statements are based on current expectations, estimates and assumptions that involve a number of risks and uncertainties, many of which are beyond our control, and are not guarantees of future results. Accordingly, there are or will be important factors that could cause actual results to differ materially from those indicated in such statements and, therefore, you should not place undue reliance on any such statements and caution must be exercised in relying on forward-looking statements. These risks and uncertainties include, without limitation, the following: • the impact on drilling and production by factors beyond our control, including the demand for natural gas and crude oil; producers’ desire and ability to drill and obtain necessary permits; regulatory compliance; reserve performance; and capacity constraints and/or shut downs on the pipelines that transport crude oil, natural gas and NGLs from producing areas and our facilities; • the effects of weather and other natural phenomena, including climate change, on our operations, demand for our services and energy prices; • the length, severity and reemergence of a pandemic or other health crisis, such as the recent outbreak of COVID-19 and the measures that international, federal, state and local governments, agencies, law enforcement and/or health authorities implement to address it, which may (as with COVID-19) precipitate or exacerbate one or more of the factors herein, reduce the demand for natural gas, NGLs and crude oil and significantly disrupt or prevent us and our customers and counterparties from operating in the ordinary course for an extended period and increase the cost of operating our business; • the timing and extent of changes in energy commodity prices, including changes due to production decisions by other countries, such as the failure of countries to abide by recent agreements to reduce production volumes; • economic climate and growth in the geographic areas in which we operate; -more-
ONEOK Announces 14% Year-Over-Year Increase in Third Quarter 2020 Operating Income Oct. 27, 2020 Page 9 • risks associated with adequate supply to our gathering, processing, fractionation and pipeline facilities, including production declines that outpace new drilling, the shutting-in of production by producers, actions taken by federal, state or local governments to require producers to prorate or to cut their production levels as a way to address any excess market supply situations or extended periods of ethane rejection; • competition from other United States and foreign energy suppliers and transporters, as well as alternative forms of energy, including, but not limited to, solar power, wind power, geothermal energy and biofuels such as ethanol and biodiesel; • demand for our services and products in the proximity of our facilities; • the ability to market pipeline capacity on favorable terms, including the effects of: – future demand for and prices of natural gas, NGLs and crude oil; – competitive conditions in the overall energy market; – availability of supplies of United States natural gas and crude oil; and – availability of additional storage capacity; • acts of nature, sabotage, terrorism or other similar acts that cause damage to our facilities or our suppliers’, customers’ or shippers’ facilities; • the possibility of future terrorist attacks or the possibility or occurrence of an outbreak of, or changes in, hostilities or changes in the political conditions throughout the world; • the timely receipt of approval by applicable governmental entities for construction and operation of our pipeline and other projects and required regulatory clearances; • our ability to acquire all necessary permits, consents or other approvals in a timely manner, to promptly obtain all necessary materials and supplies required for construction, and to construct gathering, processing, storage, fractionation and transportation facilities without labor or contractor problems; • the profitability of assets or businesses acquired or constructed by us; • the risk of a slowdown in growth or decline in the United States or international economies, including liquidity risks in United States or foreign credit markets; • risks of marketing, trading and hedging activities, including the risks of changes in energy prices or the financial condition of our counterparties; • the uncertainty of estimates, including accruals and costs of environmental remediation; • changes in demand for the use of natural gas, NGLs and crude oil because of market conditions caused by concerns about climate change; • the impact of uncontracted capacity in our assets being greater or less than expected; • the composition and quality of the natural gas and NGLs we gather and process in our plants and transport on our pipelines; • the efficiency of our plants in processing natural gas and extracting and fractionating NGLs; • our ability to control construction costs and completion schedules of our pipelines and other projects; • the effects of changes in governmental policies and regulatory actions, including changes with respect to income and other taxes, pipeline safety, environmental compliance, climate change initiatives, production limits and authorized rates of recovery of natural gas and natural gas transportation costs; • the ability to recover operating costs and amounts equivalent to income taxes, costs of property, plant and equipment and regulatory assets in our state and Federal Energy Regulatory Commission (FERC)-regulated rates; • the results of administrative proceedings and litigation, regulatory actions, executive orders, rule changes and receipt of expected clearances involving any local, state or federal regulatory body, including the FERC, the National Transportation Safety Board, the Pipeline and Hazardous Materials Safety Administration (PHMSA), the U.S. Environmental Protection Agency (EPA) and the U.S. Commodity Futures Trading Commission (CFTC); • difficulties or delays experienced by trucks, railroads or pipelines in delivering products to or from our terminals or pipelines; • the capital-intensive nature of our businesses; • the mechanical integrity of facilities operated; • risks associated with pending or possible acquisitions and dispositions, including our ability to finance or integrate any such acquisitions and any regulatory delay or conditions imposed by regulatory bodies in connection with any such acquisitions and dispositions; • the risk that material weaknesses or significant deficiencies in our internal controls over financial reporting could emerge or that minor problems could become significant; -more-
ONEOK Announces 14% Year-Over-Year Increase in Third Quarter 2020 Operating Income Oct. 27, 2020 Page 10 • the impact of unforeseen changes in interest rates, debt and equity markets, inflation rates, economic recession and other external factors over which we have no control, including the effect on pension and postretirement expense and funding resulting from changes in equity and bond market returns; • our indebtedness and guarantee obligations could make us vulnerable to general adverse economic and industry conditions, limit our ability to borrow additional funds and/or place us at competitive disadvantages compared with our competitors that have less debt or have other adverse consequences; • actions by rating agencies concerning our credit; • our ability to access capital at competitive rates or on terms acceptable to us; • the impact and outcome of pending and future litigation; • performance of contractual obligations by our customers, service providers, contractors and shippers; • our ability to control operating costs and make cost-saving changes; • the impact of recently issued and future accounting updates and other changes in accounting policies; • the risk of increased costs for insurance premiums, security or other items as a consequence of terrorist attacks; • the risk inherent in the use of information systems in our respective businesses and those of our counterparties and service providers, including cyber-attacks, which, according to experts, have increased in volume and sophistication since the beginning of the COVID-19 pandemic; implementation of new software and hardware; and the impact on the timeliness of information for financial reporting; • operational challenges relating to the COVID-19 pandemic and efforts to mitigate the spread of the virus, including logistical challenges, protecting the health and well-being of our employees, remote work arrangements, performance of contracts and supply chain disruptions; • the impact of potential impairment charges; and • the risk factors listed in the reports we have filed and may file with the Securities and Exchange Commission (the “SEC”), which are incorporated by reference. These reports are also available from the sources described below. Forward-looking statements are based on the estimates and opinions of management at the time the statements are made. ONEOK undertakes no obligation to publicly update any forward-looking statement, whether as a result of new information, future events or changes in circumstances, expectations or otherwise. The foregoing review of important factors should not be construed as exhaustive and should be read in conjunction with the other cautionary statements that are included herein and elsewhere, including the Risk Factors included in the most recent reports on Form 10-K and Form 10-Q and other documents of ONEOK on file with the SEC. ONEOK's SEC filings are available publicly on the SEC's website at www.sec.gov. ### -more-
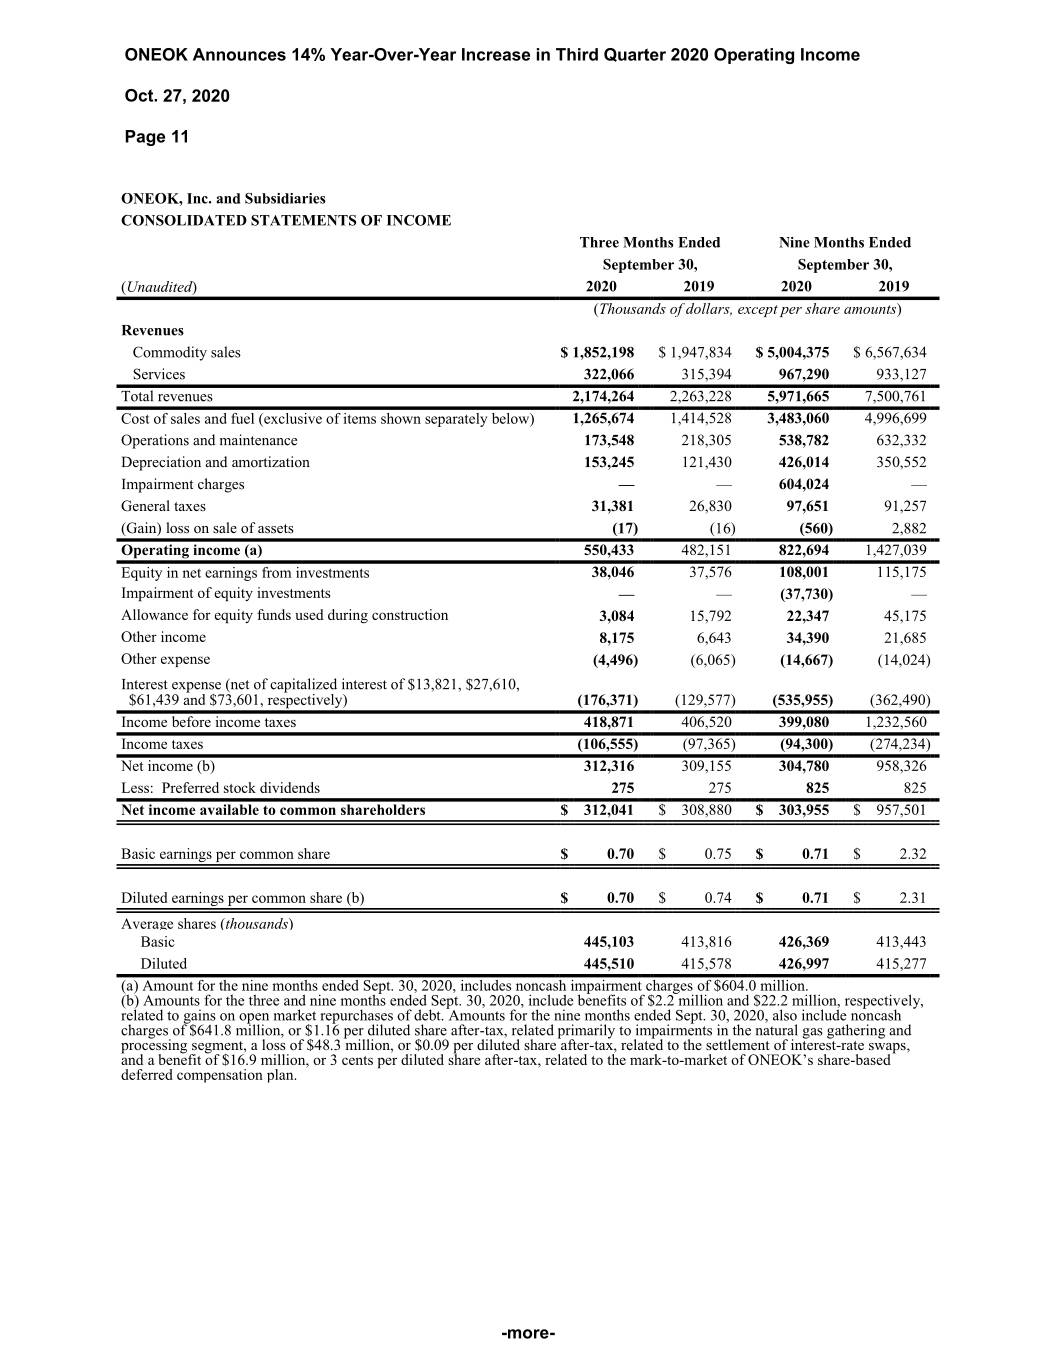
ONEOK Announces 14% Year-Over-Year Increase in Third Quarter 2020 Operating Income Oct. 27, 2020 Page 11 ONEOK, Inc. and Subsidiaries CONSOLIDATED STATEMENTS OF INCOME Three Months Ended Nine Months Ended September 30, September 30, (Unaudited) 2020 2019 2020 2019 (Thousands of dollars, except per share amounts) Revenues Commodity sales $ 1,852,198 $ 1,947,834 $ 5,004,375 $ 6,567,634 Services 322,066 315,394 967,290 933,127 Total revenues 2,174,264 2,263,228 5,971,665 7,500,761 Cost of sales and fuel (exclusive of items shown separately below) 1,265,674 1,414,528 3,483,060 4,996,699 Operations and maintenance 173,548 218,305 538,782 632,332 Depreciation and amortization 153,245 121,430 426,014 350,552 Impairment charges — — 604,024 — General taxes 31,381 26,830 97,651 91,257 (Gain) loss on sale of assets (17) (16) (560) 2,882 Operating income (a) 550,433 482,151 822,694 1,427,039 Equity in net earnings from investments 38,046 37,576 108,001 115,175 Impairment of equity investments — — (37,730) — Allowance for equity funds used during construction 3,084 15,792 22,347 45,175 Other income 8,175 6,643 34,390 21,685 Other expense (4,496) (6,065) (14,667) (14,024) Interest expense (net of capitalized interest of $13,821, $27,610, $61,439 and $73,601, respectively) (176,371) (129,577) (535,955) (362,490) Income before income taxes 418,871 406,520 399,080 1,232,560 Income taxes (106,555) (97,365) (94,300) (274,234) Net income (b) 312,316 309,155 304,780 958,326 Less: Preferred stock dividends 275 275 825 825 Net income available to common shareholders $ 312,041 $ 308,880 $ 303,955 $ 957,501 Basic earnings per common share $ 0.70 $ 0.75 $ 0.71 $ 2.32 Diluted earnings per common share (b) $ 0.70 $ 0.74 $ 0.71 $ 2.31 Average shares (thousands) Basic 445,103 413,816 426,369 413,443 Diluted 445,510 415,578 426,997 415,277 (a) Amount for the nine months ended Sept. 30, 2020, includes noncash impairment charges of $604.0 million. (b) Amounts for the three and nine months ended Sept. 30, 2020, include benefits of $2.2 million and $22.2 million, respectively, related to gains on open market repurchases of debt. Amounts for the nine months ended Sept. 30, 2020, also include noncash charges of $641.8 million, or $1.16 per diluted share after-tax, related primarily to impairments in the natural gas gathering and processing segment, a loss of $48.3 million, or $0.09 per diluted share after-tax, related to the settlement of interest-rate swaps, and a benefit of $16.9 million, or 3 cents per diluted share after-tax, related to the mark-to-market of ONEOK’s share-based deferred compensation plan. -more-
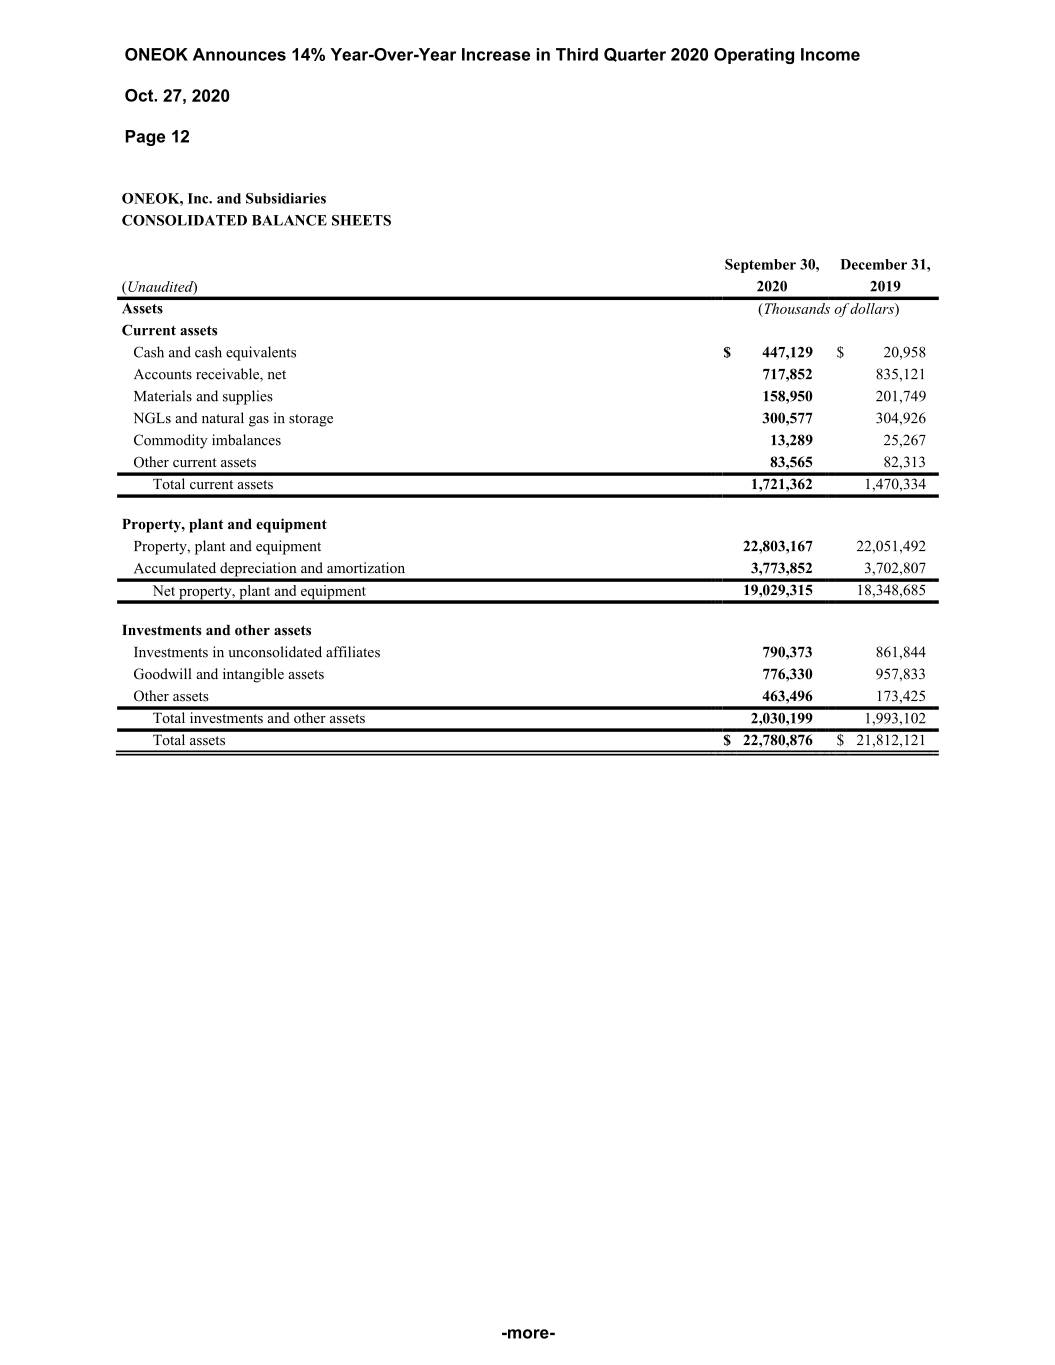
ONEOK Announces 14% Year-Over-Year Increase in Third Quarter 2020 Operating Income Oct. 27, 2020 Page 12 ONEOK, Inc. and Subsidiaries CONSOLIDATED BALANCE SHEETS September 30, December 31, (Unaudited) 2020 2019 Assets (Thousands of dollars) Current assets Cash and cash equivalents $ 447,129 $ 20,958 Accounts receivable, net 717,852 835,121 Materials and supplies 158,950 201,749 NGLs and natural gas in storage 300,577 304,926 Commodity imbalances 13,289 25,267 Other current assets 83,565 82,313 Total current assets 1,721,362 1,470,334 Property, plant and equipment Property, plant and equipment 22,803,167 22,051,492 Accumulated depreciation and amortization 3,773,852 3,702,807 Net property, plant and equipment 19,029,315 18,348,685 Investments and other assets Investments in unconsolidated affiliates 790,373 861,844 Goodwill and intangible assets 776,330 957,833 Other assets 463,496 173,425 Total investments and other assets 2,030,199 1,993,102 Total assets $ 22,780,876 $ 21,812,121 -more-
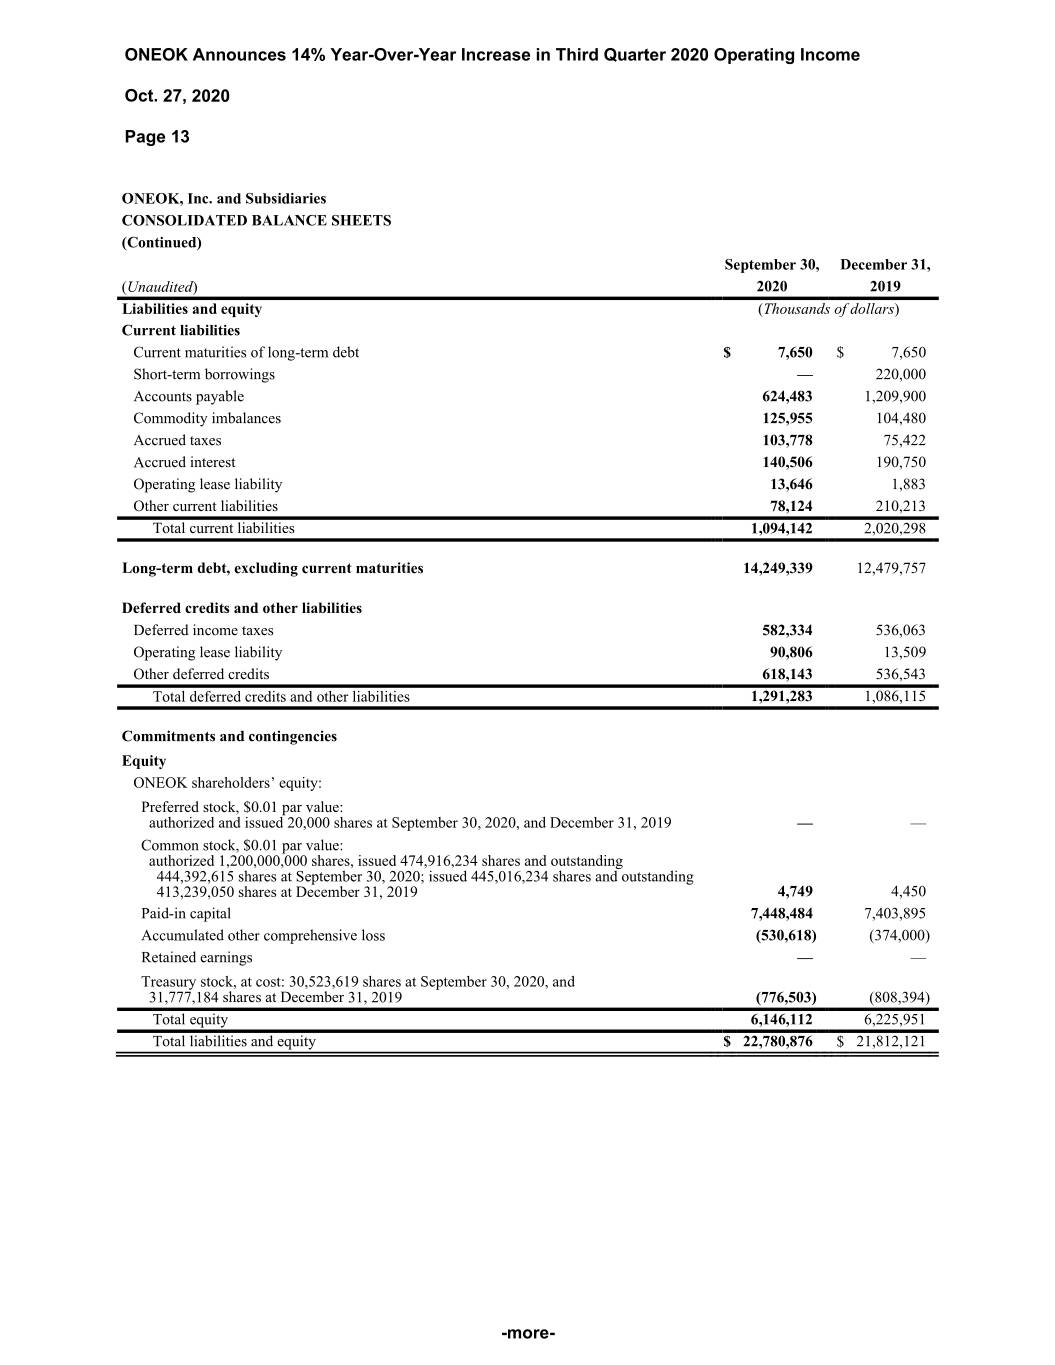
ONEOK Announces 14% Year-Over-Year Increase in Third Quarter 2020 Operating Income Oct. 27, 2020 Page 13 ONEOK, Inc. and Subsidiaries CONSOLIDATED BALANCE SHEETS (Continued) September 30, December 31, (Unaudited) 2020 2019 Liabilities and equity (Thousands of dollars) Current liabilities Current maturities of long-term debt $ 7,650 $ 7,650 Short-term borrowings — 220,000 Accounts payable 624,483 1,209,900 Commodity imbalances 125,955 104,480 Accrued taxes 103,778 75,422 Accrued interest 140,506 190,750 Operating lease liability 13,646 1,883 Other current liabilities 78,124 210,213 Total current liabilities 1,094,142 2,020,298 Long-term debt, excluding current maturities 14,249,339 12,479,757 Deferred credits and other liabilities Deferred income taxes 582,334 536,063 Operating lease liability 90,806 13,509 Other deferred credits 618,143 536,543 Total deferred credits and other liabilities 1,291,283 1,086,115 Commitments and contingencies Equity ONEOK shareholders’ equity: Preferred stock, $0.01 par value: authorized and issued 20,000 shares at September 30, 2020, and December 31, 2019 — — Common stock, $0.01 par value: authorized 1,200,000,000 shares, issued 474,916,234 shares and outstanding 444,392,615 shares at September 30, 2020; issued 445,016,234 shares and outstanding 413,239,050 shares at December 31, 2019 4,749 4,450 Paid-in capital 7,448,484 7,403,895 Accumulated other comprehensive loss (530,618) (374,000) Retained earnings — — Treasury stock, at cost: 30,523,619 shares at September 30, 2020, and 31,777,184 shares at December 31, 2019 (776,503) (808,394) Total equity 6,146,112 6,225,951 Total liabilities and equity $ 22,780,876 $ 21,812,121 -more-
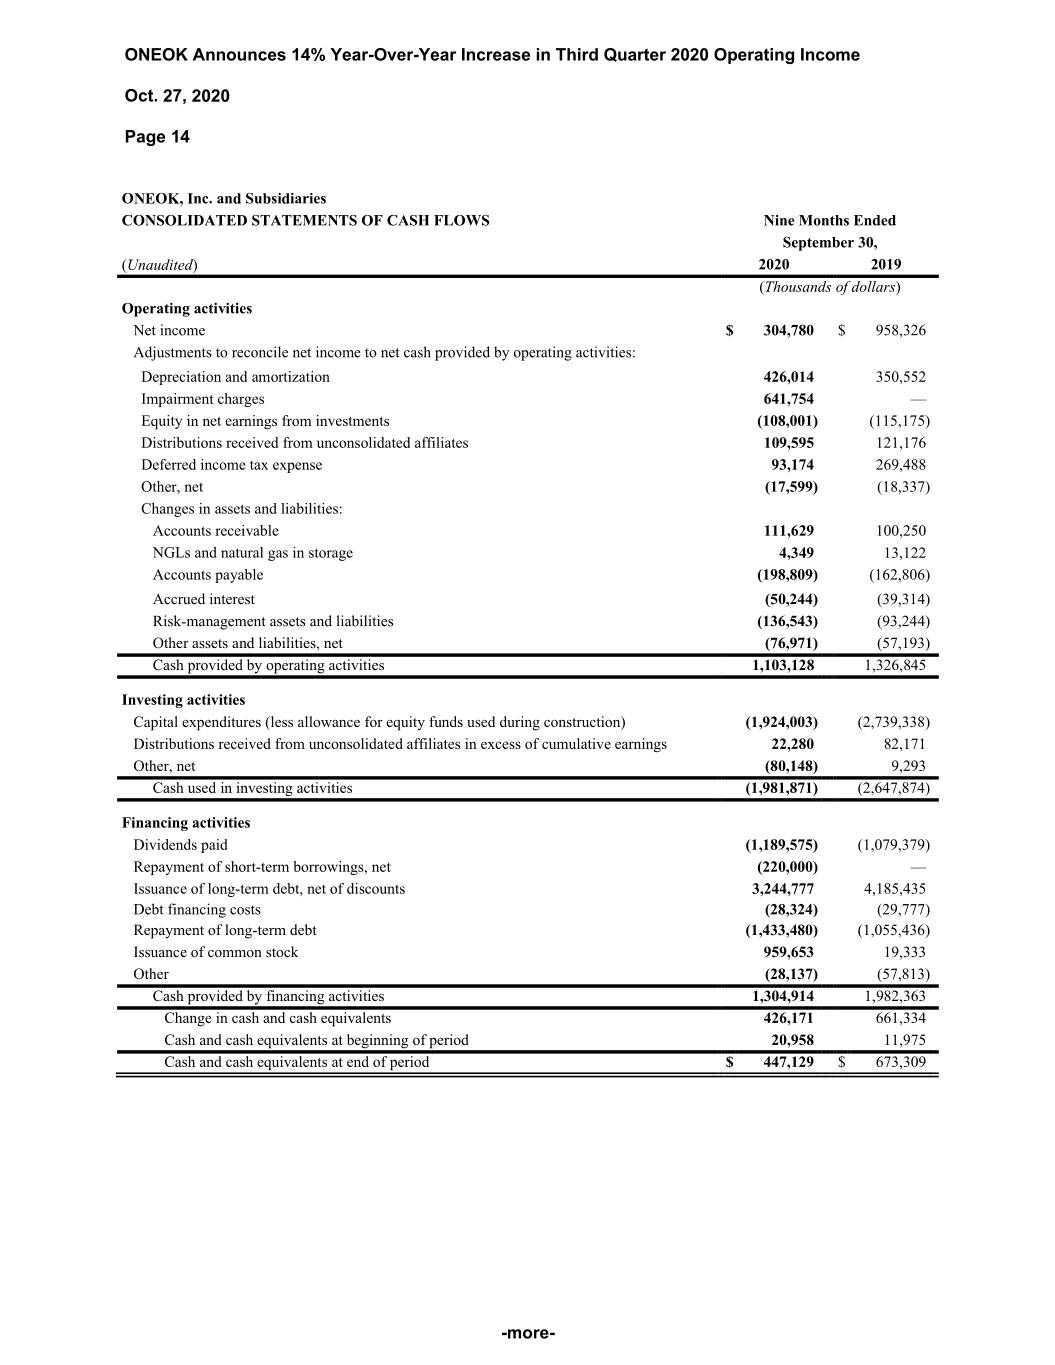
ONEOK Announces 14% Year-Over-Year Increase in Third Quarter 2020 Operating Income Oct. 27, 2020 Page 14 ONEOK, Inc. and Subsidiaries CONSOLIDATED STATEMENTS OF CASH FLOWS Nine Months Ended September 30, (Unaudited) 2020 2019 (Thousands of dollars) Operating activities Net income $ 304,780 $ 958,326 Adjustments to reconcile net income to net cash provided by operating activities: Depreciation and amortization 426,014 350,552 Impairment charges 641,754 — Equity in net earnings from investments (108,001) (115,175) Distributions received from unconsolidated affiliates 109,595 121,176 Deferred income tax expense 93,174 269,488 Other, net (17,599) (18,337) Changes in assets and liabilities: Accounts receivable 111,629 100,250 NGLs and natural gas in storage 4,349 13,122 Accounts payable (198,809) (162,806) Accrued interest (50,244) (39,314) Risk-management assets and liabilities (136,543) (93,244) Other assets and liabilities, net (76,971) (57,193) Cash provided by operating activities 1,103,128 1,326,845 Investing activities Capital expenditures (less allowance for equity funds used during construction) (1,924,003) (2,739,338) Distributions received from unconsolidated affiliates in excess of cumulative earnings 22,280 82,171 Other, net (80,148) 9,293 Cash used in investing activities (1,981,871) (2,647,874) Financing activities Dividends paid (1,189,575) (1,079,379) Repayment of short-term borrowings, net (220,000) — Issuance of long-term debt, net of discounts 3,244,777 4,185,435 Debt financing costs (28,324) (29,777) Repayment of long-term debt (1,433,480) (1,055,436) Issuance of common stock 959,653 19,333 Other (28,137) (57,813) Cash provided by financing activities 1,304,914 1,982,363 Change in cash and cash equivalents 426,171 661,334 Cash and cash equivalents at beginning of period 20,958 11,975 Cash and cash equivalents at end of period $ 447,129 $ 673,309 -more-
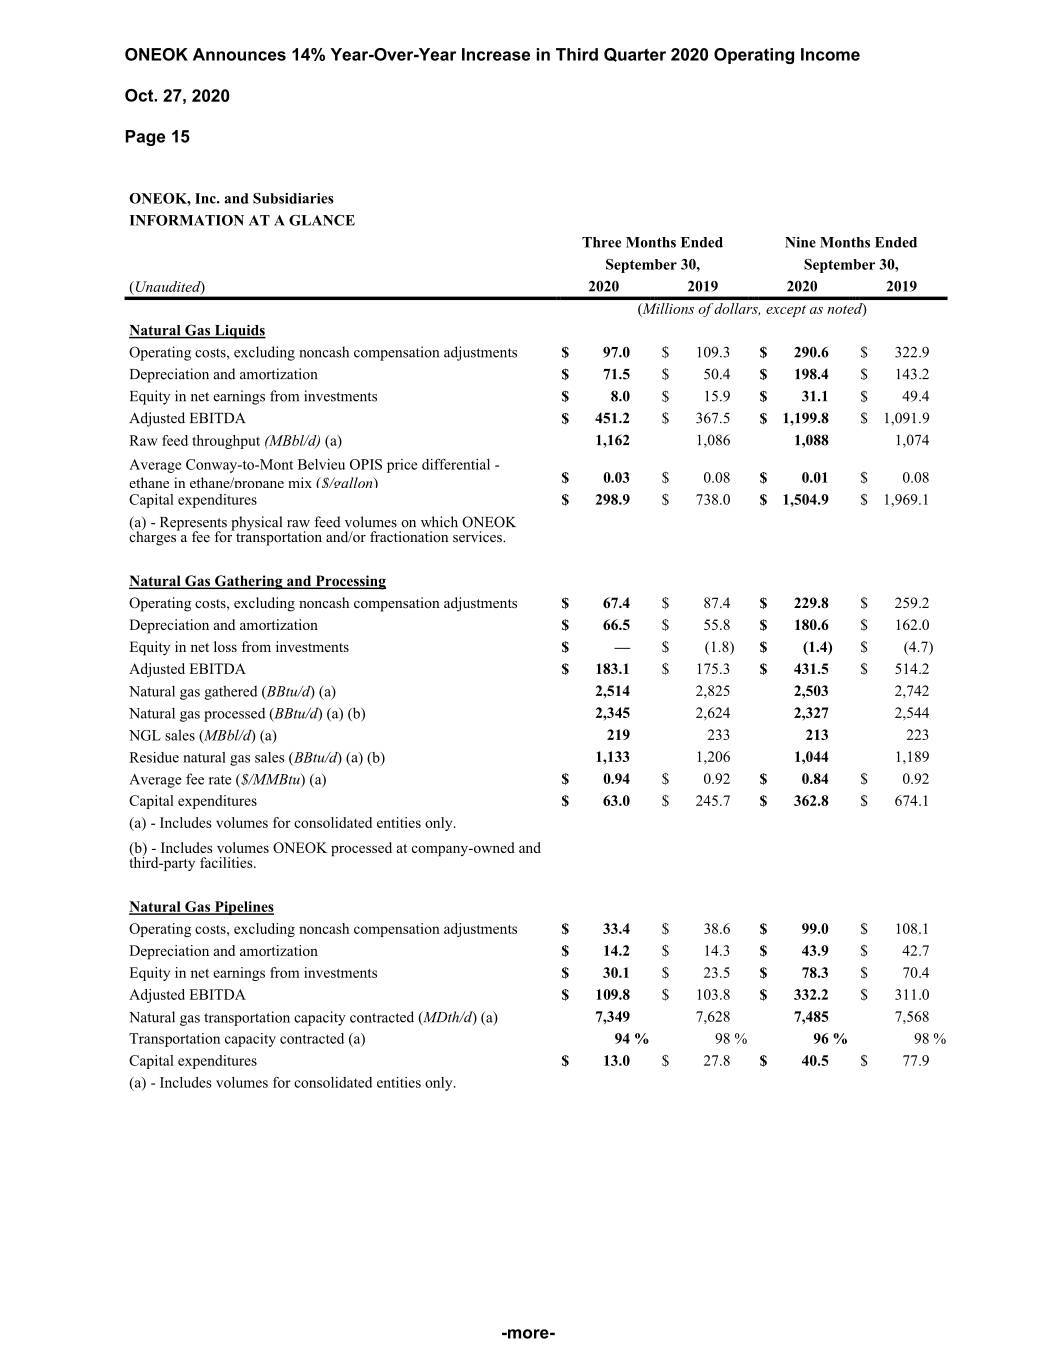
ONEOK Announces 14% Year-Over-Year Increase in Third Quarter 2020 Operating Income Oct. 27, 2020 Page 15 ONEOK, Inc. and Subsidiaries INFORMATION AT A GLANCE Three Months Ended Nine Months Ended September 30, September 30, (Unaudited) 2020 2019 2020 2019 (Millions of dollars, except as noted) Natural Gas Liquids Operating costs, excluding noncash compensation adjustments $ 97.0 $ 109.3 $ 290.6 $ 322.9 Depreciation and amortization $ 71.5 $ 50.4 $ 198.4 $ 143.2 Equity in net earnings from investments $ 8.0 $ 15.9 $ 31.1 $ 49.4 Adjusted EBITDA $ 451.2 $ 367.5 $ 1,199.8 $ 1,091.9 Raw feed throughput (MBbl/d) (a) 1,162 1,086 1,088 1,074 Average Conway-to-Mont Belvieu OPIS price differential - ethane in ethane/propane mix ($/gallon) $ 0.03 $ 0.08 $ 0.01 $ 0.08 Capital expenditures $ 298.9 $ 738.0 $ 1,504.9 $ 1,969.1 (a) - Represents physical raw feed volumes on which ONEOK charges a fee for transportation and/or fractionation services. Natural Gas Gathering and Processing Operating costs, excluding noncash compensation adjustments $ 67.4 $ 87.4 $ 229.8 $ 259.2 Depreciation and amortization $ 66.5 $ 55.8 $ 180.6 $ 162.0 Equity in net loss from investments $ — $ (1.8) $ (1.4) $ (4.7) Adjusted EBITDA $ 183.1 $ 175.3 $ 431.5 $ 514.2 Natural gas gathered (BBtu/d) (a) 2,514 2,825 2,503 2,742 Natural gas processed (BBtu/d) (a) (b) 2,345 2,624 2,327 2,544 NGL sales (MBbl/d) (a) 219 233 213 223 Residue natural gas sales (BBtu/d) (a) (b) 1,133 1,206 1,044 1,189 Average fee rate ($/MMBtu) (a) $ 0.94 $ 0.92 $ 0.84 $ 0.92 Capital expenditures $ 63.0 $ 245.7 $ 362.8 $ 674.1 (a) - Includes volumes for consolidated entities only. (b) - Includes volumes ONEOK processed at company-owned and third-party facilities. Natural Gas Pipelines Operating costs, excluding noncash compensation adjustments $ 33.4 $ 38.6 $ 99.0 $ 108.1 Depreciation and amortization $ 14.2 $ 14.3 $ 43.9 $ 42.7 Equity in net earnings from investments $ 30.1 $ 23.5 $ 78.3 $ 70.4 Adjusted EBITDA $ 109.8 $ 103.8 $ 332.2 $ 311.0 Natural gas transportation capacity contracted (MDth/d) (a) 7,349 7,628 7,485 7,568 Transportation capacity contracted (a) 94 % 98 % 96 % 98 % Capital expenditures $ 13.0 $ 27.8 $ 40.5 $ 77.9 (a) - Includes volumes for consolidated entities only. -more-
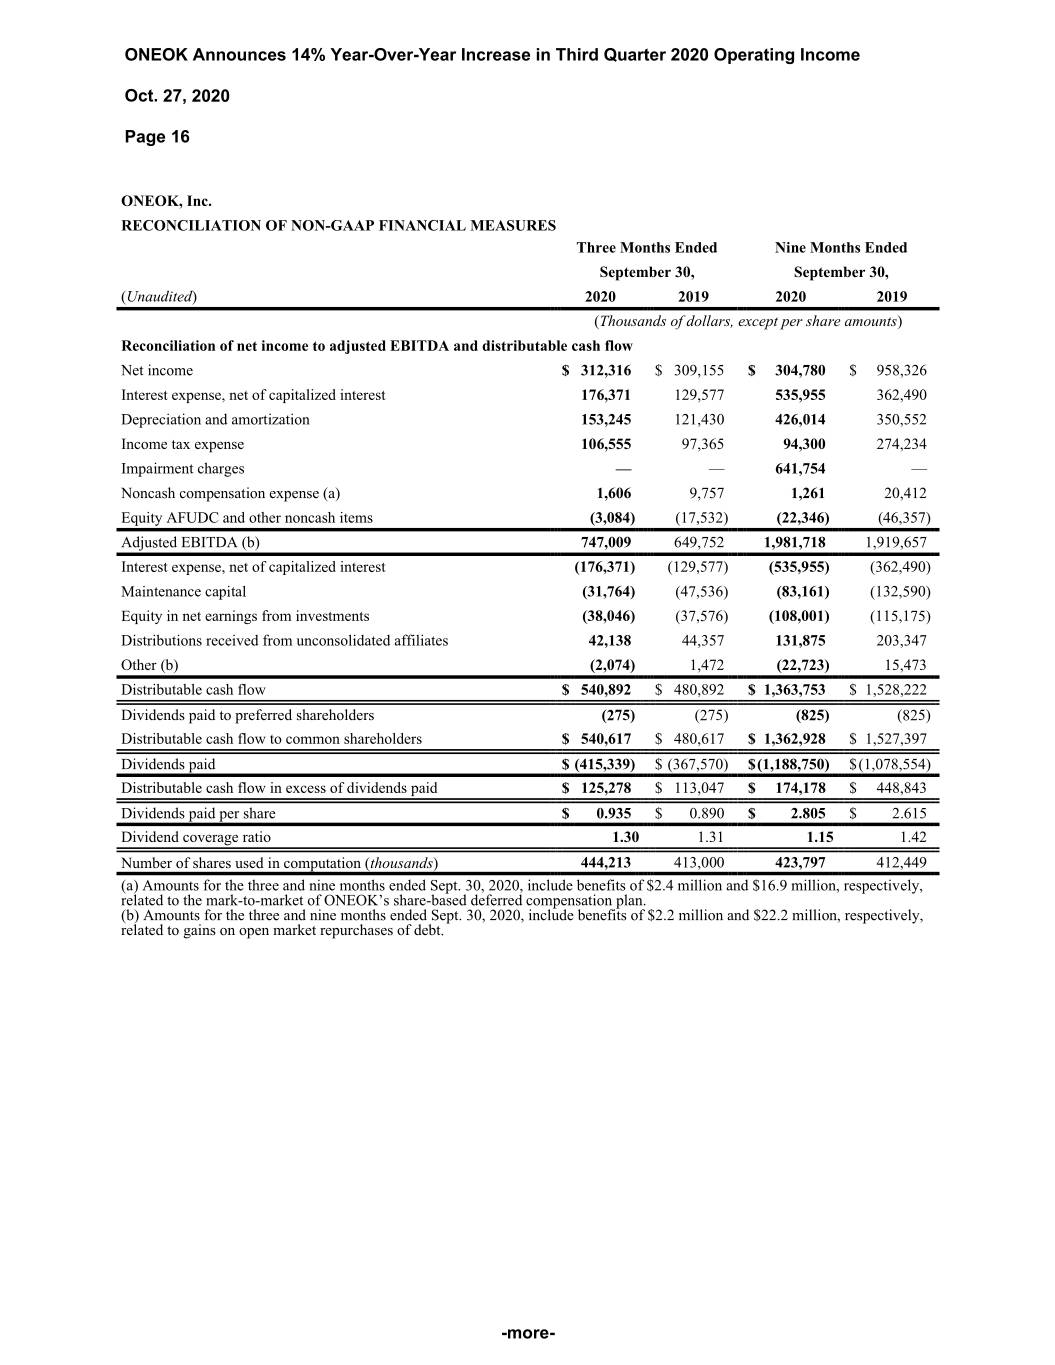
ONEOK Announces 14% Year-Over-Year Increase in Third Quarter 2020 Operating Income Oct. 27, 2020 Page 16 ONEOK, Inc. RECONCILIATION OF NON-GAAP FINANCIAL MEASURES Three Months Ended Nine Months Ended September 30, September 30, (Unaudited) 2020 2019 2020 2019 (Thousands of dollars, except per share amounts) Reconciliation of net income to adjusted EBITDA and distributable cash flow Net income $ 312,316 $ 309,155 $ 304,780 $ 958,326 Interest expense, net of capitalized interest 176,371 129,577 535,955 362,490 Depreciation and amortization 153,245 121,430 426,014 350,552 Income tax expense 106,555 97,365 94,300 274,234 Impairment charges — — 641,754 — Noncash compensation expense (a) 1,606 9,757 1,261 20,412 Equity AFUDC and other noncash items (3,084) (17,532) (22,346) (46,357) Adjusted EBITDA (b) 747,009 649,752 1,981,718 1,919,657 Interest expense, net of capitalized interest (176,371) (129,577) (535,955) (362,490) Maintenance capital (31,764) (47,536) (83,161) (132,590) Equity in net earnings from investments (38,046) (37,576) (108,001) (115,175) Distributions received from unconsolidated affiliates 42,138 44,357 131,875 203,347 Other (b) (2,074) 1,472 (22,723) 15,473 Distributable cash flow $ 540,892 $ 480,892 $ 1,363,753 $ 1,528,222 Dividends paid to preferred shareholders (275) (275) (825) (825) Distributable cash flow to common shareholders $ 540,617 $ 480,617 $ 1,362,928 $ 1,527,397 Dividends paid $ (415,339) $ (367,570) $ (1,188,750) $ (1,078,554) Distributable cash flow in excess of dividends paid $ 125,278 $ 113,047 $ 174,178 $ 448,843 Dividends paid per share $ 0.935 $ 0.890 $ 2.805 $ 2.615 Dividend coverage ratio 1.30 1.31 1.15 1.42 Number of shares used in computation (thousands) 444,213 413,000 423,797 412,449 (a) Amounts for the three and nine months ended Sept. 30, 2020, include benefits of $2.4 million and $16.9 million, respectively, related to the mark-to-market of ONEOK’s share-based deferred compensation plan. (b) Amounts for the three and nine months ended Sept. 30, 2020, include benefits of $2.2 million and $22.2 million, respectively, related to gains on open market repurchases of debt. -more-
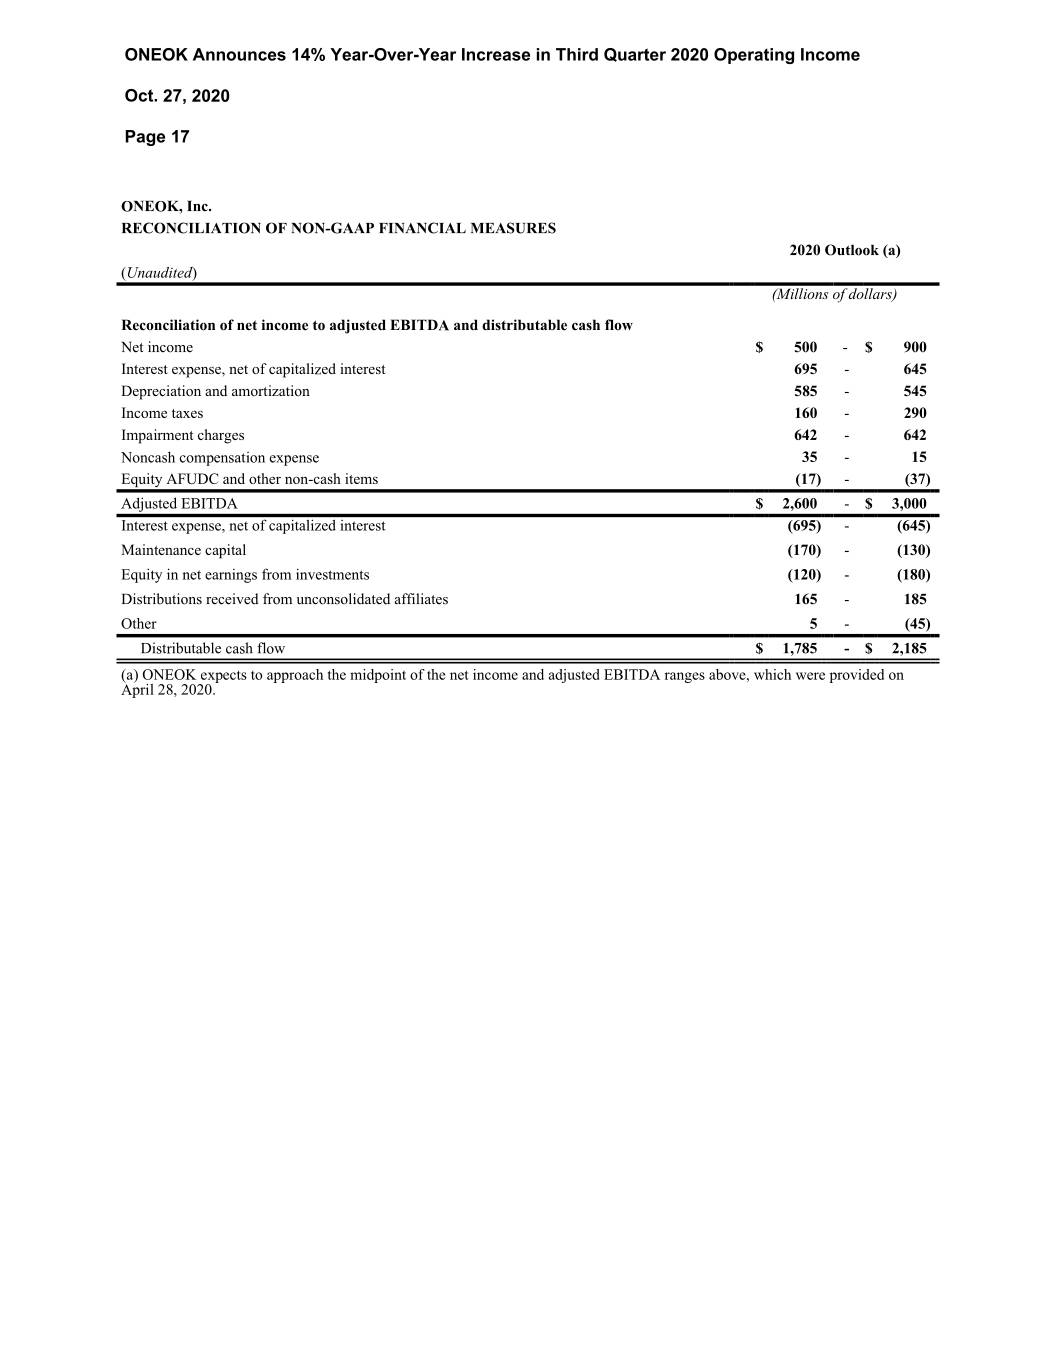
ONEOK Announces 14% Year-Over-Year Increase in Third Quarter 2020 Operating Income Oct. 27, 2020 Page 17 ONEOK, Inc. RECONCILIATION OF NON-GAAP FINANCIAL MEASURES 2020 Outlook (a) (Unaudited) (Millions of dollars) Reconciliation of net income to adjusted EBITDA and distributable cash flow Net income $ 500 - $ 900 Interest expense, net of capitalized interest 695 - 645 Depreciation and amortization 585 - 545 Income taxes 160 - 290 Impairment charges 642 - 642 Noncash compensation expense 35 - 15 Equity AFUDC and other non-cash items (17) - (37) Adjusted EBITDA $ 2,600 - $ 3,000 Interest expense, net of capitalized interest (695) - (645) Maintenance capital (170) - (130) Equity in net earnings from investments (120) - (180) Distributions received from unconsolidated affiliates 165 - 185 Other 5 - (45) Distributable cash flow $ 1,785 - $ 2,185 (a) ONEOK expects to approach the midpoint of the net income and adjusted EBITDA ranges above, which were provided on April 28, 2020.
