Attached files
| file | filename |
|---|---|
| EX-99.1 - EX-99.1 EARNINGS RELEASE Q3 2020 - Independent Bank Group, Inc. | exhibit991q32020.htm |
| 8-K - 8-K - Independent Bank Group, Inc. | ibtx-20201026.htm |

Exhibit 99.2 NASDAQ: IBTX Earnings Presentation October 26, 2020

Safe Harbor Statement The numbers as of and for the quarter ended September 30, 2020 are unaudited. This communication contains “forward-looking statements” within the meaning of the Private Securities Litigation Reform Act of 1995 regarding the financial condition, results of operations, business plans and the future performance of Independent Bank Group, Inc. (“IBTX”). Words such as “anticipates,” “believes,” “estimates,” “expects,” “forecasts,” “intends,” “plans,” “projects,” “could,” “may,” “should,” “will” or other similar words and expressions are intended to identify these forward-looking statements. These forward-looking statements are based on IBTX’s current expectations and assumptions regarding IBTX’s business, the economy, and other future conditions. Because forward-looking statements relate to future results and occurrences, they are subject to inherent uncertainties, assumptions, risks, and changes in circumstances that are difficult to predict. Many possible events or factors could materialize or IBTX’s underlying assumptions could prove incorrect and affect IBTX’s future financial results and performance and could cause actual results or performance to differ materially from anticipated results or performance. Such risks and uncertainties include, among others, risks relating to the coronavirus (COVID-19) pandemic and its effect on U.S. and world financial markets, potential regulatory actions, changes in consumer behaviors and impacts on and modifications to the operations and business of IBTX relating thereto, and the business, economic and political conditions in the markets in which IBTX operates. Except to the extent required by applicable law or regulation, IBTX disclaims any obligation to update such factors or to publicly announce the results of any revisions to any of the forward-looking statements included herein to reflect future events or developments. Further information regarding IBTX and factors which could affect the forward-looking statements contained herein can be found in IBTX’s Annual Report on Form 10-K, as amended, for the fiscal year ended December 31, 2019, its Quarterly Reports on Form 10-Q for the periods ended March 31, 2020 and June 30, 2020, and its other filings with the Securities and Exchange Commission. NASDAQ: IBTX 2

Safe Harbor Statement (cont.) Non-GAAP Financial Measures In addition to results presented in accordance with GAAP, this presentation contains certain non-GAAP financial measures. These measures and ratios include “adjusted net income,” “tangible book value,” “tangible book value per common share,” “adjusted efficiency ratio,” “tangible common equity to tangible assets,” “return on tangible common equity,” “adjusted return on average assets,” “adjusted return on average common equity,” “adjusted return on tangible common equity,” “adjusted earnings per share,” “adjusted diluted earnings per share,” “adjusted net interest margin,” “adjusted net interest income,” “adjusted noninterest expenses” and “adjusted noninterest income” and are supplemental measures that are not required by, or are not presented in accordance with, accounting principles generally accepted in the United States. We believe that these measures provide useful information to management and investors that is supplementary to our financial condition, results of operations and cash flows computed in accordance with GAAP; however we acknowledge that our financial measures have a number of limitations relative to GAAP financial measures. Certain non-GAAP financial measures exclude items of income, expenditures, expenses, assets, or liabilities, including provisions for loan losses and the effect of goodwill, other intangible assets and income from accretion on acquired loans arising from purchase accounting adjustments, that we believe cause certain aspects of our results of operations or financial condition to be not indicative of our primary operating results. All of these items significantly impact our financial statements. Additionally, the items that we exclude in our adjustments are not necessarily consistent with the items that our peers may exclude from their results of operations and key financial measures and therefore may limit the comparability of similarly named financial measures and ratios. We compensate for these limitations by providing the equivalent GAAP measures whenever we present the non- GAAP financial measures and by including a reconciliation of the impact of the components adjusted for in the non-GAAP financial measure so that both measures and the individual components may be considered when analyzing our performance. A reconciliation of our non-GAAP financial measures to the comparable GAAP financial measures is included at the end of this presentation. NASDAQ: IBTX 3

Today's Presenters David R. Brooks Chairman of the Board, CEO and President, Director • 40 years in the financial services industry; 32 years at Independent Bank • Active in community banking since the early 1980s - led the investor group that acquired Independent Bank in 1988 Daniel W. Brooks Vice Chairman, Chief Risk Officer, Director • 37 years in the financial services industry; 31 years at Independent Bank • Active in community banking since the early 1980s Michelle S. Hickox Executive Vice President, Chief Financial Officer • 30 years in the financial services industry; 8 years at Independent Bank • Formerly a Financial Services Audit Partner at RSM US LLP • Certified Public Accountant NASDAQ: IBTX 4

2020 Q3 Results GAAP Adjusted1 For the quarter ended September 30, 2020, the $1.39 $1.38 Adj. EPS Company reported: EPS $60.1 Million $59.6 Million – Net income of $60.1 million, or $1.39 per diluted share Net Income Adj. Net Income and adjusted (non-GAAP) net income of $59.6 million, or $1.38 per diluted share 1.43% 1.42% Return on Average Adj. Return on – Return on average assets of 1.43% and efficiency ratio Assets Average Assets of 44.69% 44.69% 44.57% Efficiency Ratio Adj. Efficiency – Strong organic deposit growth of 14.91%, annualized Ratio – Strong liquidity, with cash and securities representing 14.91% Organic Deposit approximately 14.8% of total assets Growth – Continued solid credit metrics with nonperforming 14.8% assets of 0.25% of total assets and provision for loan Liquidity Ratio losses of $7.6 million 0.25% NPAs/Total Assets – Completed the issuance and sale of $130 million of 4.0% fixed-to-floating rate subordinated debentures 1Adjusted (non-GAAP) metrics. See Appendix for reconciliation to the closest applicable GAAP metrics. NASDAQ: IBTX 5

2020 Q3 Selected Financials $ in thousands, except per share data As of and for the Quarter Ended Selected Balance Sheet Data September 30, 2020 June 30, 2020 September 30, 2019 Linked Quarter Change Annual Change Total Assets $ 17,117,007 $ 16,986,025 $ 14,959,127 0.8 % 14.4 % LHFI, Excluding Mortgage Warehouse Loans1 11,651,855 11,690,356 10,936,136 (0.3) % 6.5 % Mortgage Warehouse Loans 1,219,013 903,630 660,650 34.9 % 84.5 % Total Deposits 13,797,560 13,299,035 11,727,885 3.7 % 17.6 % Total Borrowings (Other Than Junior Subordinated Debentures) 680,529 1,116,462 767,642 (39.0) % (11.3) % Total Stockholders’ Equity 2,476,373 2,424,960 2,298,932 2.1 % 7.7 % Selected Earnings and Profitability Data Net Interest Income $ 132,007 $ 128,372 $ 125,393 2.8 % 5.3 % Net Interest Margin 3.52 % 3.51 % 3.84 % 0.3 % (8.3) % Adjusted Net Interest Margin2 3.48 % 3.50 % 3.82 % (0.6) % (8.9) % Noninterest Income $ 25,165 $ 25,414 $ 27,324 (1.0) % (7.9) % Noninterest Expense 73,409 83,069 76,948 (11.6) % (4.6) % Net Income 60,075 38,693 55,633 55.3 % 8.0 % Adjusted Net Income3 59,580 49,076 57,827 21.4 % 3.0 % Basic EPS 1.39 0.90 1.30 54.4 % 6.9 % Adjusted Basic EPS3 1.38 1.14 1.35 21.1 % 2.2 % Diluted EPS 1.39 0.90 1.30 54.4 % 6.9 % Adjusted Diluted EPS3 1.38 1.14 1.35 21.1 % 2.2 % Return on Average Assets 1.43 % 0.94 % 1.50 % 52.1 % (4.7) % Adjusted Return on Average Assets3 1.42 % 1.20 % 1.56 % 18.3 % (9.0) % 1LHFI includes SBA PPP loans of $825,966 and $823,289 at September 30, 2020 and June 30, 2020, respectively. 2Adjusted net interest margin, excludes unexpected income recognized on credit impaired acquired loans of $1,294, $354, and $618 respectively. 3Adjusted (non-GAAP) metrics. See Appendix for reconciliation to the closest applicable GAAP metrics. NASDAQ: IBTX 6

Tangible Book Value, EPS and Adjusted EPS Trends (Diluted) $32.17 $31.05 $30.08 $28.99 $28.99 $27.44 $27.89 $5.08 $23.76 $4.47 $1.39 $21.19 $1.35 $4.46 $1.32 $4.33 $1.38 $17.85 $3.45 $1.30 $1.17 $3.04 $1.14 $1.03 $2.36 $2.88 $2.97 $1.01 $2.21 $0.90 2015 2016 2017 (1) 2018 2019 Q3 2019 Q4 2019 Q1 2020 Q2 2020 Q3 2020 Year Ending Quarter Ending Tangible Book Value (2) EPS Adjusted EPS (2) (1) Effective January 1, 2018, the TCJA reduced the corporate U.S. statutory tax rate from 35% to 21%. The year ended December 31, 2017, includes a $5,528 charge to remeasure deferred taxes as a result of the enactment of the tax reform. NASDAQ: IBTX (2) Adjusted (non-GAAP) metrics. See Appendix for reconciliation to the closest applicable GAAP metrics. 7 7

Adjusted Efficiency Ratio Trends (1) $130.7 $499.6 $ in Millions $124.8 $322.5 $72.6 $272.7 $261.4 $64.9 $189.4 $157.6 42.98% 44.57% 51.46% 50.47% 45.95% $25.0 $18.7 $35.9 $41.5 $65.9 $12.9 $3.2 $3.2 $4.6 $5.7 2017 2018 2019 Q3 2019 Q3 2020 Year Ending Quarter Ending Adjusted net interest income Adjusted noninterest income Adjusted noninterest expense Amortization of other intangible assets Adjusted efficiency ratio (1) Adjusted (non-GAAP) metrics. See Appendix for reconciliation to the closest applicable GAAP metrics. NASDAQ: IBTX 8 8

Loan Portfolio Growth Total Loans by Year and Current Annual Trend ($ in Millions) (1) 2017 - 2019 CAGR 33.8% 11.4% Increase $12,958 $11,652 $11,630 $7,921 $6,513 2017 2018 2019 Q3 2019 Q3 2020 Year Ending Quarter Ending Organic Impact of Acquisitions PPP Loans (1) Includes loans held for sale NASDAQ: IBTX 9 9
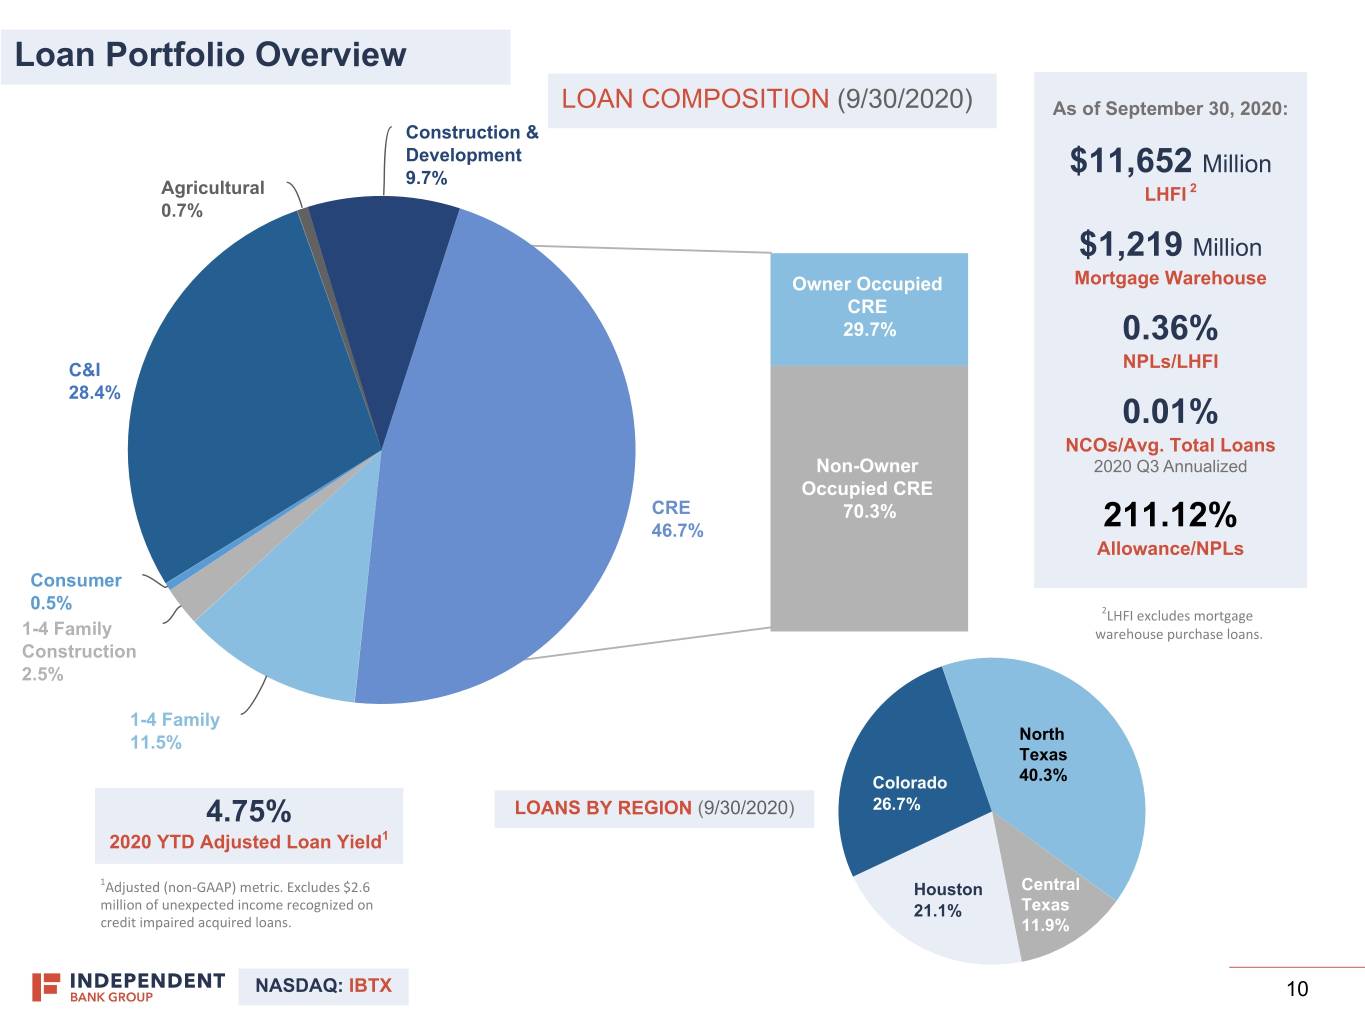
Loan Portfolio Overview LOAN COMPOSITION (9/30/2020) As of September 30, 2020: Construction & Development Million 9.7% $11,652 Agricultural LHFI 2 0.7% $1,219 Million Owner Occupied Mortgage Warehouse CRE 29.7% 0.36% C&I NPLs/LHFI 28.4% 0.01% NCOs/Avg. Total Loans Non-Owner 2020 Q3 Annualized Occupied CRE CRE 70.3% 46.7% 211.12% Allowance/NPLs Consumer 0.5% 2LHFI excludes mortgage 1-4 Family warehouse purchase loans. Construction 2.5% 1-4 Family 11.5% North Texas Colorado 40.3% 4.75% LOANS BY REGION (9/30/2020) 26.7% 2020 YTD Adjusted Loan Yield1 1Adjusted (non-GAAP) metric. Excludes $2.6 Houston Central million of unexpected income recognized on 21.1% Texas credit impaired acquired loans. 11.9% NASDAQ: IBTX 10
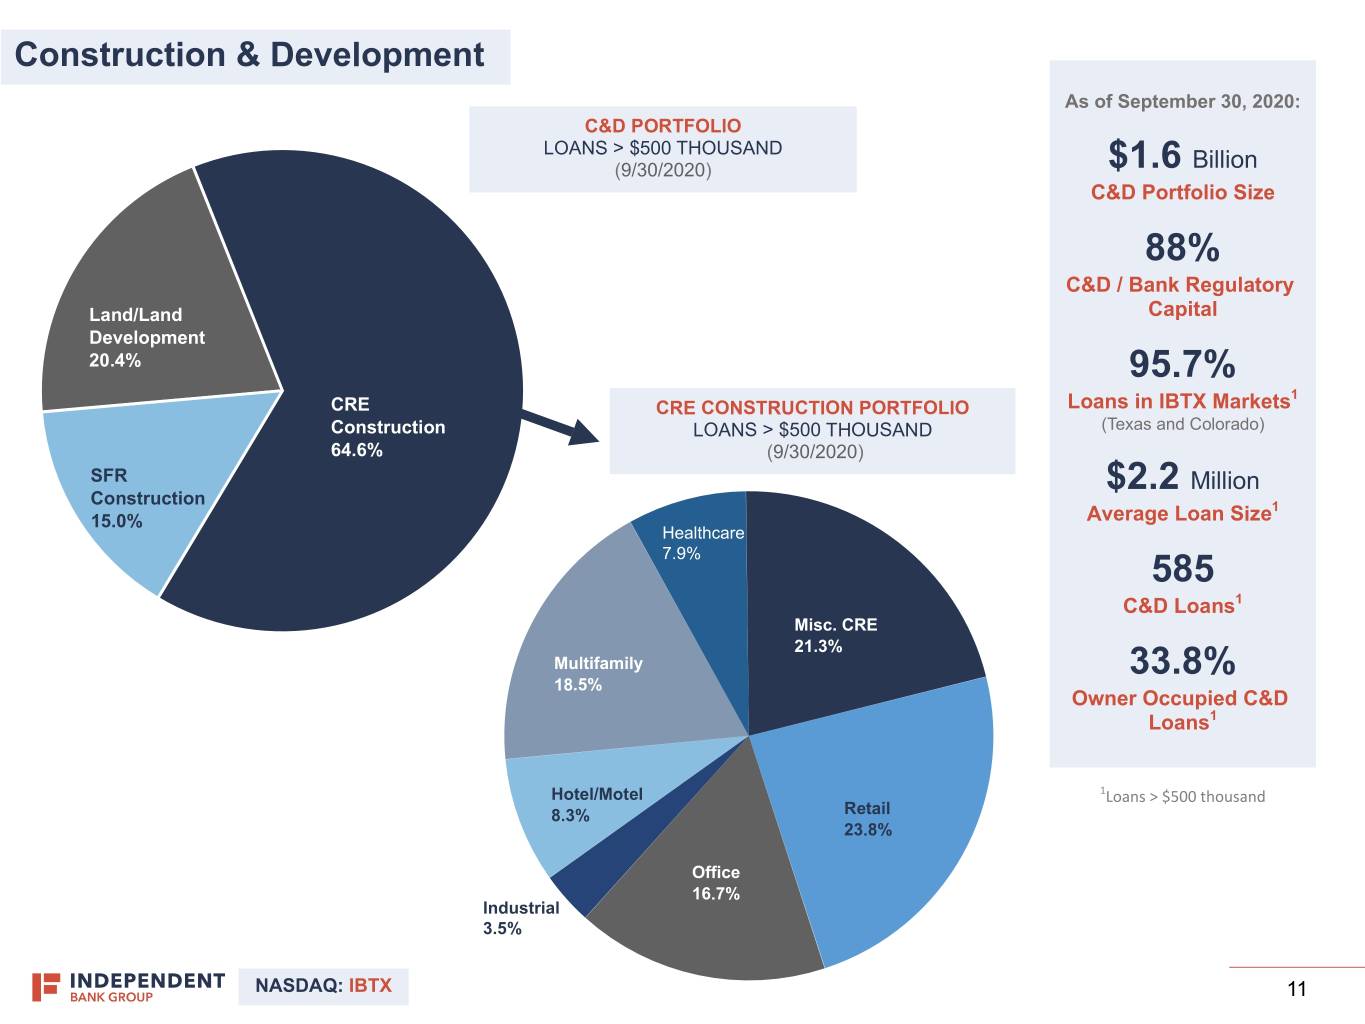
Construction & Development As of September 30, 2020: C&D PORTFOLIO LOANS > $500 THOUSAND (9/30/2020) $1.6 Billion C&D Portfolio Size 88% C&D / Bank Regulatory Land/Land Capital Development 20.4% 95.7% 1 CRE CRE CONSTRUCTION PORTFOLIO Loans in IBTX Markets Construction LOANS > $500 THOUSAND (Texas and Colorado) 64.6% (9/30/2020) SFR $2.2 Million Construction 1 15.0% Average Loan Size Healthcare 7.9% 585 C&D Loans1 Misc. CRE 21.3% Multifamily 33.8% 18.5% Owner Occupied C&D Loans1 Hotel/Motel 1Loans > $500 thousand 8.3% Retail 23.8% Office 16.7% Industrial 3.5% NASDAQ: IBTX 11

Commercial Real Estate As of September 30, 2020: CRE COMPOSITION (9/30/2020) $6.1 Billion CRE Loans Multifamily 7.7% 325% CRE / Regulatory Bank Capital Mixed Use (Non-Retail) 1.7% Million Office and Office $28.0 Warehouse 24.5% Largest CRE Loan Size Miscellaneous 7.3% $1.2 Million Average CRE Loan Size Restaurant 2.9% 29.7% Owner Occupied Mini Storage 2.8% Retail 25.2% Convenience Store 2.5% Church 2.0% Healthcare 6.2% Daycare/School 2.5% Industrial 8.5% Hotel/Motel 6.2% NASDAQ: IBTX 12

Retail CRE RETAIL CRE & C&D COMPOSITION As of September 30, 2020: LOANS > $500 THOUSAND 9/30/2020 $1.7 Billion Retail Loan Portfolio Size Big Box Mixed Use $19.6 Million 10.4% 1.8% Largest Retail Loan 997 Total Retail Loans Free Standing / 9/30/2020 Single Tenant 15.2% 95.0% Loans in IBTX Markets (Texas and Colorado) Strip Center 72.6% $1.7 Million Average Loan Size 75 Number of Loans >$5m $8.7 Million Avg. Size of Loans >$5m 54% 1.68x Weighted Average LTV Weighted Average DSCR Pre-Pandemic (March 2020) Pre-Pandemic (March 2020) NASDAQ: IBTX 13

Office CRE As of September 30, 2020: Office CRE COMPOSITION 9/30/2020 $1.6 Billion Total Office CRE Office/Warehouse Owner Occupied $20.8 Million 12.3% Largest Office Loan $1.0 Million Average Loan Size 32.9% Owner Occupied Office Non-Owner Occupied Office/Warehouse 45.1% 34.3% Non-Owner Occupied Office/Warehouse 22.0% Office Owner Occupied 20.6% NASDAQ: IBTX 14

Hotel & Motel As of September 30, 2020: $444.3 Million – We maintain a granular book of hotel loans in our markets, the majority of Hotel & Motel Loan which are branded, limited/select service properties in our core markets Portfolio Size across Texas and Colorado. $5.6 Million – We have very limited exposure to those segments of the hotel industry that Average Loan Size have been most impacted by the COVID-19 pandemic (i.e. resort and conference hotels). 52.7% Average LTV – While we anticipate many of our hotel borrowers will need additional time to recover from pandemic-related economic dislocation, we remain encouraged 1.78x by the early signs of recovery in occupancy rates. Weighted Average DSCR Pre-Pandemic (March 2020) Hotel Loans by Type Hotel Loans by Property Hotel Loans by Product Location Type 79.4% 14.7% 40.1% 7.9% 77.4% 20.6% 9.0% 50.9% Full Service Brand CRE Limited/Selected Service Brand Construction & Development Texas Colorado Other Boutique/Independent NASDAQ: IBTX 15

Energy Lending As of September 30, 2020: – We have a small, conservatively-underwritten energy book that is mostly of recent vintage. $219.7 Million Size of Energy Portfolio – Energy assets are well-diversified by basin across the 90.5% / 9.5% United States. E&P Loans / Services Loans Energy by Type 6.1% Energy Reserve / Energy Loans $ in millions 1.9% Energy Loans / Total LHFI $199.0 $20.7 E&P Services NASDAQ: IBTX 16

Loan Deferral Update as of October 16, 2020 – As of October 16, 2020, 1.2% of our loan accounts* remain in deferral: 1.2% – 4.5% of our loan balances* remain in deferral Number of Loan Accounts* Remaining in Deferral – 2.7% of our loan balances* are on 2nd deferral, or have a 2nd deferral pending 4.5% Amount of Loan Balances* – As anticipated, the number of deferrals continues to trend downward Remaining in Deferral – Hotel loans remain the largest category of loans still in deferral, accounting 2.7% for 37% of all deferral balances as of October 16th Amount of Loan Balances* in 2nd Deferral – Retail deferrals have dropped sharply, falling 56% since last update (8/31) *Loan accounts and balances used in the – Office deferrals have dropped sharply, falling 83% since last update (8/31) denominator exclude PPP and HFS loans. *Loan accounts and balances exclude PPP and HFS loans. Detail on Remaining Deferrals % of Category % of Category % of Category As of October 16, 2020 $ Remaining on 1st $ Granted/Pending 2nd Total $ on Any Balance** Remaining Balance** On/Pending Balance on Any $ in thousands Deferral^ Deferral Deferral on 1st Deferral 2nd Deferral Deferral Hotel Loans $104,545 $99,519 $204,064 23.5% 22.4% 45.9% Retail Loans 41,388 45,928 87,316 2.4% 2.7% 5.1% Office Loans 5,688 12,572 18,260 0.3% 0.8% 1.1% Other CRE and C&D Loans 19,113 135,092 154,205 0.5% 3.8% 4.3% C&I Loans 39,357 32,901 72,258 1.9% 1.6% 3.5% Other Loans 8,241 3,695 11,936 0.3% 0.1% 0.4% Total Loans $218,332 $329,707 $548,039 1.8% 2.7% 4.5% ^ Includes loans whose deferral period has expired, but where payment has not yet been due, received and/or processed. Includes loans that were granted original 6 month deferrals. ** Category balance as of 09/30/2020 NASDAQ: IBTX 17
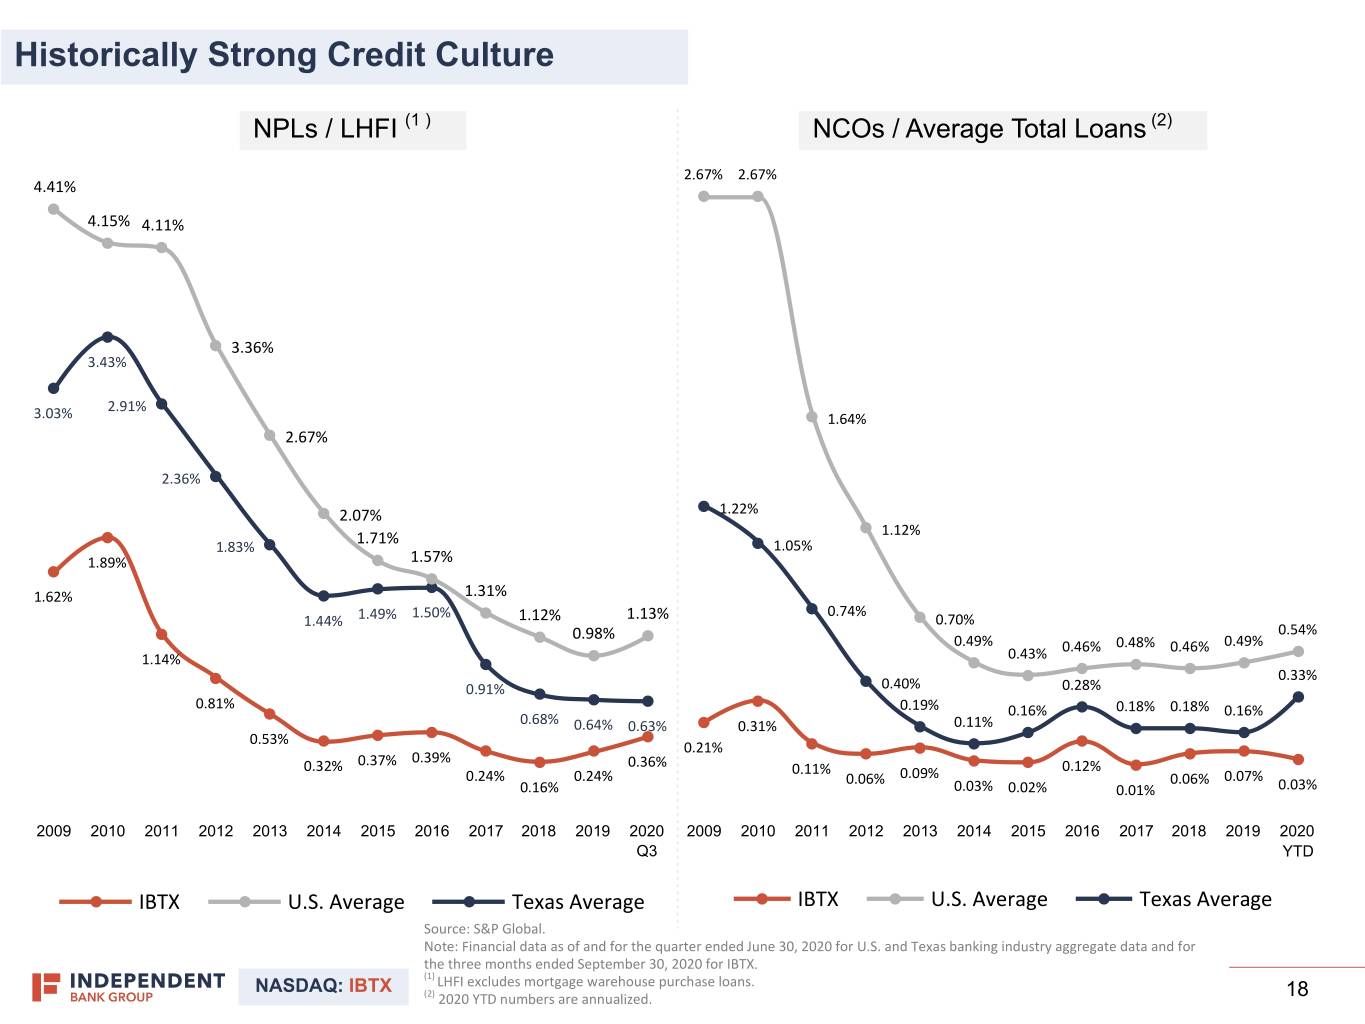
Historically Strong Credit Culture NPLs / LHFI (1 ) NCOs / Average Total Loans (2) 2.67% 2.67% 4.41% 4.15% 4.11% 3.36% 3.43% 2.91% 3.03% 1.64% 2.67% 2.36% 2.07% 1.22% 1.71% 1.12% 1.83% 1.05% 1.89% 1.57% 1.62% 1.31% 1.50% 0.74% 1.44% 1.49% 1.12% 1.13% 0.70% 0.98% 0.54% 0.49% 0.46% 0.48% 0.46% 0.49% 1.14% 0.43% 0.33% 0.91% 0.40% 0.28% 0.81% 0.19% 0.16% 0.18% 0.18% 0.16% 0.68% 0.64% 0.63% 0.31% 0.11% 0.53% 0.21% 0.37% 0.39% 0.32% 0.36% 0.11% 0.12% 0.24% 0.24% 0.06% 0.09% 0.06% 0.07% 0.16% 0.03% 0.02% 0.01% 0.03% 2009 2010 2011 2012 2013 2014 2015 2016 2017 2018 2019 2020 2009 2010 2011 2012 2013 2014 2015 2016 2017 2018 2019 2020 Q3 YTD IBTX U.S. Average Texas Average IBTX U.S. Average Texas Average Source: S&P Global. Note: Financial data as of and for the quarter ended June 30, 2020 for U.S. and Texas banking industry aggregate data and for the three months ended September 30, 2020 for IBTX. (1) NASDAQ: IBTX LHFI excludes mortgage warehouse purchase loans. (2) 2020 YTD numbers are annualized. 18

Provision & Charge-offs $23,121 $ in Thousands NCO's / Avg. Total Loans (1) 0.01% 0.06% 0.07% 0.21% 0.02% 0.05% 0.05% 0.01% $14,805 $8,146 $5,861 $9,860 $8,381 $8,265 $7,620 $5,233 $4,460 $1,439 $1,469 $1,609 $454 $595 $184 2017 2018 2019 Q3 2019 Q4 2019 Q1 2020 Q2 2020 Q3 2020 Year Ending Quarter Ending Provision expense Net charge-offs (1) Quarterly metrics are annualized. NASDAQ: IBTX 19 19

Loans Past Due and Classified Loans Loans 30 - 89 Days Past Due1 Classified Loans $ in Thousands $26,908 $189,521 $22,488 $19,041 $15,639 $114,296 $73,382 0.34% 1.47% 0.19% $56,544 0.24% 0.15% 0.98% 0.87% 0.93% 2017 2018 2019 Q3 2020 2017 2018 2019 Q3 2020 30 - 89 Days Past Due % of LHFI Classified Loans % of LHFI 1Includes 30- 89 days past due acquired PCI loans. NASDAQ: IBTX 20

Loan Loss Coverage IBTX Allowance For Credit Losses – IBTX deferred CECL adoption as as of 9/30/2020 provided under the CARES Act until Illustrative Retrospective Impact of CECL Adoption the earlier of December 31, 2020, or the termination of the President’s national emergency declaration, with a retrospective effective date of January 1, 2020. ~$58 Million – Current anticipated “Day One”, January 1, 2020, impact from the adoption of CECL is estimated to $22 Million boost reserves to approximately 1.44% of loans held for investment (excluding mortgage warehouse): ~$167.5 Million $87.5 Million $87.5 Million ~1.44% of LHFI (Excluding Mortgage Warehouse) 0.75% of LHFI 9/30/2020 ALLL (Excluding Mortgage Warehouse) – This illustration excludes additional provision expense to be taken in future As of 9/30/2020 Estimated Retrospective 2020 quarters and any changes to Adoption of CECL PCD credit marks. Loan Loss Reserve PCD Credit Mark Est. CECL Day 1 Impact NASDAQ: IBTX 21
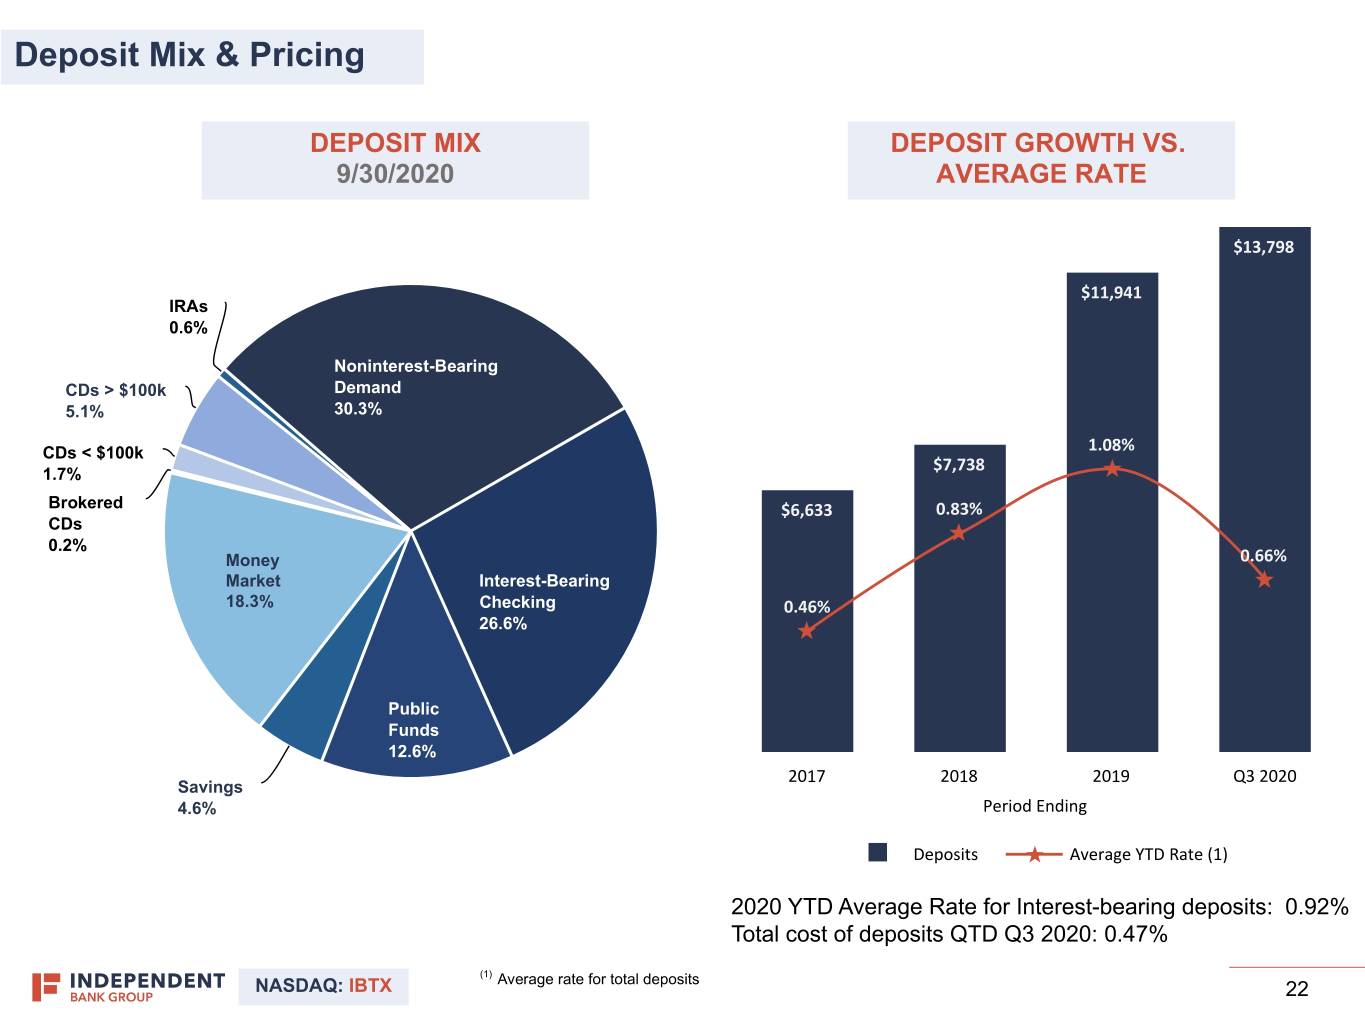
Deposit Mix & Pricing DEPOSIT MIX DEPOSIT GROWTH VS. 9/30/2020 AVERAGE RATE $13,798 $11,941 IRAs 0.6% Noninterest-Bearing CDs > $100k Demand 5.1% 30.3% CDs < $100k 1.08% 1.7% $7,738 Brokered $6,633 0.83% CDs 0.2% Money 0.66% Market Interest-Bearing 18.3% Checking 0.46% 26.6% Public Funds 12.6% 2017 2018 2019 Q3 2020 Savings 4.6% Period Ending Deposits Average YTD Rate (1) 2020 YTD Average Rate for Interest-bearing deposits: 0.92% Total cost of deposits QTD Q3 2020: 0.47% (1) NASDAQ: IBTX Average rate for total deposits 22 22

Securities Portfolio As of September 30, Our investment portfolio consists of a diversified mix of liquid, low-risk 2020: securities designed to help augment the bank’s liquidity position and 2.5% manage interest rate risk toward our target “net neutral” position. Yield 3.50 Duration INVESTMENT PORTFOLIO COMPOSITION 9/30/2020 U.S. Treasury 6.3% Securities 4.6% of Total Assets CRA 0.1% Agency $1.1 Billion Securities Corporates Portfolio Size 19.0% 1.8% Taxable Municipals 2.3% Mortgage-Backed Tax-Exempt Securities Municipals 39.7% 32.5% NASDAQ: IBTX 23

Consolidated Capital 13.29% 12.56% 12.58% 12.44% 12.05% 11.83% 11.38% 10.60% 10.66% 10.41% 10.38% 10.19% 10.17% 10.24% 10.05% 10.05% 9.95% 9.76% 9.61% 9.57% 9.32% 9.67% 9.15% 8.92% 8.94% 9.24% 8.55% 8.98% 8.94% 8.68% 8.20% 8.37% 8.41% 7.82% 7.17% 12/31/16 12/31/17 12/31/18 12/31/19 2020 Q1 2020 Q2 2020 Q3 Period Ending Common equity tier 1 to risk-weighted assets Tier 1 capital to average assets Total capital to risk-weighted assets Tangible common equity to tangible assets (1) Tier 1 capital to risk-weighted assets NASDAQ: IBTX (1) Adjusted (non-GAAP) metrics. See Appendix for reconciliation to the closest applicable GAAP metrics. 24
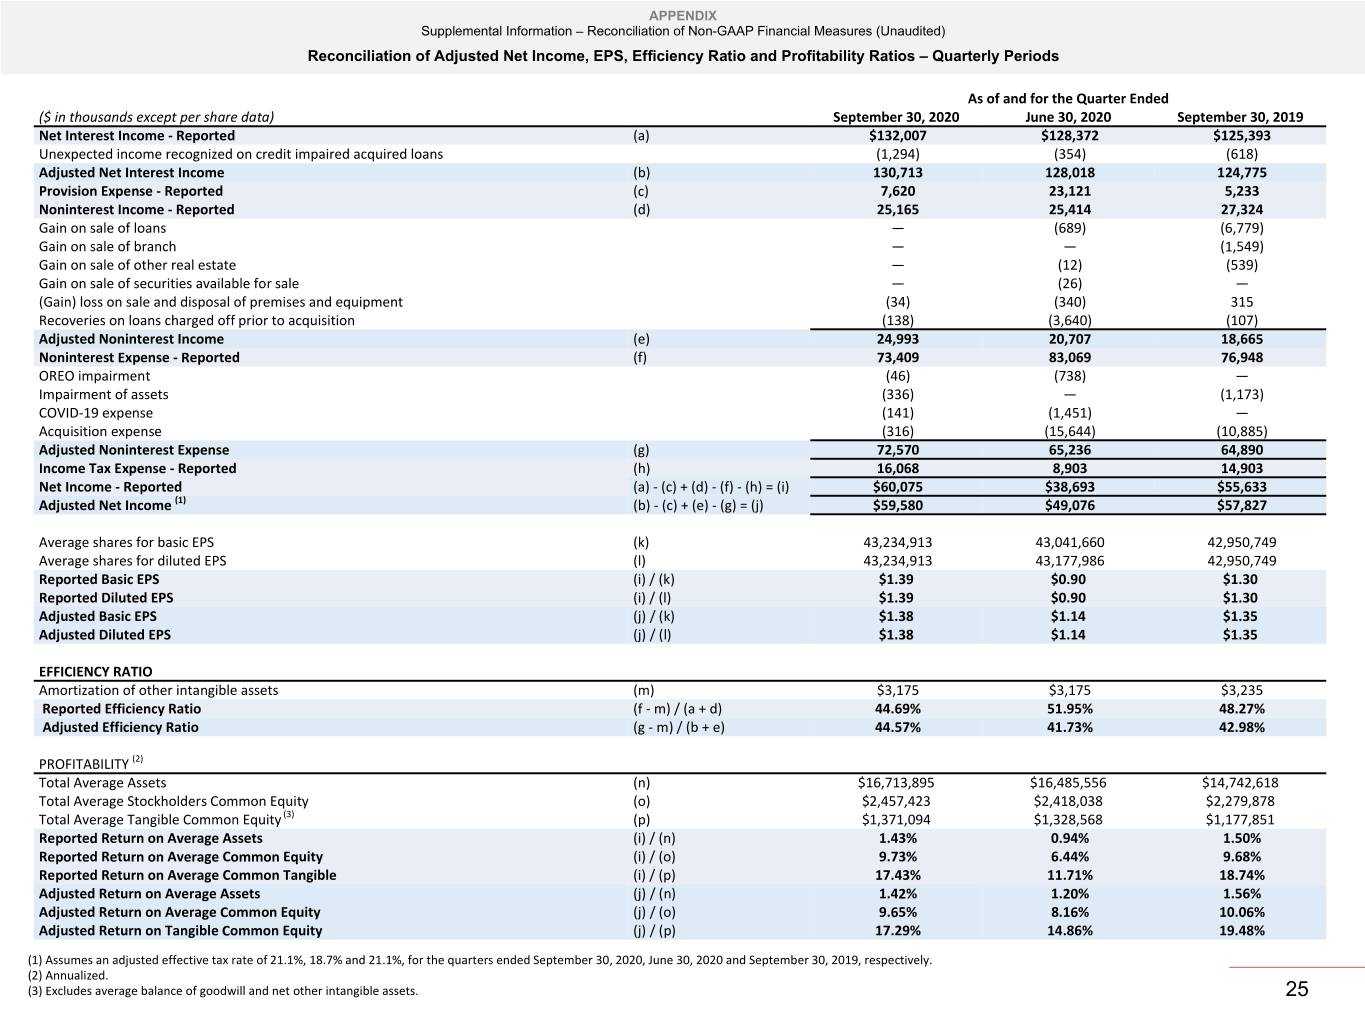
APPENDIX Supplemental Information – Reconciliation of Non-GAAP Financial Measures (Unaudited) Reconciliation of Adjusted Net Income, EPS, Efficiency Ratio and Profitability Ratios – Quarterly Periods As of and for the Quarter Ended ($ in thousands except per share data) September 30, 2020 June 30, 2020 September 30, 2019 Net Interest Income - Reported (a) $132,007 $128,372 $125,393 Unexpected income recognized on credit impaired acquired loans (1,294) (354) (618) Adjusted Net Interest Income (b) 130,713 128,018 124,775 Provision Expense - Reported (c) 7,620 23,121 5,233 Noninterest Income - Reported (d) 25,165 25,414 27,324 Gain on sale of loans — (689) (6,779) Gain on sale of branch — — (1,549) Gain on sale of other real estate — (12) (539) Gain on sale of securities available for sale — (26) — (Gain) loss on sale and disposal of premises and equipment (34) (340) 315 Recoveries on loans charged off prior to acquisition (138) (3,640) (107) Adjusted Noninterest Income (e) 24,993 20,707 18,665 Noninterest Expense - Reported (f) 73,409 83,069 76,948 OREO impairment (46) (738) — Impairment of assets (336) — (1,173) COVID-19 expense (141) (1,451) — Acquisition expense (316) (15,644) (10,885) Adjusted Noninterest Expense (g) 72,570 65,236 64,890 Income Tax Expense - Reported (h) 16,068 8,903 14,903 Net Income - Reported (a) - (c) + (d) - (f) - (h) = (i) $60,075 $38,693 $55,633 Adjusted Net Income (1) (b) - (c) + (e) - (g) = (j) $59,580 $49,076 $57,827 Average shares for basic EPS (k) 43,234,913 43,041,660 42,950,749 Average shares for diluted EPS (l) 43,234,913 43,177,986 42,950,749 Reported Basic EPS (i) / (k) $1.39 $0.90 $1.30 Reported Diluted EPS (i) / (l) $1.39 $0.90 $1.30 Adjusted Basic EPS (j) / (k) $1.38 $1.14 $1.35 Adjusted Diluted EPS (j) / (l) $1.38 $1.14 $1.35 EFFICIENCY RATIO Amortization of other intangible assets (m) $3,175 $3,175 $3,235 Reported Efficiency Ratio (f - m) / (a + d) 44.69% 51.95% 48.27% Adjusted Efficiency Ratio (g - m) / (b + e) 44.57% 41.73% 42.98% PROFITABILITY (2) Total Average Assets (n) $16,713,895 $16,485,556 $14,742,618 Total Average Stockholders Common Equity (o) $2,457,423 $2,418,038 $2,279,878 Total Average Tangible Common Equity (3) (p) $1,371,094 $1,328,568 $1,177,851 Reported Return on Average Assets (i) / (n) 1.43% 0.94% 1.50% Reported Return on Average Common Equity (i) / (o) 9.73% 6.44% 9.68% Reported Return on Average Common Tangible (i) / (p) 17.43% 11.71% 18.74% Adjusted Return on Average Assets (j) / (n) 1.42% 1.20% 1.56% Adjusted Return on Average Common Equity (j) / (o) 9.65% 8.16% 10.06% Adjusted Return on Tangible Common Equity (j) / (p) 17.29% 14.86% 19.48% (1) Assumes an adjusted effective tax rate of 21.1%, 18.7% and 21.1%, for the quarters ended September 30, 2020, June 30, 2020 and September 30, 2019, respectively. (2) Annualized. (3) Excludes average balance of goodwill and net other intangible assets. 25

APPENDIX Supplemental Information – Reconciliation of Non-GAAP Financial Measures (Unaudited) Reconciliation of Adjusted Net Income, EPS, Efficiency Ratio and Profitability Ratios – Annual Periods For the Year Ended December 31, ($ in thousands except per share data) 2019 2018 2017 2016 2015 Net Interest Income - Reported (a) $504,757 $326,252 $265,478 $183,806 $154,098 Unexpected income recognized on credit impaired acquired loans (5,120) (3,711) (4,063) (1,765) (1,272) Adjusted Net Interest Income (b) 499,637 322,541 261,415 182,041 152,826 Provision Expense - Reported (c) 14,805 9,860 8,265 9,440 9,231 Noninterest Income - Reported (d) 78,176 42,224 41,287 19,555 16,128 Gain on sale of loans (6,779) — (351) — (116) (Gain) loss on sale of branch (1,549) — (2,917) 43 — Gain on sale of trust business (1,319) — — — — Gain on sale of other real estate (875) (269) (850) (62) (290) (Gain) loss on sale of securities available for sale (275) 581 (124) (4) (134) Loss (gain) on sale and disposal of premises and equipment 585 (123) 21 (32) 358 Recoveries on loans charged off prior to acquisition (2,101) (962) (1,182) — — Adjusted Noninterest Income (e) 65,863 41,451 35,884 19,500 15,946 Noninterest Expense - Reported (f) 321,864 198,619 176,813 113,790 103,198 Separation expense (3,421) — — (2,575) — OREO impairment (1,801) (85) (1,412) (106) (35) IPO related stock grants — (136) (508) (543) (624) Impairment of assets (1,173) — — — — Acquisition expense (42,744) (8,958) (17,259) (3,121) (3,954) Adjusted Noninterest Expense (g) 272,725 189,440 157,634 107,445 98,585 Income Tax Expense - Reported (h) 53,528 31,738 45,175 26,591 19,011 Net Income - Reported (a) - (c) + (d) - (f) - (h) = (i) $192,736 $128,259 $76,512 $53,540 $38,786 Adjusted Net Income (1) (b) - (c) + (e) - (g) = (j) $219,582 $132,183 $88,878 $56,562 $41,056 Average shares for basic EPS (k) 43,245,418 29,599,119 25,636,292 18,501,663 17,321,513 Average shares for diluted EPS (l) 43,245,418 29,599,119 25,742,362 18,588,309 17,406,108 Reported Basic EPS (i) / (k) $4.46 $4.33 $2.98 $2.89 $2.23 Reported Diluted EPS (i) / (l) $4.46 $4.33 $2.97 $2.88 $2.21 Adjusted Basic EPS (j) / (k) $5.08 $4.47 $3.47 $3.06 $2.37 Adjusted Diluted EPS (j) / (l) $5.08 $4.47 $3.45 $3.04 $2.36 EFFICIENCY RATIO Amortization of other intangible assets (m) $12,880 $5,739 $4,639 $1,964 $1,555 Reported Efficiency Ratio (f - m) / (a + d) 53.01% 52.35% 56.13% 54.99% 59.71% Adjusted Efficiency Ratio (g - m) / (b + e) 45.95% 50.47% 51.46% 52.34% 57.49% PROFITABILITY Total Average Assets (n) $14,555,315 $9,478,934 $7,966,421 $5,469,542 $4,395,552 Total Average Stockholders Common Equity (o) $2,267,103 $1,476,688 $1,139,573 $635,864 $540,489 Total Average Tangible Common Equity (2) (p) $1,164,915 $751,911 $568,071 $362,287 $294,133 Reported Return on Average Assets (i) / (n) 1.32% 1.35% 0.96% 0.98% 0.88% Reported Return on Average Common Equity (3) (i) / (o) 8.50% 8.69% 6.71% 8.42% 7.13% Reported Return on Average Common Tangible (3) (i) / (p) 16.55% 17.06% 13.47% 14.78% 13.10% Adjusted Return on Average Assets (j) / (n) 1.51% 1.39% 1.12% 1.03% 0.93% Adjusted Return on Average Common Equity (3) (j) / (o) 9.69% 8.95% 7.80% 8.90% 7.60% Adjusted Return on Tangible Common Equity (3) (j) / (p) 18.85% 17.58% 15.65% 15.61% 13.96% (1) Assumes an adjusted effective tax rate of 21.0%, 19.7%, 32.4%, 33.2%, and 32.6% for the years ended December 31, 2019, 2018, 2017, 2016, and 2015, respectively. (2) Excludes average balance of goodwill and net other intangible assets and preferred stock. 26 (3) 2015 net income adjusted to exclude 2015 YTD preferred stock dividend of $240.

APPENDIX Supplemental Information – Reconciliation of Non-GAAP Financial Measures (Unaudited) Reconciliation of Tangible Common Equity to Tangible Assets and Tangible Book Value Per Common Share – Quarterly Periods ($ in thousands, except per share information) September 30, 2020 June 30, 2020 March 31, 2020 December 31, 2019 September 30, 2019 Tangible Common Equity Total common stockholders equity $2,476,373 $2,424,960 $2,386,285 $2,339,773 $2,298,932 Adjustments: Goodwill (994,021) (994,021) (994,021) (994,021) (994,021) Other intangible assets, net (91,215) (94,390) (97,565) (100,741) (106,855) Tangible Common Equity $1,391,137 $1,336,549 $1,294,699 $1,245,011 $1,198,056 Tangible Assets Total Assets $17,117,007 $16,986,025 $15,573,868 $14,958,207 $14,959,127 Adjustments: Goodwill (994,021) (994,021) (994,021) (994,021) (994,021) Other intangible assets, net (91,215) (94,390) (97,565) (100,741) (106,855) Tangible Assets $16,031,771 $15,897,614 $14,482,282 $13,863,445 $13,858,251 Common shares outstanding 43,244,797 43,041,119 43,041,776 42,950,228 42,952,642 Tangible Common Equity To Tangible Assets 8.68% 8.41% 8.94% 8.98% 8.65% Book value per common share $57.26 $56.34 $55.44 $54.48 $53.52 Tangible book value per common share $32.17 $31.05 $30.08 $28.99 $27.89 27
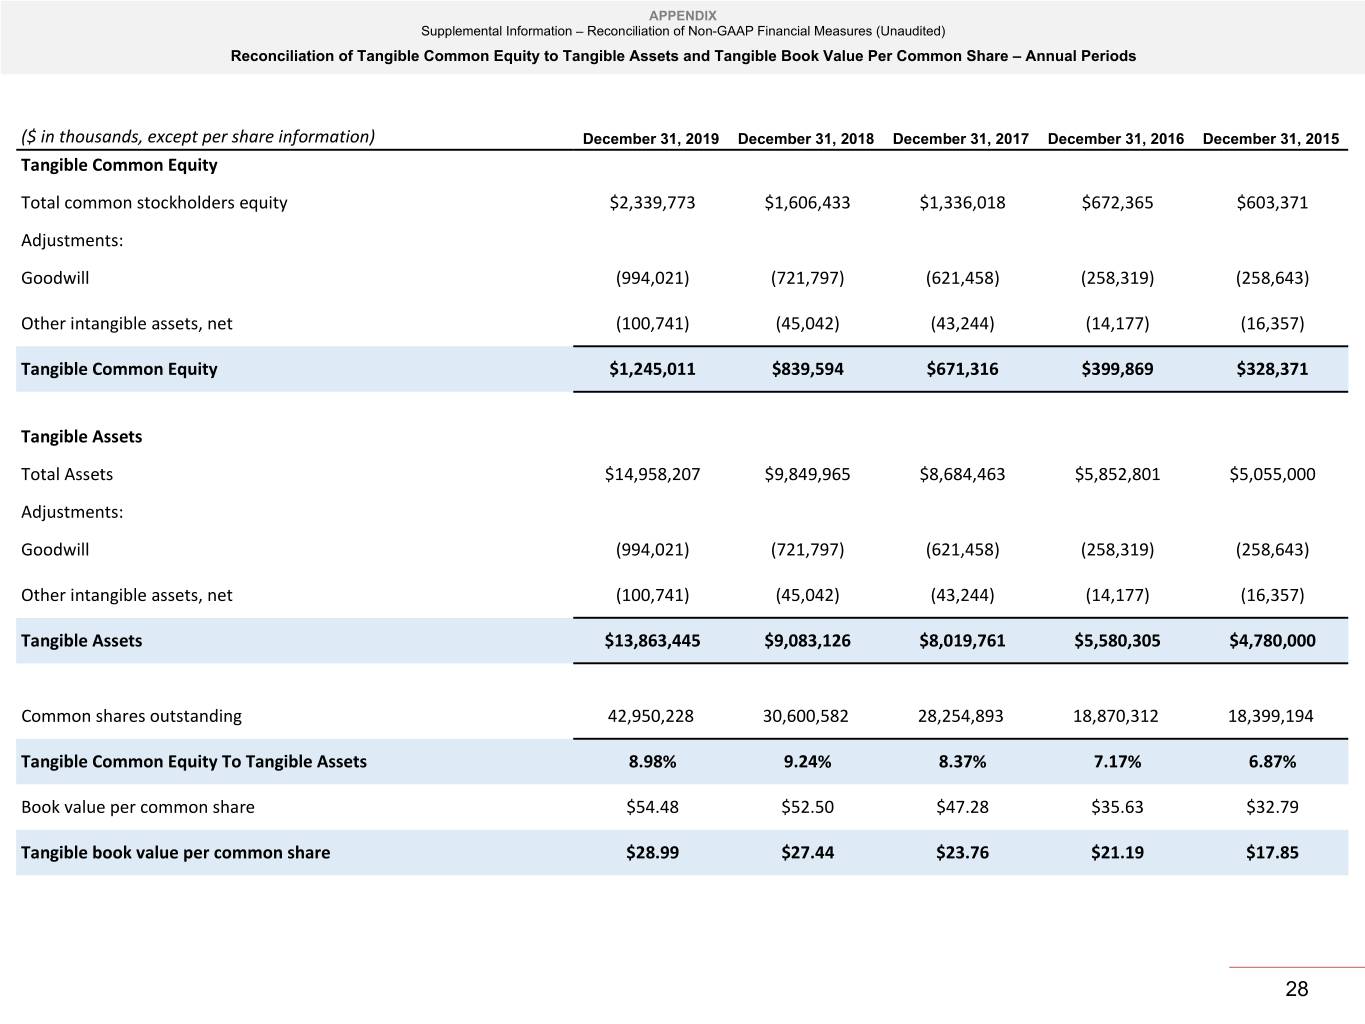
APPENDIX Supplemental Information – Reconciliation of Non-GAAP Financial Measures (Unaudited) Reconciliation of Tangible Common Equity to Tangible Assets and Tangible Book Value Per Common Share – Annual Periods ($ in thousands, except per share information) December 31, 2019 December 31, 2018 December 31, 2017 December 31, 2016 December 31, 2015 Tangible Common Equity Total common stockholders equity $2,339,773 $1,606,433 $1,336,018 $672,365 $603,371 Adjustments: Goodwill (994,021) (721,797) (621,458) (258,319) (258,643) Other intangible assets, net (100,741) (45,042) (43,244) (14,177) (16,357) Tangible Common Equity $1,245,011 $839,594 $671,316 $399,869 $328,371 Tangible Assets Total Assets $14,958,207 $9,849,965 $8,684,463 $5,852,801 $5,055,000 Adjustments: Goodwill (994,021) (721,797) (621,458) (258,319) (258,643) Other intangible assets, net (100,741) (45,042) (43,244) (14,177) (16,357) Tangible Assets $13,863,445 $9,083,126 $8,019,761 $5,580,305 $4,780,000 Common shares outstanding 42,950,228 30,600,582 28,254,893 18,870,312 18,399,194 Tangible Common Equity To Tangible Assets 8.98% 9.24% 8.37% 7.17% 6.87% Book value per common share $54.48 $52.50 $47.28 $35.63 $32.79 Tangible book value per common share $28.99 $27.44 $23.76 $21.19 $17.85 28
