Attached files
| file | filename |
|---|---|
| EX-99.3 - EX-99.3 - ECOLAB INC. | ecl-20201027xex99d3.htm |
| EX-99.1 - EX-99.1 - ECOLAB INC. | ecl-20201027xex99d1.htm |
| 8-K - 8-K - ECOLAB INC. | ecl-20201027x8k.htm |
Exhibit 99.2
| Please see Ecolab’s news release dated October 27, 2020 for additional information, including discussion on the use of certain non-GAAP financial measures. Third Quarter 2020 Teleconference Supplemental Data |
| Please see Ecolab’s news release dated October 27, 2020 for additional information, including discussion on the use of certain non-GAAP financial measures. . Cautionary Statement 2 Forward-Looking Information This communication contains forward looking statements as that term is defined in the Private Securities Litigation Reform Act of 1995. These forward-looking statements include, but are not limited to, statements regarding our financial and business performance and prospects, including the impact of the coronavirus outbreak on our sales, operating results and cash flows, growth opportunities, investments in technologies, and forecasted financial and business results, including sales and earnings per share. These statements are based on the current expectations of management. There are a number of risks and uncertainties that could cause actual results to differ materially from the forward-looking statements. In particular, with respect to the coronavirus, numerous factors will determine the extent of the impact on our business, including the extent to which the COVID-19 pandemic continues to spread; actions by various governments to address the COVID-19 pandemic; scientific advances to combat COVID-19; the time it takes for our key end markets to recover; the financial health of our customers and channel partners; potential supply chain disruptions; and the health and welfare of our employees. Additional risks and uncertainties are set forth under Item 1A in Exhibit 99.1 of our Form 8-K filed with the SEC on September 25, 2020, and our other public filings with the SEC and include the effects and duration of the coronavirus (COVID-19) pandemic; the vitality of the markets we serve; the impact of economic factors such as the worldwide economy; our ability to execute key business initiatives; potential information technology infrastructure failures or breaches in data security; our ability to attract, retain and develop high caliber management talent to lead our business; our ability to innovate and to commercialize digital solutions; exposure to global economic, political and legal risks; difficulty in procuring raw materials or fluctuations in raw material costs; and other uncertainties or risks reported from time to time in our reports to the SEC. In light of these risks, uncertainties and factors, the forward-looking events discussed in this communication may not occur. We caution that undue reliance should not be placed on forward-looking statements, which speak only as of the date made. Ecolab does not undertake, and expressly disclaims, any duty to update any forward-looking statement, except as required by law. Non-GAAP Financial Information This communication includes Company information that does not conform to generally accepted accounting principles (GAAP). Management believes that a presentation of this information is meaningful to investors because it provides insight with respect to ongoing operating results of the Company and allows investors to better evaluate the financial results of the Company. These measures should not be viewed as an alternative to GAAP measures of performance. Furthermore, these measures may not be consistent with similar measures provided by other companies. Reconciliations of our non-GAAP measures included within this presentation are included in the “Non-GAAP Financial Measures” section of this presentation. |
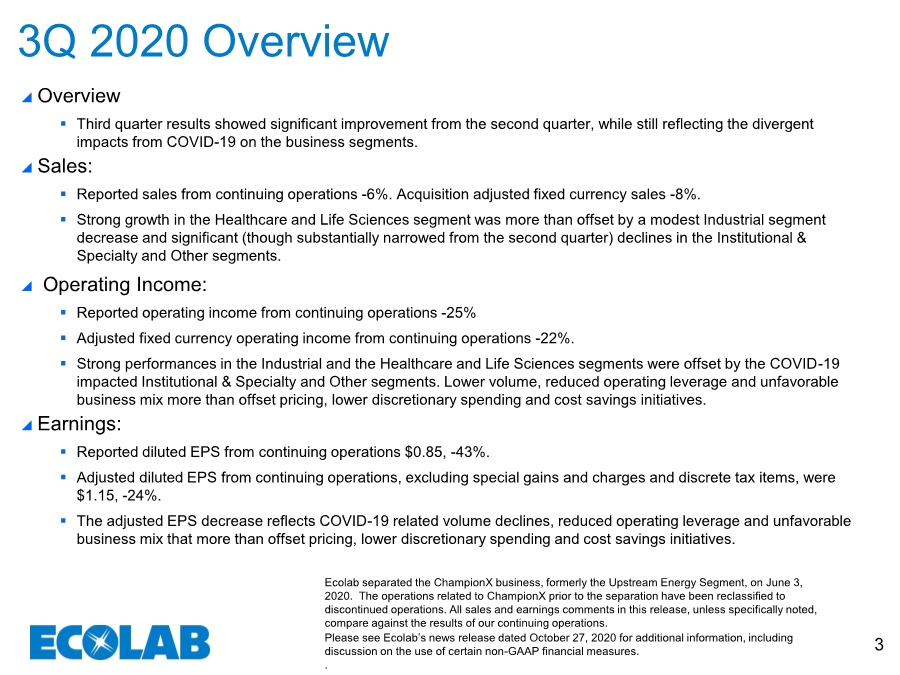
| Please see Ecolab’s news release dated October 27, 2020 for additional information, including discussion on the use of certain non-GAAP financial measures. . 3 Overview ▪ Third quarter results showed significant improvement from the second quarter, while still reflecting the divergent impacts from COVID-19 on the business segments. Sales: ▪ Reported sales from continuing operations -6%. Acquisition adjusted fixed currency sales -8%. ▪ Strong growth in the Healthcare and Life Sciences segment was more than offset by a modest Industrial segment decrease and significant (though substantially narrowed from the second quarter) declines in the Institutional & Specialty and Other segments. Operating Income: ▪ Reported operating income from continuing operations -25% ▪ Adjusted fixed currency operating income from continuing operations -22%. ▪ Strong performances in the Industrial and the Healthcare and Life Sciences segments were offset by the COVID-19 impacted Institutional & Specialty and Other segments. Lower volume, reduced operating leverage and unfavorable business mix more than offset pricing, lower discretionary spending and cost savings initiatives. Earnings: ▪ Reported diluted EPS from continuing operations $0.85, -43%. ▪ Adjusted diluted EPS from continuing operations, excluding special gains and charges and discrete tax items, were $1.15, -24%. ▪ The adjusted EPS decrease reflects COVID-19 related volume declines, reduced operating leverage and unfavorable business mix that more than offset pricing, lower discretionary spending and cost savings initiatives. 3Q 2020 Overview Ecolab separated the ChampionX business, formerly the Upstream Energy Segment, on June 3, 2020. The operations related to ChampionX prior to the separation have been reclassified to discontinued operations. All sales and earnings comments in this release, unless specifically noted, compare against the results of our continuing operations. |
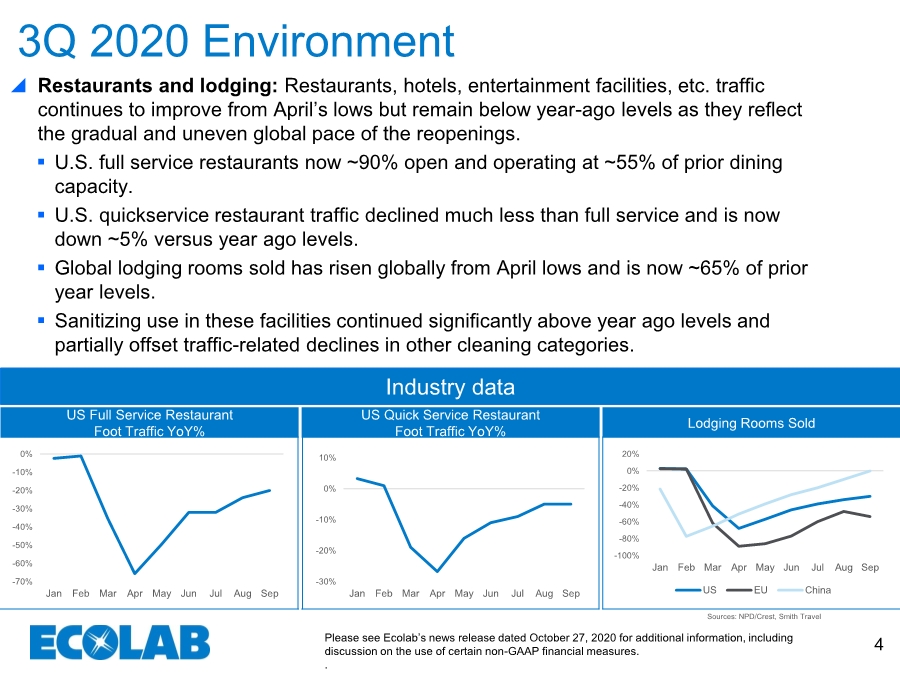
| Please see Ecolab’s news release dated October 27, 2020 for additional information, including discussion on the use of certain non-GAAP financial measures. . 4 Restaurants and lodging: Restaurants, hotels, entertainment facilities, etc. traffic continues to improve from April’s lows but remain below year-ago levels as they reflect the gradual and uneven global pace of the reopenings. ▪ U.S. full service restaurants now ~90% open and operating at ~55% of prior dining capacity. ▪ U.S. quickservice restaurant traffic declined much less than full service and is now down ~5% versus year ago levels. ▪ Global lodging rooms sold has risen globally from April lows and is now ~65% of prior year levels. ▪ Sanitizing use in these facilities continued significantly above year ago levels and partially offset traffic-related declines in other cleaning categories. 3Q 2020 Environment Sources: NPD/Crest, Smith Travel US Full Service Restaurant Foot Traffic YoY% Industry data US Quick Service Restaurant Foot Traffic YoY% Lodging Rooms Sold -30% -20% -10% 0% 10% Jan Feb Mar Apr May Jun Jul Aug Sep -100% -80% -60% -40% -20% 0% 20% Jan Feb Mar Apr May Jun Jul Aug Sep US EU China -70% -60% -50% -40% -30% -20% -10% 0% Jan Feb Mar Apr May Jun Jul Aug Sep |
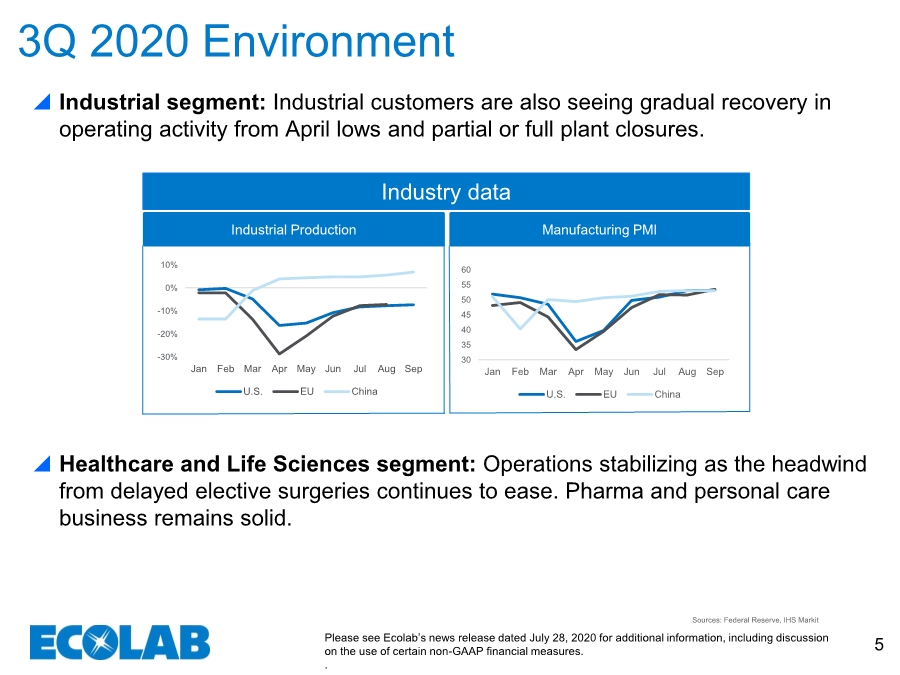
| Please see Ecolab’s news release dated July 28, 2020 for additional information, including discussion on the use of certain non-GAAP financial measures. . 5 3Q 2020 Environment Sources: Federal Reserve, IHS Markit Industrial segment: Industrial customers are also seeing gradual recovery in operating activity from April lows and partial or full plant closures. Healthcare and Life Sciences segment: Operations stabilizing as the headwind from delayed elective surgeries continues to ease. Pharma and personal care business remains solid. Industrial Production Industry data Manufacturing PMI 30 35 40 45 50 55 60 Jan Feb Mar Apr May Jun Jul Aug Sep U.S. EU China -30% -20% -10% 0% 10% Jan Feb Mar Apr May Jun Jul Aug Sep U.S. EU China |
| Please see Ecolab’s news release dated October 27 2020 for additional information, including discussion on the use of certain non-GAAP financial measures. . 6 4Q 2020 Comment We expect continued improvement in the fourth quarter, though likely at a slower rate as the second COVID-19 wave impacts reopenings, with our improvement driven by our product and service innovation, investments in new hygiene and digital technologies, and successful sales initiatives. Further, we expect these actions, and our ability to leverage them, have only improved and position us well for post-COVID success. |
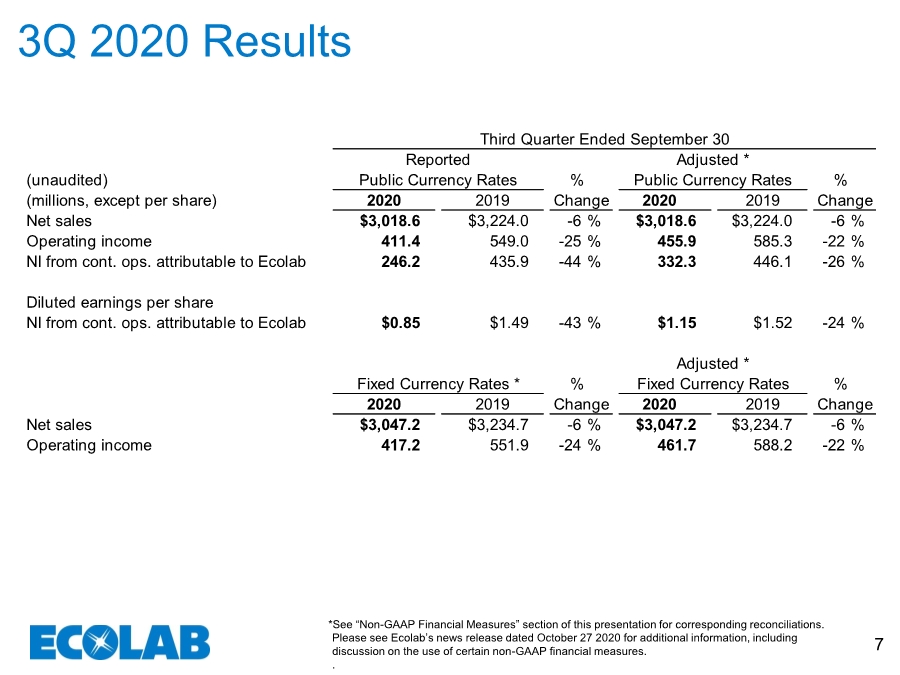
| Please see Ecolab’s news release dated October 27 2020 for additional information, including discussion on the use of certain non-GAAP financial measures. . 7 3Q 2020 Results *See “Non-GAAP Financial Measures” section of this presentation for corresponding reconciliations. (unaudited) (millions, except per share) 2020 Net sales $3,018.6 $3,224.0 -6 % $3,018.6 $3,224.0 -6 % Operating income 411.4 549.0 -25 % 455.9 585.3 -22 % NI from cont. ops. attributable to Ecolab 246.2 435.9 -44 % 332.3 446.1 -26 % Diluted earnings per share NI from cont. ops. attributable to Ecolab $0.85 $1.49 -43 % $1.15 $1.52 -24 % 2020 Net sales $3,047.2 $3,234.7 -6 % $3,047.2 $3,234.7 -6 % Operating income 417.2 551.9 -24 % 461.7 588.2 -22 % Adjusted * Third Quarter Ended September 30 Reported Adjusted * Public Currency Rates % Public Currency Rates % 2020 2019 Change 2019 Change Fixed Currency Rates * % Fixed Currency Rates % 2020 2019 Change 2019 Change |
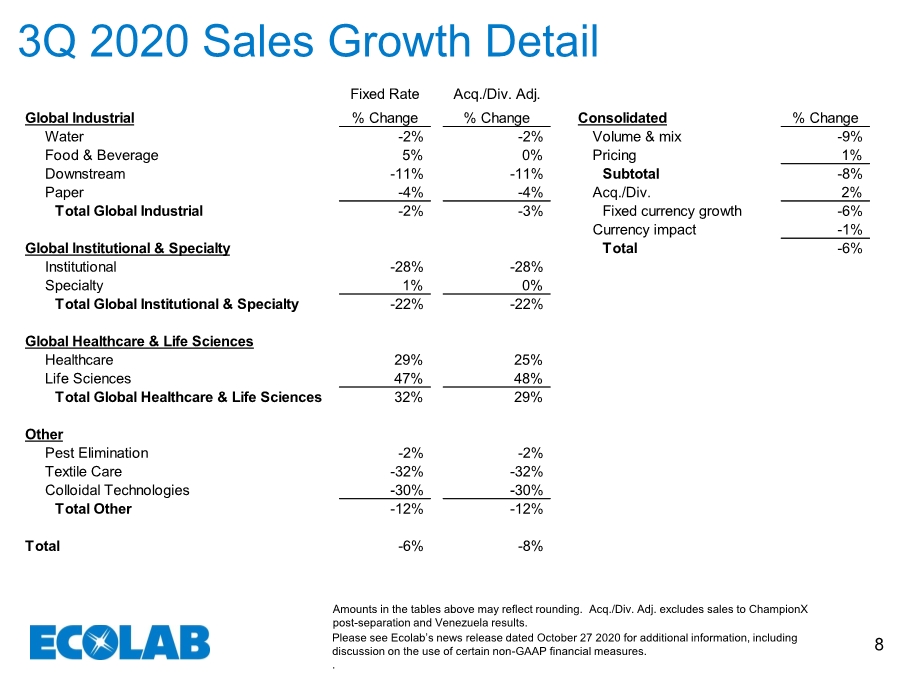
| Please see Ecolab’s news release dated October 27 2020 for additional information, including discussion on the use of certain non-GAAP financial measures. . 8 3Q 2020 Sales Growth Detail Amounts in the tables above may reflect rounding. Acq./Div. Adj. excludes sales to ChampionX post-separation and Venezuela results. Fixed Rate Acq./Div. Adj. Global Industrial % Change % Change Consolidated % Change Water -2% -2% Volume & mix -9% Food & Beverage 5% 0% Pricing 1% Downstream -11% -11% Subtotal -8% Paper -4% -4% Acq./Div. 2% Total Global Industrial -2% -3% Fixed currency growth -6% Currency impact -1% Global Institutional & Specialty Total -6% Institutional -28% -28% Specialty 1% 0% Total Global Institutional & Specialty -22% -22% Global Healthcare & Life Sciences Healthcare 29% 25% Life Sciences 47% 48% Total Global Healthcare & Life Sciences 32% 29% Other Pest Elimination -2% -2% Textile Care -32% -32% Colloidal Technologies -30% -30% Total Other -12% -12% Total -6% -8% |
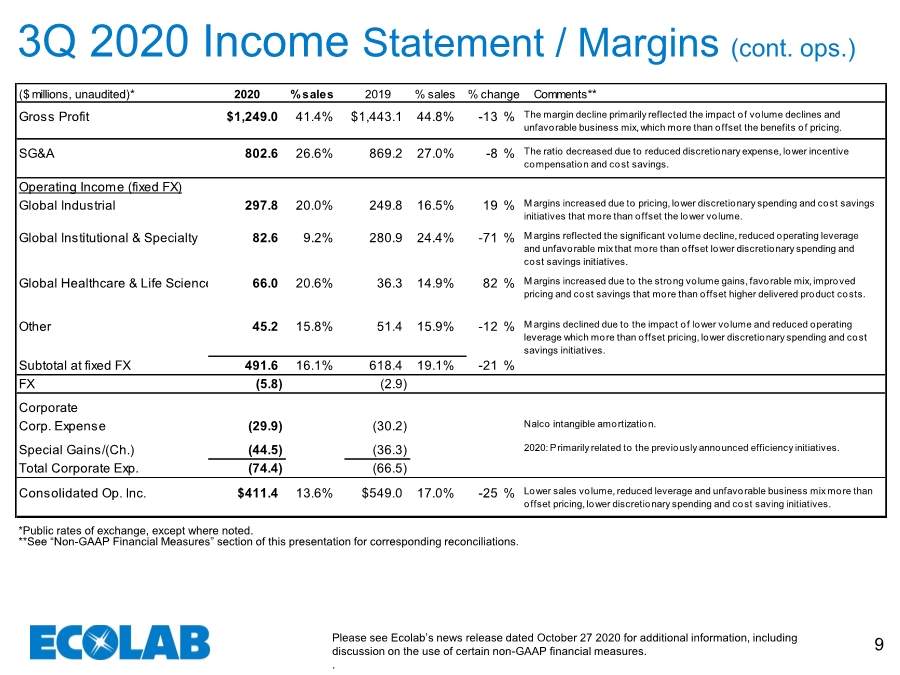
| Please see Ecolab’s news release dated October 27 2020 for additional information, including discussion on the use of certain non-GAAP financial measures. . 9 3Q 2020 Income Statement / Margins (cont. ops.) *Public rates of exchange, except where noted. **See “Non-GAAP Financial Measures” section of this presentation for corresponding reconciliations. ($ millions, unaudited)* 2020 % sales 2019 % sales Comments** Gross Profit $1,249.0 41.4% $1,443.1 44.8% -13 % The margin decline primarily reflected the impact of volume declines and unfavorable business mix, which more than offset the benefits of pricing. SG&A 802.6 26.6% 869.2 27.0% -8 % The ratio decreased due to reduced discretionary expense, lower incentive compensation and cost savings. Operating Income (fixed FX) Global Industrial 297.8 20.0% 249.8 16.5% 19 % M argins increased due to pricing, lower discretionary spending and cost savings initiatives that more than offset the lower volume. Global Institutional & Specialty 82.6 9.2% 280.9 24.4% -71 % M argins reflected the significant volume decline, reduced operating leverage and unfavorable mix that more than offset lower discretionary spending and cost savings initiatives. Global Healthcare & Life Sciences 66.0 20.6% 36.3 14.9% 82 % M argins increased due to the strong volume gains, favorable mix, improved pricing and cost savings that more than offset higher delivered product costs. Other 45.2 15.8% 51.4 15.9% -12 % M argins declined due to the impact of lower volume and reduced operating leverage which more than offset pricing, lower discretionary spending and cost savings initiatives. Subtotal at fixed FX 491.6 16.1% 618.4 19.1% -21 % FX (5.8) (2.9) Corporate Corp. Expense (29.9) (30.2) Nalco intangible amortization. Special Gains/(Ch.) (44.5) (36.3) 2020: Primarily related to the previously announced efficiency initiatives. Total Corporate Exp. (74.4) (66.5) Consolidated Op. Inc. $411.4 13.6% $549.0 17.0% -25 % Lower sales volume, reduced leverage and unfavorable business mix more than offset pricing, lower discretionary spending and cost saving initiatives. % change |
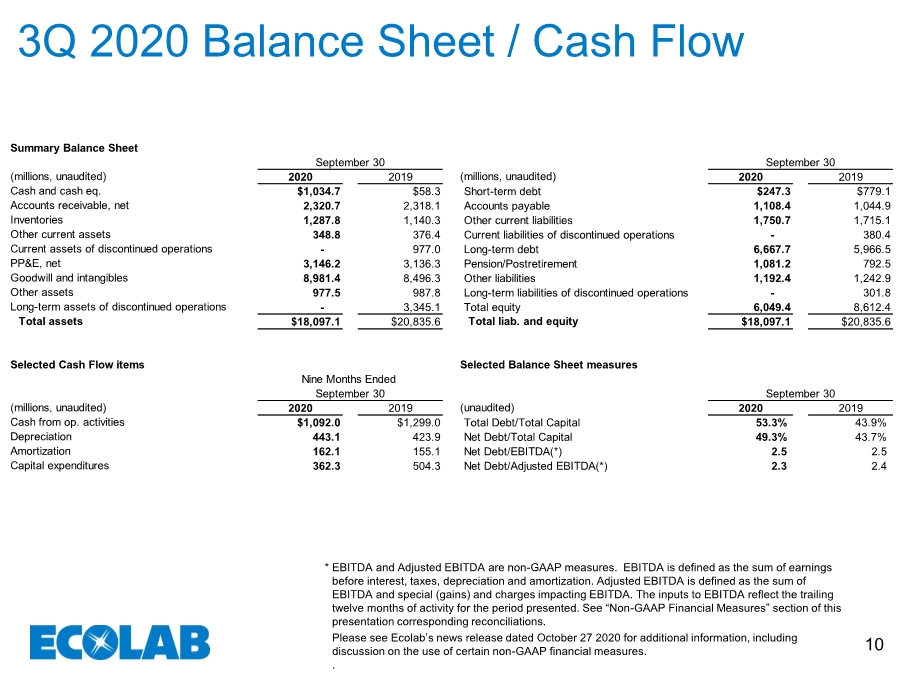
| Please see Ecolab’s news release dated October 27 2020 for additional information, including discussion on the use of certain non-GAAP financial measures. . 10 3Q 2020 Balance Sheet / Cash Flow EBITDA and Adjusted EBITDA are non-GAAP measures. EBITDA is defined as the sum of earnings before interest, taxes, depreciation and amortization. Adjusted EBITDA is defined as the sum of EBITDA and special (gains) and charges impacting EBITDA. The inputs to EBITDA reflect the trailing twelve months of activity for the period presented. See “Non-GAAP Financial Measures” section of this presentation corresponding reconciliations. * Summary Balance Sheet (millions, unaudited) 2020 2019 (millions, unaudited) 2020 2019 Cash and cash eq. $1,034.7 $58.3 Short-term debt $247.3 $779.1 Accounts receivable, net 2,320.7 2,318.1 Accounts payable 1,108.4 1,044.9 Inventories 1,287.8 1,140.3 Other current liabilities 1,750.7 1,715.1 Other current assets 348.8 376.4 Current liabilities of discontinued operations - 380.4 Current assets of discontinued operations - 977.0 Long-term debt 6,667.7 5,966.5 PP&E, net 3,146.2 3,136.3 Pension/Postretirement 1,081.2 792.5 Goodwill and intangibles 8,981.4 8,496.3 Other liabilities 1,192.4 1,242.9 Other assets 977.5 987.8 Long-term liabilities of discontinued operations - 301.8 Long-term assets of discontinued operations - 3,345.1 Total equity 6,049.4 8,612.4 Total assets $18,097.1 $20,835.6 Total liab. and equity $18,097.1 $20,835.6 Selected Cash Flow items (millions, unaudited) 2020 2019 (unaudited) 2020 2019 Cash from op. activities $1,092.0 $1,299.0 Total Debt/Total Capital 53.3% 43.9% Depreciation 443.1 423.9 Net Debt/Total Capital 49.3% 43.7% Amortization 162.1 155.1 Net Debt/EBITDA(*) 2.5 2.5 Capital expenditures 362.3 504.3 Net Debt/Adjusted EBITDA(*) 2.3 2.4 September 30 September 30 Nine Months Ended Selected Balance Sheet measures September 30 September 30 |
| Please see Ecolab’s news release dated October 27 2020 for additional information, including discussion on the use of certain non-GAAP financial measures. . 11 Appendix |
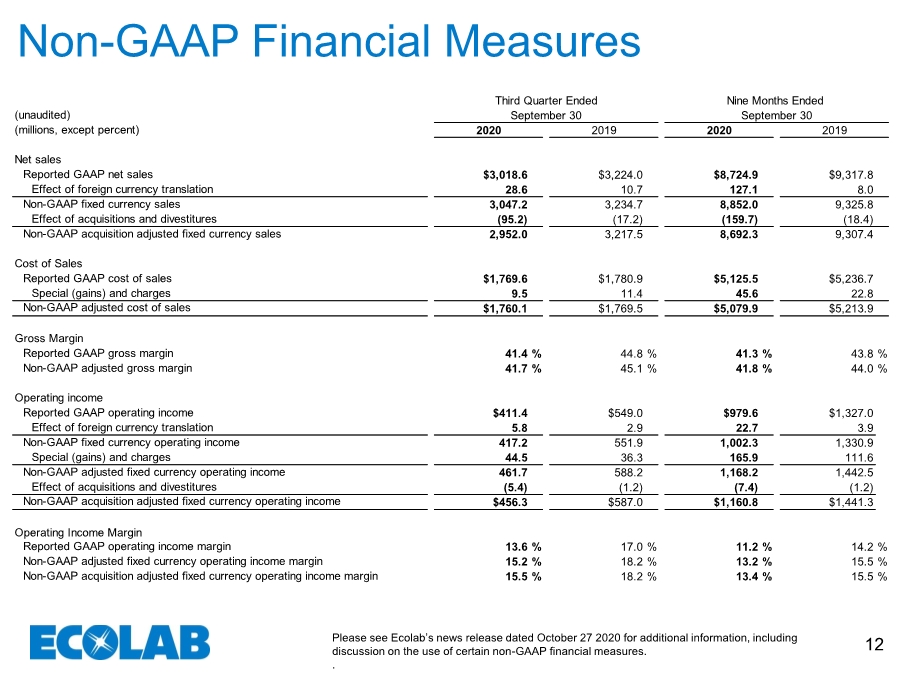
| Please see Ecolab’s news release dated October 27 2020 for additional information, including discussion on the use of certain non-GAAP financial measures. . 12 Non-GAAP Financial Measures (unaudited) (millions, except percent) Net sales Reported GAAP net sales $3,018.6 $3,224.0 $8,724.9 $9,317.8 Effect of foreign currency translation 28.6 10.7 127.1 8.0 Non-GAAP fixed currency sales 3,047.2 3,234.7 8,852.0 9,325.8 Effect of acquisitions and divestitures (95.2) (17.2) (159.7) (18.4) Non-GAAP acquisition adjusted fixed currency sales 2,952.0 3,217.5 8,692.3 9,307.4 Cost of Sales Reported GAAP cost of sales $1,769.6 $1,780.9 $5,125.5 $5,236.7 Special (gains) and charges 9.5 11.4 45.6 22.8 Non-GAAP adjusted cost of sales $1,760.1 $1,769.5 $5,079.9 $5,213.9 Gross Margin Reported GAAP gross margin 41.4 % 44.8 % 41.3 % 43.8 % Non-GAAP adjusted gross margin 41.7 % 45.1 % 41.8 % 44.0 % Operating income Reported GAAP operating income $411.4 $549.0 $979.6 $1,327.0 Effect of foreign currency translation 5.8 2.9 22.7 3.9 Non-GAAP fixed currency operating income 417.2 551.9 1,002.3 1,330.9 Special (gains) and charges 44.5 36.3 165.9 111.6 Non-GAAP adjusted fixed currency operating income 461.7 588.2 1,168.2 1,442.5 Effect of acquisitions and divestitures (5.4) (1.2) (7.4) (1.2) Non-GAAP acquisition adjusted fixed currency operating income $456.3 $587.0 $1,160.8 $1,441.3 Operating Income Margin Reported GAAP operating income margin 13.6 % 17.0 % 11.2 % 14.2 % Non-GAAP adjusted fixed currency operating income margin 15.2 % 18.2 % 13.2 % 15.5 % Non-GAAP acquisition adjusted fixed currency operating income margin 15.5 % 18.2 % 13.4 % 15.5 % Third Quarter Ended September 30 Nine Months Ended September 30 2020 2019 2020 2019 |
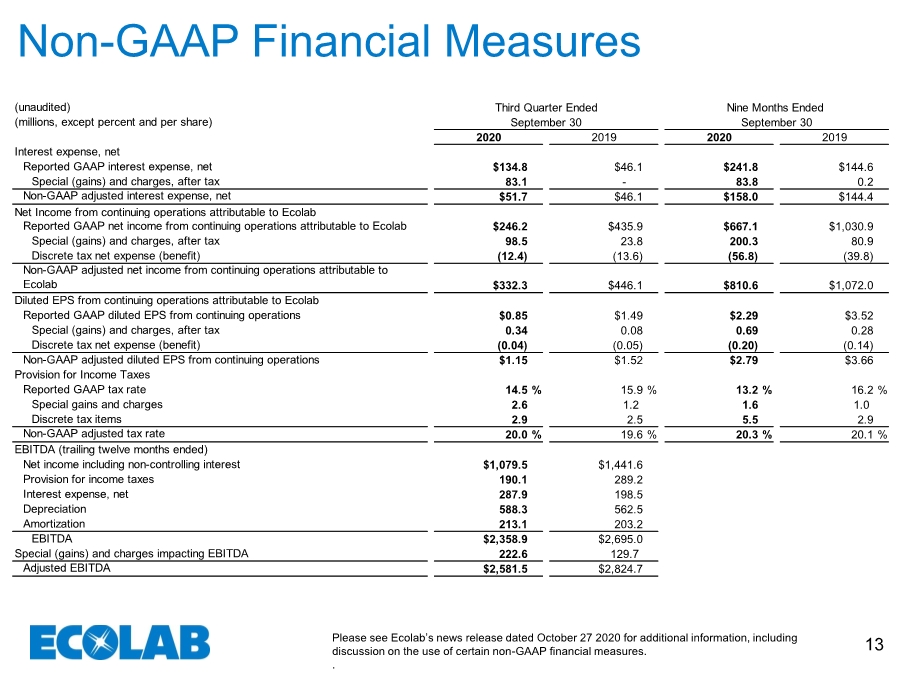
| Please see Ecolab’s news release dated October 27 2020 for additional information, including discussion on the use of certain non-GAAP financial measures. . 13 Non-GAAP Financial Measures (unaudited) (millions, except percent and per share) Interest expense, net Reported GAAP interest expense, net $134.8 $46.1 $241.8 $144.6 Special (gains) and charges, after tax 83.1 - 83.8 0.2 Non-GAAP adjusted interest expense, net $51.7 $46.1 $158.0 $144.4 Net Income from continuing operations attributable to Ecolab Reported GAAP net income from continuing operations attributable to Ecolab $246.2 $435.9 $667.1 $1,030.9 Special (gains) and charges, after tax 98.5 23.8 200.3 80.9 Discrete tax net expense (benefit) (12.4) (13.6) (56.8) (39.8) Non-GAAP adjusted net income from continuing operations attributable to Ecolab $332.3 $446.1 $810.6 $1,072.0 Diluted EPS from continuing operations attributable to Ecolab Reported GAAP diluted EPS from continuing operations $0.85 $1.49 $2.29 $3.52 Special (gains) and charges, after tax 0.34 0.08 0.69 0.28 Discrete tax net expense (benefit) (0.04) (0.05) (0.20) (0.14) Non-GAAP adjusted diluted EPS from continuing operations $1.15 $1.52 $2.79 $3.66 Provision for Income Taxes Reported GAAP tax rate 14.5 % 15.9 % 13.2 % 16.2 % Special gains and charges 2.6 1.2 1.6 1.0 Discrete tax items 2.9 2.5 5.5 2.9 Non-GAAP adjusted tax rate 20.0 % 19.6 % 20.3 % 20.1 % EBITDA (trailing twelve months ended) Net income including non-controlling interest $1,079.5 $1,441.6 Provision for income taxes 190.1 289.2 Interest expense, net 287.9 198.5 Depreciation 588.3 562.5 Amortization 213.1 203.2 EBITDA $2,358.9 $2,695.0 Special (gains) and charges impacting EBITDA 222.6 129.7 Adjusted EBITDA $2,581.5 $2,824.7 2020 2019 2020 2019 September 30 September 30 Third Quarter Ended Nine Months Ended |
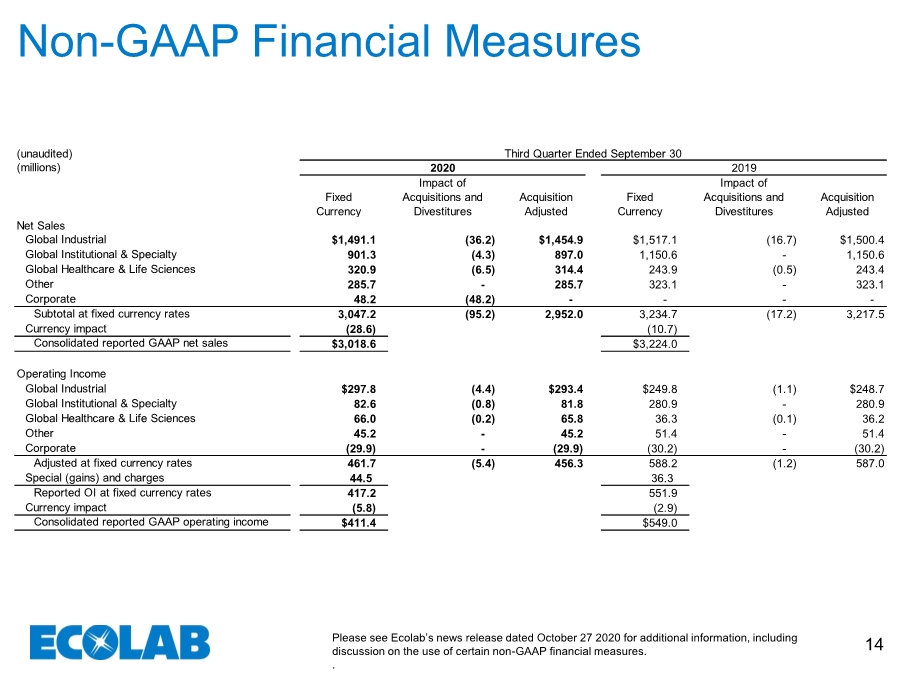
| Please see Ecolab’s news release dated October 27 2020 for additional information, including discussion on the use of certain non-GAAP financial measures. . 14 Non-GAAP Financial Measures (unaudited) (millions) Fixed Currency Impact of Acquisitions and Divestitures Acquisition Adjusted Fixed Currency Impact of Acquisitions and Divestitures Acquisition Adjusted Net Sales Global Industrial $1,491.1 (36.2) $1,454.9 $1,517.1 (16.7) $1,500.4 Global Institutional & Specialty 901.3 (4.3) 897.0 1,150.6 - 1,150.6 Global Healthcare & Life Sciences 320.9 (6.5) 314.4 243.9 (0.5) 243.4 Other 285.7 - 285.7 323.1 - 323.1 Corporate 48.2 (48.2) - - - - Subtotal at fixed currency rates 3,047.2 (95.2) 2,952.0 3,234.7 (17.2) 3,217.5 Currency impact (28.6) (10.7) Consolidated reported GAAP net sales $3,018.6 $3,224.0 Operating Income Global Industrial $297.8 (4.4) $293.4 $249.8 (1.1) $248.7 Global Institutional & Specialty 82.6 (0.8) 81.8 280.9 - 280.9 Global Healthcare & Life Sciences 66.0 (0.2) 65.8 36.3 (0.1) 36.2 Other 45.2 - 45.2 51.4 - 51.4 Corporate (29.9) - (29.9) (30.2) - (30.2) Adjusted at fixed currency rates 461.7 (5.4) 456.3 588.2 (1.2) 587.0 Special (gains) and charges 44.5 36.3 Reported OI at fixed currency rates 417.2 551.9 Currency impact (5.8) (2.9) Consolidated reported GAAP operating income $411.4 $549.0 Third Quarter Ended September 30 2020 2019 |
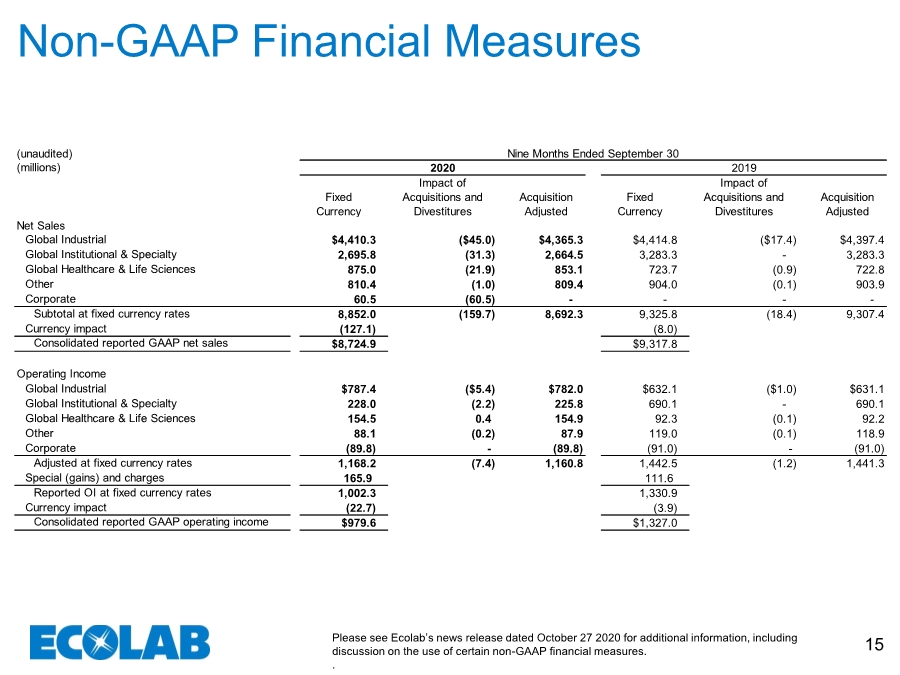
| Please see Ecolab’s news release dated October 27 2020 for additional information, including discussion on the use of certain non-GAAP financial measures. . 15 Non-GAAP Financial Measures (unaudited) (millions) Fixed Currency Impact of Acquisitions and Divestitures Acquisition Adjusted Fixed Currency Impact of Acquisitions and Divestitures Acquisition Adjusted Net Sales Global Industrial $4,410.3 ($45.0) $4,365.3 $4,414.8 ($17.4) $4,397.4 Global Institutional & Specialty 2,695.8 (31.3) 2,664.5 3,283.3 - 3,283.3 Global Healthcare & Life Sciences 875.0 (21.9) 853.1 723.7 (0.9) 722.8 Other 810.4 (1.0) 809.4 904.0 (0.1) 903.9 Corporate 60.5 (60.5) - - - - Subtotal at fixed currency rates 8,852.0 (159.7) 8,692.3 9,325.8 (18.4) 9,307.4 Currency impact (127.1) (8.0) Consolidated reported GAAP net sales $8,724.9 $9,317.8 Operating Income Global Industrial $787.4 ($5.4) $782.0 $632.1 ($1.0) $631.1 Global Institutional & Specialty 228.0 (2.2) 225.8 690.1 - 690.1 Global Healthcare & Life Sciences 154.5 0.4 154.9 92.3 (0.1) 92.2 Other 88.1 (0.2) 87.9 119.0 (0.1) 118.9 Corporate (89.8) - (89.8) (91.0) - (91.0) Adjusted at fixed currency rates 1,168.2 (7.4) 1,160.8 1,442.5 (1.2) 1,441.3 Special (gains) and charges 165.9 111.6 Reported OI at fixed currency rates 1,002.3 1,330.9 Currency impact (22.7) (3.9) Consolidated reported GAAP operating income $979.6 $1,327.0 Nine Months Ended September 30 2020 2019 |