Attached files
| file | filename |
|---|---|
| 8-K - 8-K - CubeSmart | cube-20201021x8k.htm |
| EX-99.1 - EX-99.1 - CubeSmart | cube-20201021ex9918226b6.htm |
Exhibit 99.2
| / / Cu Storage Deluxe Portfolio Acquisition October 2020 |
| Safe Harbor Statement The forward-lookingstatements contained in this presentation are subject to various risks and known and unknown uncertainties. Although the Company believes the expectations reflected in such forward-looking statements are based on reasonable assumptions, there can be no assurance that the Company's expectations will be achieved. Factors which could cause the Company's actual results, performance, or achievements to differ significantly from the results, performance, or achievements expressed or implied by such statements are set forth under the captions "Item 1A. Risk Factors" and "Forward-Looking Statements" in our annual report on Form 10-K and in our quarterly reports on Form 10-Q and described from time to time in the Company's filings with the SEC. Forward-looking statements are not guarantees of performance. For forward-looking statements herein, the Company claims the protection of the safe harbor for forward-looking statements contained in the Private Securities Litigation Reform Act of 1995. The Company assumes no obligation to update or supplement forward-looking statements that become untrue because of subsequent events. 2 I Storage Deluxe Portfolio Acquisition |
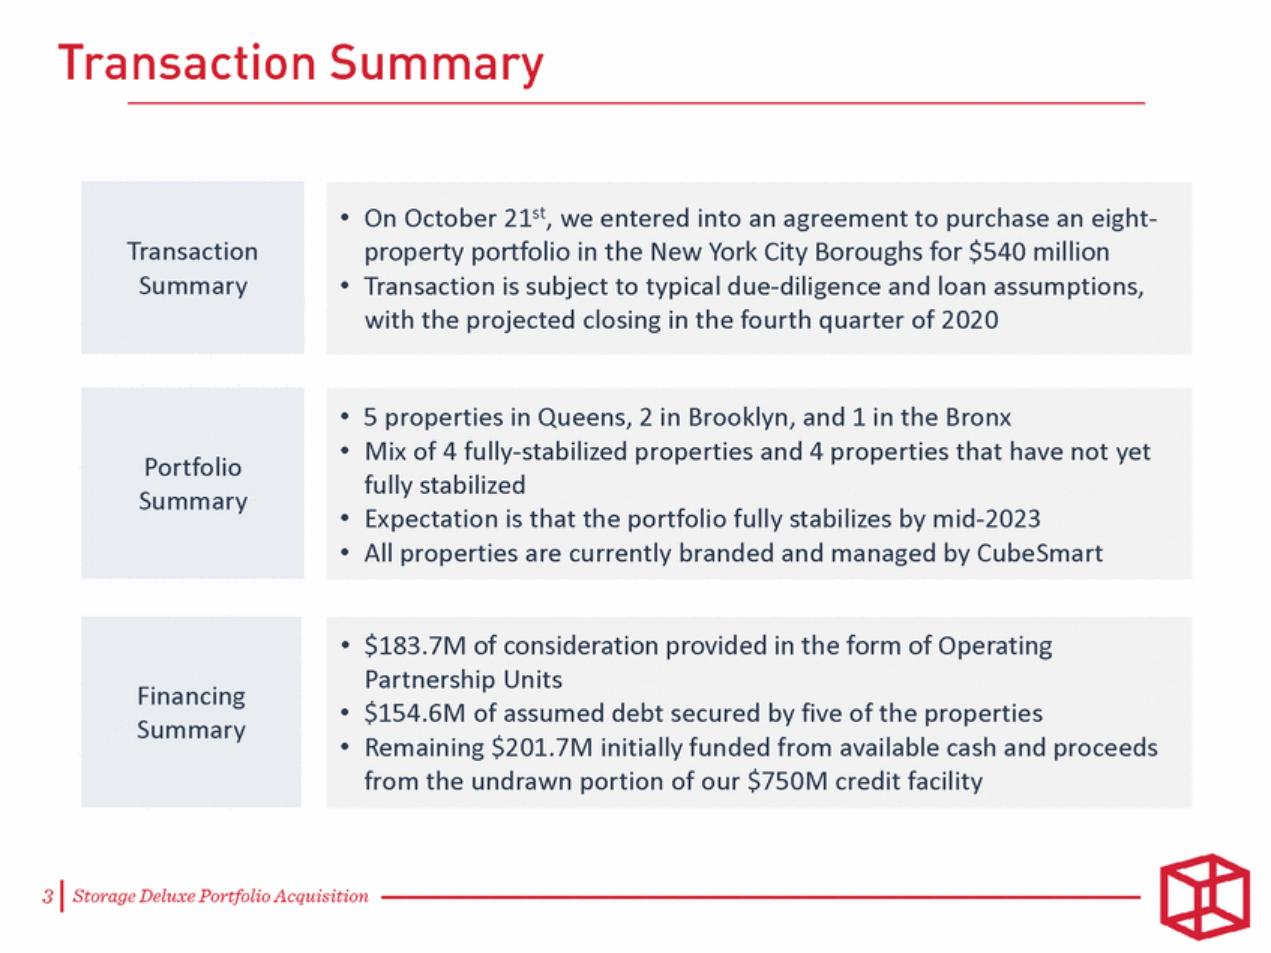
| Transaction Summary On October 21st, we entered into an agreement to purchase an eight-property portfolio in the New York City Boroughs for $540 million Transaction is subject to typical due-diligence and loan assumptions, with the projected closing in the fourth quarter of 2020 Portfolio Summary 5 properties in Queens, 2 in Brooklyn, and 1 in the Bronx Mix of 4 fully-stabilized properties and 4 properties that have not yet fully stabilized Expectation is that the portfolio fully stabilizes by mid-2023 All properties are currently branded and managed by CubeSmart Financing Summary $183.7M of consideration provided in the form of Operating Partnership Units $154.6M of assumed debt secured by five of the properties Remaining $201.7M initially funded from available cash and proceeds from the undrawn portion of our $750M credit facility |
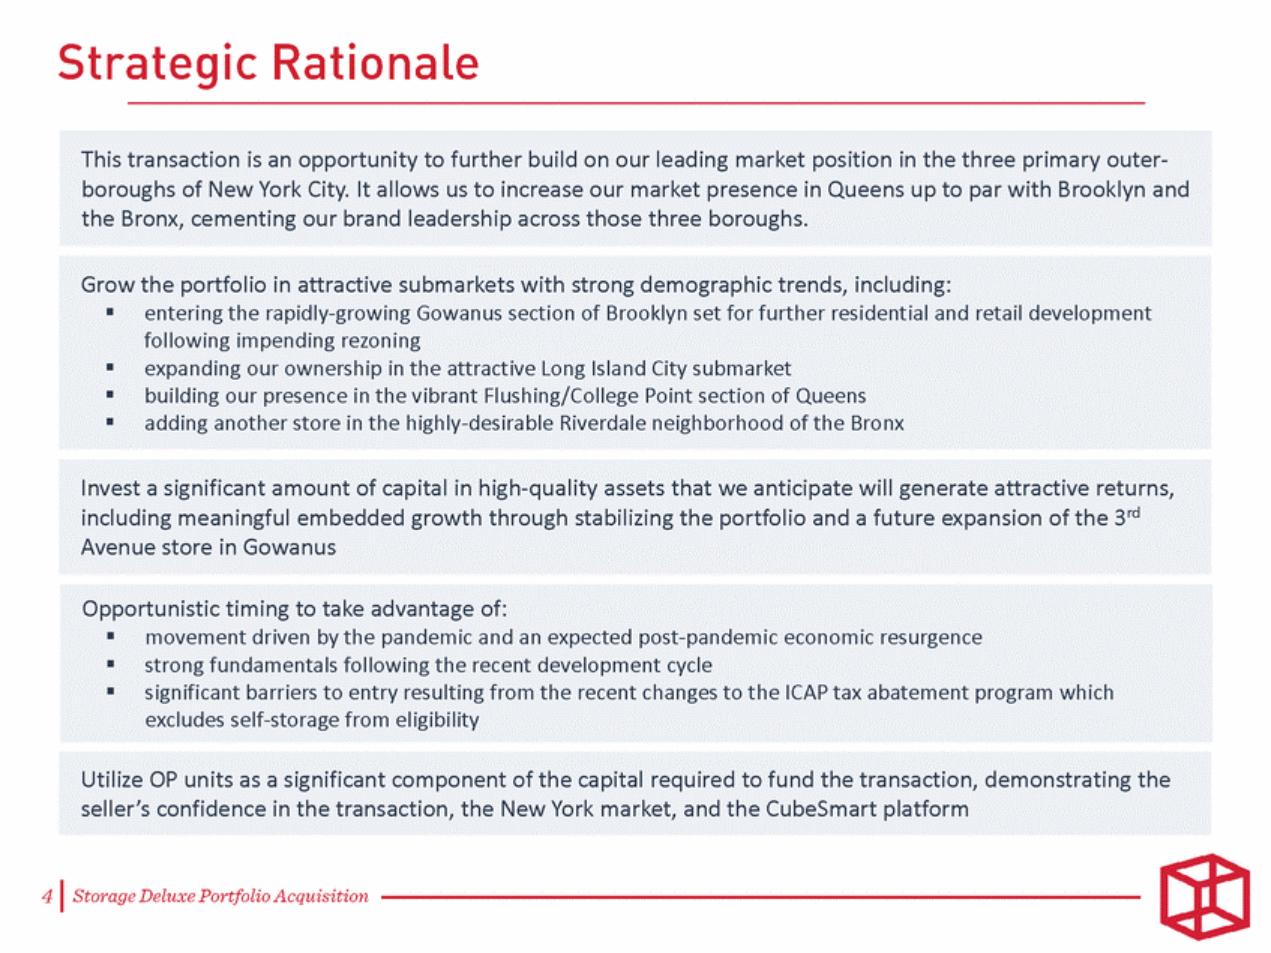
| [LOGO] This transaction is an opportunity to further build on our leading market position in the three primary outer boroughs of New York City. It allows us to increase our market presenc e in Queens up to par with Brooklyn and the Bronx, cementing our brand leadership across those three boroughs. Grow the portfolio in attractive submarkets with strong demographic trends, including:entering the rapidly growing Gowanus section of Brooklyn set for further residential and retail development following impending rezoningexpanding our ownership in the attractive Long Island City submarket building our presence in the vibrant Flushing/College Point section of Queens adding another store in the highly desirable Riverdale neighborhood of the Bronx Invest a significant amount of capital in high quality assets that we anticipate will generate attractive returns, including meaningful embedded growth through stabilizing the portfolio and a future expansion of the 3 rd Avenue store in Gowanus Opportunistic timing to take advantage of: movement driven by the pandemic and an expected post pandemic economic resurgence strong fundamentals following the recent development cycle significant barriers to entry resulting from the recent changes to the ICAP tax abatement program which excludes self storage from eligibility Utilize OP units as a significant component of the capital required to fund the transaction, demonstrating the seller’s confidence in the transaction, the New York market , and the CubeSmart platform |
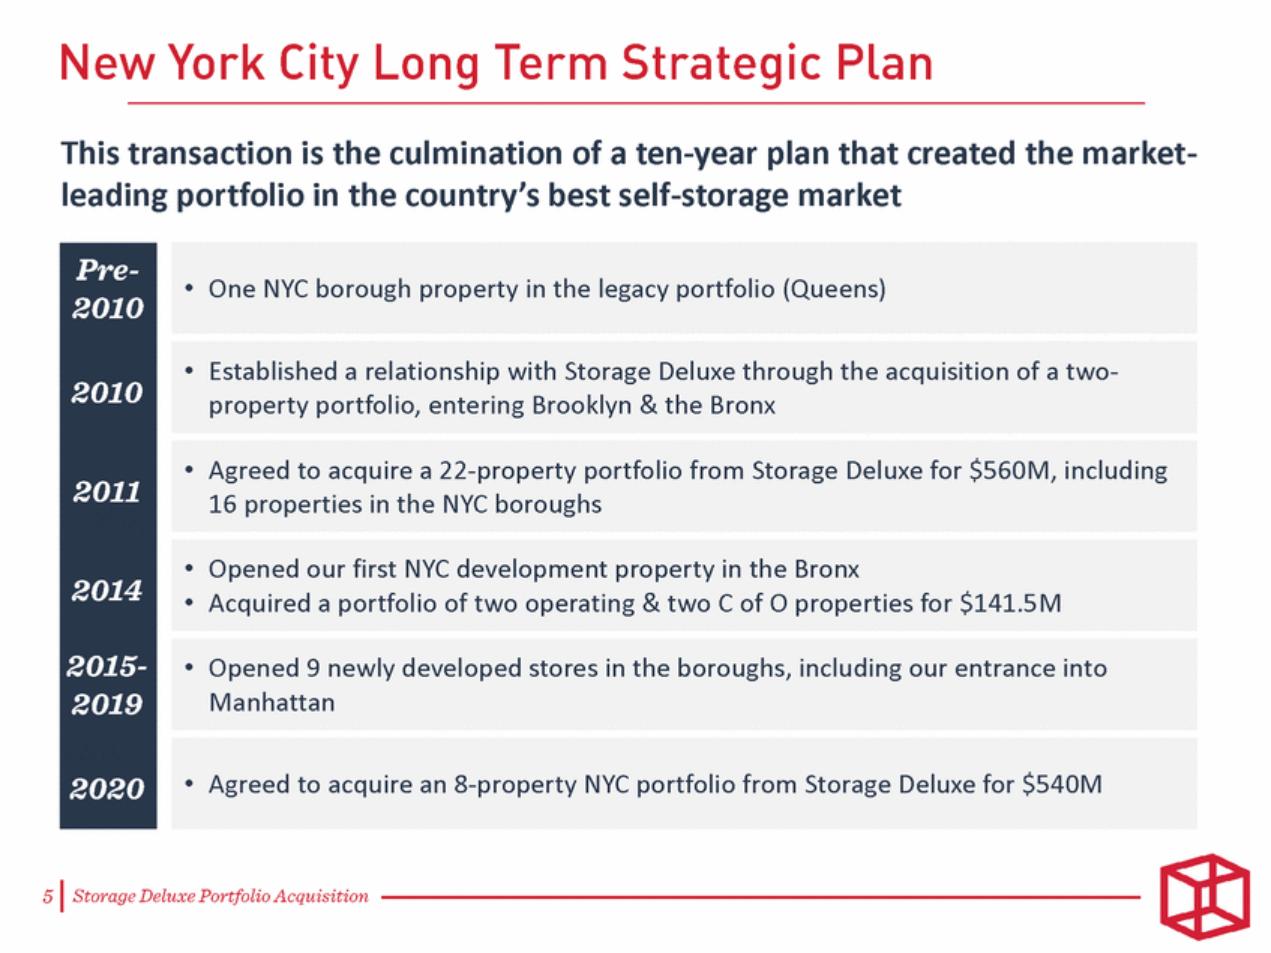
| This transaction is the culmination of a ten-year plan that created the market-leading portfolio in the country’s best self-storage market One NYC borough property in the legacy portfolio (Queens) Established a relationship with Storage Deluxe through the acquisition of a two-property portfolio, entering Brooklyn & the Bronx Agreed to acquire a 22-property portfolio from Storage Deluxe for $560M, including 16 properties in the NYC boroughs Opened our first NYC development property in the Bronx Acquired a portfolio of two operating & two C of O properties for $141.5M Opened 9 newly developed stores in the boroughs, including our entrance into Manhattan Agreed to acquire an 8-property NYC portfolio from Storage Deluxe for $540M |
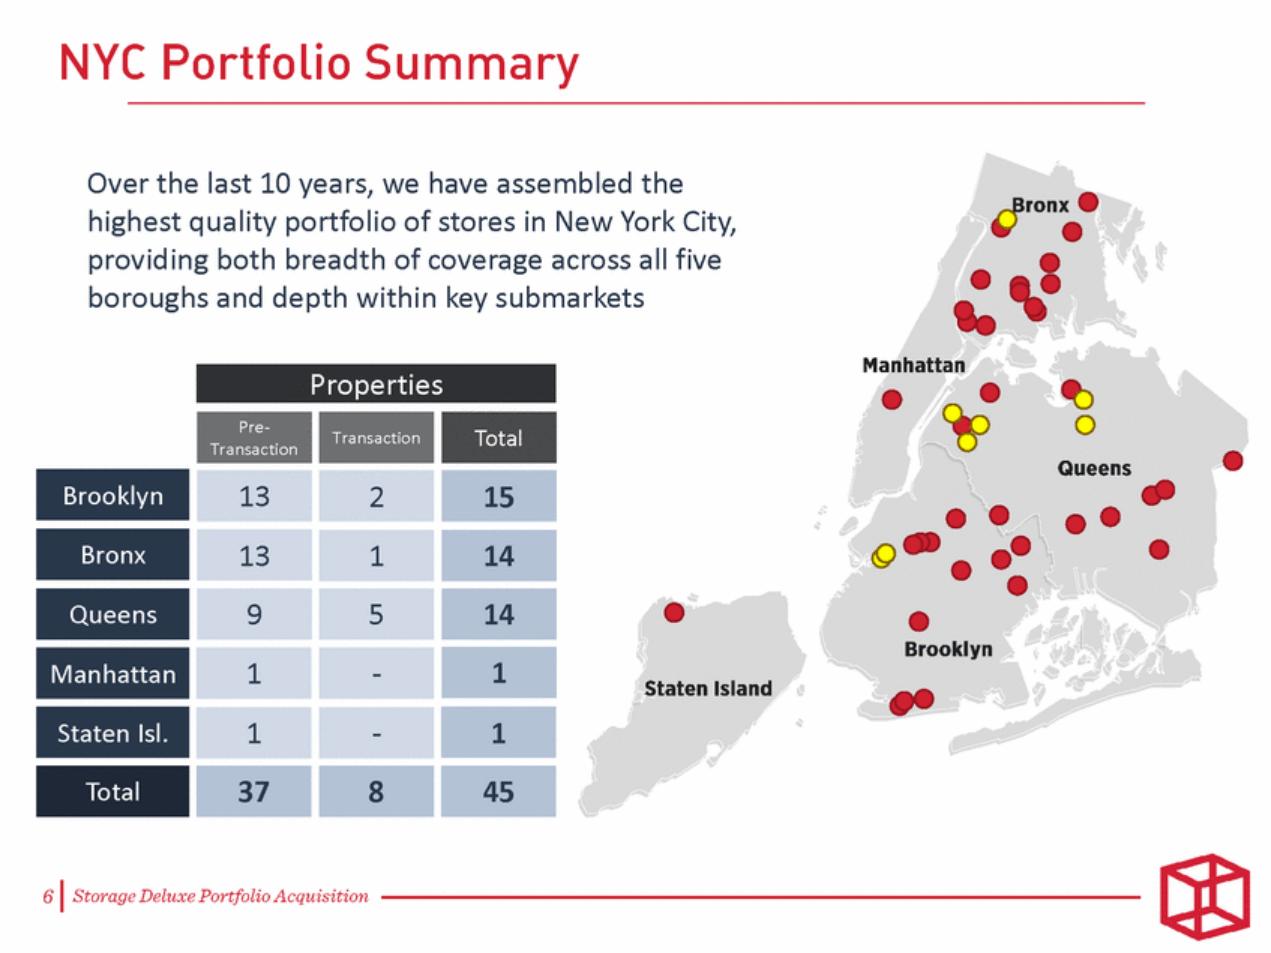
| Over the last 10 years, we have assembled the highest quality portfolio of stores in New York City, providing both breadth of coverage across all five boroughs and depth within key submarkets Properties Pre-Transaction Transaction Total Brooklyn 13 2 15 Bronx 13 1 14 Queens 9 5 14 Manhattan 1 - 1 Staten Isl. 1 - 1 Total 37 8 45 |
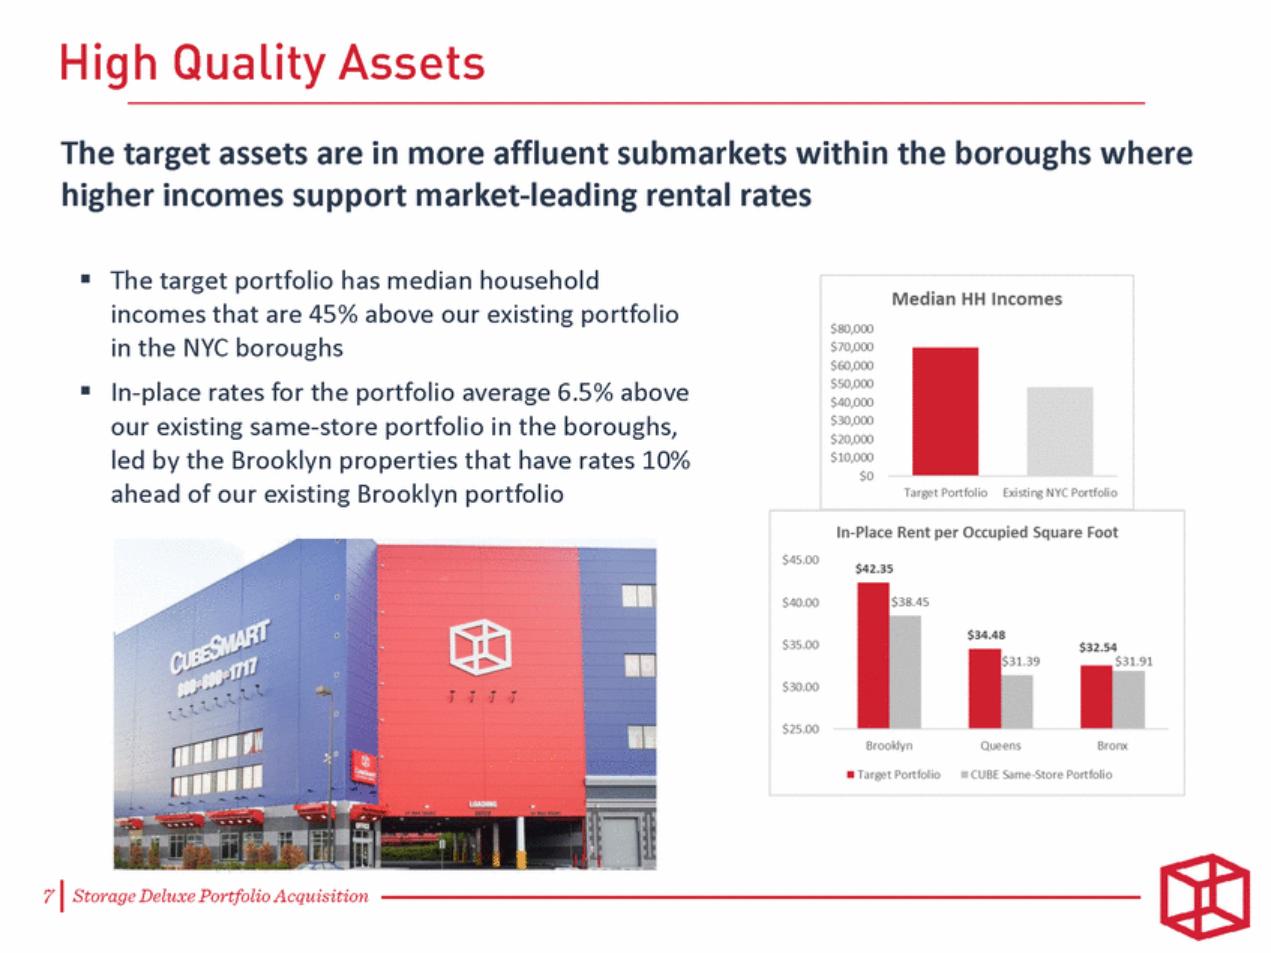
| The target assets are in more affluent submarkets within the boroughs where higher incomes support market-leading rental rates The target portfolio has median household incomes that are 45% above our existing portfolio in the NYC boroughs In-place rates for the portfolio average 6.5% above our existing same-store portfolio in the boroughs, led by the Brooklyn properties that have rates 10% ahead of our existing Brooklyn portfolio |
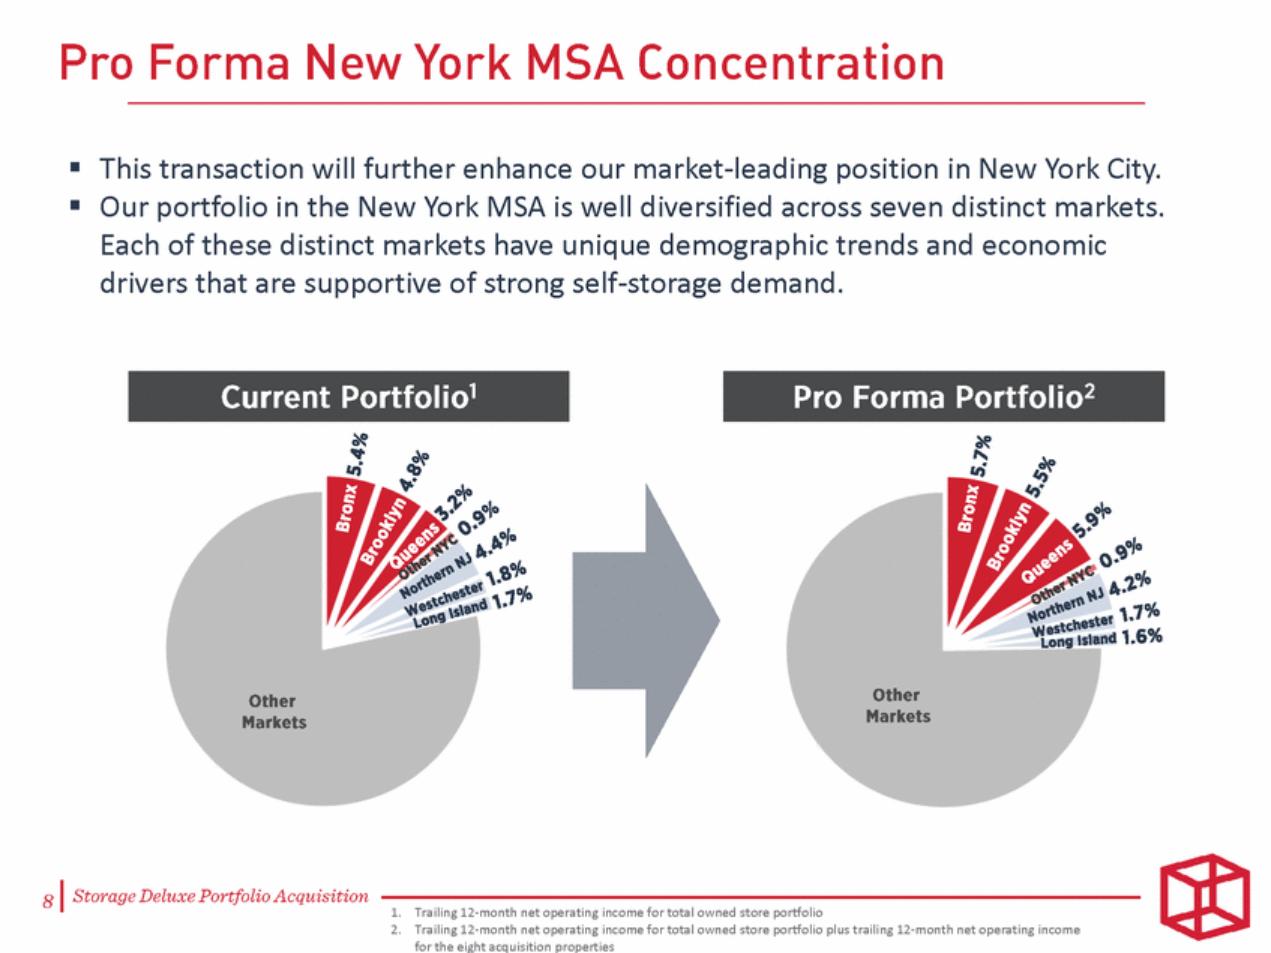
| This transaction will further enhance our market-leading position in New York City. Our portfolio in the New York MSA is well diversified across seven distinct markets. Each of these distinct markets have unique demographic trends and economic drivers that are supportive of strong self-storage demand. Trailing 12-month net operating income for total owned store portfolio Trailing 12-month net operating income for total owned store portfolio plus trailing 12-month net operating income for the eight acquisition properties |
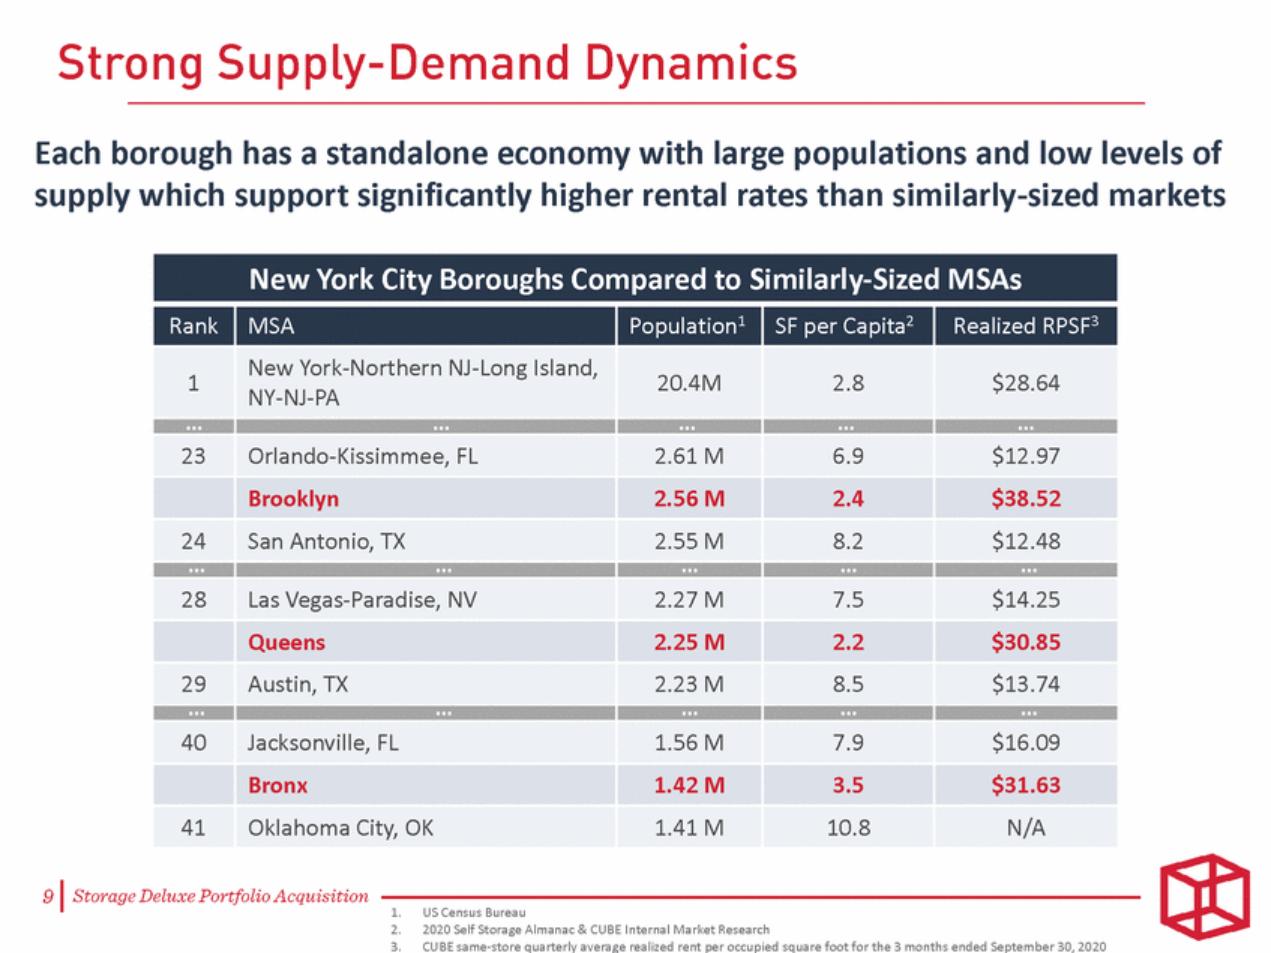
| Each borough has a standalone economy with large populations and low levels of supply which support significantly higher rental rates than similarly-sized markets US Census Bureau 2020 Self Storage Almanac & CUBE Internal Market Research CUBE same-store quarterly average realized rent per occupied square foot for the 3 months ended September 30, 2020 |
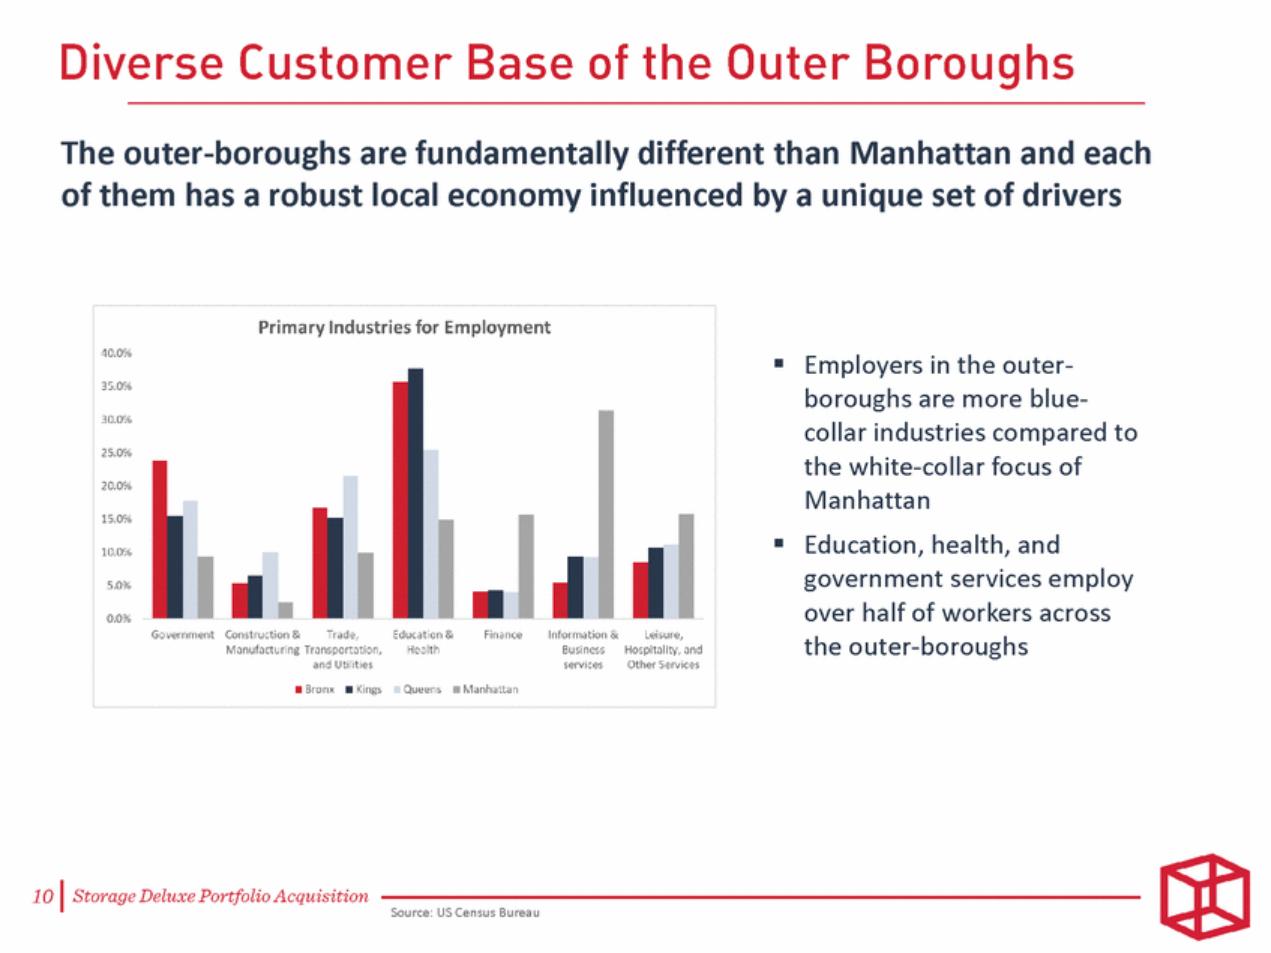
| The outer-boroughs are fundamentally different than Manhattan and each of them has a robust local economy influenced by a unique set of drivers Employers in the outer-boroughs are more blue-collar industries compared to the white-collar focus of Manhattan Education, health, and government services employ over half of workers across the outer-boroughs Source: US Census Bureau |
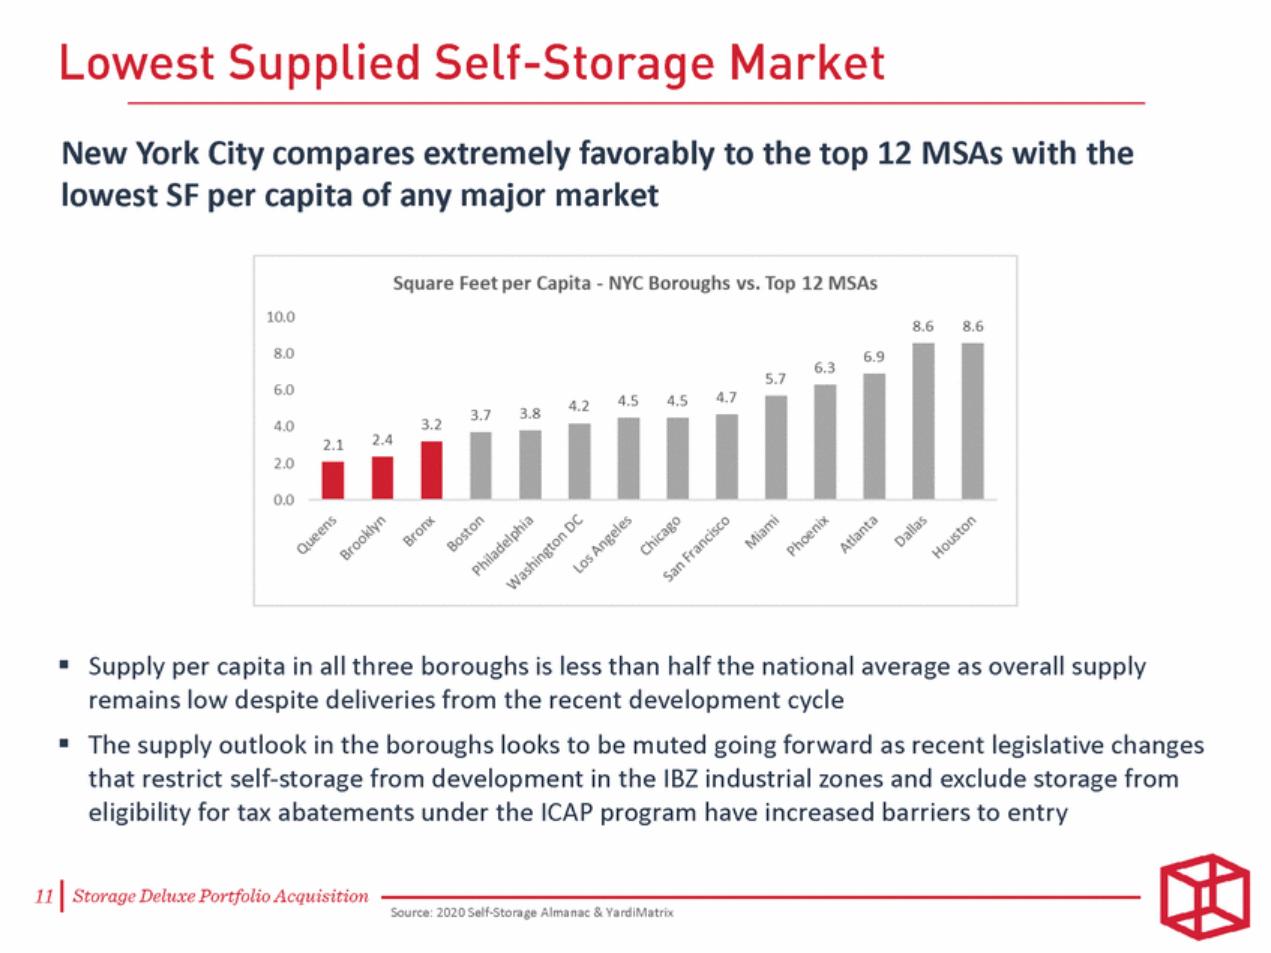
| New York City compares extremely favorably to the top 12 MSAs with the lowest SF per capita of any major market Supply per capita in all three boroughs is less than half the national average as overall supply remains low despite deliveries from the recent development cycle The supply outlook in the boroughs looks to be muted going forward as recent legislative changes that restrict self-storage from development in the IBZ industrial zones and exclude storage from eligibility for tax abatements under the ICAP program have increased barriers to entry Source: 2020 Self-Storage Almanac & YardiMatrix |
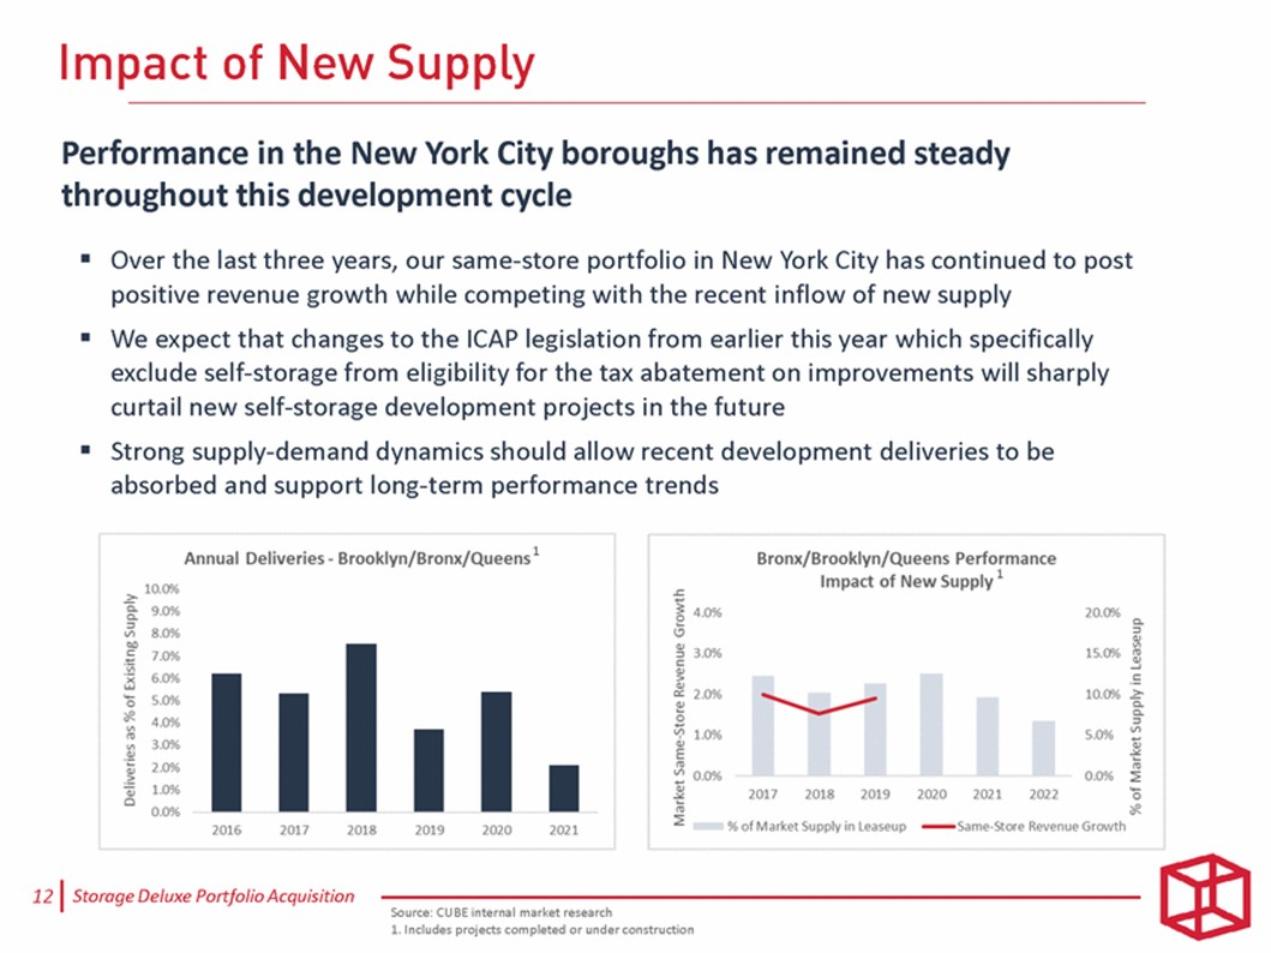
| Performance in the New York City boroughs has remained steady throughout this development cycle Over the last three years, our same-store portfolio in New York City has continued to post positive revenue growth while competing with the recent inflow of new supply We expect that changes to the ICAP legislation from earlier this year which specifically exclude self-storage from eligibility for the tax abatement on improvements will sharply curtail new self-storage development projects in the future Strong supply-demand dynamics should allow recent development deliveries to be absorbed and support long-term performance trends 1 1 |
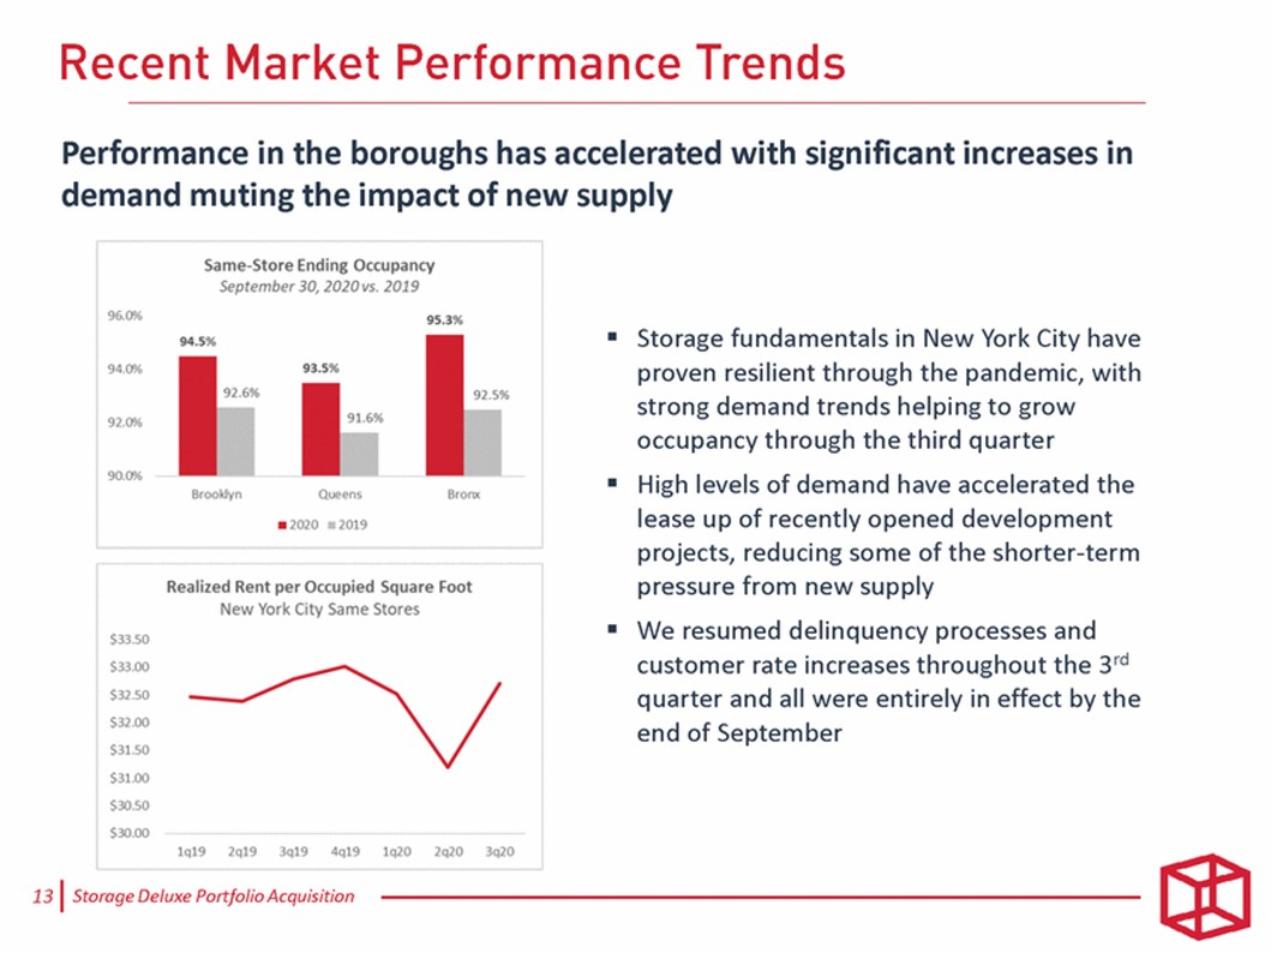
| Performance in the boroughs has accelerated with significant increases in demand muting the impact of new supply Storage fundamentals in New York City have proven resilient through the pandemic, with strong demand trends helping to grow occupancy through the third quarter High levels of demand have accelerated the lease up of recently opened development projects, reducing some of the shorter-term pressure from new supply We resumed delinquency processes and customer rate increases throughout the 3rd quarter and all were entirely in effect by the end of September |
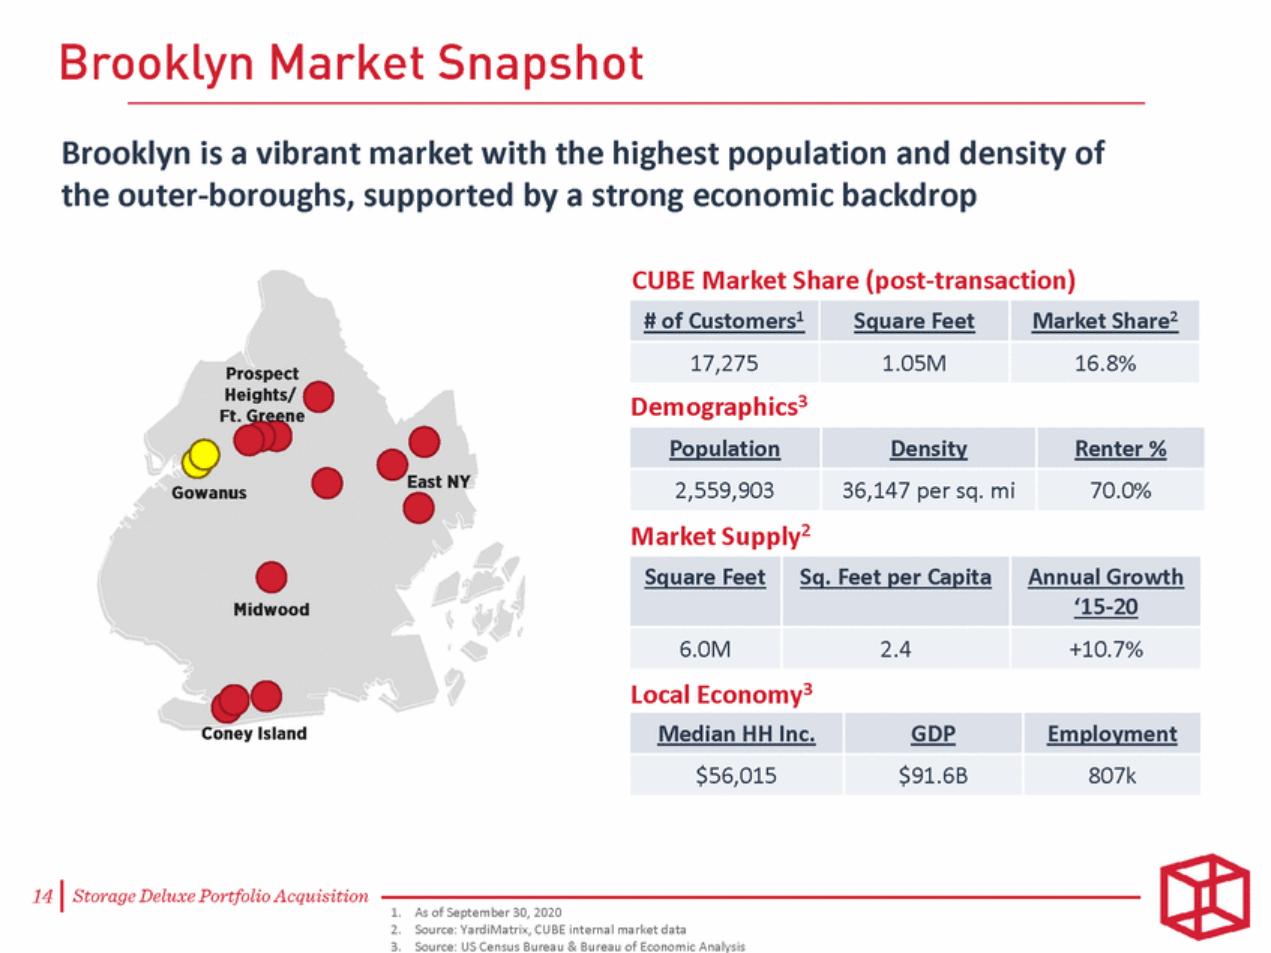
| Brooklyn is a vibrant market with the highest population and density of the outer-boroughs, supported by a strong economic backdrop CUBE Market Share (post-transaction) Demographics3 Market Supply2 Local Economy3 As of September 30, 2020 Source: YardiMatrix, CUBE internal market data Source: US Census Bureau & Bureau of Economic Analysis |
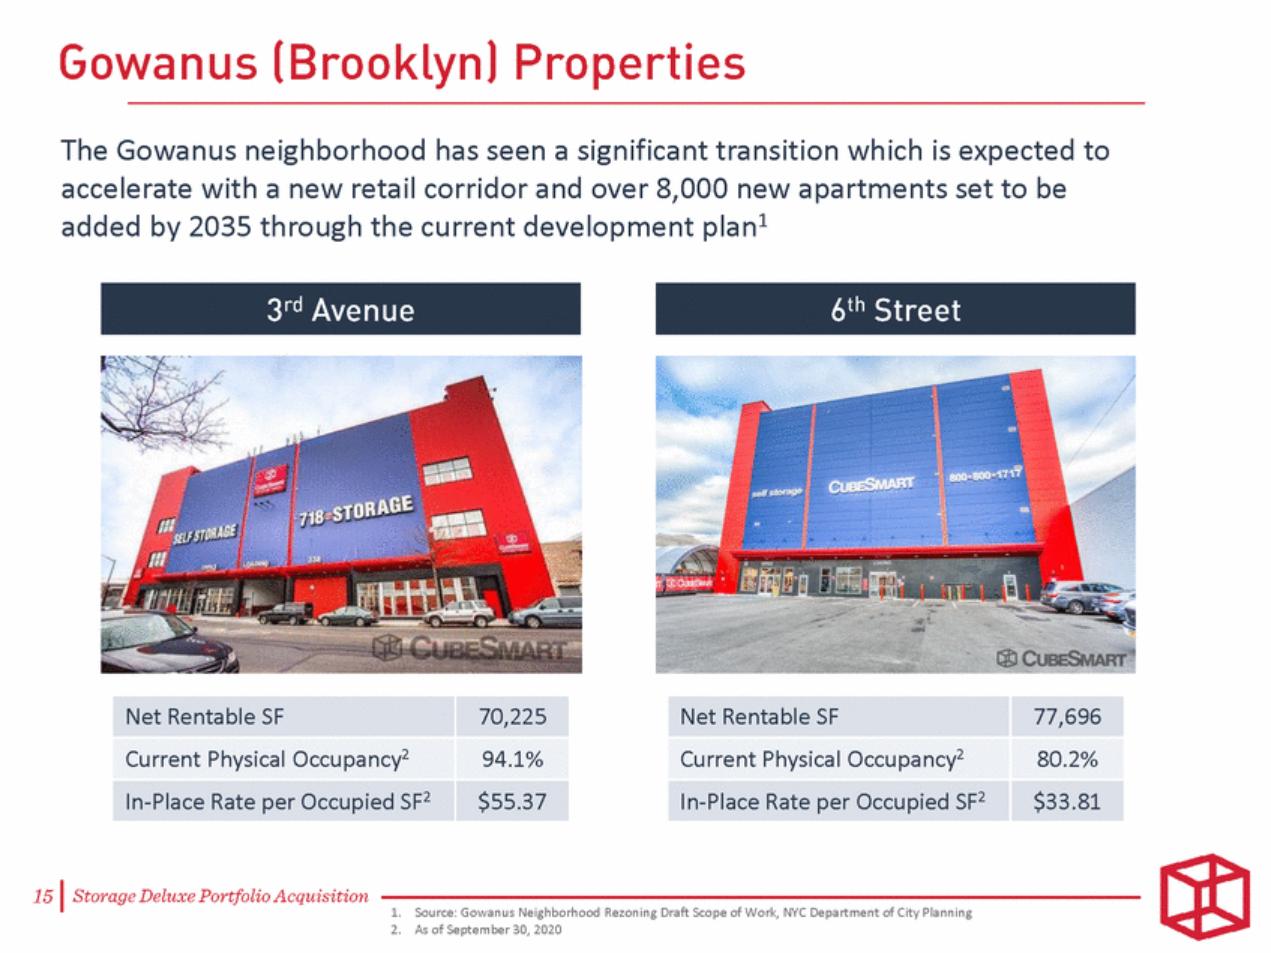
| The Gowanus neighborhood has seen a significant transition which is expected to accelerate with a new retail corridor and over 8,000 new apartments set to be added by 2035 through the current development plan1 Net Rentable SF 70,225 Current Physical Occupancy2 94.1% In-Place Rate per Occupied SF2 $55.37 Net Rentable SF 77,696 Current Physical Occupancy2 80.2% In-Place Rate per Occupied SF2 $33.81 Source: Gowanus Neighborhood Rezoning Draft Scope of Work, NYC Department of City Planning As of September 30, 2020 |
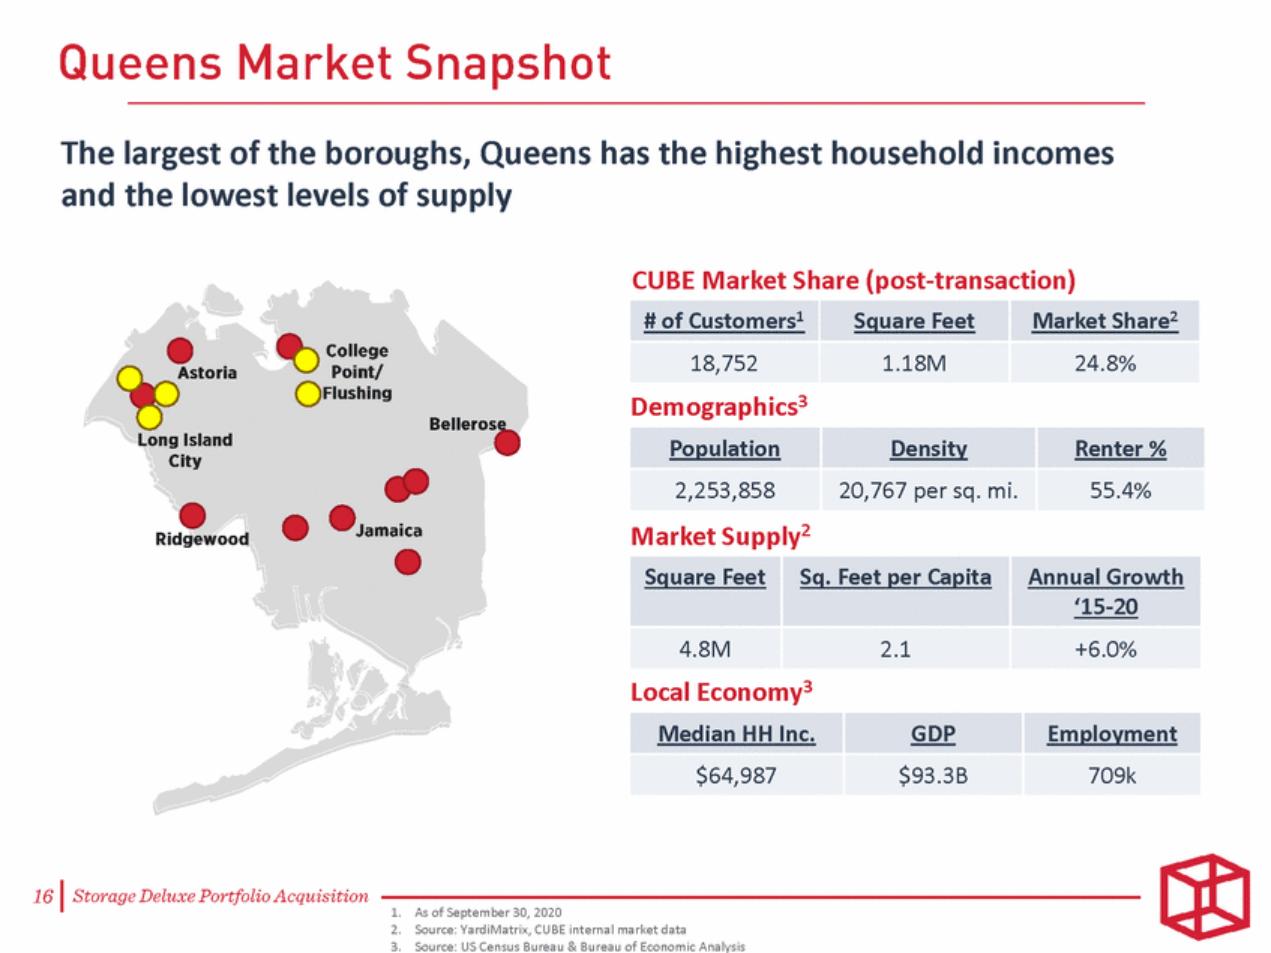
| The largest of the boroughs, Queens has the highest household incomes and the lowest levels of supply CUBE Market Share (post-transaction) Demographics3 Market Supply2 Local Economy3 As of September 30, 2020 Source: YardiMatrix, CUBE internal market data Source: US Census Bureau & Bureau of Economic Analysis |
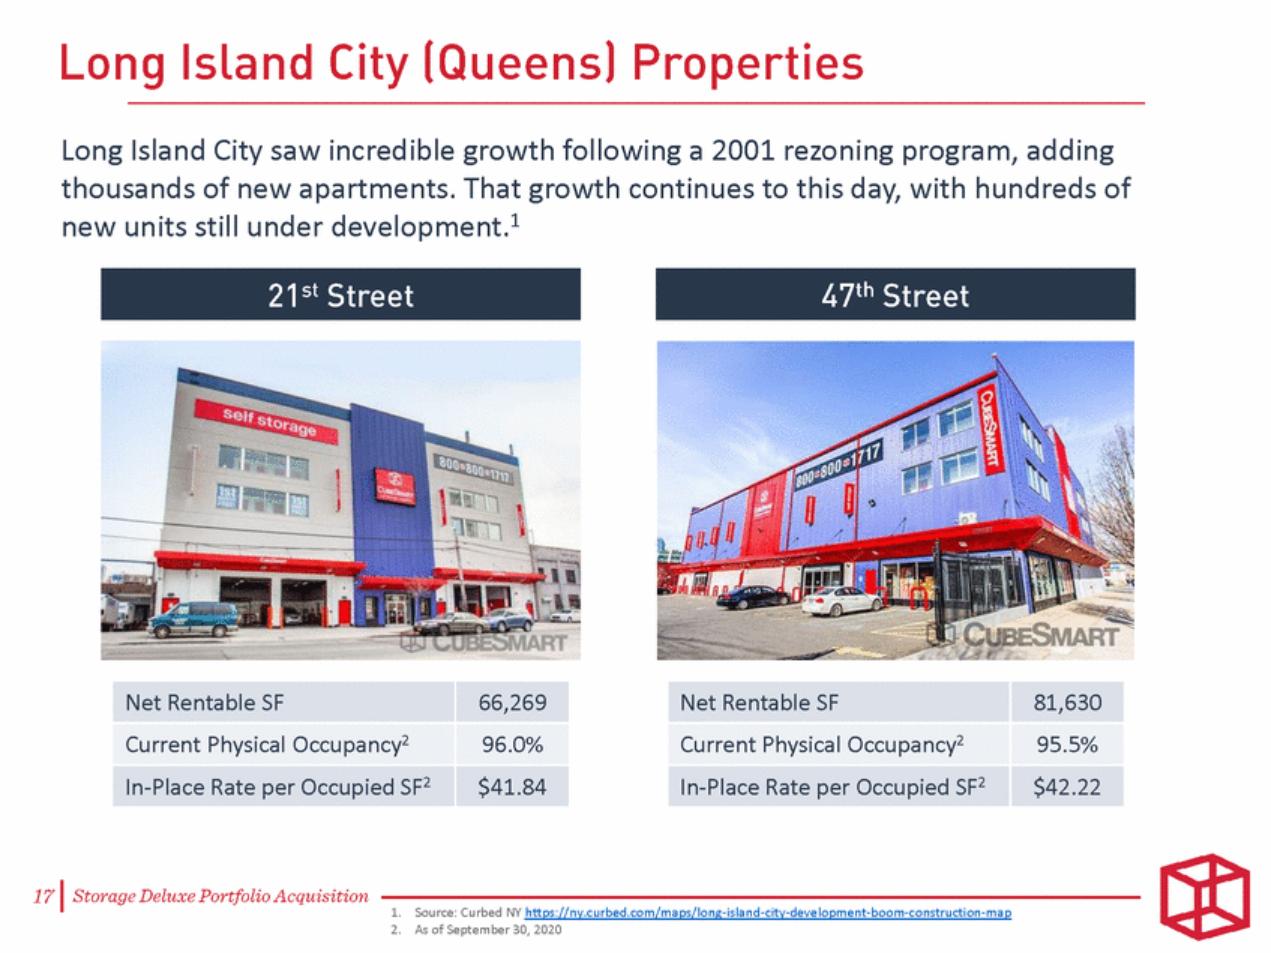
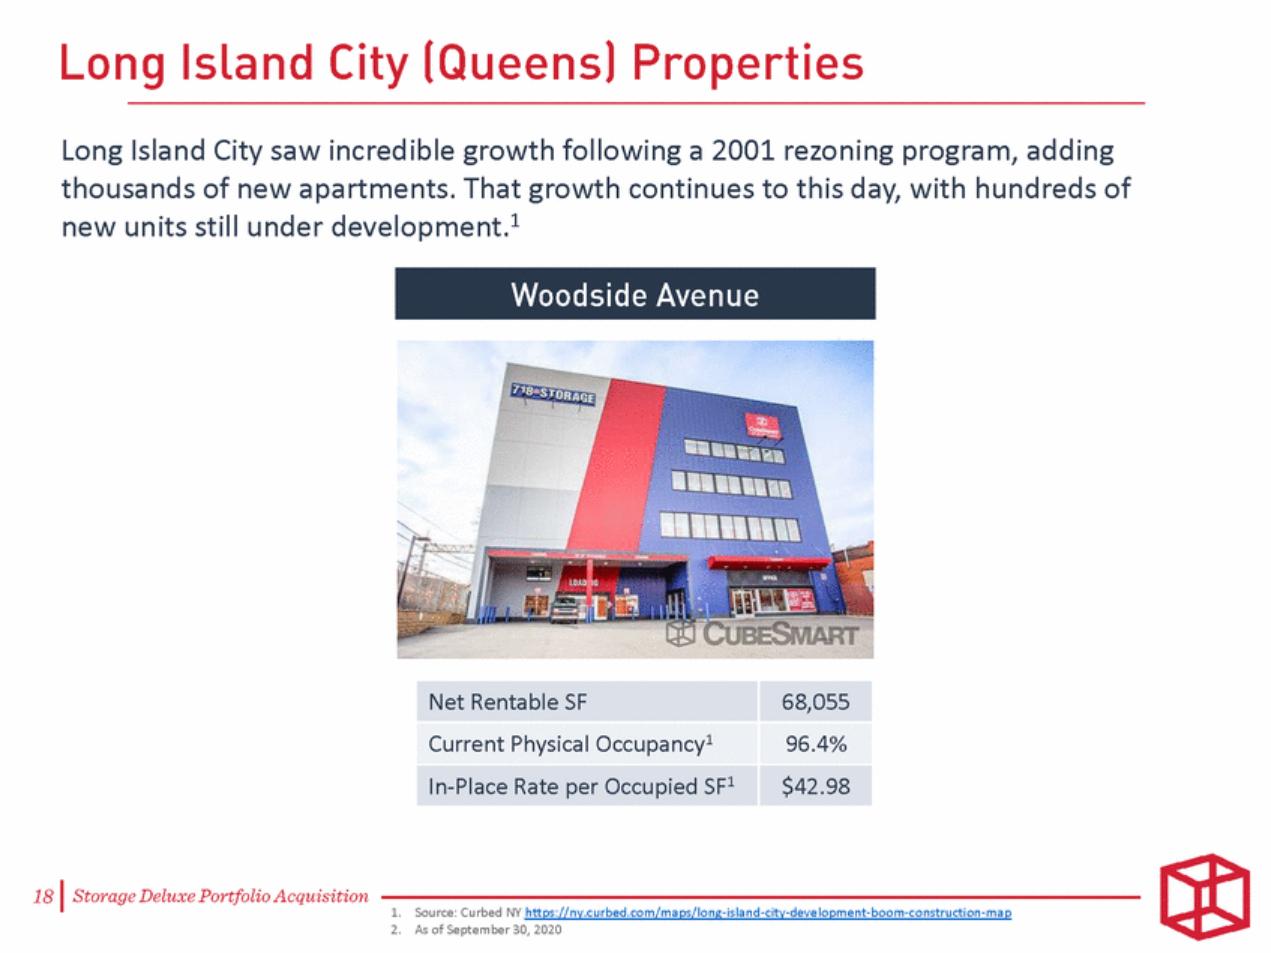
| Long Island City saw incredible growth following a 2001 rezoning program, adding thousands of new apartments. That growth continues to this day, with hundreds of new units still under development.1 Net Rentable SF 66,269 Current Physical Occupancy2 96.0% In-Place Rate per Occupied SF2 $41.84 Net Rentable SF 81,630 Current Physical Occupancy2 95.5% In-Place Rate per Occupied SF2 $42.22 Source: Curbed NY https://ny.curbed.com/maps/long-island-city-development-boom-construction-map As of September 30, 2020 |
| Long Island City saw incredible growth following a 2001 rezoning program, adding thousands of new apartments. That growth continues to this day, with hundreds of new units still under development.1 Source: Curbed NY https://ny.curbed.com/maps/long-island-city-development-boom-construction-map As of September 30, 2020 |
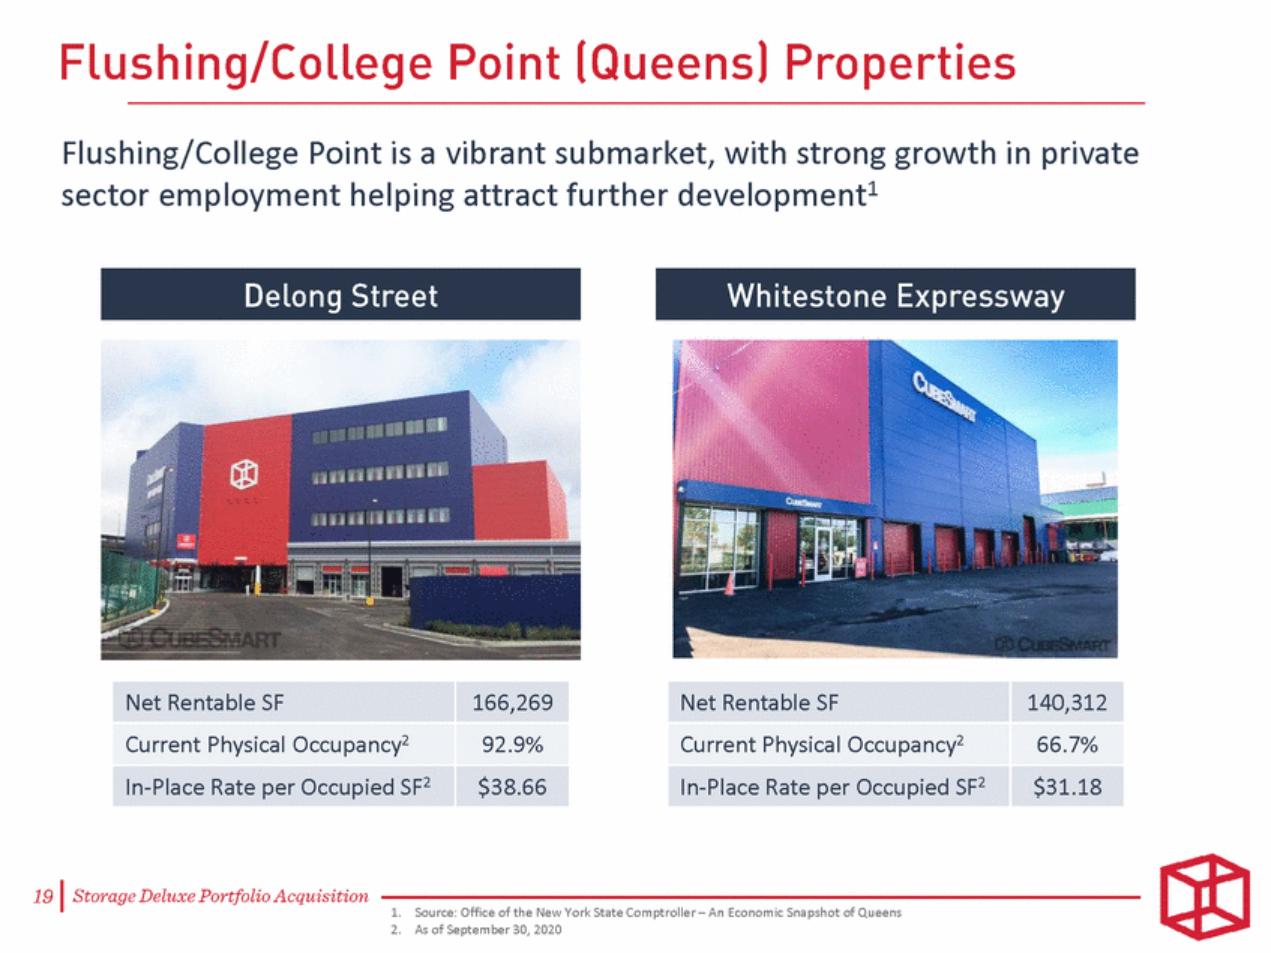
| Flushing/College Point is a vibrant submarket, with strong growth in private sector employment helping attract further development1 Net Rentable SF 166,269 Current Physical Occupancy2 92.9% In-Place Rate per Occupied SF2 $38.66 Net Rentable SF 140,312 Current Physical Occupancy2 66.7% In-Place Rate per Occupied SF2 $31.18 Source: Office of the New York State Comptroller – An Economic Snapshot of Queens As of September 30, 2020 |
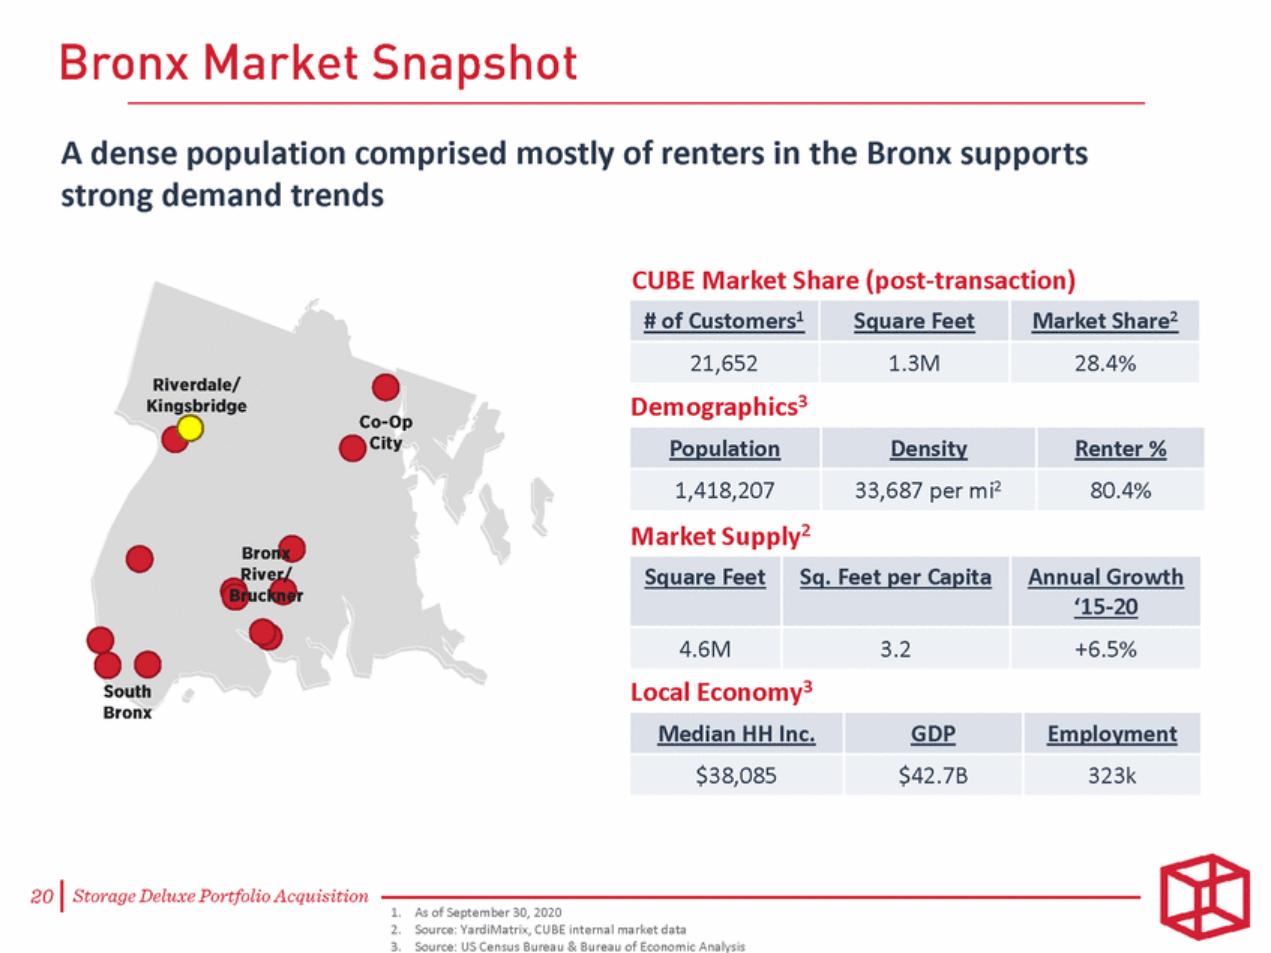
| A dense population comprised mostly of renters in the Bronx supports strong demand trends CUBE Market Share (post-transaction) Demographics3 Market Supply2 Local Economy3 As of September 30, 2020 Source: YardiMatrix, CUBE internal market data Source: US Census Bureau & Bureau of Economic Analysis |
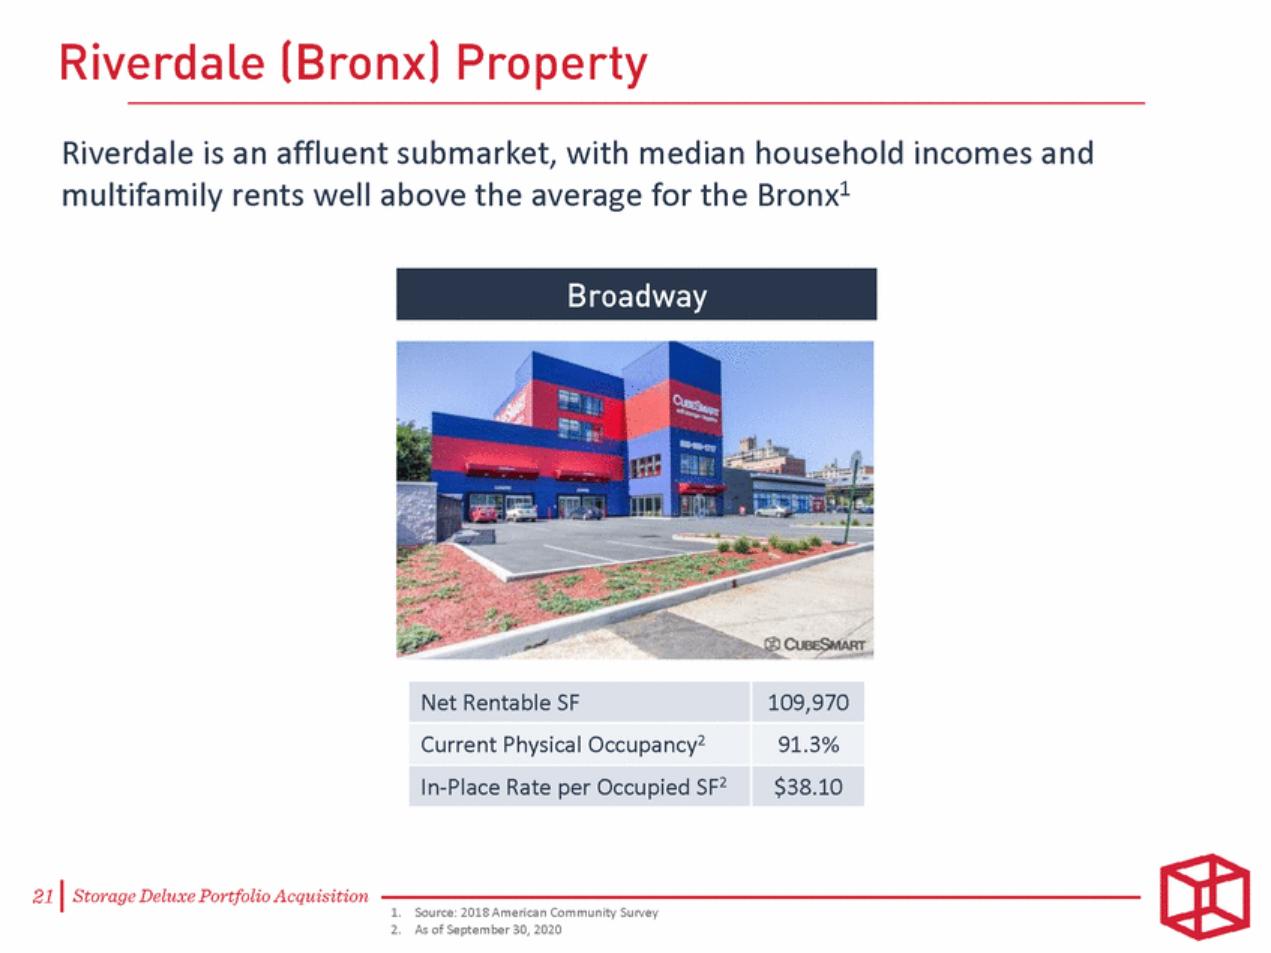
| Riverdale is an affluent submarket, with median household incomes and multifamily rents well above the average for the Bronx1 Source: 2018 American Community Survey As of September 30, 2020 |
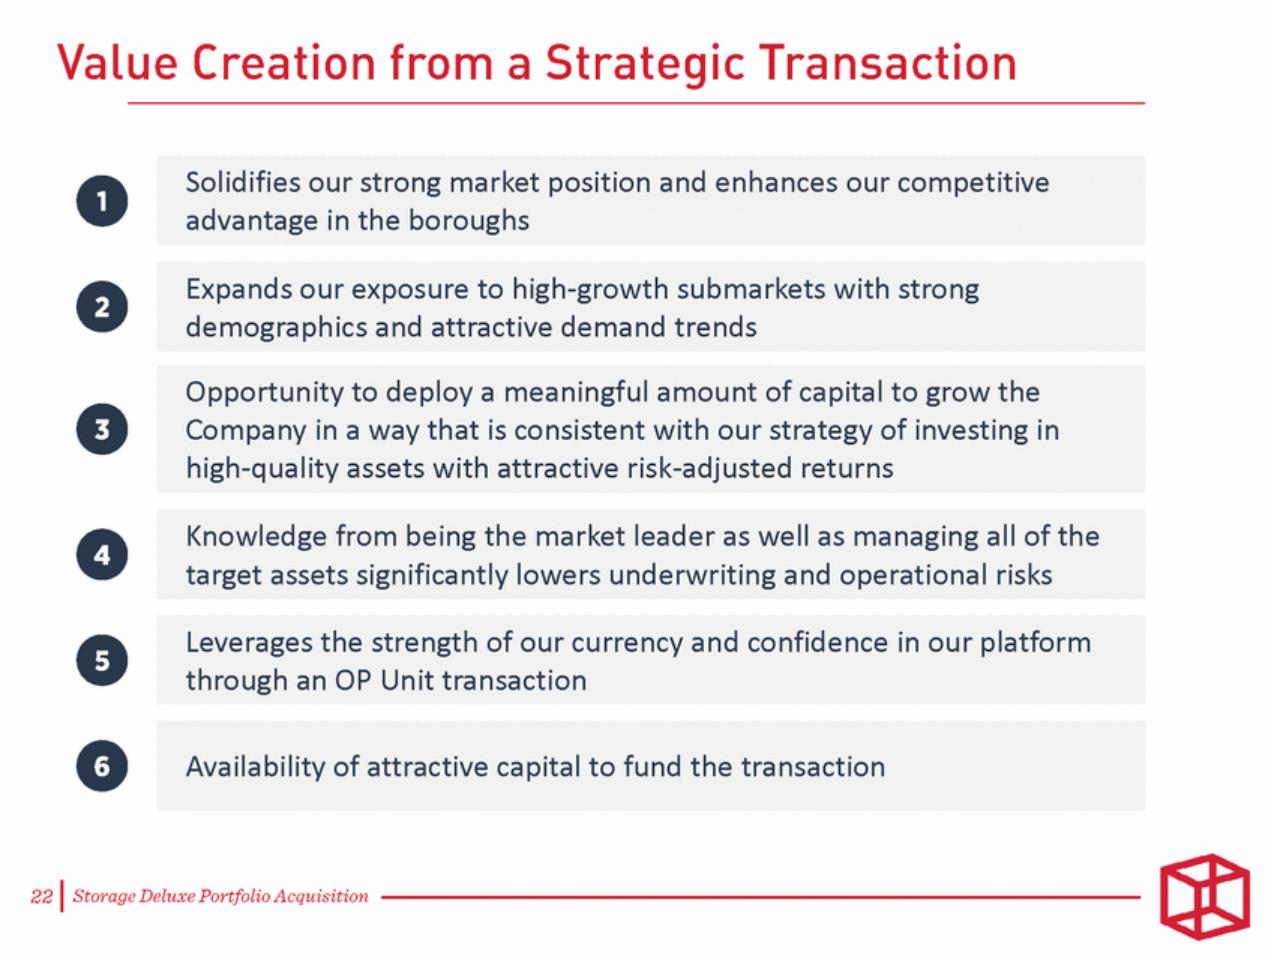
| Solidifies our strong market position and enhances our competitive advantage in the boroughs Expands our exposure to high-growth submarkets with strong demographics and attractive demand trends Opportunity to deploy a meaningful amount of capital to grow the Company in a way that is consistent with our strategy of investing in high-quality assets with attractive risk-adjusted returns Knowledge from being the market leader as well as managing all of the target assets significantly lowers underwriting and operational risks Leverages the strength of our currency and confidence in our platform through an OP Unit transaction Availability of attractive capital to fund the transaction |