Attached files
| file | filename |
|---|---|
| EX-99.1 - EX-99.1 - Citizens Community Bancorp Inc. | exhibit991earningsrelc.htm |
| 8-K - 8-K - Citizens Community Bancorp Inc. | czwi-20201027.htm |

EXHIBIT 99.2 Earnings Release Supplement Third Quarter 2020

Citizens Community Bancorp, Inc. Table of Contents Segment Profiles Page(s) COVID-19 Related Loan Deferrals 2 Non-Owner Occupied CRE 3 Owner Occupied CRE 4 Multi-family 5 Commercial and Industrial Loans 6 Construction and Development Loans 7 Agricultural Real Estate and Operating Loans 8 Hotel Loans 9 Restaurant Loans 10 Commercial Real Estate by Vintage and Risk Rating 11 Residential Loans 12 Credit Quality Risk Rating Descriptions 13 Loans by Risk Rating as of September 30, 2020 14 Loans by Risk Rating as of June 30, 2020 15 Loans by Risk Rating as of December 31, 2019 16 Loans by Risk Rating as of September 30, 2019 17 Nonaccrual Loans Roll forward 18 Other Real Estate Roll forward 18 Troubled Debt Restructurings in Accrual Status 18 Acquired Loans – Non-accretable difference; Accretable discount tables 19 Capital Ratios – Bank and Company 20 1

2

• • • • • Wisconsin Minnesota Other • 3

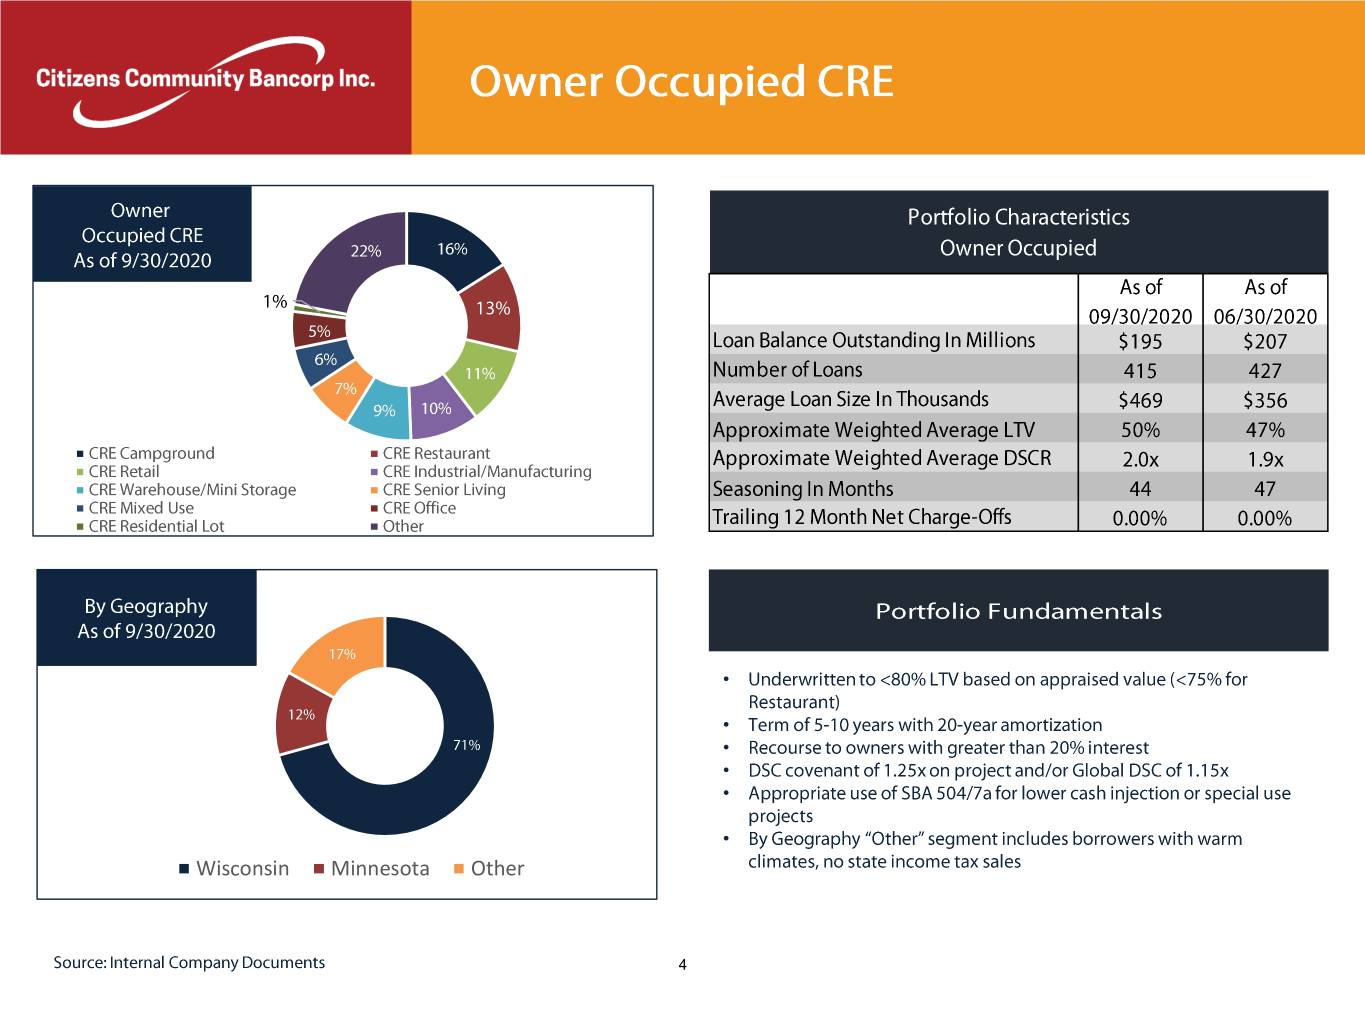
• • • • • • Wisconsin Minnesota Other 4

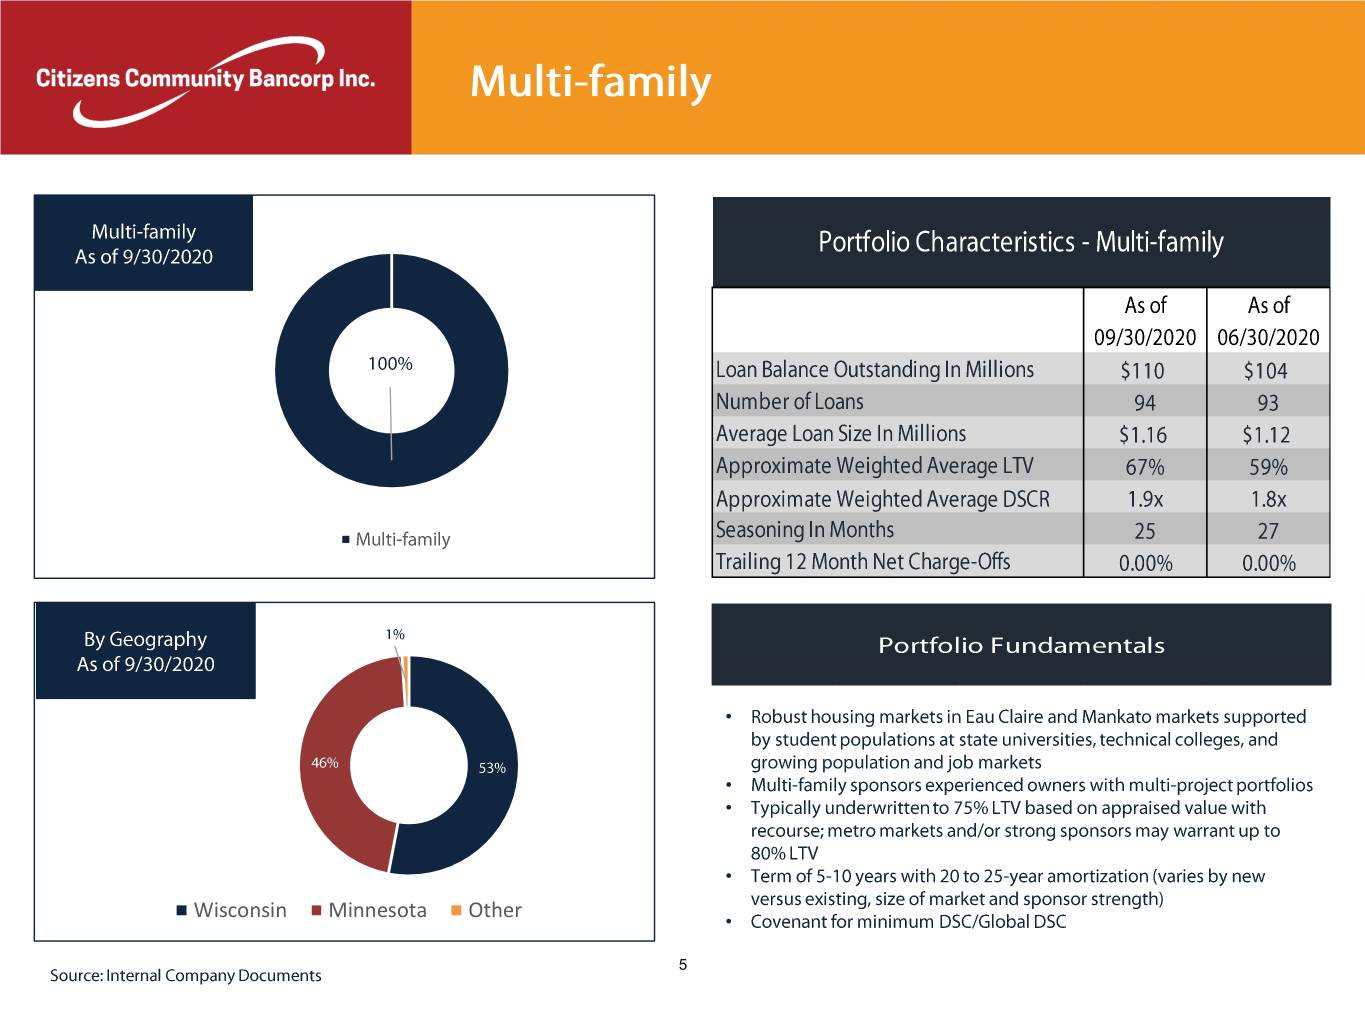
• • • • Wisconsin Minnesota Other • 5

• • • • • Wisconsin Minnesota Other 6

• • • Wisconsin Minnesota Illinios • • 7

Crop Dairy Other Farming Other • • • • • Wisconsin Minnesota Other 8

• • • • • Minnesota Wisconsin Illinois 9

• • • • • Wisconsin Minnesota Other • 10

$88,473$51,230$90,360$162,571 $223,624 $156,564$772,822 11

12

Credit Quality/Risk Ratings: Management utilizes a numeric risk rating system to identify and quantify the Bank’s risk of loss within its loan portfolio. Ratings are initially assigned prior to funding the loan, and may be changed at any time as circumstances warrant. Ratings range from the highest to lowest quality based on factors that include measurements of ability to pay, collateral type and value, borrower stability and management experience. The Bank’s loan portfolio is presented below in accordance with the risk rating framework that has been commonly adopted by the federal banking agencies. The definitions of the various risk rating categories are as follows: 1 through 4 - Pass. A “Pass” loan means that the condition of the borrower and the performance of the loan is satisfactory or better. 5 - Watch. A “Watch” loan has clearly identifiable developing weaknesses that deserve additional attention from management. Weaknesses that are not corrected or mitigated, may jeopardize the ability of the borrower to repay the loan in the future. 6 - Special Mention. A “Special Mention” loan has one or more potential weakness that deserve management’s close attention. If left uncorrected, these potential weaknesses may result in deterioration of the repayment prospects for the loan or in the institution’s credit position in the future. 7 - Substandard. A “Substandard” loan is inadequately protected by the current net worth and paying capacity of the obligor or the collateral pledged, if any. Assets classified as substandard must have a well-defined weakness, or weaknesses, that jeopardize the liquidation of the debt. They are characterized by the distinct possibility that the Bank will sustain some loss if the deficiencies are not corrected. 8 - Doubtful. A “Doubtful” loan has all the weaknesses inherent in a Substandard loan with the added characteristic that the weaknesses make collection or liquidation in full, on the basis of currently existing facts, conditions and values, highly questionable and improbable. 9 - Loss. Loans classified as “Loss” are considered uncollectible, and their continuance as bankable assets is not warranted. This classification does not mean that the loan has absolutely no recovery or salvage value, and a partial recovery may occur in the future. 13

Below is a breakdown of loans by risk rating as of September 30, 2020: 1 to 5 6 7 8 9 TOTAL Originated Loans: Commercial/Agricultural real estate: Commercial real estate $ 318,915 $ 1,947 $ 1,166 $ — $ — $ 322,028 Agricultural real estate 30,807 454 1,269 — — 32,530 Multi-family real estate 100,148 — — — — 100,148 Construction and land development 77,514 — 3,478 — — 80,992 C&I/Agricultural operating: Commercial and industrial 75,338 802 3,819 — — 79,959 SBA PPP loans 139,166 — — — — 139,166 Agricultural operating 23,040 28 1,256 — — 24,324 Residential mortgage: Residential mortgage 85,922 7 4,171 — — 90,100 Purchased HELOC loans 6,220 — 327 — — 6,547 Consumer installment: Originated indirect paper 28,312 — 223 — — 28,535 Other consumer 13,135 — 86 — — 13,221 Total originated loans $ 898,517 $ 3,238 $ 15,795 $ — $ — $ 917,550 Acquired Loans: Commercial/Agricultural real estate: Commercial real estate $ 168,360 $ 4,237 $ 6,048 $ — $ — $ 178,645 Agricultural real estate 33,765 — 6,848 — — 40,613 Multi-family real estate 9,372 — 148 — — 9,520 Construction and land development 8,264 — 82 — — 8,346 C&I/Agricultural operating: Commercial and industrial 23,572 59 782 — — 24,413 Agricultural operating 8,688 — 946 — — 9,634 Residential mortgage: Residential mortgage 49,243 243 2,268 — — 51,754 Consumer installment: Other consumer 1,404 — 5 — — 1,409 Total acquired loans $ 302,668 $ 4,539 $ 17,127 $ — $ — $ 324,334 Total Loans: Commercial/Agricultural real estate: Commercial real estate $ 487,275 $ 6,184 $ 7,214 $ — $ — $ 500,673 Agricultural real estate 64,572 454 8,117 — — 73,143 Multi-family real estate 109,520 — 148 — — 109,668 Construction and land development 85,778 — 3,560 — — 89,338 C&I/Agricultural operating: Commercial and industrial 98,910 861 4,601 — — 104,372 SBA PPP loans 139,166 — — — — 139,166 Agricultural operating 31,728 28 2,202 — — 33,958 Residential mortgage: Residential mortgage 135,165 250 6,439 — — 141,854 Purchased HELOC loans 6,220 — 327 — — 6,547 Consumer installment: Originated indirect paper 28,312 — 223 — — 28,535 Other consumer 14,539 — 91 — — 14,630 Gross loans $ 1,201,185 $ 7,777 $ 32,922 $ — $ — $ 1,241,884 Less: Unearned net deferred fees and costs and loans in process (5,033) Unamortized discount on acquired loans (6,712) Allowance for loan losses (14,836) Loans receivable, net $ 1,215,303 14

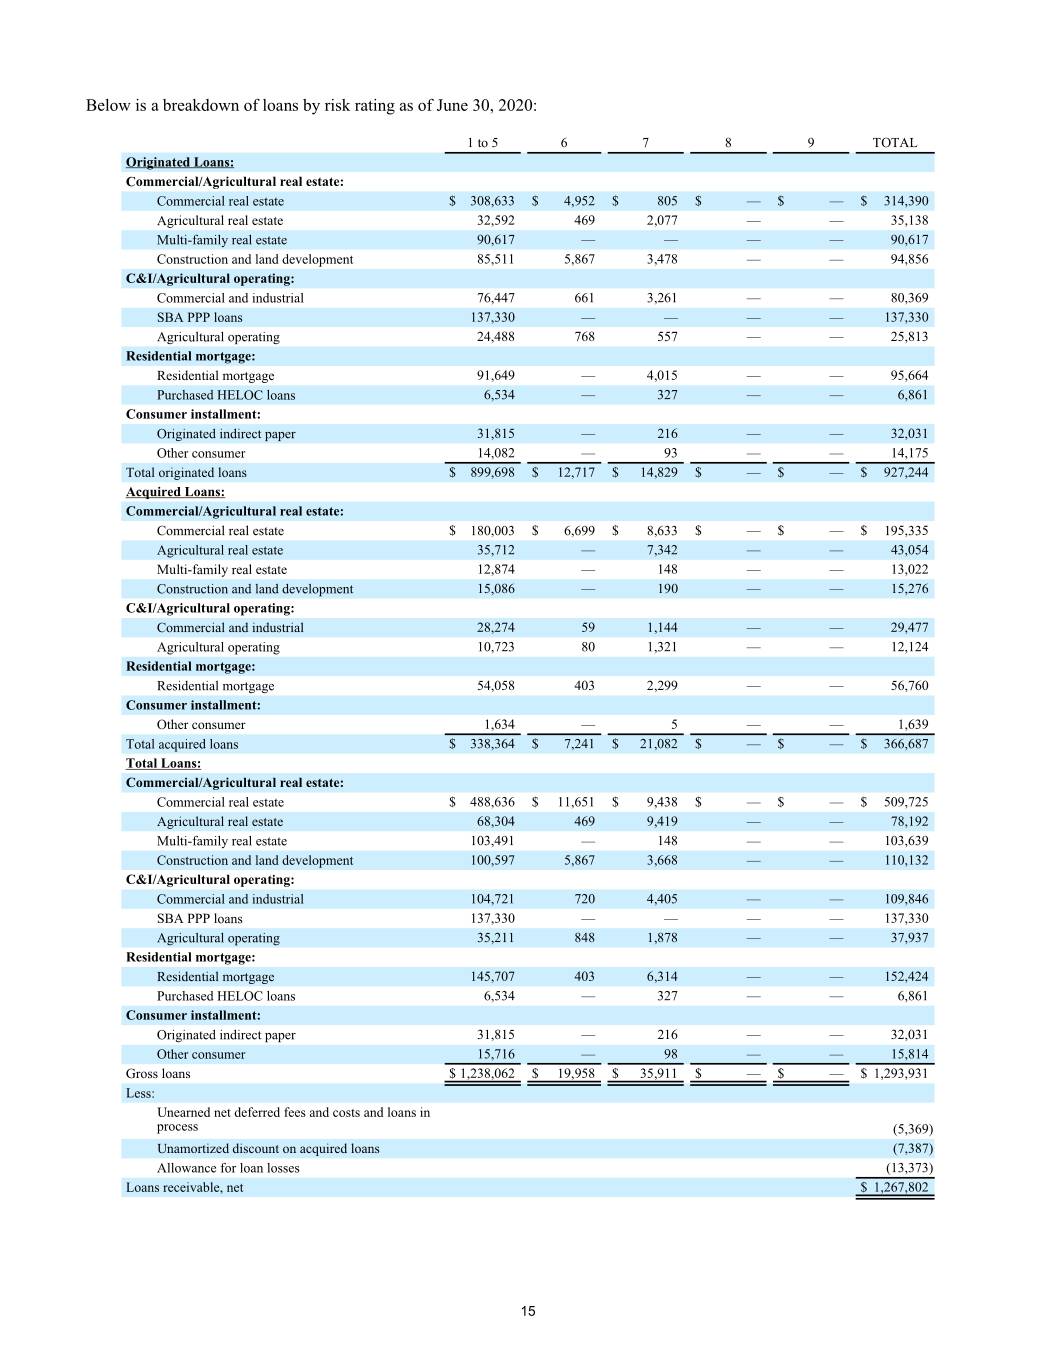
Below is a breakdown of loans by risk rating as of June 30, 2020: 1 to 5 6 7 8 9 TOTAL Originated Loans: Commercial/Agricultural real estate: Commercial real estate $ 308,633 $ 4,952 $ 805 $ — $ — $ 314,390 Agricultural real estate 32,592 469 2,077 — — 35,138 Multi-family real estate 90,617 — — — — 90,617 Construction and land development 85,511 5,867 3,478 — — 94,856 C&I/Agricultural operating: Commercial and industrial 76,447 661 3,261 — — 80,369 SBA PPP loans 137,330 — — — — 137,330 Agricultural operating 24,488 768 557 — — 25,813 Residential mortgage: Residential mortgage 91,649 — 4,015 — — 95,664 Purchased HELOC loans 6,534 — 327 — — 6,861 Consumer installment: Originated indirect paper 31,815 — 216 — — 32,031 Other consumer 14,082 — 93 — — 14,175 Total originated loans $ 899,698 $ 12,717 $ 14,829 $ — $ — $ 927,244 Acquired Loans: Commercial/Agricultural real estate: Commercial real estate $ 180,003 $ 6,699 $ 8,633 $ — $ — $ 195,335 Agricultural real estate 35,712 — 7,342 — — 43,054 Multi-family real estate 12,874 — 148 — — 13,022 Construction and land development 15,086 — 190 — — 15,276 C&I/Agricultural operating: Commercial and industrial 28,274 59 1,144 — — 29,477 Agricultural operating 10,723 80 1,321 — — 12,124 Residential mortgage: Residential mortgage 54,058 403 2,299 — — 56,760 Consumer installment: Other consumer 1,634 — 5 — — 1,639 Total acquired loans $ 338,364 $ 7,241 $ 21,082 $ — $ — $ 366,687 Total Loans: Commercial/Agricultural real estate: Commercial real estate $ 488,636 $ 11,651 $ 9,438 $ — $ — $ 509,725 Agricultural real estate 68,304 469 9,419 — — 78,192 Multi-family real estate 103,491 — 148 — — 103,639 Construction and land development 100,597 5,867 3,668 — — 110,132 C&I/Agricultural operating: Commercial and industrial 104,721 720 4,405 — — 109,846 SBA PPP loans 137,330 — — — — 137,330 Agricultural operating 35,211 848 1,878 — — 37,937 Residential mortgage: Residential mortgage 145,707 403 6,314 — — 152,424 Purchased HELOC loans 6,534 — 327 — — 6,861 Consumer installment: Originated indirect paper 31,815 — 216 — — 32,031 Other consumer 15,716 — 98 — — 15,814 Gross loans $ 1,238,062 $ 19,958 $ 35,911 $ — $ — $ 1,293,931 Less: Unearned net deferred fees and costs and loans in process (5,369) Unamortized discount on acquired loans (7,387) Allowance for loan losses (13,373) Loans receivable, net $ 1,267,802 15

Below is a breakdown of loans by risk rating as of December 31, 2019: 1 to 5 6 7 8 9 TOTAL Originated Loans: Commercial/Agricultural real estate: Commercial real estate $ 301,381 $ 266 $ 899 $ — $ — $ 302,546 Agricultural real estate 31,129 829 2,068 — — 34,026 Multi-family real estate 71,877 — — — — 71,877 Construction and land development 67,989 — 3,478 — — 71,467 C&I/Agricultural operating: Commercial and industrial 85,248 1,023 3,459 — — 89,730 Agricultural operating 19,545 402 770 — — 20,717 Residential mortgage: Residential mortgage 104,428 — 4,191 — — 108,619 Purchased HELOC loans 8,407 — — — — 8,407 Consumer installment: — Originated indirect paper 39,339 — 246 — — 39,585 Other consumer 15,425 — 121 — — 15,546 Total originated loans $ 744,768 $ 2,520 $ 15,232 $ — $ — $ 762,520 Acquired Loans: Commercial/Agricultural real estate: Commercial real estate $ 196,692 $ 6,084 $ 9,137 $ — $ — $ 211,913 Agricultural real estate 42,381 534 8,422 — — 51,337 Multi-family real estate 13,533 — 1,598 — — 15,131 Construction and land development 14,181 — 762 — — 14,943 C&I/Agricultural operating: Commercial and industrial 41,587 932 1,485 — — 44,004 Agricultural operating 15,621 350 1,092 — — 17,063 Residential mortgage: Residential mortgage 65,125 436 2,152 — — 67,713 Consumer installment: Other consumer 2,628 — 12 — — 2,640 Total acquired loans $ 391,748 $ 8,336 $ 24,660 $ — $ — $ 424,744 Total Loans: Commercial/Agricultural real estate: Commercial real estate $ 498,073 $ 6,350 $ 10,036 $ — $ — $ 514,459 Agricultural real estate 73,510 1,363 10,490 — — 85,363 Multi-family real estate 85,410 — 1,598 — — 87,008 Construction and land development 82,170 — 4,240 — — 86,410 C&I/Agricultural operating: Commercial and industrial 126,835 1,955 4,944 — — 133,734 Agricultural operating 35,166 752 1,862 — — 37,780 Residential mortgage: Residential mortgage 169,553 436 6,343 — — 176,332 Purchased HELOC loans 8,407 — — — — 8,407 Consumer installment: Originated indirect paper 39,339 — 246 — — 39,585 Other consumer 18,053 — 133 — — 18,186 Gross loans $ 1,136,516 $ 10,856 $ 39,892 $ — $ — $ 1,187,264 Less: Unearned net deferred fees and costs and loans in process (393) Unamortized discount on acquired loans (9,491) Allowance for loan losses (10,320) Loans receivable, net $ 1,167,060 16

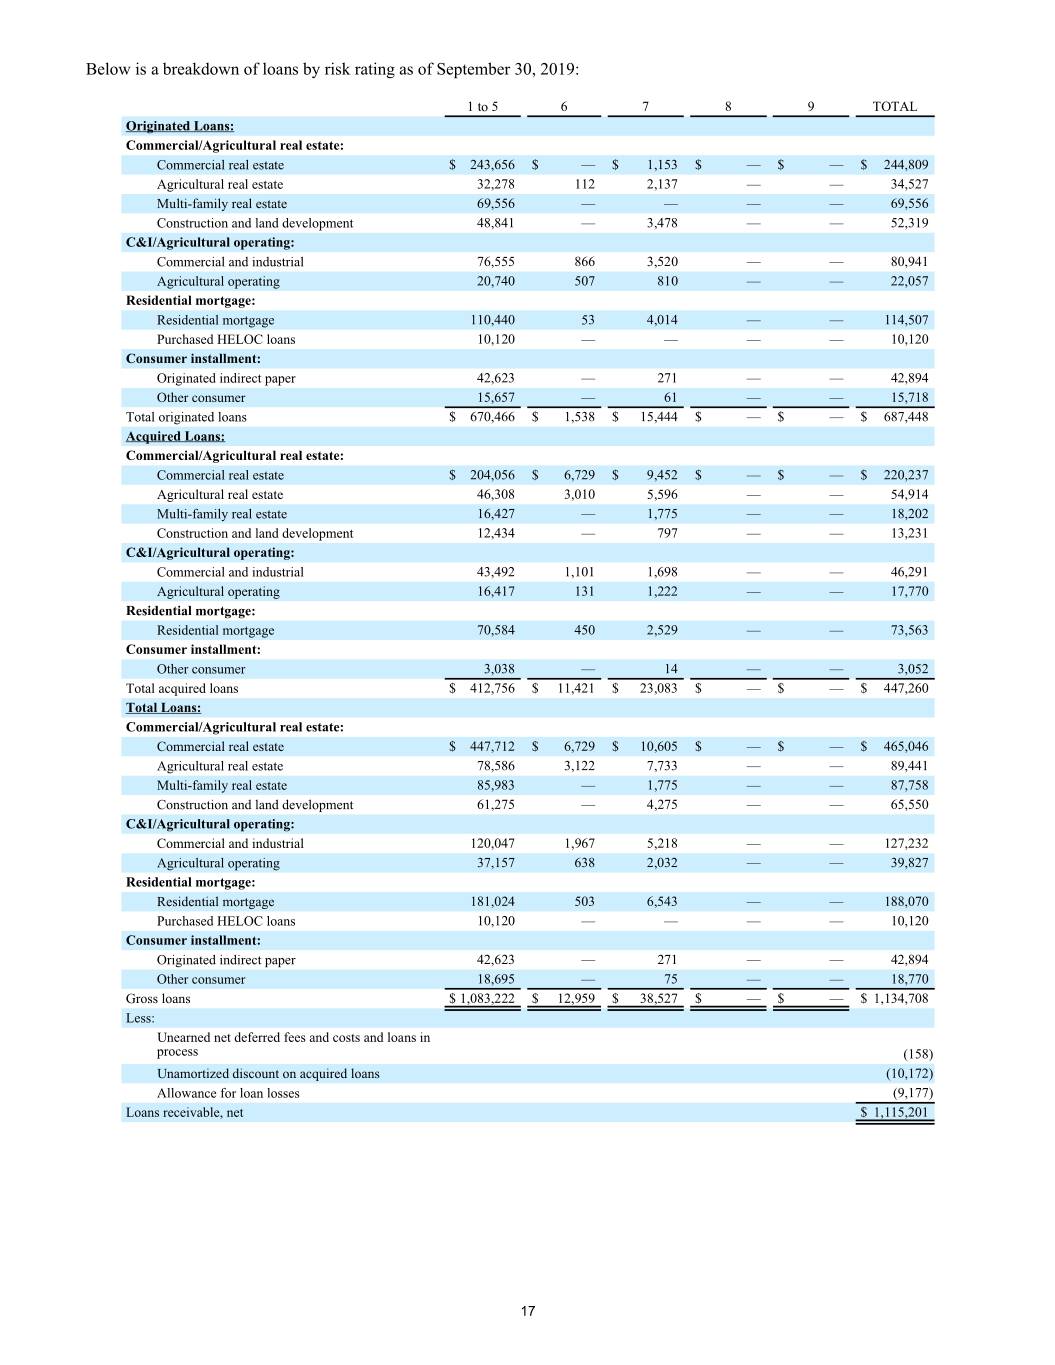
Below is a breakdown of loans by risk rating as of September 30, 2019: 1 to 5 6 7 8 9 TOTAL Originated Loans: Commercial/Agricultural real estate: Commercial real estate $ 243,656 $ — $ 1,153 $ — $ — $ 244,809 Agricultural real estate 32,278 112 2,137 — — 34,527 Multi-family real estate 69,556 — — — — 69,556 Construction and land development 48,841 — 3,478 — — 52,319 C&I/Agricultural operating: Commercial and industrial 76,555 866 3,520 — — 80,941 Agricultural operating 20,740 507 810 — — 22,057 Residential mortgage: Residential mortgage 110,440 53 4,014 — — 114,507 Purchased HELOC loans 10,120 — — — — 10,120 Consumer installment: Originated indirect paper 42,623 — 271 — — 42,894 Other consumer 15,657 — 61 — — 15,718 Total originated loans $ 670,466 $ 1,538 $ 15,444 $ — $ — $ 687,448 Acquired Loans: Commercial/Agricultural real estate: Commercial real estate $ 204,056 $ 6,729 $ 9,452 $ — $ — $ 220,237 Agricultural real estate 46,308 3,010 5,596 — — 54,914 Multi-family real estate 16,427 — 1,775 — — 18,202 Construction and land development 12,434 — 797 — — 13,231 C&I/Agricultural operating: Commercial and industrial 43,492 1,101 1,698 — — 46,291 Agricultural operating 16,417 131 1,222 — — 17,770 Residential mortgage: Residential mortgage 70,584 450 2,529 — — 73,563 Consumer installment: Other consumer 3,038 — 14 — — 3,052 Total acquired loans $ 412,756 $ 11,421 $ 23,083 $ — $ — $ 447,260 Total Loans: Commercial/Agricultural real estate: Commercial real estate $ 447,712 $ 6,729 $ 10,605 $ — $ — $ 465,046 Agricultural real estate 78,586 3,122 7,733 — — 89,441 Multi-family real estate 85,983 — 1,775 — — 87,758 Construction and land development 61,275 — 4,275 — — 65,550 C&I/Agricultural operating: Commercial and industrial 120,047 1,967 5,218 — — 127,232 Agricultural operating 37,157 638 2,032 — — 39,827 Residential mortgage: Residential mortgage 181,024 503 6,543 — — 188,070 Purchased HELOC loans 10,120 — — — — 10,120 Consumer installment: Originated indirect paper 42,623 — 271 — — 42,894 Other consumer 18,695 — 75 — — 18,770 Gross loans $ 1,083,222 $ 12,959 $ 38,527 $ — $ — $ 1,134,708 Less: Unearned net deferred fees and costs and loans in process (158) Unamortized discount on acquired loans (10,172) Allowance for loan losses (9,177) Loans receivable, net $ 1,115,201 17

Nonaccrual Loans Roll forward (in thousands) Quarter Ended September 30, 2020 June 30, 2020 March 31, 2020 December 31, 2019 Balance, beginning of period $ 14,787 $ 16,090 $ 19,056 $ 19,022 Additions 716 1,907 1,811 2,641 Acquired nonaccrual loans — — — — Charge offs (141) (175) (452) (198) Transfers to OREO (172) — (1,100) (425) Return to accrual status (165) (1,702) (120) (14) Payments received (706) (760) (2,824) (1,957) Other, net (1,165) (573) (281) (13) Balance, end of period $ 13,154 $ 14,787 $ 16,090 $ 19,056 Other Real Estate Owned Roll forward (in thousands) Quarter Ended September 30, 2020 June 30, 2020 March 31, 2020 December 31, 2019 Balance, beginning of period $ 692 $ 1,412 $ 1,429 $ 1,348 Loans transferred in 172 — 988 495 Sales (86) (681) (965) (378) Write-downs (26) (151) (49) (64) Other, net 4 112 9 28 Balance, end of period $ 756 $ 692 $ 1,412 $ 1,429 Troubled Debt Restructurings in Accrual Status (in thousands, except number of modifications) September 30, 2020 June 30, 2020 March 31, 2020 December 31, 2019 Number of Recorded Number of Recorded Number of Recorded Number of Recorded Modifications Investment Modifications Investment Modifications Investment Modifications Investment Troubled debt restructurings: Accrual Status Commercial/Agricultural real estate 19 $ 5,480 19 $ 1,885 13 $ 1,125 14 $ 1,730 C&I/Agricultural Operating 5 3,868 5 1,199 1 9 2 366 Residential mortgage 42 3,178 39 2,981 38 3,174 40 3,233 Consumer installment 7 53 8 62 8 69 7 67 Total loans 73 $ 12,579 71 $ 6,127 60 $ 4,377 63 $ 5,396 18

Acquired loans represent much of the reduction in non-performing loans and classified loans. The table below shows the changes in the Bank’s non-accretable difference on purchased credit impaired loans. The second table below shows the changes in the Bank’s accretable loan discount which was established at each acquisition. The Bank has transferred the non-accretable difference on purchased credit impaired loans to accretable discount as collateral coverage improved sufficiently, due to a combination of principal paydowns and/or improving collateral positions. This transferred non-accretable difference to accretable discount is accreted over the remaining maturity of the loan or until payoff, whichever is shorter. Non-accretable difference: (in thousands) September 30, June 30, March 31, December 31, September 30, 2020 2020 2020 2019 2019 Non-accretable difference, beginning of period $ 3,355 $ 4,327 $ 6,290 $ 6,737 $ 3,889 Additions to non-accretable difference for acquired purchased credit impaired loans — — — (170) 2,898 Non-accretable difference realized as interest from payoffs of purchased credit impaired loans (130) (196) (1,043) (271) (50) Transfers from non-accretable difference to accretable discount. (1,294) (741) (669) — — Non-accretable difference used to reduce loan principal balance (270) (35) — — — Non-accretable difference transferred to OREO due to loan foreclosure — — (251) (6) — Non-accretable difference, end of period $ 1,661 $ 3,355 $ 4,327 $ 6,290 $ 6,737 The table below provides the changes in accretable discount for acquired loans. Accretable discount: (in thousands) September 30, June 30, March 31, December 31, September 30, 2020 2020 2020 2019 2019 Accretable discount, beginning of period $ 4,032 $ 3,637 $ 3,201 $ 3,435 $ 2,855 Additions to accretable discount for acquired performing loans — — — — 814 Accelerated accretion from payoff of certain PCI loans with transferred non-accretable difference — (99) — — — Transfers from non-accretable difference to accretable discount 1,294 741 669 — — Scheduled accretion (276) (247) (233) (234) (234) Accretable discount, end of period $ 5,050 $ 4,032 $ 3,637 $ 3,201 $ 3,435 19

CITIZENS COMMUNITY FEDERAL N.A. Selected Capital Composition Highlights September 30, June 30, December 31, September 30, To Be Well Capitalized 2020 2020 2019 2019 Under Prompt Corrective (unaudited) (unaudited) (audited) (unaudited) Action Provisions Tier 1 leverage ratio (to adjusted total assets) 9.9% 9.9% 10.4% 10.2% 5.0% Tier 1 capital (to risk weighted assets) 13.7% 12.9% 12.2% 12.7% 8.0% Common equity tier 1 capital (to risk weighted assets) 13.7% 12.9% 12.2% 12.7% 6.5% Total capital (to risk weighted assets) 15.0% 14.0% 13.1% 13.5% 10.0% CITIZENS COMMUNITY BANCORP, INC. Selected Capital Composition Highlights September 30, June 30, December 31, September 30, To Be Well Capitalized 2020 2020 2019 2019 Under Prompt Corrective (unaudited) (unaudited) (audited) (unaudited) Action Provisions Tier 1 leverage ratio (to adjusted total assets) 7.5% 7.4% 7.7% 7.5% 5.0% Tier 1 capital (to risk weighted assets) 10.5% 9.7% 9.1% 9.3% 8.0% Common equity tier 1 capital (to risk weighted assets) 10.5% 9.7% 9.1% 9.3% 6.5% Total capital (to risk weighted assets) 14.3% 12.1% 11.2% 11.4% 10.0% 20
