Attached files
| file | filename |
|---|---|
| EX-99.1 - EX-99.1 - Investar Holding Corp | exhibit991-q32020earni.htm |
| 8-K - 8-K - Investar Holding Corp | istr-20201022.htm |

Exhibit 99.2 NASDAQ: ISTR Earnings Release Presentation 3rd Quarter 2020
Disclosures and Disclaimers This presentation may contain forward-looking statements within the meaning of the Private Securities Litigation Reform Act of 1995 that reflect current views of Investar Holding Corporation (the “Company”) with respect to, among other things, future events and financial performance. The Company generally identifies forward-looking statements by terminology such as “outlook,” “believes,” “expects,” “potential,” “continues,” “may,” “will,” “could,” “should,” “seeks,” “approximately,” “predicts,” “intends,” “plans,” “estimates,” “anticipates,” or the negative version of those words or other comparable words. Any forward-looking statements contained in this presentation are based on the historical performance of the Company and its subsidiaries or on the Company’s current plans, estimates and expectations. The inclusion of this forward-looking information should not be regarded as a representation by the Company that the future plans, estimates or expectations by the Company will be achieved. Such forward-looking statements are subject to various risks and uncertainties and assumptions relating to the Company’s operations, financial results, financial condition, business prospects, growth strategy and liquidity. If one or more of these or other risks or uncertainties materialize, or if the Company’s underlying assumptions prove to be incorrect, the Company’s actual results may vary materially from those indicated in these statements. The Company does not undertake any obligation to publicly update or review any forward-looking statement, whether as a result of new information, future developments or otherwise. A number of important factors could cause actual results to differ materially from those indicated by the forward-looking statements. These factors include, but are not limited to, the following, any one or more of which could materially affect the outcome of future events: • the ongoing impacts of the COVID-19 pandemic; • business and economic conditions generally and in the financial services industry in particular, whether nationally, regionally or in the markets in which the Company operates; • increased cyber and payment fraud risk; • our ability to achieve organic loan and deposit growth, and the composition of that growth; • our ability to integrate and achieve anticipated cost savings from acquisitions; • changes (or the lack of changes) in interest rates, yield curves and interest rate spread relationships that affect our loan and deposit pricing; • the extent of continuing client demand for the high level of personalized service that is a key element of our banking approach as well as our ability to execute its strategy generally; • the dependence on our management team, and our ability to attract and retain qualified personnel; • changes in the quality or composition of our loan or investment portfolios, including adverse developments in borrower industries or in the repayment ability of individual borrowers; • inaccuracy of the assumptions and estimates we make in establishing reserves for probable loan losses and other estimates; • the concentration of our business within the Company’s geographic areas of operation in Louisiana, Texas and Alabama; and • concentration of credit exposure. These factors should not be construed as exhaustive. Additional information on these and other risk factors can be found in Item 1A. “Risk Factors” and Item 7. “Special Note Regarding Forward-Looking Statements” in the Company’s Annual Report on Form 10-K for the year ended December 31, 2019, filed with the Securities and Exchange Commission (“SEC”) and in the “Risk Factors” section of subsequent reports filed with the SEC.
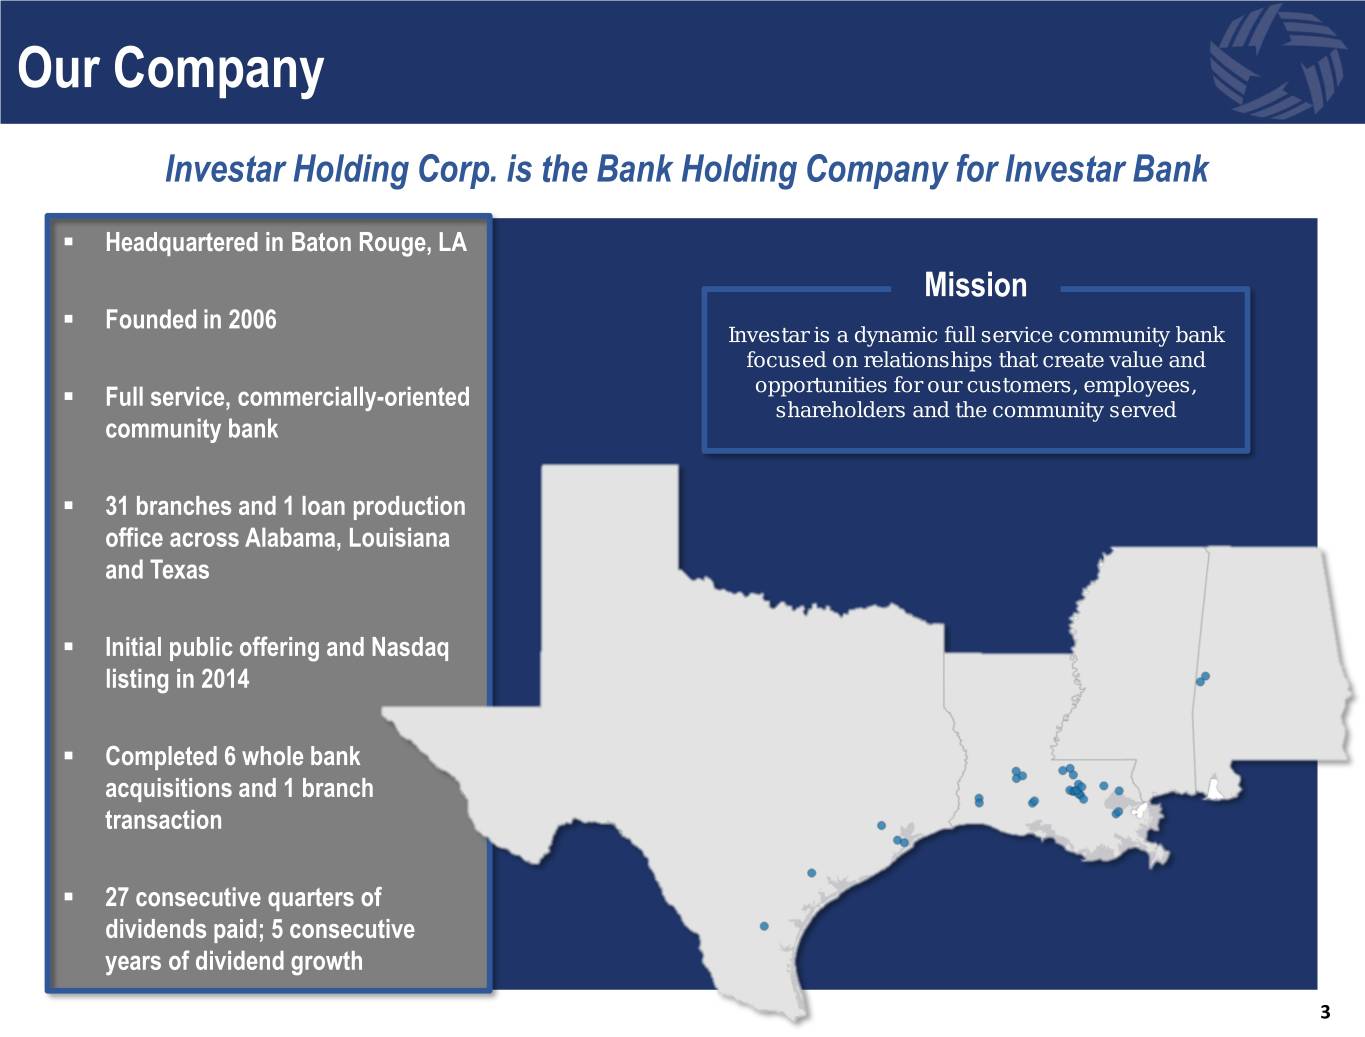
Our Company Investar Holding Corp. is the Bank Holding Company for Investar Bank . Headquartered in Baton Rouge, LA Mission . Founded in 2006 Investar is a dynamic full service community bank focused on relationships that create value and opportunities for our customers, employees, . Full service, commercially-oriented shareholders and the community served community bank . 31 branches and 1 loan production office across Alabama, Louisiana and Texas . Initial public offering and Nasdaq listing in 2014 . Completed 6 whole bank acquisitions and 1 branch transaction . 27 consecutive quarters of dividends paid; 5 consecutive years of dividend growth 3

Financial Highlights – 3rd Quarter 2020 Tangible Book Value2 Growth 3rd Quarter Results Balance Sheet (in thousands) . Increased by $0.45 during the quarter to $19.27 per share, the highest level in the Company’s history Assets $2,323,245 Net Loans $1,810,636 . Repurchased 211,132 shares in the quarter at an average price of $13.92 and 640,605 shares at an average price of $16.80 year to date Deposits $1,834,449 Equity $237,267 Profitability Holding Company Capital . Pre-Tax, Pre-Provision Net Income2 increased by 3.4% quarter-over-quarter and TCE / TA 8.94% 12.0% year-over-year Leverage Ratio1 9.29% . Net Interest Margin remained stable at 3.46% quarter-over-quarter; decrease of 2 Common Equity Tier 1 Ratio1 10.95% basis points year-over-year Tier 1 Ratio1 11.30% 1 Loan Deferrals Total Risk Weighted Ratio 14.62% . $56.5 million, or 3.1% of the total loan portfolio, was in the Company’s deferral Profitability (3rd quarter) program as of September 30, 2020; down from $490.3 million as of June 30, 2020 Net Interest Margin 3.46% . 6.5% of original deferrals have requested a second 90-day deferral period ROAA 0.77% ROAE 7.41% Deposits Transformation Net Income $4,467 2 . 3Q Total Deposit Interest Rate2 was 0.74%; a reduction of 57 basis points on a year- Pre-Tax, Pre-Provision Income $8,056 over-year basis Per Share Information . Noninterest-bearing deposits accounted for 24.6% of total deposits as of September 2 30, 2020; an increase from 18.4% as of September 30, 2019 Tangible Book Value $19.27 Earnings $0.41 . Time deposits accounted for 32.2% of total deposits as of September 30, 2020; a Dividends $0.07 decrease from 43.1% as of September 30, 2019 1 Estimated 2 Non-GAAP financial measure; please see appendix for additional details 4
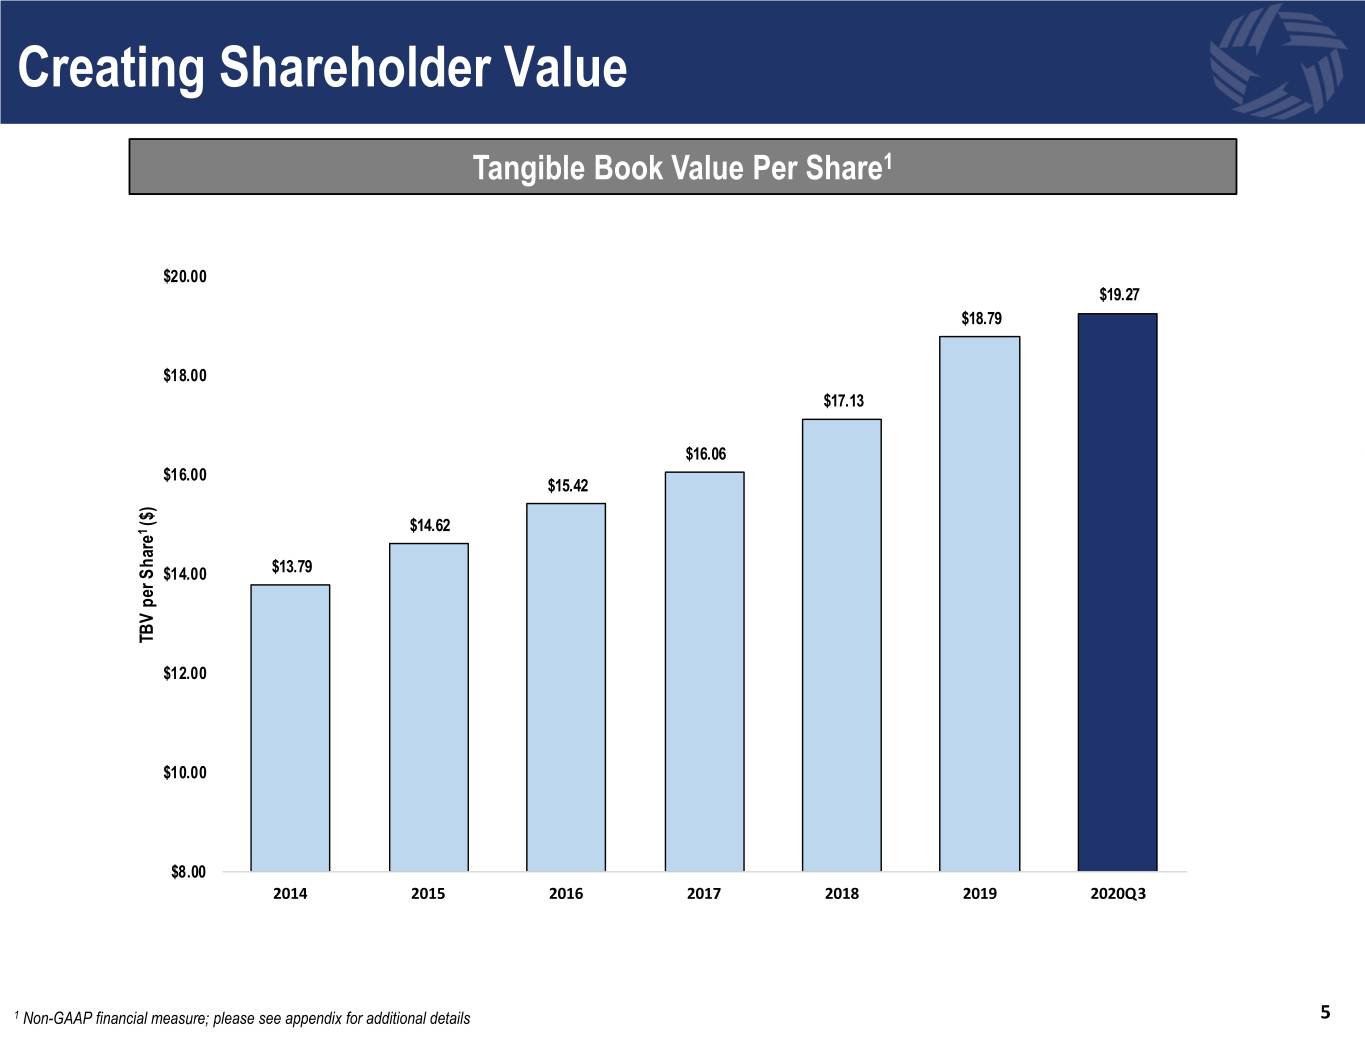
Creating Shareholder Value Tangible Book Value Per Share1 $20.00 $19.27 $18.79 $18.00 $17.13 $16.06 $16.00 $15.42 ($) 1 $14.62 $14.00 $13.79 TBV TBV perShare $12.00 $10.00 $8.00 2014 2015 2016 2017 2018 2019 2020Q3 1 Non-GAAP financial measure; please see appendix for additional details 5
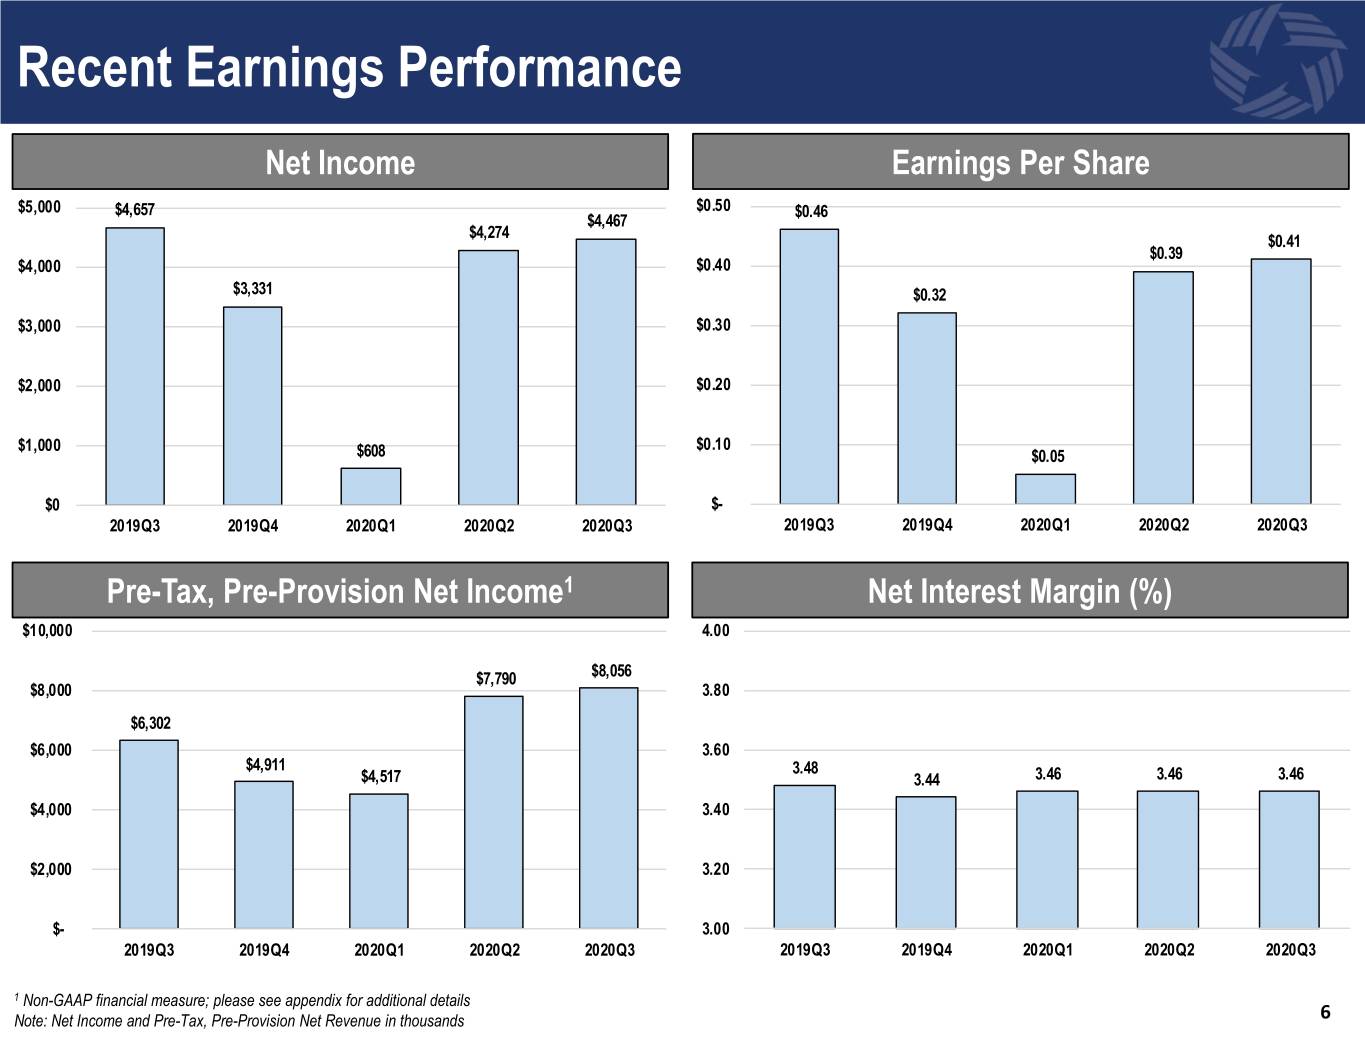
Recent Earnings Performance NetNet Income Income EarningsEarnings Per Share Share $5,000 $4,657 $0.50 $0.46 $4,467 $4,274 $0.41 $0.39 $4,000 $0.40 $3,331 $0.32 $3,000 $0.30 $2,000 $0.20 $1,000 $0.10 $608 $0.05 $0 $- 2019Q3 2019Q4 2020Q1 2020Q2 2020Q3 2019Q3 2019Q4 2020Q1 2020Q2 2020Q3 Pre-Tax,Pre- Provision,Pre-Provision Pre-Tax Net Earnings Income1 NetNet Interest Interest Margin Margin (%) (%) $10,000 4.00 $7,790 $8,056 $8,000 3.80 $6,302 $6,000 3.60 $4,911 3.48 $4,517 3.44 3.46 3.46 3.46 $4,000 3.40 $2,000 3.20 $- 3.00 2019Q3 2019Q4 2020Q1 2020Q2 2020Q3 2019Q3 2019Q4 2020Q1 2020Q2 2020Q3 1 Non-GAAP financial measure; please see appendix for additional details Note: Net Income and Pre-Tax, Pre-Provision Net Revenue in thousands 6

Total Assets Investar Has Completed 6 Whole Bank Acquisitions and 1 Branch Transaction $2,323.2 $2,148.9 $832.0 Total Assets CAGR: 37.2% $1,786.5 $783.3 Organic Assets CAGR: 32.9% $1,622.7 (Since 2006) $552.9 $552.9 $1,159.0 $1,031.6 $150.1 $881.2 $150.1 $150.1 $1,491.2 $634.9 $1,365.6 $1,233.6 $150.1 $1,008.9 $1,069.8 $375.4 $881.5 $279.3 $50.9 $731.1 $50.9 $484.8 $324.5 $209.5 $228.4 $29.8 $142.7 $173.9 $63.8 2006 2007 2008 2009 2010 2011 2012 2013 2014 2015 2016 2017 2018 2019 YTD 2020 Organic Assets Acquired Assets (in thousands) Note: 2020 YTD information as of September 30, 2020 7

Pandemic Response . Enacted business continuity plans to continue to serve customers while protecting the health of our employees . Branches remain open, offering both drive-thru services and limited appointments . In response to the pandemic, in the first quarter of 2020, the Company instituted a 90-day deferral program for affected customers and continues to offer assistance to those experiencing financial hardships as a result of the pandemic . Beginning in the second quarter of 2020, the Company participated as a lender in the SBA and U.S. Department of Treasury’s Paycheck Protection Program (“PPP”) as established by the Coronavirus Aid, Relief, and Economic Security Act (“CARES Act”) PPP Loans Loan Balance Number of Avg. Loan ($000s) Loans Balance ($000s) Loans: $0 - $150,000 $28,955 901 $32 $150,000 - $500,000 27,212 104 262 $500,000+ 57,050 51 1,119 Total $113,217 1,056 $107 Principal Payments - Gross PPP Loans $113,217 Deferred Loan Fees and Costs 2,943 Net PPP Loans $110,274 8

Loan Portfolio Update . Loan deferrals of 3.1% of total loan portfolio as of the most recent quarter; Consumer & Other 1.2% down from 27.0% as of June 30, 2020 Construction & Development . As of September 30, 2020, of the total number of loans on deferral, 73% 11.3% have deferrals on principal and interest, 17% have deferrals on principal Commercial & Industrial only, and 10% have deferrals on interest only 21.5% 1-4 Family Residential . 6.5% of loan deferral customers have requested a second 90-day deferral 18.6% period as of September 30, 2020 Nonowner-Occupied Commercial Real Estate Multifamily . Excluding PPP loans, Oil & Gas loans made up 2.7% of the total loan 22.1% 3.2% portfolio as of the most recent quarter Owner-Occupied Farm Commercial Real Estate 1.4% 20.7% . Food Services, Hospitality and Entertainment loans represented equaled 3.1% of the total loan portfolio as of the most recent quarter, excluding As of September 30, 2020 PPP loans As of 3/31/20 As of 6/30/20 As of 9/30/20 Amount Percent Amount Percent Amount Percent Loan Type Total Loans Deferred Deferred Total Loans Deferred Deferred Total Loans Deferred Deferred Construction & Development $191,597 $3,882 2.0% $199,149 $50,711 25.5% $206,751 $1,427 0.7% 1-4 Family Residential 328,730 14,294 4.3% 326,102 73,784 22.6% 339,364 9,755 2.9% Multifamily 61,709 - 0.0% 60,617 39,567 65.3% 57,734 3,484 6.0% Farm 29,373 - 0.0% 28,845 2,506 8.7% 26,005 357 1.4% Owner-Occupied Commercial Real Estate 370,209 13,363 3.6% 371,783 98,181 26.4% 379,490 10,928 2.9% Nonowner-Occupied Commercial Real Estate 406,145 10,334 2.5% 411,776 178,091 43.2% 404,748 12,161 3.0% Commercial & Industrial 313,850 12,506 4.0% 390,085 45,567 11.7% 392,955 18,150 4.6% Consumer & Other 28,181 613 2.2% 25,344 1,891 7.5% 22,633 257 1.1% Total $1,729,794 $54,992 3.2% $1,813,701 $490,298 27.0% $1,829,680 $56,519 3.1% 9
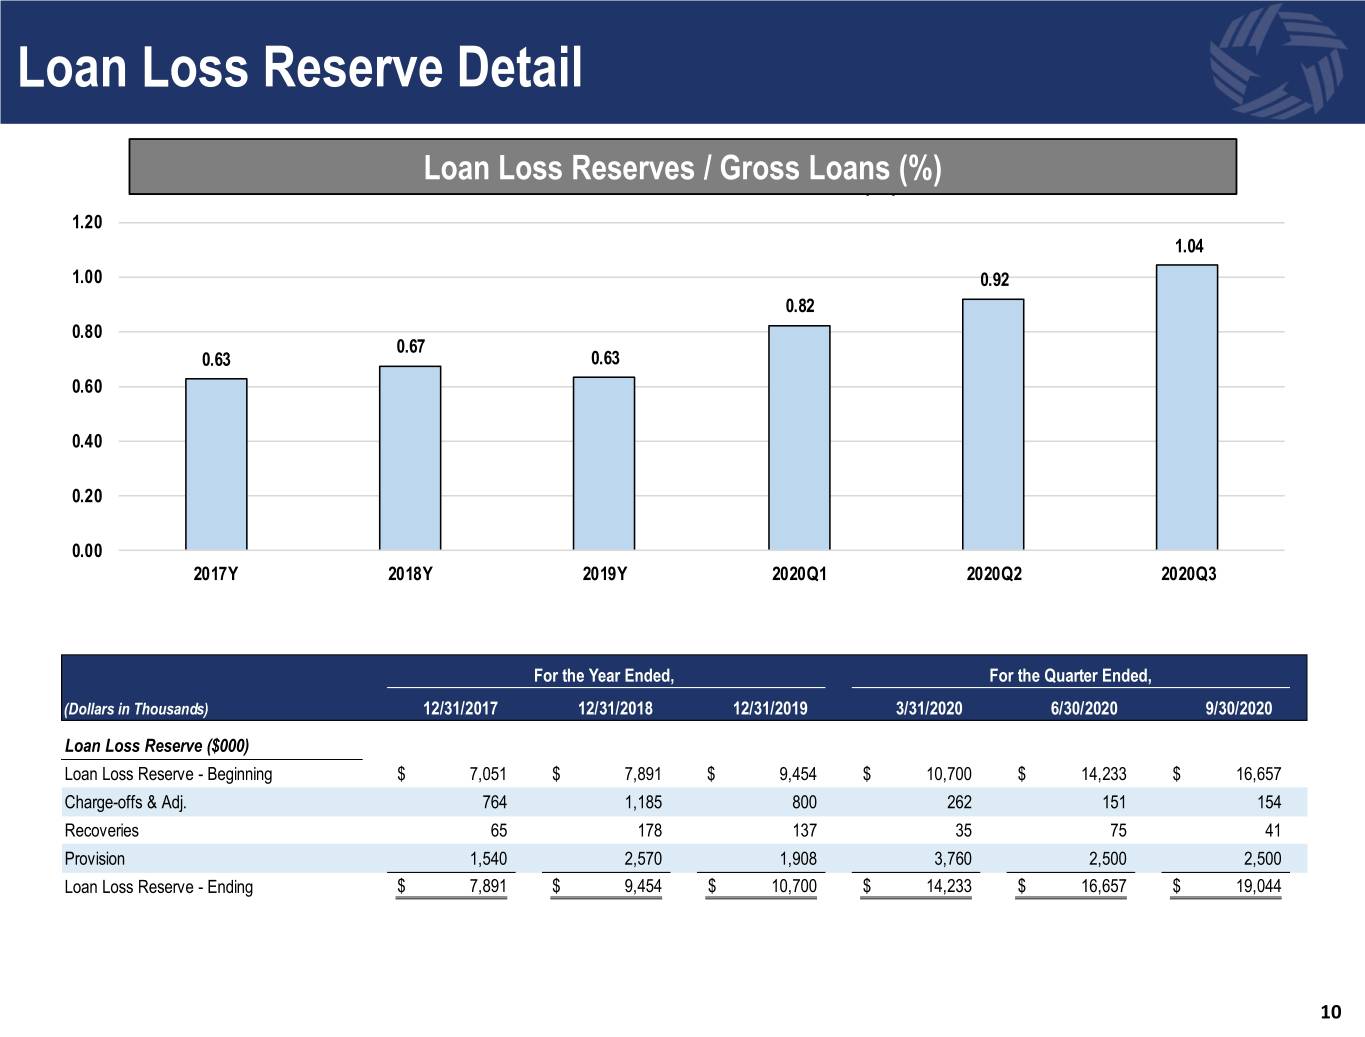
Loan Loss Reserve Detail LoanLoan Loss Loss Reserves Reserve / /Gross Gross Loans Loans (%) (%) 1.20 1.04 1.00 0.92 0.82 0.80 0.67 0.63 0.63 0.60 0.40 0.20 0.00 2017Y 2018Y 2019Y 2020Q1 2020Q2 2020Q3 For the Year Ended, For the Quarter Ended, (Dollars in Thousands) 12/31/2017 12/31/2018 12/31/2019 3/31/2020 6/30/2020 9/30/2020 Loan Loss Reserve ($000) Loan Loss Reserve - Beginning $ 7,051 $ 7,891 $ 9,454 $ 10,700 $ 14,233 $ 16,657 Charge-offs & Adj. 764 1,185 800 262 151 154 Recoveries 65 178 137 35 75 41 Provision 1,540 2,570 1,908 3,760 2,500 2,500 Loan Loss Reserve - Ending $ 7,891 $ 9,454 $ 10,700 $ 14,233 $ 16,657 $ 19,044 10
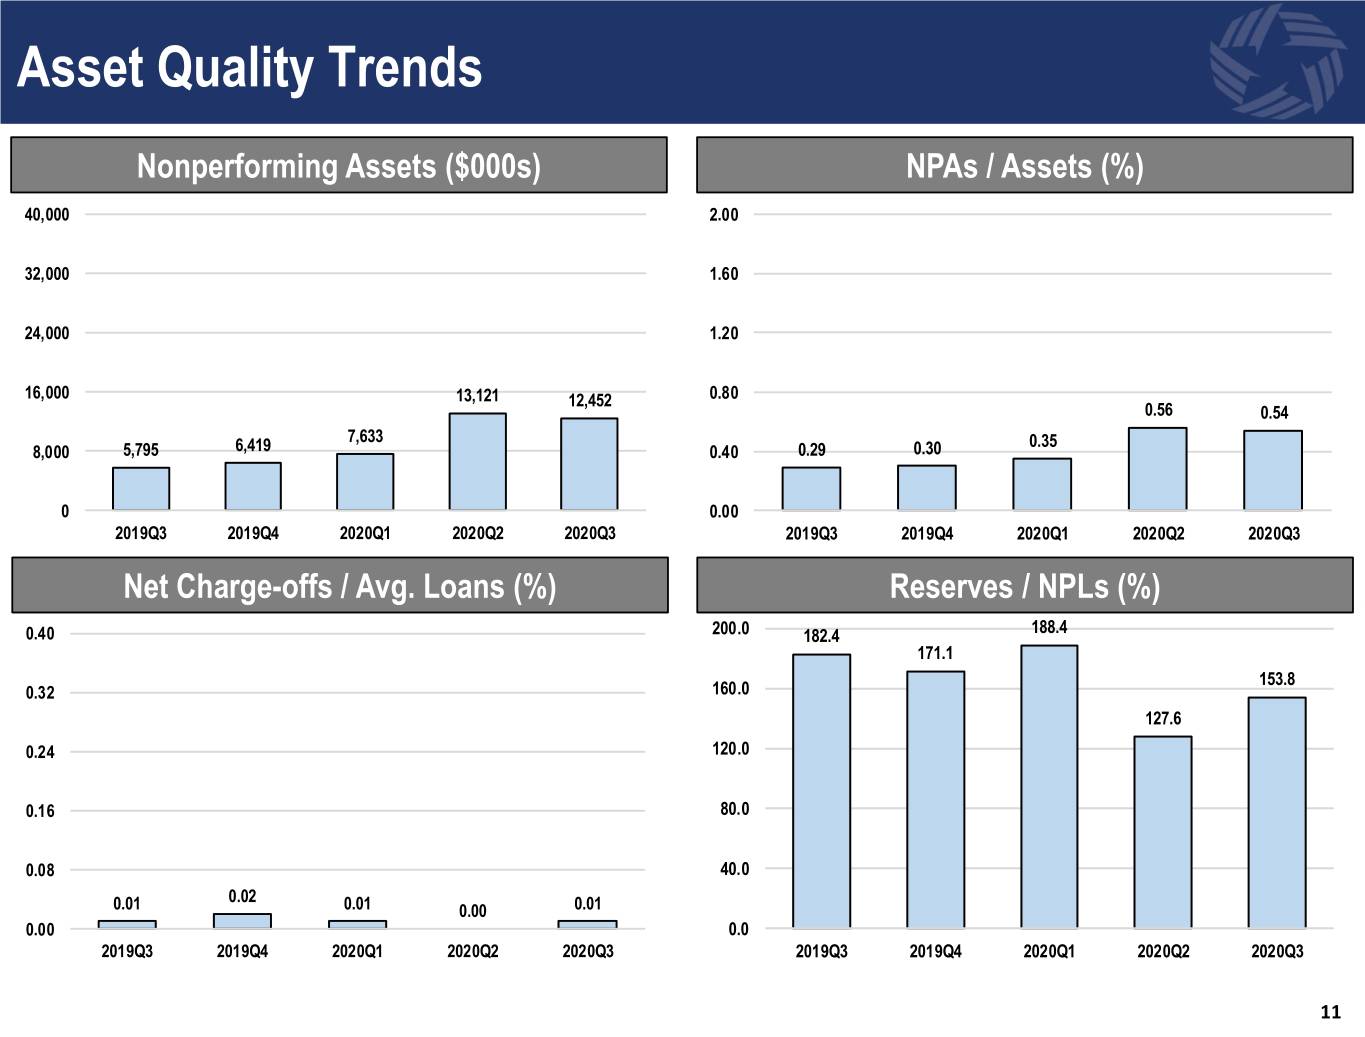
Asset Quality Trends Nonperforming Assets ($000s) NPAs / Assets (%) 40,000 2.00 32,000 1.60 24,000 1.20 16,000 13,121 12,452 0.80 0.56 0.54 7,633 0.35 8,000 5,795 6,419 0.40 0.29 0.30 0 0.00 2019Q3 2019Q4 2020Q1 2020Q2 2020Q3 2019Q3 2019Q4 2020Q1 2020Q2 2020Q3 Net Charge-offs / Avg. Loans (%) Reserves / NPLs (%) 0.40 200.0 182.4 188.4 171.1 153.8 0.32 160.0 127.6 0.24 120.0 0.16 80.0 0.08 40.0 0.02 0.01 0.01 0.00 0.01 0.00 0.0 2019Q3 2019Q4 2020Q1 2020Q2 2020Q3 2019Q3 2019Q4 2020Q1 2020Q2 2020Q3 11
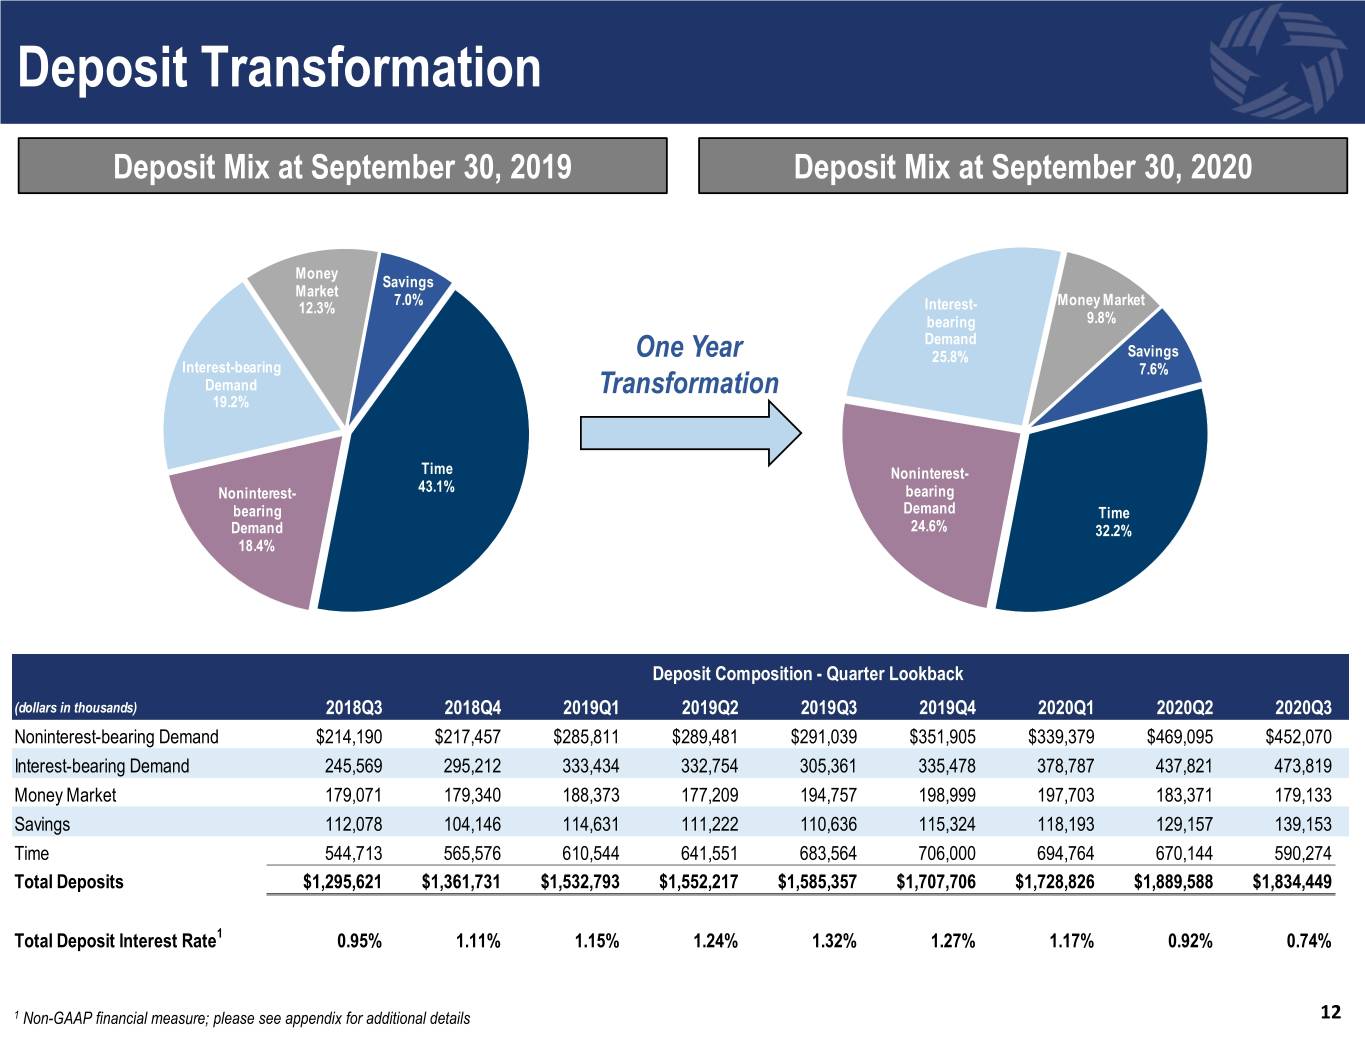
Deposit Transformation Deposit Mix at September 30, 2019 Deposit Mix at September 30, 2020 Money Savings Market 7.0% Money Market 12.3% Interest- bearing 9.8% Demand One Year 25.8% Savings Interest-bearing 7.6% Demand Transformation 19.2% Time Noninterest- Noninterest- 43.1% bearing bearing Demand Time Demand 24.6% 32.2% 18.4% Deposit Composition - Quarter Lookback (dollars in thousands) 2018Q3 2018Q4 2019Q1 2019Q2 2019Q3 2019Q4 2020Q1 2020Q2 2020Q3 Noninterest-bearing Demand $214,190 $217,457 $285,811 $289,481 $291,039 $351,905 $339,379 $469,095 $452,070 Interest-bearing Demand 245,569 295,212 333,434 332,754 305,361 335,478 378,787 437,821 473,819 Money Market 179,071 179,340 188,373 177,209 194,757 198,999 197,703 183,371 179,133 Savings 112,078 104,146 114,631 111,222 110,636 115,324 118,193 129,157 139,153 Time 544,713 565,576 610,544 641,551 683,564 706,000 694,764 670,144 590,274 Total Deposits $1,295,621 $1,361,731 $1,532,793 $1,552,217 $1,585,357 $1,707,706 $1,728,826 $1,889,588 $1,834,449 Total Deposit Interest Rate1 0.95% 1.11% 1.15% 1.24% 1.32% 1.27% 1.17% 0.92% 0.74% 1 Non-GAAP financial measure; please see appendix for additional details 12

APPENDIX

Non-GAAP Reconciliation (Dollars in thousands, except per share data) As of September 30, As of December 31, 2020 2019 2018 2017 2016 2015 Tangible Common Equity: Total Stockholders' Equity $ 237,267 $ 241,976 $ 182,262 $ 172,729 $ 112,757 $ 109,350 Adjustments: Goodwill (28,144) (26,132) (17,424) (17,086) (2,684) (2,684) Other Intangibles (4,327) (4,803) (2,263) (2,740) (450) (491) Tangible Common Equity $ 204,796 $ 211,041 $ 162,575 $ 152,903 $ 109,623 $ 106,175 Common Shares Outstanding 10,629,586 11,228,775 9,484,219 9,514,926 7,101,851 7,264,282 Book Value Per Common Share $ 22.32 $ 21.55 $ 19.22 $ 18.15 $ 15.88 $ 15.05 Tangible Book Value Per Common Share $ 19.27 $ 18.79 $ 17.14 $ 16.07 $ 15.44 $ 14.62 Tangible Assets: Total Assets $ 2,323,245 $ 2,148,916 $ 1,786,469 $ 1,622,734 $ 1,158,960 $ 1,031,555 Adjustments: Goodwill (28,144) (26,132) (17,424) (17,086) (2,684) (2,684) Other Intangibles (4,327) (4,803) (2,263) (2,740) (450) (491) Tangible Assets $ 2,290,774 $ 2,117,981 $ 1,766,782 $ 1,602,908 $ 1,155,826 $ 1,028,380 Total Stockholders' Equity to Total Assets Ratio 10.21% 11.26% 10.20% 10.64% 9.73% 10.60% Tangible Common Equity to Tangible Assets Ratio 8.94% 9.96% 9.20% 9.54% 9.48% 10.32% 14
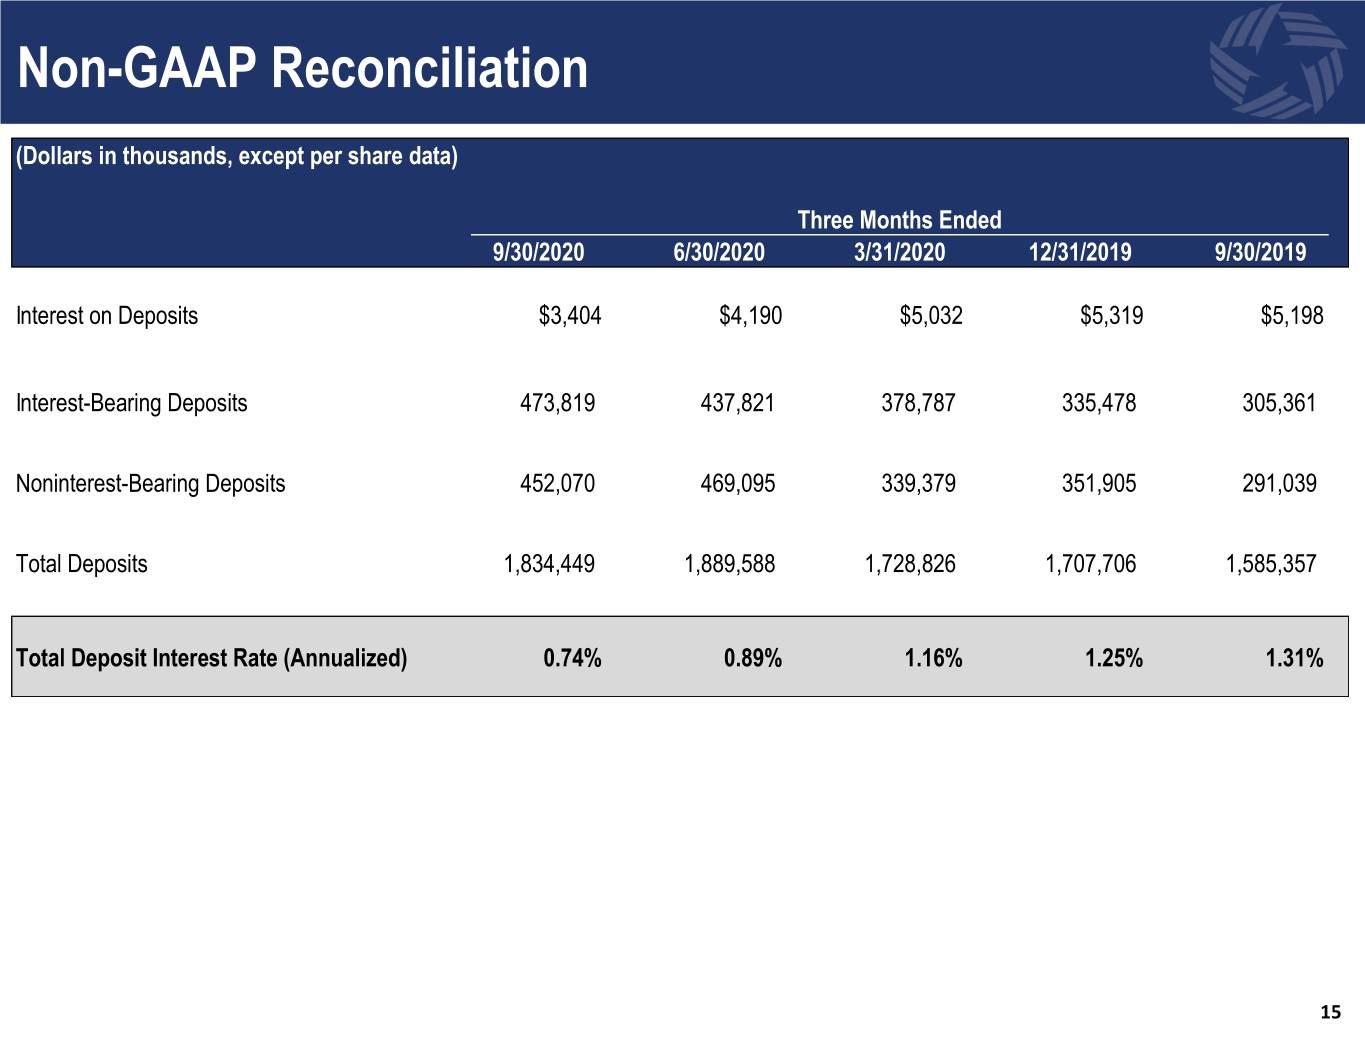
Non-GAAP Reconciliation (Dollars in thousands, except per share data) Three Months Ended 9/30/2020 6/30/2020 3/31/2020 12/31/2019 9/30/2019 Interest on Deposits $3,404 $4,190 $5,032 $5,319 $5,198 Interest-Bearing Deposits 473,819 437,821 378,787 335,478 305,361 Noninterest-Bearing Deposits 452,070 469,095 339,379 351,905 291,039 Total Deposits 1,834,449 1,889,588 1,728,826 1,707,706 1,585,357 Total Deposit Interest Rate (Annualized) 0.74% 0.89% 1.16% 1.25% 1.31% 15
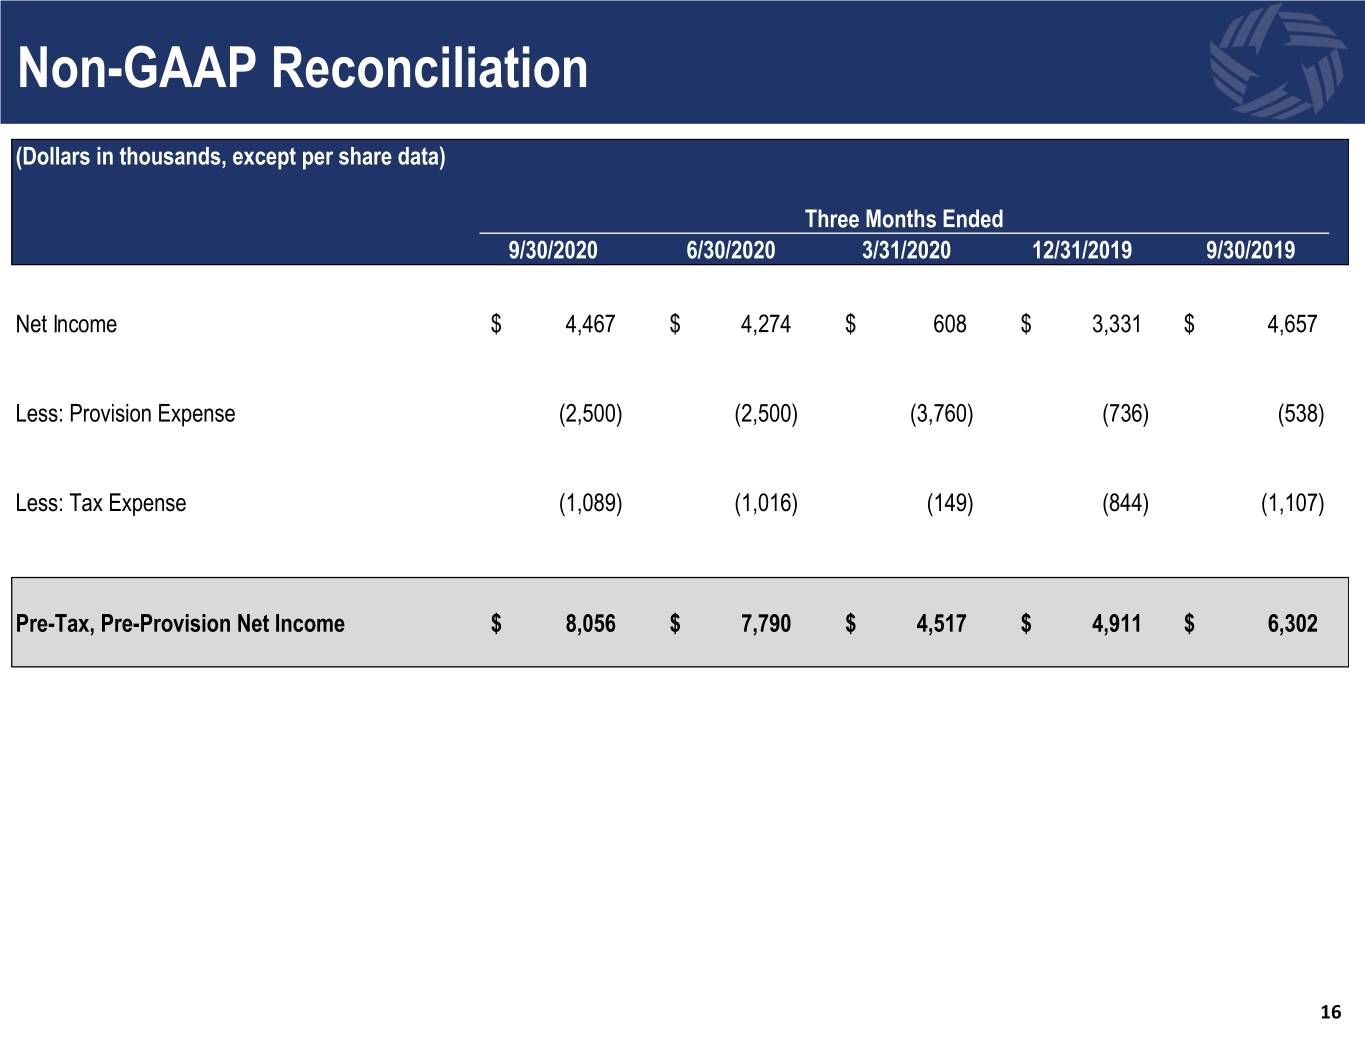
Non-GAAP Reconciliation (Dollars in thousands, except per share data) Three Months Ended 9/30/2020 6/30/2020 3/31/2020 12/31/2019 9/30/2019 Net Income $ 4,467 $ 4,274 $ 608 $ 3,331 $ 4,657 Less: Provision Expense (2,500) (2,500) (3,760) (736) (538) Less: Tax Expense (1,089) (1,016) (149) (844) (1,107) Pre-Tax, Pre-Provision Net Income $ 8,056 $ 7,790 $ 4,517 $ 4,911 $ 6,302 16
