Attached files
| file | filename |
|---|---|
| 8-K - 8-K - Kearny Financial Corp. | krny-8k_20201022.htm |
Annual Meeting of Stockholders October 22, 2020 10:00 AM

Welcome and Introductions Craig L. Montanaro Director, President and Chief Executive Officer
John J. Mazur, Jr., Chairman Theodore J. Aanensen Raymond E. Chandonnet John N. Hopkins Catherine A. Lawton Joseph P. Mazza John F. McGovern Craig L. Montanaro Leopold W. Montanaro Christopher Petermann Charles J. Pivirotto John F. Regan Board of Directors
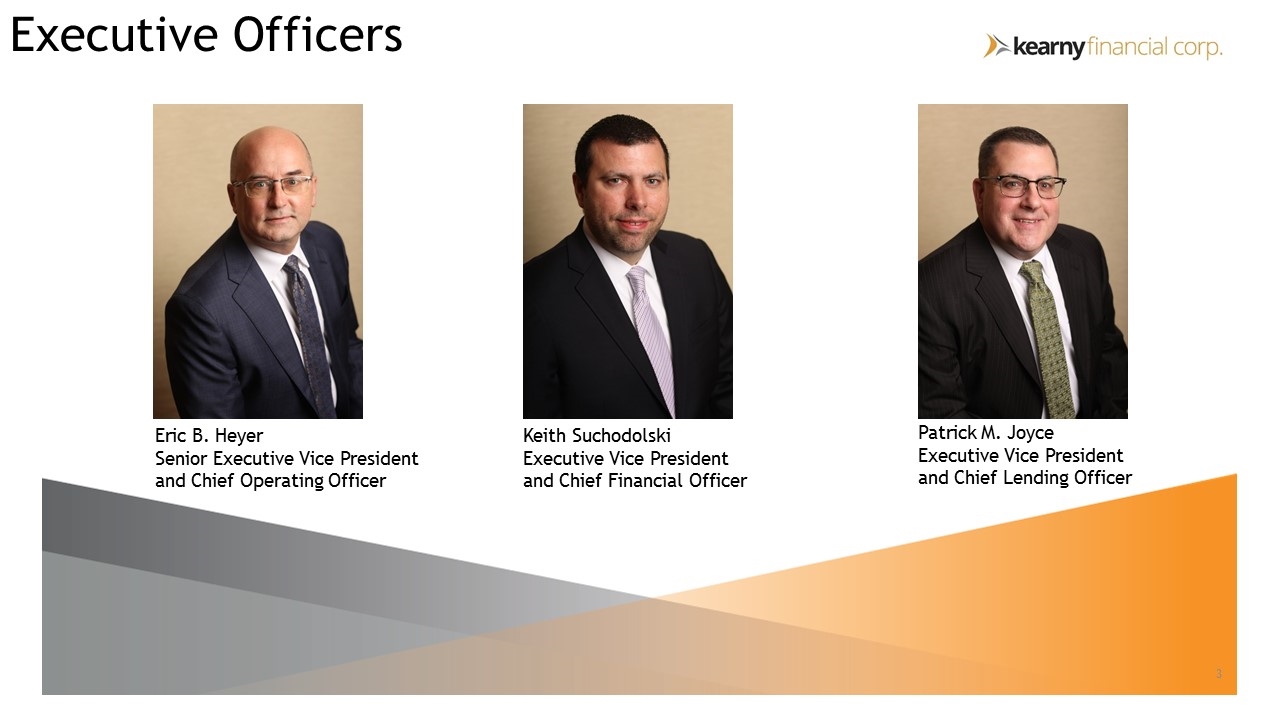
Executive Officers Eric B. Heyer Senior Executive Vice President and Chief Operating Officer Keith Suchodolski Executive Vice President and Chief Financial Officer Patrick M. Joyce Executive Vice President and Chief Lending Officer
Anthony V. Bilotta, Jr. Executive Vice President and Chief Banking Officer Thomas D. DeMedici Executive Vice President and Chief Credit Officer John V. Dunne Executive Vice President and Chief Risk Officer Erika K. Parisi Executive Vice President and Chief Administrative Officer Timothy A. Swansson Executive Vice President and Chief Technology and Innovation Officer Executive Officers
Corporate Secretary Kearny Financial Corp. Gail Corrigan Senior Vice President Legal Counsel Luse Gorman, PC Marc Levy, Esq. Independent Registered Public Accounting Firm Crowe LLP Bill Hoving Audit Partner Inspector of Election Computershare Amilja Regan Assistant Vice President Other Participants
Business of the Meeting Proposals Election of five directors Ratification of the appointment of Crowe LLP as the Company’s independent auditor for the fiscal year ending June 30, 2021 Advisory, non-binding resolution to approve our executive compensation as described in the Proxy Statement Report of Inspector of Election
Theodore J. Aanensen Three year term to expire in 2023 Joseph P. Mazza Three year term to expire in 2023 Christopher Petermann Two year term to expire in 2022 Charles J. Pivirotto Three year term to expire in 2023 John F. Regan Three year term to expire in 2023 Proposal #1 Election of Directors
Ratification of the appointment of Crowe LLP as the Company’s independent auditor for the fiscal year ending June 30, 2021 Proposal #2
Advisory, non-binding resolution to approve our executive compensation as described in the Proxy Statement Proposal #3
Review of Financial Results Fiscal Year Ended June 30, 2020
This presentation may include certain “forward-looking statements,” which are made in good faith by Kearny Financial Corp. (the “Company”) pursuant to the “safe harbor” provisions of the Private Securities Litigation Reform Act of 1995. These forward-looking statements are subject to risks and uncertainties, such as statements of the Company’s plans, objectives, expectations, estimates and intentions that are subject to change based on various important factors (some of which are beyond the Company’s control). In addition to the factors described under Item 1A. Risk Factors in the Company’s Annual Report on Form 10-K, the following factors, among others, could cause the Company’s financial performance to differ materially from the plans, objectives, expectations, estimates and intentions expressed in such forward-looking statements: the strength of the United States economy in general and the strength of the local economy in which the Company conducts operations, The effects of COVID-19 on our business, financial condition or results of operations, the effects of and changes in, trade, monetary and fiscal policies and laws, including interest rate policies of the Board of Governors of the Federal Reserve System, inflation, interest rates, market and monetary fluctuations, the impact of changes in laws, regulations and government policies regarding financial institutions (including laws concerning taxation, banking, securities and insurance), changes in accounting policies and practices, as may be adopted by regulatory agencies, the Financial Accounting Standards Board (“FASB”) or the Public Company Accounting Oversight Board, technological changes, competition among financial services providers, and the success of the Company at managing the risks involved in the foregoing and managing its business. The Company cautions that the foregoing list of important factors is not exhaustive. Readers should not place any undue reliance on any forward looking statements, which speak only as of the date made. The Company does not undertake any obligation to update any forward-looking statement, whether written or oral, that may be made from time to time by or on behalf of the Company. Forward Looking Statements
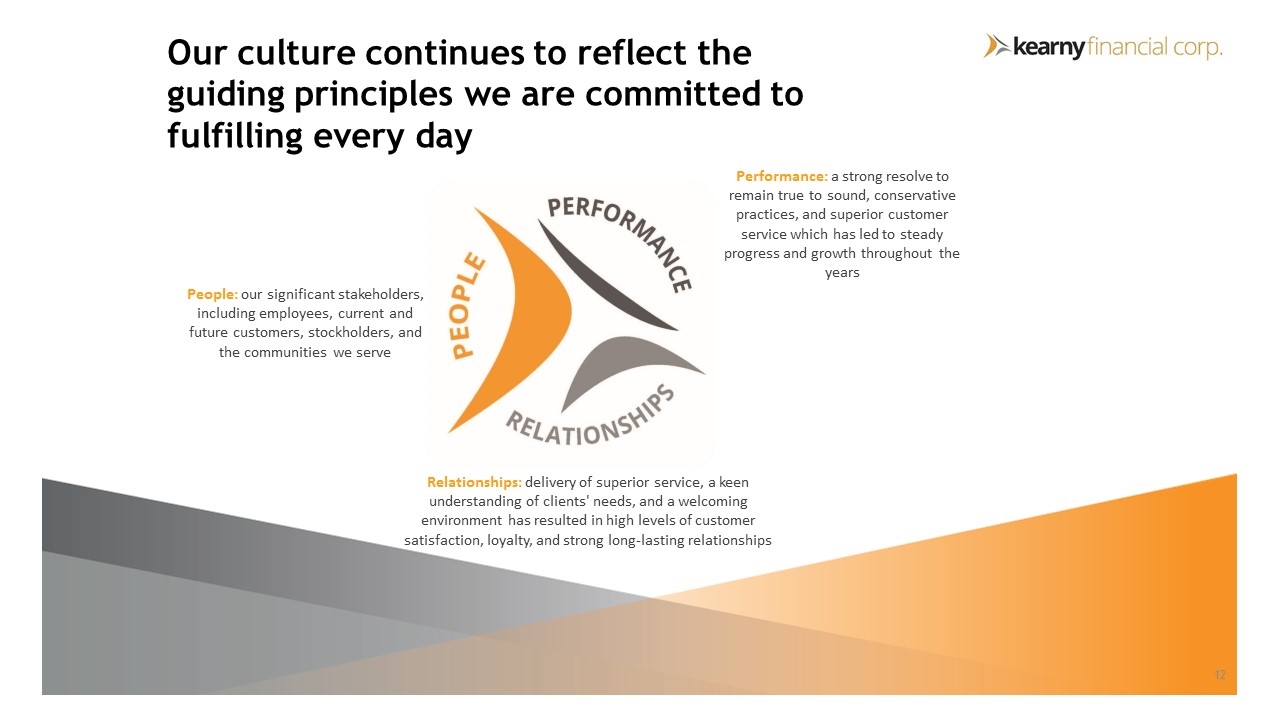
People: our significant stakeholders, including employees, current and future customers, stockholders, and the communities we serve Performance: a strong resolve to remain true to sound, conservative practices, and superior customer service which has led to steady progress and growth throughout the years Relationships: delivery of superior service, a keen understanding of clients' needs, and a welcoming environment has resulted in high levels of customer satisfaction, loyalty, and strong long-lasting relationships Our culture continues to reflect the guiding principles we are committed to fulfilling every day
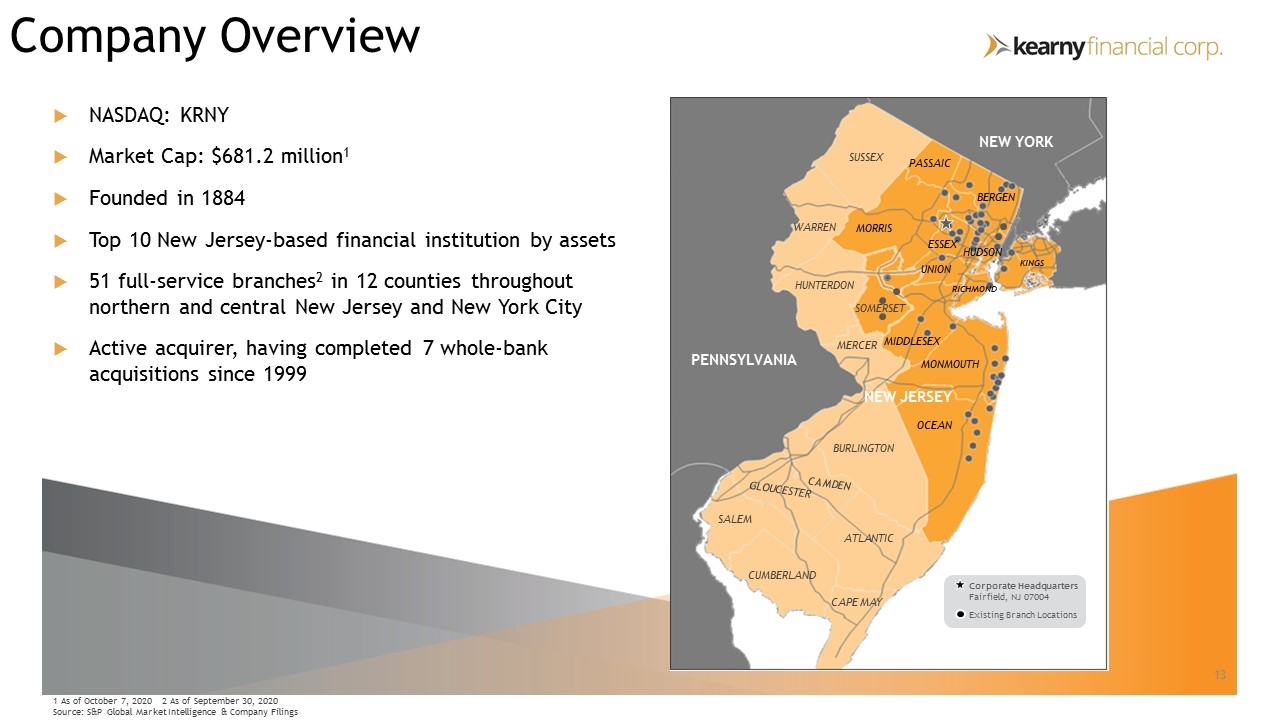
NASDAQ: KRNY Market Cap: $681.2 million1 Founded in 1884 Top 10 New Jersey-based financial institution by assets 51 full-service branches2 in 12 counties throughout northern and central New Jersey and New York City Active acquirer, having completed 7 whole-bank acquisitions since 1999 1 As of October 7, 2020 2 As of September 30, 2020 Source: S&P Global Market Intelligence & Company Filings Corporate Headquarters Fairfield, NJ 07004 Existing Branch Locations PENNSYLVANIA NEW YORK CUMBERLAND CAPE MAY ATLANTIC BURLINGTON GLOUCESTER SALEM CAMDEN MERCER HUNTERDON SOMERSET WARREN SUSSEX PASSAIC MORRIS ESSEX UNION MONMOUTH OCEAN RICHMOND KINGS HUDSON BERGEN MIDDLESEX NEW JERSEY Company Overview
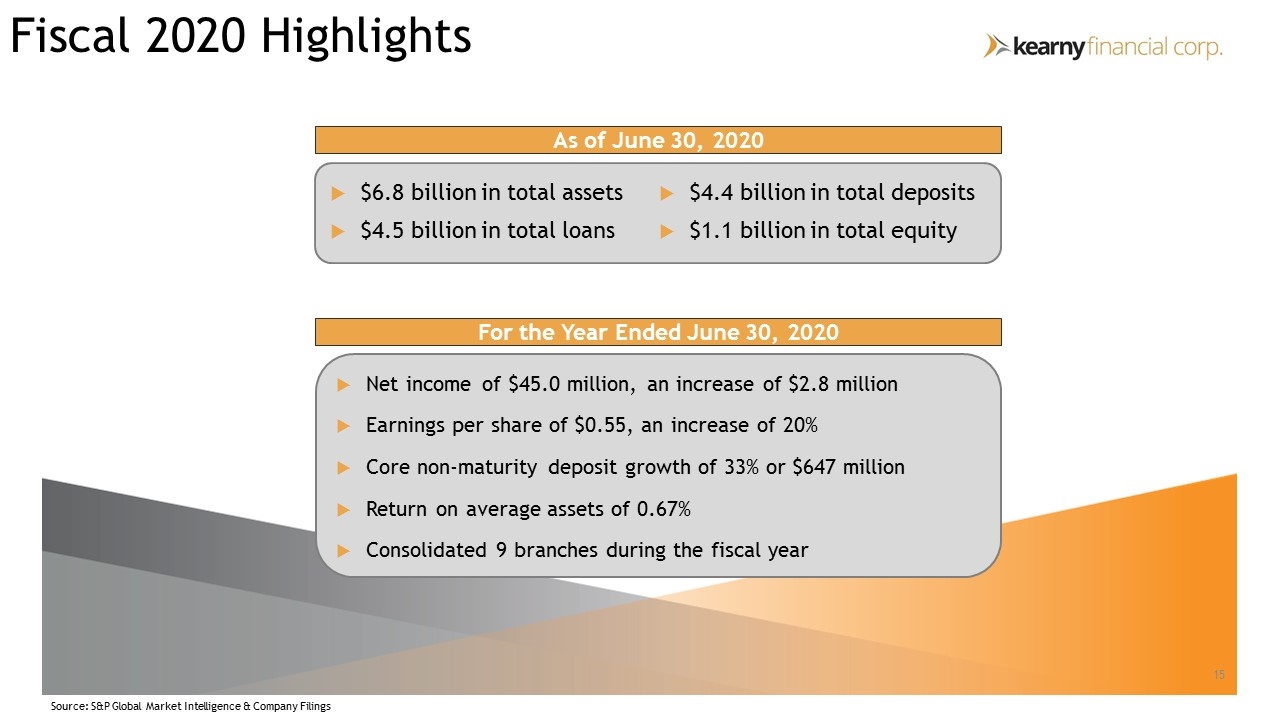
Fiscal 2020 Highlights $6.8 billion in total assets $4.5 billion in total loans $4.4 billion in total deposits $1.1 billion in total equity Net income of $45.0 million, an increase of $2.8 million Earnings per share of $0.55, an increase of 20% Core non-maturity deposit growth of 33% or $647 million Return on average assets of 0.67% Consolidated 9 branches during the fiscal year Source: S&P Global Market Intelligence & Company Filings As of June 30, 2020 For the Year Ended June 30, 2020
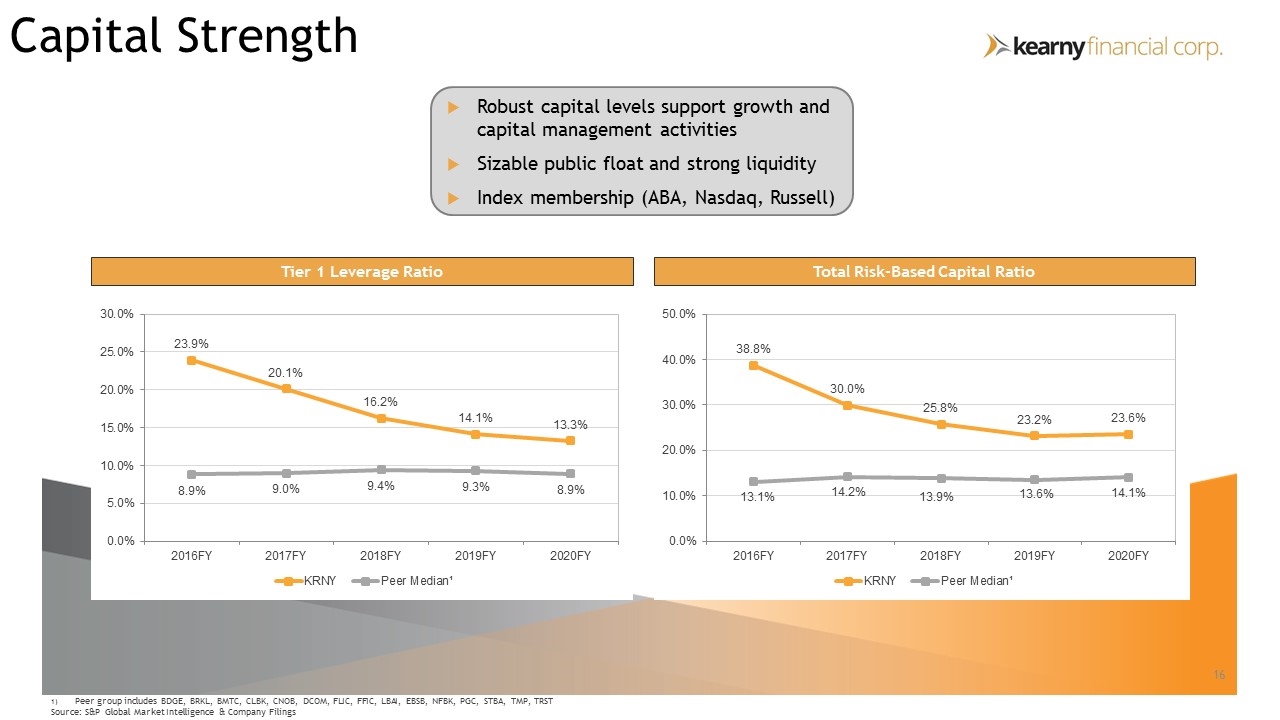
Capital Strength Tier 1 Leverage Ratio Total Risk-Based Capital Ratio Peer group includes BDGE, BRKL, BMTC, CLBK, CNOB, DCOM, FLIC, FFIC, LBAI, EBSB, NFBK, PGC, STBA, TMP, TRST Source: S&P Global Market Intelligence & Company Filings Robust capital levels support growth and capital management activities Sizable public float and strong liquidity Index membership (ABA, Nasdaq, Russell)
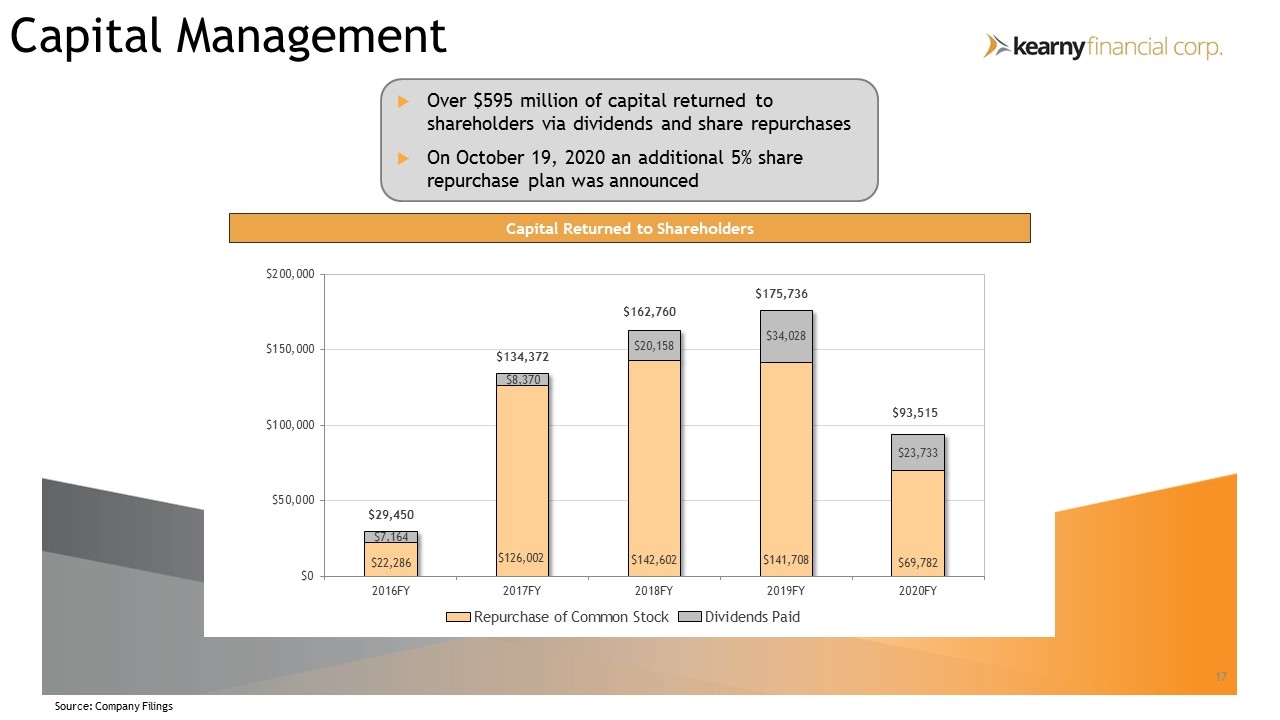
Capital Management Capital Returned to Shareholders Over $595 million of capital returned to shareholders via dividends and share repurchases On October 19, 2020 an additional 5% share repurchase plan was announced Source: Company Filings
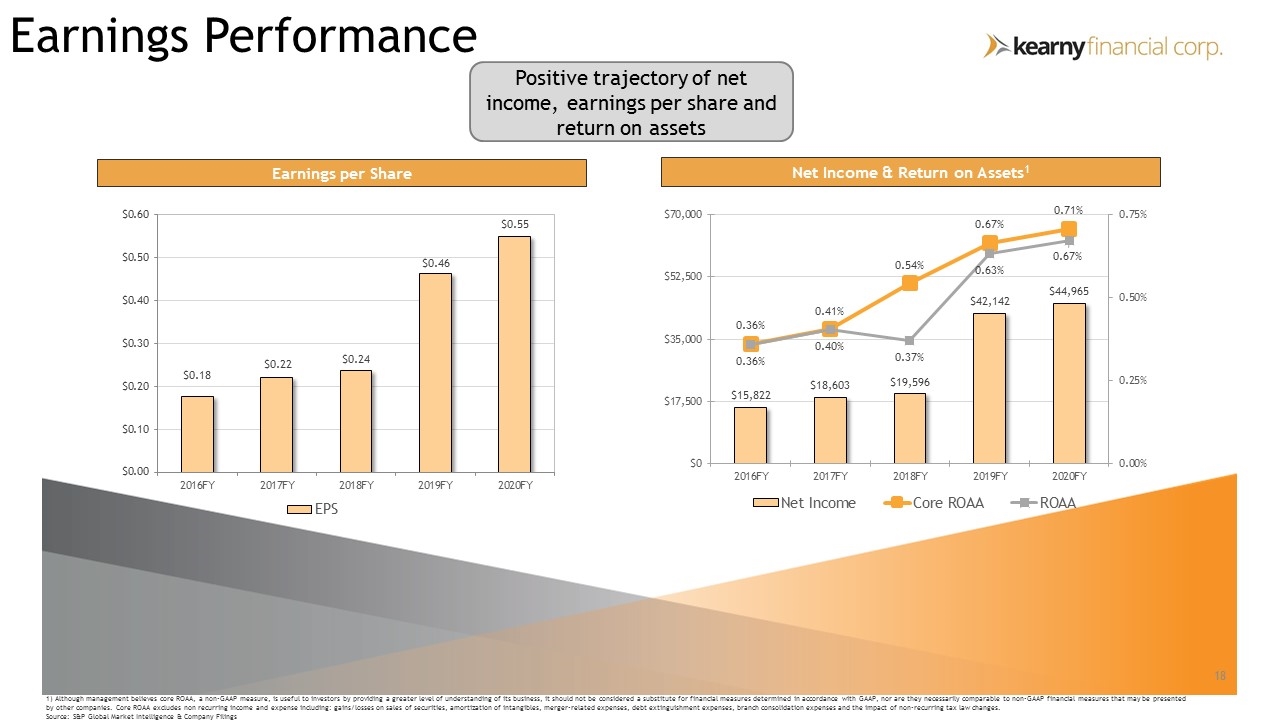
Earnings Performance Net Income & Return on Assets1 Earnings per Share 1) Although management believes core ROAA, a non-GAAP measure, is useful to investors by providing a greater level of understanding of its business, it should not be considered a substitute for financial measures determined in accordance with GAAP, nor are they necessarily comparable to non-GAAP financial measures that may be presented by other companies. Core ROAA excludes non recurring income and expense including: gains/losses on sales of securities, amortization of intangibles, merger-related expenses, debt extinguishment expenses, branch consolidation expenses and the impact of non-recurring tax law changes. Source: S&P Global Market Intelligence & Company Filings Positive trajectory of net income, earnings per share and return on assets
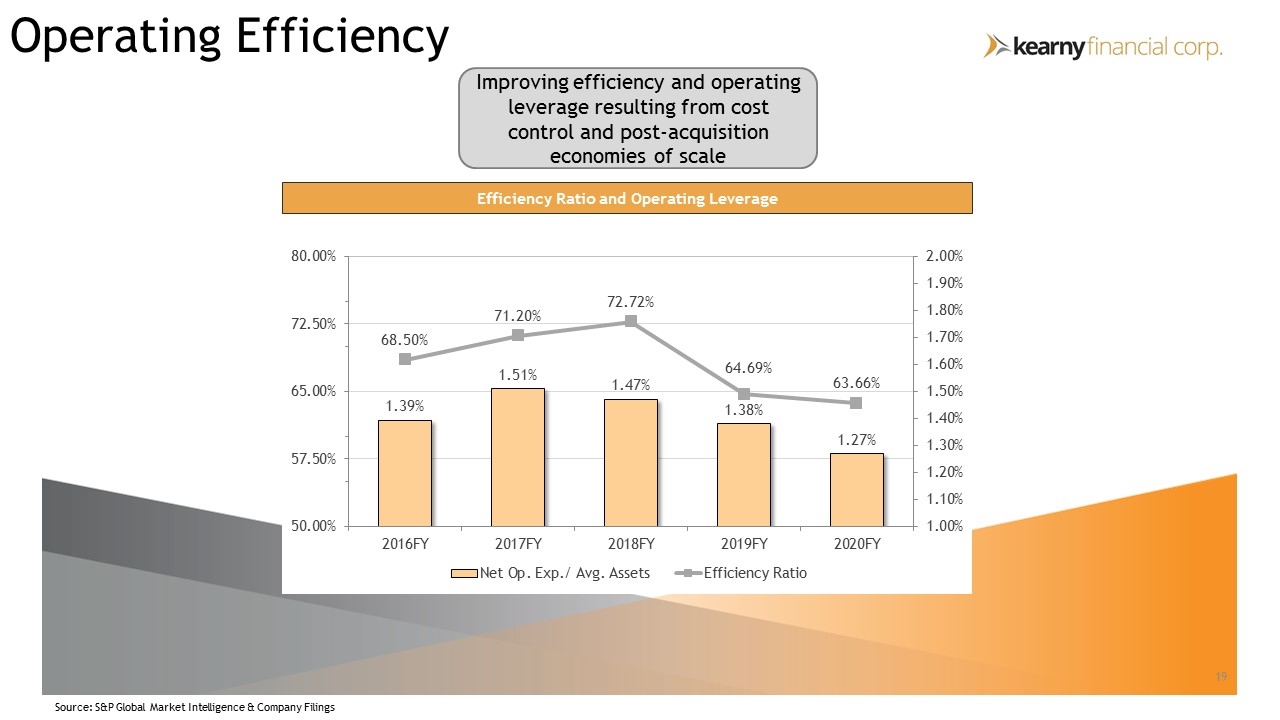
Operating Efficiency Efficiency Ratio and Operating Leverage Source: S&P Global Market Intelligence & Company Filings Improving efficiency and operating leverage resulting from cost control and post-acquisition economies of scale
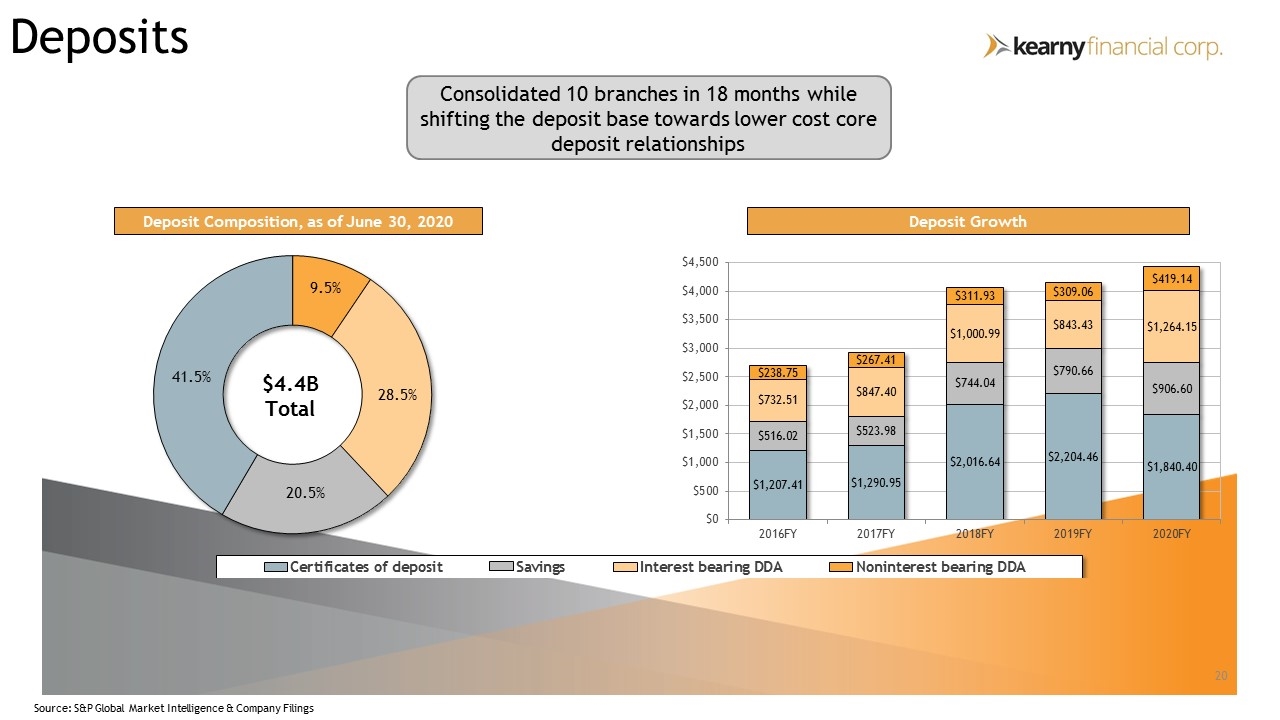
Deposits Consolidated 10 branches in 18 months while shifting the deposit base towards lower cost core deposit relationships Deposit Composition, as of June 30, 2020 Deposit Growth Source: S&P Global Market Intelligence & Company Filings
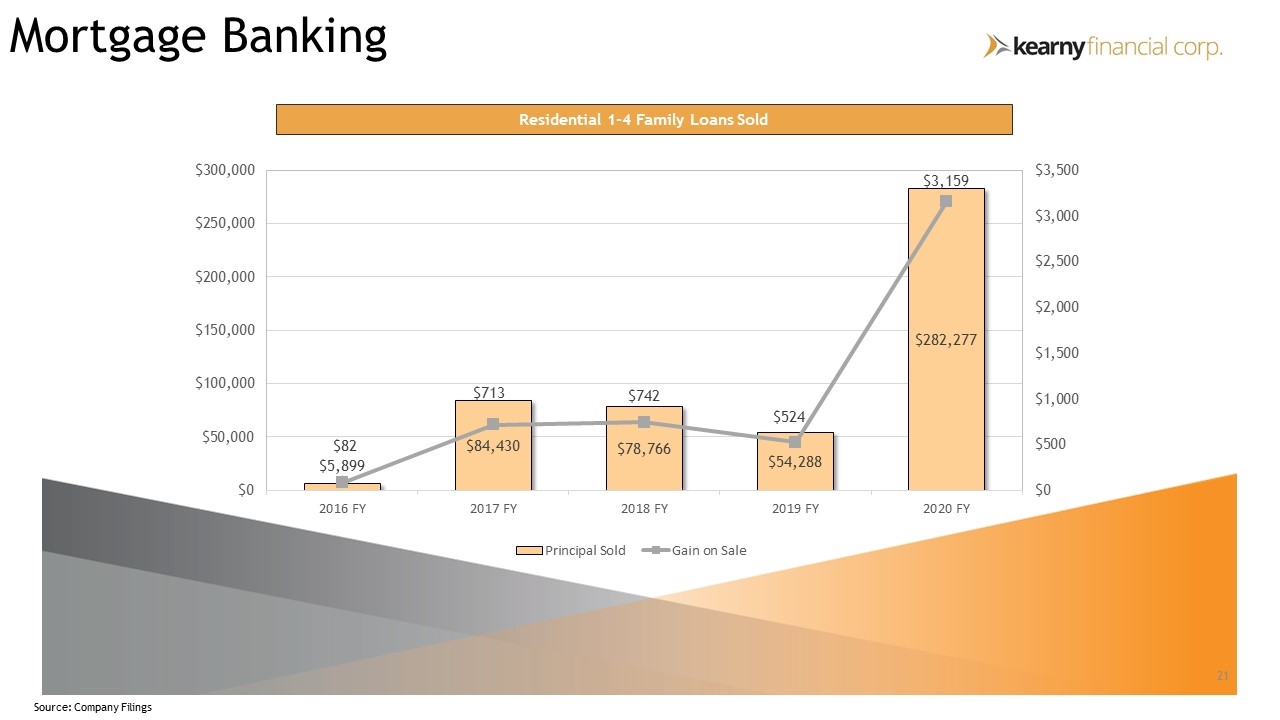
Mortgage Banking 1-4 Family Avg. LTV = 59.0% Home Equity Avg. LTV = 41.0% Residential 1-4 Family Loans Sold Source: Company Filings
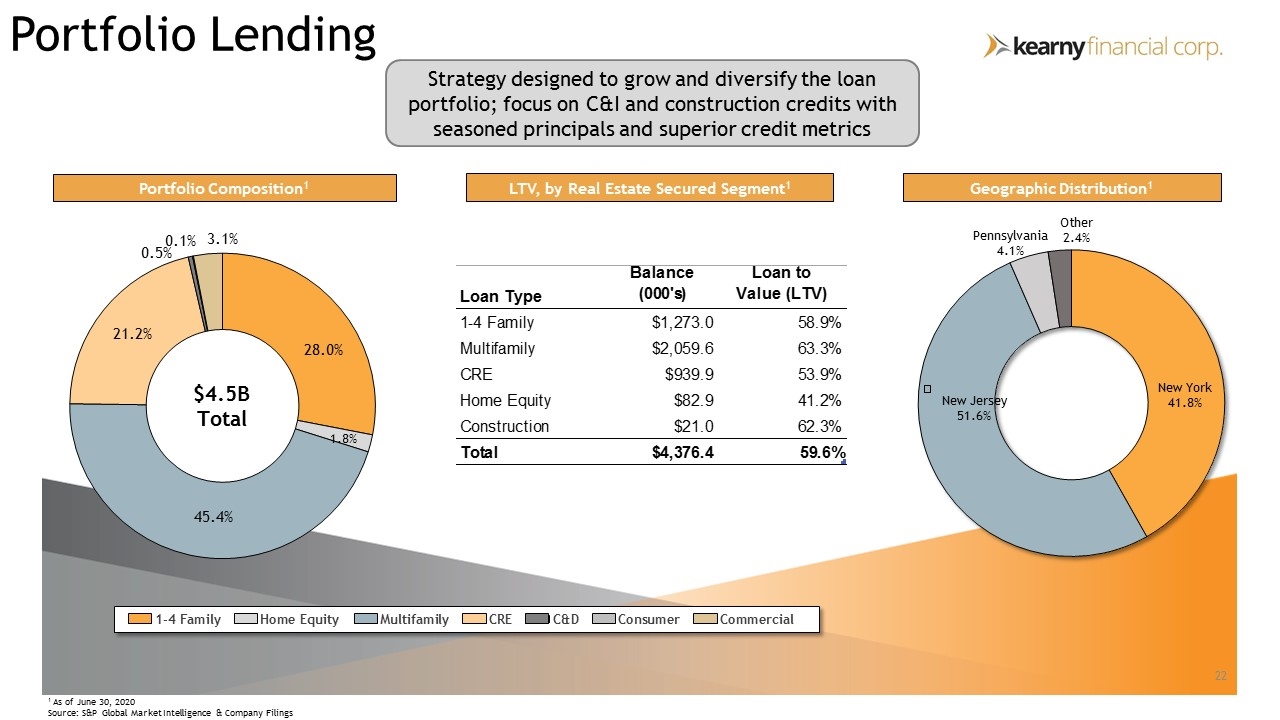
Portfolio Lending Portfolio Composition1 Geographic Distribution1 1 As of June 30, 2020 Source: S&P Global Market Intelligence & Company Filings LTV, by Real Estate Secured Segment1 Strategy designed to grow and diversify the loan portfolio; focus on C&I and construction credits with seasoned principals and superior credit metrics Strategy designed to grow and diversify the loan portfolio; focus on C&I and construction credits with seasoned principals and superior credit metrics Portfolio Composition1 LTV, by Real Estate Secured Segment1 Geographic Distribution1 Portfolio Lending Portfolio Lending Other Other New York $4.5B 21.2% Total0.1% 3.1% 28.0% 1.8% Loan Type Balance (000's) Loan to Value (LTV) 1-4 Family $1,273.0 58.9% Multifamily $2,059.6 63.3% CRE $939.9 53.9% Home Equity $82.9 41.2% Construction $21.0 62.3% Total $4,376.4 59.6%
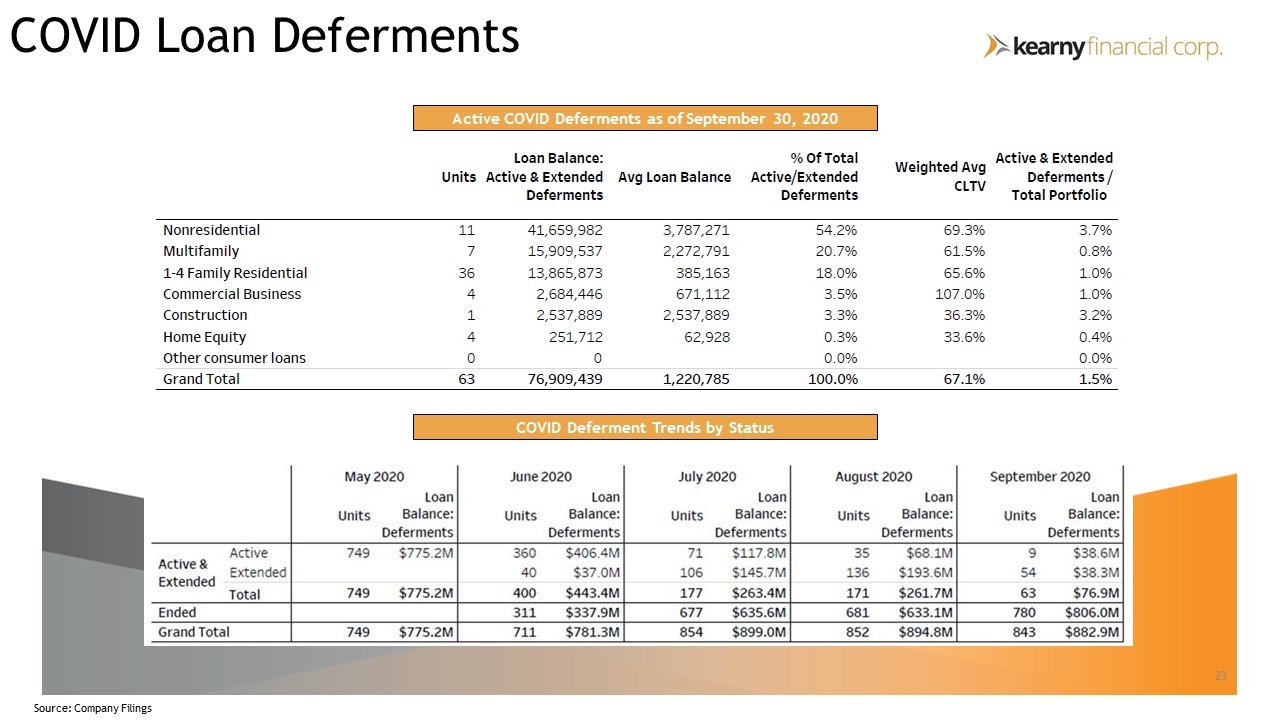
COVID Loan Deferments Active COVID Deferments as of September 30, 2020 COVID Deferment Trends by Status Source: Company Filings
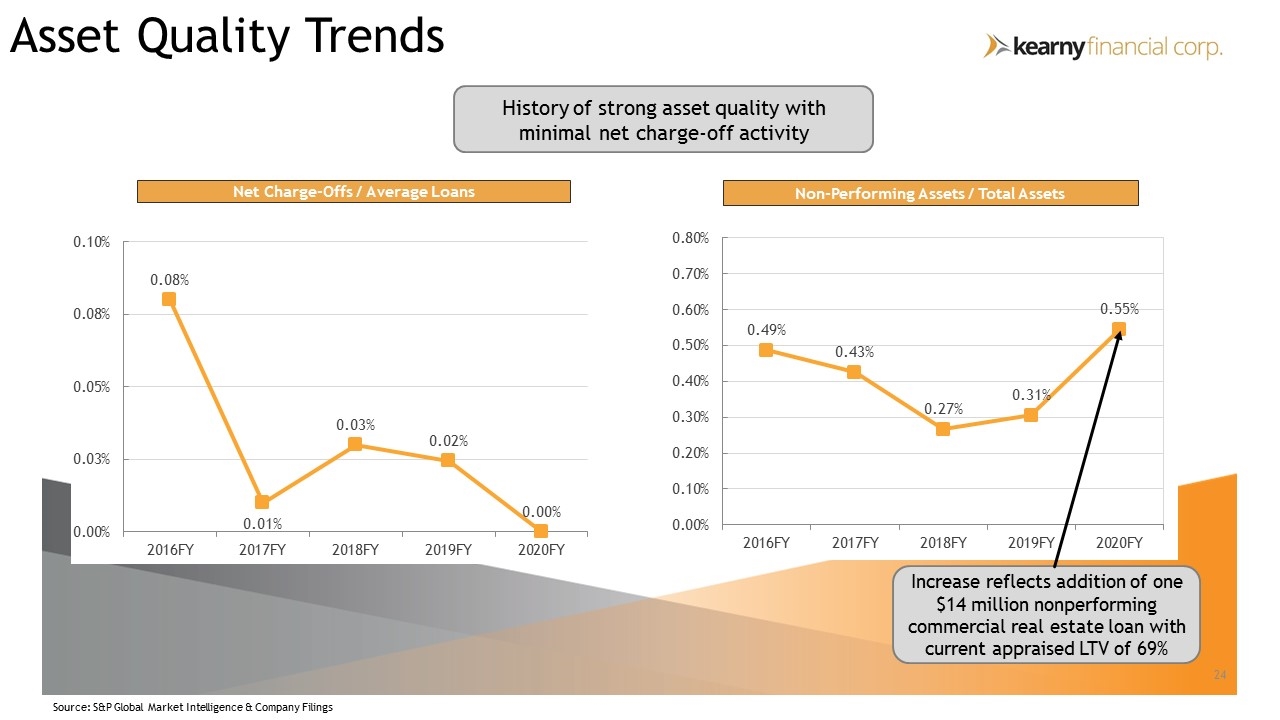
Asset Quality Trends Net Charge-Offs / Average Loans Non-Performing Assets / Total Assets Increase reflects addition of one $14 million nonperforming commercial real estate loan with current appraised LTV of 69% Source: S&P Global Market Intelligence & Company Filings History of strong asset quality with minimal net charge-off activity
M&A History and Strategy Experienced acquirer and integrator, having successfully completed 7 whole-bank acquisitions over the past 20 years Opportunistic acquisition strategy with an emphasis on: Low premium deals Similar or complementary business models Expansion in existing or contiguous markets Cultural compatibility Focused on limiting tangible book value dilution and earn-back periods
MSB Financial Acquisition Transaction completed on July 10, 2020 Systems conversion and re-branding completed simultaneous with closing Expanded franchise into attractive Somerset and Morris county, NJ markets Tangible book value dilution of 1.4%, or 1.8% inclusive of Day 1 CECL entry Non-interest expense savings to exceed 45% Source: Company Filings
Report of the Inspector of Election Results of Voting
Annual Meeting of Stockholders October 22, 2020 10:00 AM
