Attached files
| file | filename |
|---|---|
| EX-99.2 - EX-99.2 - CITRIX SYSTEMS INC | d61442dex992.htm |
| 8-K - 8-K - CITRIX SYSTEMS INC | d61442d8k.htm |
Exhibit 99.1
Citrix 2020 I Q3 Financials October 22, 2020 To Our Stakeholders Our third quarter results reflect strong on-going demand for the Citrix Workspace—the intelligent digital experience that empowers all employees with unified, secure, and reliable access to all the apps, content, and services they need to be productive and do their best work — anytime, anywhere. The third quarter marks the final period in which the perpetual license model for the Workspace was broadly available. Going forward, Workspace will primarily be sold as a SaaS or on-premises subscription. This changing mix is evident in our third quarter results and expectations going forward. Our third quarter highlights include: Third quarter subscription ARR’ was $1.03 billion, up 53% year-over-year, and SaaS ARR was $630 million, up 36% year-over-year Subscription bookings as a percentage of total product bookings was 77%, up from 59% in the third quarter of 2019 Citrix Cloud paid subscriber growth reaccelerated to 8.3 million, up from 7.5 million in the second quarter and 6.1 million in the third quarter of 2019 Reported revenue was $767 million in the third quarter, up 5% year-over-year. For the third quarter, GAAP diluted EPS was $0.78, and non-GAAP diluted EPS2 was $1.38 Future committed revenue increased 20%, or approximately $433 million year-over-year reflecting an increasing mix of subscription product bookings ‘Annualized Recurring Revenue, or ARR, is an operating metric that represents the contracted recurring value of all termed subscriptions normalized to a one-year period. It is calculated at the end of a reporting period by taking each contract’s recurring total contract value and dividing by the length of the contract. ARR includes only active contractually committed, fixed subscription fees. Our definition of ARR includes contracts expected to recur and therefore excludes contracts with durations of 12 months or less where licenses were issued to address extraordinary business continuity events for our customers. All contracts are annualized, including 30 day offerings where we take monthly recurring revenue multiplied by 12 to annualize. ARR should be viewed independently of U.S. GAAP revenue, deferred revenue and unbilled revenue and is not intended to be combined with or to replace those items. ARR is not a forecast of future revenue. ‘A reconciliation of GAAP to non-GAAP measures has been provided in the financial statement tables included in this letter. An explanation of these measures is also included below under the heading “Reconciliation of Non-GAAP Financial Measures to Comparable U.S. GAAP Measures.” Citrix 2020 1 Q3 Financials 1
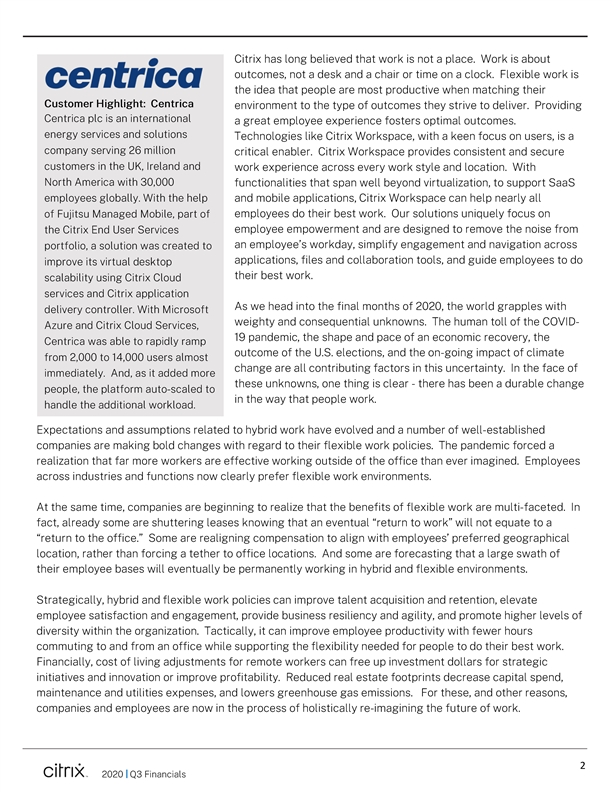
centrica Customer Highlight: Centrica Centrica plc is an international energy services and solutions company serving 26 million customers in the UK, Ireland and North America with 30,000 employees globally. With the help of Fujitsu Managed Mobile, part of the Citrix End User Services portfolio, a solution was created to improve its virtual desktop scalability using Citrix Cloud services and Citrix application delivery controller. With Microsoft Azure and Citrix Cloud Services, Centrica was able to rapidly ramp from 2,000 to 14,000 users almost immediately. And, as it added more people, the platform auto-scaled to handle the additional workload. Citrix has long believed that work is not a place. Work is about outcomes, not a desk and a chair or time on a clock. Flexible work is the idea that people are most productive when matching their environment to the type of outcomes they strive to deliver. Providing a great employee experience fosters optimal outcomes. Technologies like Citrix Workspace, with a keen focus on users, is a critical enabler. Citrix Workspace provides consistent and secure work experience across every work style and location. With functionalities that span well beyond virtualization, to support SaaS and mobile applications, Citrix Workspace can help nearly all employees do their best work. Our solutions uniquely focus on employee empowerment and are designed to remove the noise from an employee’s workday, simplify engagement and navigation across applications, files and collaboration tools, and guide employees to do their best work. As we head into the final months of 2020, the world grapples with weighty and consequential unknowns. The human toll of the COVID 19 pandemic, the shape and pace of an economic recovery, the outcome of the U.S. elections, and the on-going impact of climate change are all contributing factors in this uncertainty. In the face of these unknowns, one thing is clear—there has been a durable change in the way that people work. Expectations and assumptions related to hybrid work have evolved and a number of well-established companies are making bold changes with regard to their flexible work policies. The pandemic forced a realization that far more workers are effective working outside of the office than ever imagined. Employees across industries and functions now clearly prefer flexible work environments. At the same time, companies are beginning to realize that the benefits of flexible work are multi-faceted. In fact, already some are shuttering leases knowing that an eventual “return to work” will not equate to a “return to the office.” Some are realigning compensation to align with employees’ preferred geographical location, rather than forcing a tether to office locations. And some are forecasting that a large swath of their employee bases will eventually be permanently working in hybrid and flexible environments. Strategically, hybrid and flexible work policies can improve talent acquisition and retention, elevate employee satisfaction and engagement, provide business resiliency and agility, and promote higher levels of diversity within the organization. Tactically, it can improve employee productivity with fewer hours commuting to and from an office while supporting the flexibility needed for people to do their best work. Financially, cost of living adjustments for remote workers can free up investment dollars for strategic initiatives and innovation or improve profitability. Reduced real estate footprints decrease capital spend, maintenance and utilities expenses, and lowers greenhouse gas emissions. For these, and other reasons, companies and employees are now in the process of holistically re-imagining the future of work.
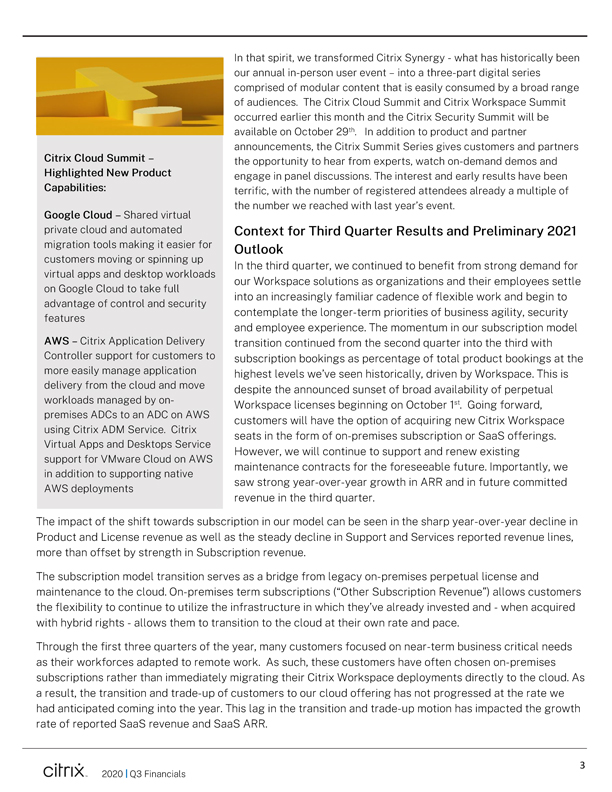
Citrix Cloud Summit -Highlighted New Product Capabilities: Google Cloud - Shared virtual private cloud and automated migration tools
making it easier for customers moving or spinning up virtual apps and desktop workloads on Google Cloud to take full advantage of control and security features AWS - Citrix Application Delivery Controller support for customers to more easily manage
application delivery from the cloud and move workloads managed by on- premises ADCs to an ADC on AWS
using Citrix ADM Service. Citrix Virtual Apps and Desktops
Service support for VMware Cloud on AWS in addition to supporting native AWS deployments
In that spirit, we transformed Citrix Synergy - what has historically been
our annual in-person user event - into a three-part digital series comprised of modular content that is easily consumed by a broad range of audiences. The Citrix Cloud Summit and Citrix Workspace Summit occurred earlier this month and the Citrix
Security Summit will be available on October 29th. In addition to product and partner announcements, the Citrix Summit Series gives customers and partners
the
opportunity to hear from experts, watch on-demand demos and engage in panel discussions. The interest and early results have been terrific, with the number of registered attendees already a multiple of the number we reached with last year’s
event. Context for Third Quarter Results and Preliminary 2021 Outlook In the third quarter, we continued to benefit from strong demand for our Workspace solutions as organizations and their employees settle into an increasingly familiar cadence of
flexible work and begin to contemplate the longer-term priorities of business agility, security and employee experience. The momentum in our subscription model transition continued from the second quarter into the third with subscription bookings as
percentage of total product bookings at the highest levels we’ve seen historically, driven by Workspace. This is despite the announced sunset of broad availability of perpetual Workspace licenses beginning on October 1st Going forward,
customers will have the option of acquiring new Citrix Workspace seats in the form of on-premises subscription or SaaS offerings. However, we will continue to support and renew existing maintenance contracts for the foreseeable future. Importantly,
we saw strong year-over-year growth in ARR and in future committed
revenue in the third quarter. The impact of the shift towards subscription in our model can be
seen in the sharp year-over-year decline in Product and License revenue as well as the steady decline in Support and Services reported revenue lines, more than offset by strength in Subscription revenue. The subscription model transition serves as a
bridge from legacy on-premises perpetual license and maintenance to the cloud. On-premises term subscriptions (“Other Subscription Revenue”) allows customers
the flexibility to continue to utilize the infrastructure in which they’ve already invested and when acquired with hybrid rights - allows them to transition to the cloud at
their own rate and pace. Through the first three quarters of the year, many customers focused on near-term business critical needs as their workforces adapted to remote work. As such, these customers have often chosen on-premises subscriptions
rather than immediately migrating their Citrix Workspace deployments directly to the cloud. As a result, the transition and trade-up of customers to our cloud offering has not progressed at the rate we had anticipated coming into the year. This lag
in the transition and trade-up motion has impacted the growth rate of reported SaaS revenue and SaaS ARR.
citrix 2020 |Q3 Financials
Looking ahead, there are a number of factors that impact our visibility, not least of which is the course of COVID-19 infection rates
and the shape of the global economic recovery. Still, we are comfortable providing some highlights of our current view of how the full year 2021 is expected to look at a high level. At this time, our initial guidance for FY’21 revenue is growth
of approximately 4% over FY’20. Keep in mind that during 2021, the year-over-year revenue growth rate by quarter will vary considerably relative to prior years. This is due to the strong upside we experienced in the first quarter of FY’20
due to business continuity, combined with our decision to continue the availability of perpetual Workspace licenses in the third quarter of 2020. Therefore, we expect the quarterly growth rate to be sharply negative in the first quarter of
FY’21, ramping each quarter after that. Looking beyond 2021, we believe we are currently well-positioned to achieve the longer-term goals we shared one year ago. Long term, we are confident that this global health crisis is changing the way
companies think about the benefits of hybrid and flexible work. Work is an activity, not a place, requiring a flexible infrastructure to support, secure and empower teams. This is why digital workspace technologies are incredibly relevant to our
customers and to our partners. We believe the secular shifts towards hybrid and flexible work, security and employee experience will serve as key demand drivers for Citrix well into the future. Lastly, I am pleased to welcome Bob Knowling to the
Citrix Board of Directors. Bob brings a great depth of experience across technology, leadership and governance. He will be a great asset to Citrix in the years ahead.
lugt
David Henshall
President & CEO
4
citrix 2020 |Q3 Financials
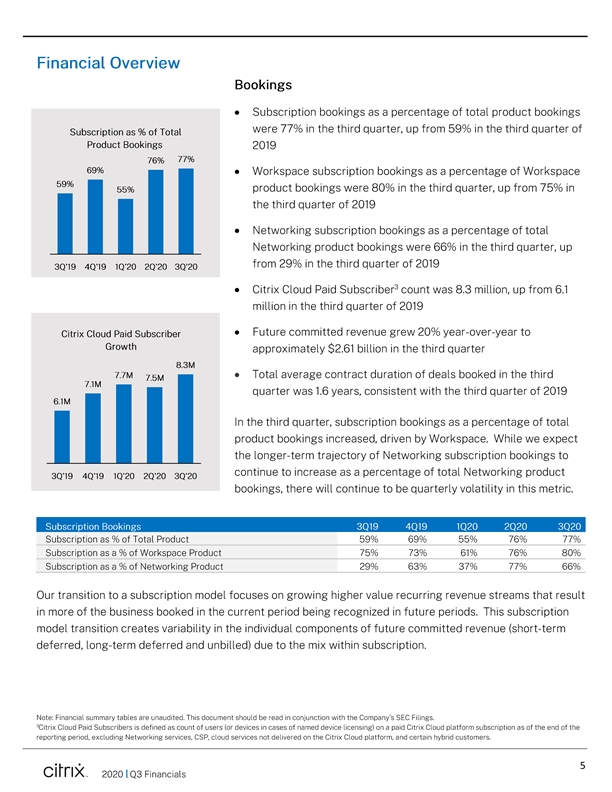
Financial Overview Subscription as % of Total Product Bookings 76% 77% 69% 59% 55% 3Q’19 4Q’19 1Q’20 2Q’20 3Q’20 Bookings Subscription bookings as a percentage of total product bookings were 77% in the third quarter, up from 59% in the third quarter of 2019 Workspace subscription bookings as a percentage of Workspace product bookings were 80% in the third quarter, up from 75% in the third quarter of 2019 Networking subscription bookings as a percentage of total Networking product bookings were 66% in the third quarter, up from 29% in the third quarter of 2019 Citrix Cloud Paid Subscriber3 count was 8.3 million, up from 6.1 million in the third quarter of 2019 Future committed revenue grew 20% year-over-year to approximately $2.61 billion in the third quarter 8.3M 7.7M 7.5M • Total average contract duration of deals booked in the third 7.1 M quarter was 1.6 years, consistent with the third quarter of 2019 6.1 M In the third quarter, subscription bookings as a percentage of total product bookings increased, driven by Workspace. While we expect the longer-term trajectory of Networking subscription bookings to continue to increase as a percentage of total Networking product bookings, there will continue to be quarterly volatility in this metric. 3Q’19 4Q’19 1Q’20 2Q’20 3Q’20 Subscription Bookings 3Q19 4Q19 1Q20 2Q20 3Q20 Subscription as % of Total Product 59% 69% 55% 76% 77% Subscription as a % of Workspace Product 75% 73% 61% 76% 80% Subscription as a % of Networking Product 29% 63% 37% 77% 66% Our transition to a subscription model focuses on growing higher value recurring revenue streams that result in more of the business booked in the current period being recognized in future periods. This subscription model transition creates variability in the individual components of future committed revenue (short-term deferred, long-term deferred and unbilled) due to the mix within subscription. Note: Financial summary tables are unaudited. This document should be read in conjunction with the Company’s SEC Filings. 3Citrix Cloud Paid Subscribers is defined as count of users (or devices in cases of named device Licensing) on a paid Citrix Cloud platform subscription as of the end of the reporting period, excluding Networking services, CSP, cloud services not delivered on the Citrix Cloud platform, and certain hybrid customers. 5 2020 I Q3 Financials
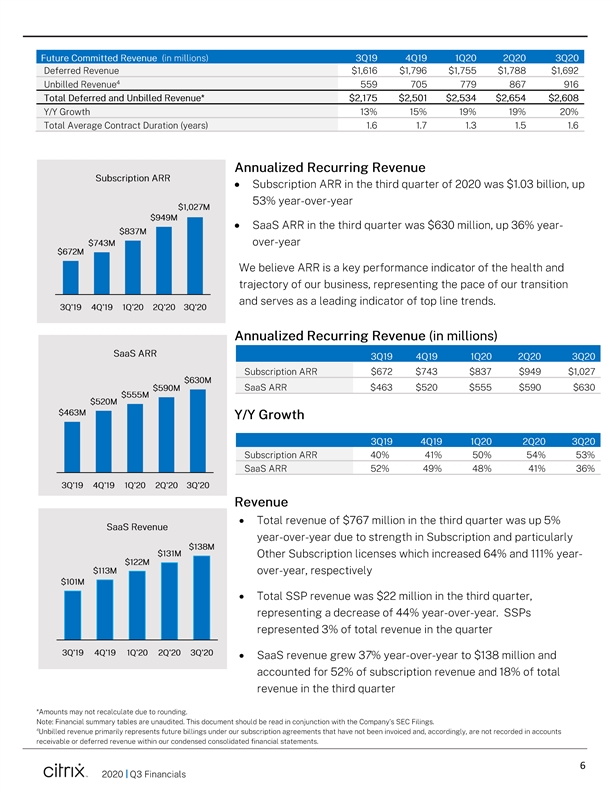
Deferred Revenue $1,616 $1,796 $1,755 $1,788 $1,692 Unbilled Revenue 559 705 779 867 916 Total Deferred and Unbilled Revenue* $2,175 $2,501 $2,534 $2,654 $2,608 Y/Y Growth 13% 15% 19% 19% 20% Total Average Contract Duration (years) 1.6 1.7 1.3 1.5 1.6 Annualized Recurring Revenue Subscription ARR in the third quarter of 2020 was $1.03 billion, up 53% year-over-year SaaS ARR in the third quarter was $630 million, up 36% yearover-year We believe ARR is a key performance indicator of the health and trajectory of our business, representing the pace of our transition and serves as a leading indicator of top line trends. Annualized Recurring Revenue (in millions) 3Q19 4Q’19 1Q’20 2Q’20 3Q’20 SaaS Revenue $ $131M138M $122M $113M $101M Revenue Total revenue of $767 million in the third quarter was up 5% year-over-year due to strength in Subscription and particularly Other Subscription licenses which increased 64% and 111% yearover-year, respectively Total SSP revenue was $22 million in the third quarter, representing a decrease of 44% year-over-year. SSPs represented 3% of total revenue in the quarter 3Q19 4Q’19 1Q’20 2Q20 3Q’20 SaaS revenue grew 37% year-over-year to $138 million and accounted for 52% of subscription revenue and 18% of total revenue in the third quarter *Amounts may not recalculate due to rounding. Note: Financial summary tables are unaudited. This document should be read in conjunction with the Company’s SEC Filings. 4Unbilled revenue primarily represents future billings under our subscription agreements that have not been invoiced and, accordingly, are not recorded in accounts receivable or deferred revenue within our condensed consolidated financial statements. 6 20201Q3 Financials
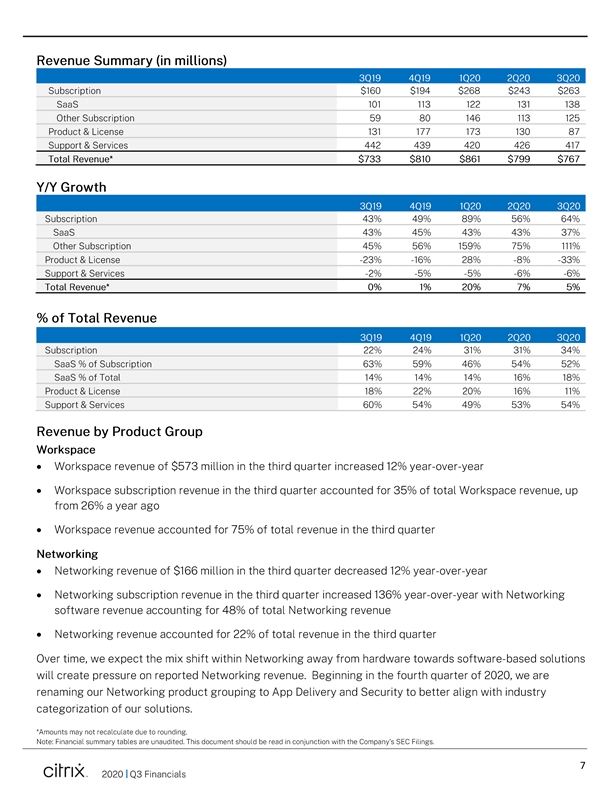
3Q19 4Q19 1Q20 2Q20 3Q20 $160 $194 $268 $243 $263 101 113 122 131 138 59 80 146 113 125 131 177 173 130 87 442 439 420 426 417 $733 $810 $861 $799 $767 3Q19 4Q19 1Q20 2Q20 3Q20 43% 49% 89% 56% 64% 43% 45% 43% 43% 37% 45% 56% 159% 75% 111% -23% -16% 28% -8% -33% -2% -5% -5% -6% -6% 0% 1% 20% 7% 5% 3Q19 Q19 2Q20 3Q20 22% 24% 31% 31% 34% 63% 59% 46% 54% 52% 14% 14% 14% 16% 18% 18% 22% 20% 16% 11% 60% 54% 49% 53% 54% Revenue Summary (in millions) Subscription SaaS Other Subscription Product & License Support & Services Total Revenue* Y/Y Growth Subscription SaaS Other Subscription Product & License Support & Services Total Revenue* % of Total Revenue Subscription SaaS % of Subscription SaaS % of Total Product & License Support & Services Revenue by Product Group Workspace Workspace revenue of $573 million in the third quarter increased 12% year-over-year Workspace subscription revenue in the third quarter accounted for 35% of total Workspace revenue, up from 26% a year ago Workspace revenue accounted for 75% of total revenue in the third quarter Networking Networking revenue of $166 million in the third quarter decreased 12% year-over-year Networking subscription revenue in the third quarter increased 136% year-over-year with Networking software revenue accounting for 48% of total Networking revenue Networking revenue accounted for 22% of total revenue in the third quarter Over time, we expect the mix shift within Networking away from hardware towards software-based solutions will create pressure on reported Networking revenue. Beginning in the fourth quarter of 2020, we are renaming our Networking product grouping to App Delivery and Security to better align with industry categorization of our solutions. *Amounts may not recalculate due to rounding. Note: Financial summary tables are unaudited. This document should be read in conjunction with the Company’s SEC Filings. 7 20201Q3 Financials
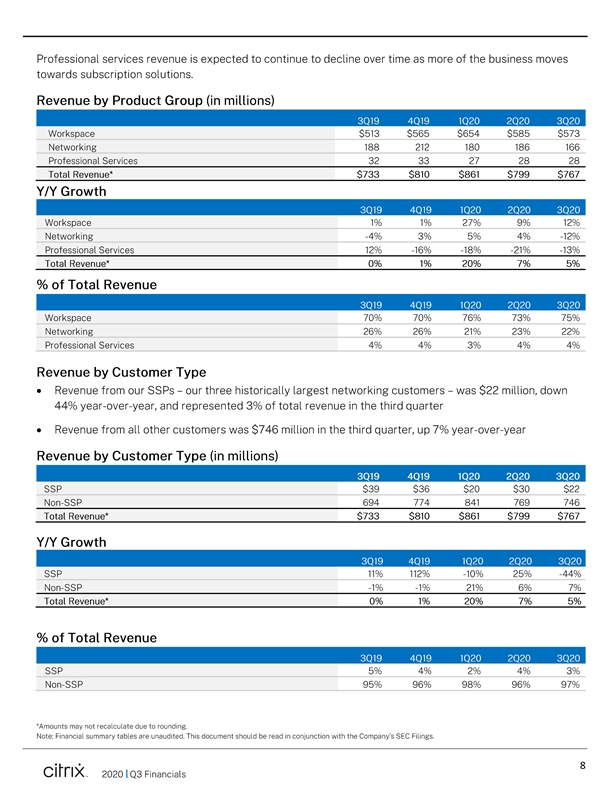
Professional services revenue is expected to continue to decline over time as more of the business moves towards subscription solutions. Revenue by Product Group (in millions) 3019 4019 1020 2020 3020 Workspace $513 $565 $654 $585 $573 Networking 188 212 180 186 166 Professional Services es 32 33 27 28 28 Total Revenue* $733 $810 $861 $799 $767 Y/Y Growth 3019 4019 1020 2020 3020 Work space e 1% 1% 27% 9% 12% Networking -4% 3% 5% 4% -12% Professional Services 12% -16% -18% -21% -13% Total Revenue* 0% 1% 20% 7% 5% % of Total Revenue 3019 4019 1020 2020 3020 Work space 70% 70% 76% 73% 75% Networking 26% 26% 21% 23% 22% Professional Services 4% 4% 3% 4% 4% Revenue by Customer Type • Revenue from our SSPs- our three historically largest networking customers- was $22 million, down 44% year-over-year, and represented 3% of total revenue in the third quarter • Revenue from all other customers was $746 million in the third quarter, up 7% yea r-over-year Revenue by Customer Type (in millions) 3Q19 4Q19 1Q20 2Q20 3Q20 SSP $39 $36 $20 $30 $22 Non-SSP 694 774 841 769 746 TotalReve nue* $733 $810 $861 $799 $767 Y/Y Growth 3Q19 4Q19 1Q20 2Q20 3Q20 SSP 11% 112% -10% 25% -44% Non-SSP -1% -1% 21% 6% 7% TotalReve nue* 0% 1% 20% 7% 5% % of Total Revenue 3019 4019 1020 2020 3020 SS P 5% 4% 2% 4% 3% Non-SS P 95% 96% 98% 96% 97% ‘A mounts may not recalculate due to rounding. Note: Financial summary tables are unaudited. This document should be read in conjunction with t he Company’ s SEC Filings.
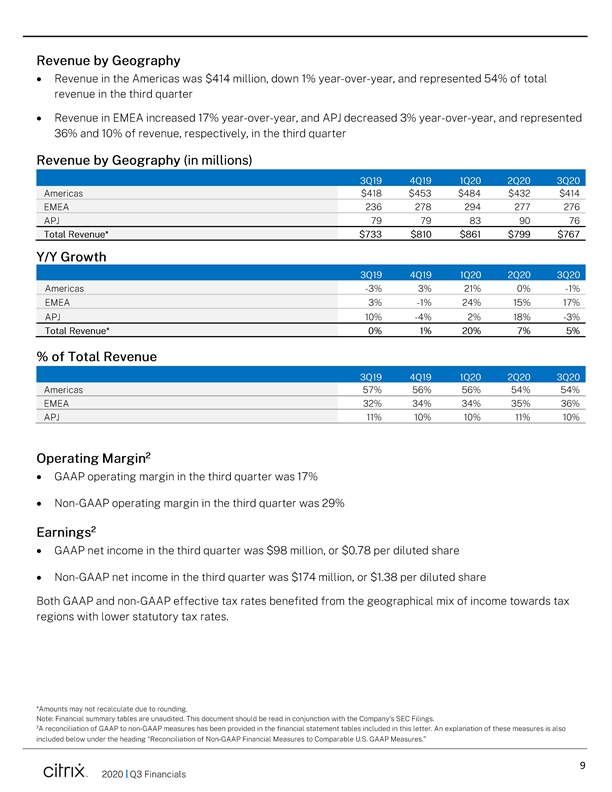
Revenue by Geography • Revenue in the Americas was $414 million, down 1% year-over-year, and represented 54% of total revenue in the third quarter • Revenue in EMEA increased 17% year-over-year, and APJ decreased 3% year-over-year, and represented 36% and 10% of revenue, respectively, in the third quarter Revenue by Geography (in millions) 3019 4Q19 1020 2020 3020 Americas $418 $453 $484 $432 $414 EMEA 236 278 294 277 276 APJ 79 79 83 90 76 TotalRevenue* $733 $810 $861 $799 $767 Y/Y Growth 3019 4019 1Q20 2Q20 3Q20 Americas -3% 3% 21% 0% -1% E MEA 3% -1% 24% 15% 17% A PJ 10% -4% 2% 18% -3% Total Revenue* 0% 1% 20% 7% 5% % of Total Revenue 3019 4Q19 1020 2020 3020 Americas 57% 56% 56% 54% 54% EMEA 32% 34% 34% 35% 36% APJ 11% 10% 10% 11% 10% Operating Margin2 • GAAP operating ma rgin in the third quarter was 17% • Non-GAAP operating ma rgin in the third quarter was 29% Earnings2 • GAAP net income in the third quarter was $98 million, or $0.78 per diluted share • Non-GAAP net income in the third quarter was $174 million, or $1.38 per diluted share Both GAAP and non-GAAP effective tax rates benefited from the geographical mix of income towards tax regions with lower statutory tax rates. ‘A mounts may not recalculate due to rounding. Note: Financial summary tables are unaudited. This document should be read In conjunction with the Company’s SEC Flings. ‘A reconciliation of GAAP to non-GAAP measures has been provided ded in the financial statement tables included in this letter. An explanation of these measures is also Included below under the headingng “Reconciliation of N on-GAAP Financial Measures to Comparable U.S. GAAP Measures.”
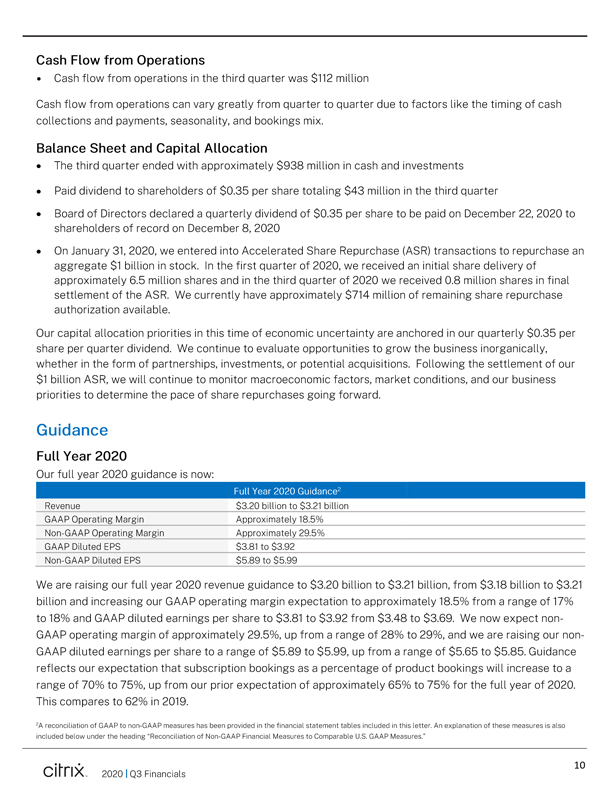
Cash Flow from Operations Cash flow from operations in the third quarter was $112 million Cash flow from operations can vary greatly
from quarter to quarter due to factors like the timing of cash collections and payments, seasonality, and bookings mix. Balance Sheet and Capital Allocation The third quarter ended with approximately $938 million in cash and investments Paid
dividend to shareholders of $0.35 per share totaling $43 million in the third quarter Board of Directors declared a quarterly dividend of $0.35 per share to be paid on December 22, 2020 to shareholders of record on December 8, 2020 On January 31,
2020, we entered into Accelerated Share Repurchase (ASR) transactions to repurchase an aggregate $1 billion in stock. In the first quarter of 2020, we received an initial share delivery of approximately 6.5 million shares and in the third quarter of
2020 we received 0.8 million shares in final settlement of the ASR. We currently have approximately $714 million of remaining share repurchase authorization available. Our capital allocation priorities in this time of economic uncertainty are
anchored in our quarterly $0.35 per share per quarter dividend. We continue to evaluate opportunities to grow the business inorganically, whether in the form of partnerships, investments, or potential acquisitions. Following the settlement of our $1
billion ASR, we will continue to monitor macroeconomic factors, market conditions, and our business
priorities to determine the pace of share repurchases going
forward. Guidance Full Year 2020
Our full year 2020 guidance is now: Revenue GAAP Operating Margin Non-GAAP Operating Margin GAAP Diluted EPS Non-GAAP Diluted EPS
Full Year 2020 Guidance2 $3.20 billion to $3.21 billion Approximately 18.5% Approximately 29.5% $3.81 to $3.92 $5.89 to $5.99 We are raising our full year 2020 revenue guidance to $3.20 billion to $3.21 billion, from $3.18 billion to $3.21 billion
and increasing our GAAP operating margin expectation to approximately 18.5% from a range of 17% to 18% and GAAP diluted earnings per share to $3.81 to $3.92 from $3.48 to $3.69. We now expect non- GAAP operating margin of approximately 29.5%, up
from a range of 28% to 29%, and we are raising our non- GAAP diluted earnings per share to a range of $5.89 to $5.99, up from a range of $5.65 to $5.85. Guidance reflects our expectation that subscription bookings as percentage of product bookings
will increase to a range of 70% to 75%, up from our prior expectation of approximately 65% to 75% for the full year of 2020. This compares to 62% in 2019. 2A reconciliation of GAAP to non-GAAP measures has been provided in the financial statement
tables included in this letter. An explanation of these measures is also included below under the heading “Reconciliation of Non-GAAP Financial Measures to Comparable U.S. GAAP Measures.” 10 citrix 2020 | Q3 Financials
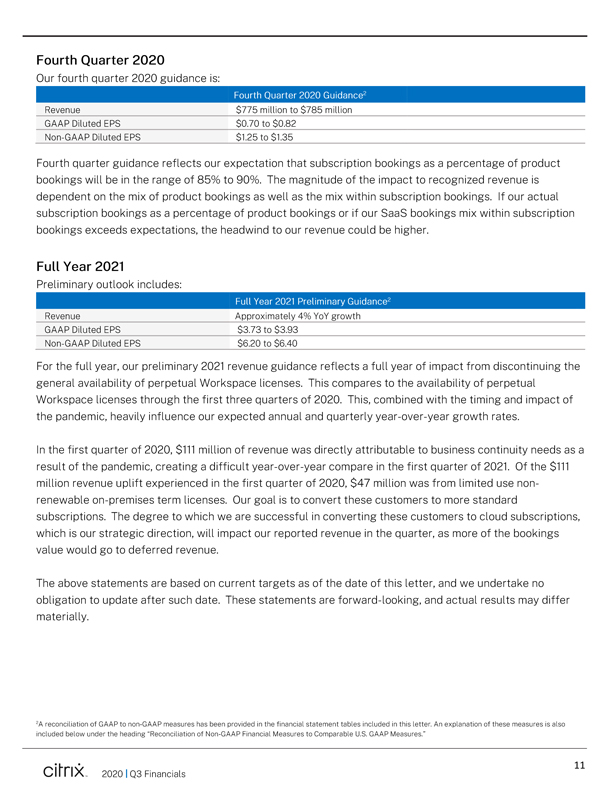
Fourth Quarter 2020 Our fourth quarter 2020 guidance is: Revenue GAAP Diluted EPS Non-GAAP Diluted EPS Fourth Quarter 2020 Guidance2 $775 million to $785 million $0.70 to $0.82 $1.25 to $1.35 Fourth quarter guidance reflects our expectation that subscription bookings as a percentage of product bookings will be in the range of 85% to 90%. The magnitude of the impact to recognized revenue is dependent on the mix of product bookings as well as the mix within subscription bookings. If our actual subscription bookings as a percentage of product bookings or if our SaaS bookings mix within subscription bookings exceeds expectations, the headwind to our revenue could be higher. Full Year 2021 Preliminary outlook includes: Revenue GAAP Diluted EPS Non-GAAP Diluted EPS Full Year 2021 Preliminary Guidance? Approximately 4% YoY growth $3.73 to $3.93 $6.20 to $6.40 For the full year, our preliminary 2021 revenue guidance reflects a full year of impact from discontinuing the general availability of perpetual Workspace licenses. This compares to the availability of perpetual Workspace licenses through the first three quarters of 2020. This, combined with the timing and impact of the pandemic, heavily influence our expected annual and quarterly year-over-year growth rates. In the first quarter of 2020, $111 million of revenue was directly attributable to business continuity needs as a result of the pandemic, creating a difficult year-over-year compare in the first quarter of 2021. Of the $111 million revenue uplift experienced in the first quarter of 2020, $47 million was from limited use non- renewable on-premises term licenses. Our goal is to convert these customers to more standard subscriptions. The degree to which we are successful in converting these customers to cloud subscriptions, which is our strategic direction, will impact our reported revenue in the quarter, as more of the bookings value would go to deferred revenue. The above statements are based on current targets as of the date of this letter, and we undertake no obligation to update after such date. These statements are forward-looking, and actual results may differ materially. 2A reconciliation of GAAP to non-GAAP measures has been provided in the financial statement tables included in this letter. An explanation of these measures is also included below under the heading “Reconciliation of Non-GAAP Financial Measures to Comparable U.S. GAAP Measures.” 11 citrix 2020 | Q3 Financials
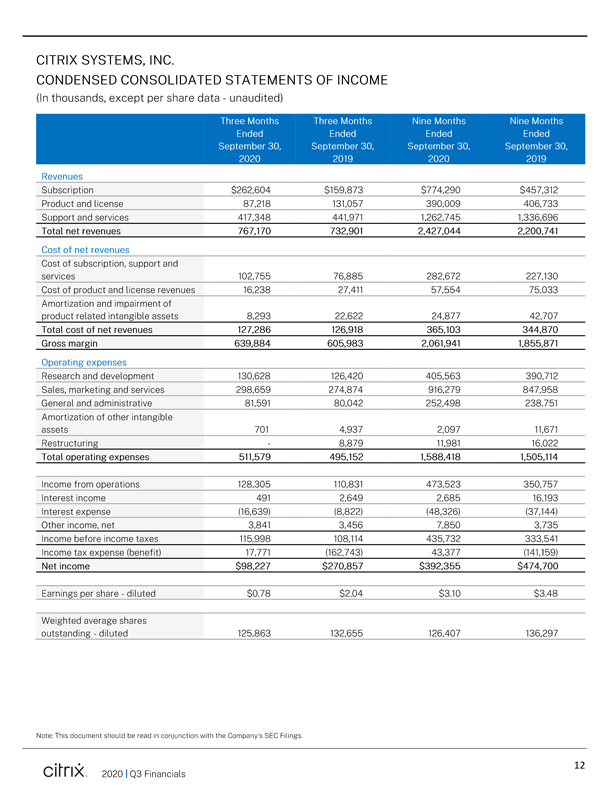
CITRIX SYSTEMS, INC. CONDENSED CONSOLIDATED STATEMENTS OF INCOME (In thousands, except per share data - unaudited)
Three Months Ended September 30, 2020 Three Months Ended September 30, 2019 Nine Months Ended September 30, 2020
Nine Months Ended September 30, 2019 Revenues Subscription Product and license Support and services Total net revenues $262,604 87,218 417,348 767,170 $159,873 131,057 441,971
732,901 $774,290 390,009 1,262,745 2,427,044 $457,312 406,733 1,336,696 2,200,741 102,755 16,238 76,885 27,411 282,672 57,554 227,130 75,033 Cost of net revenues Cost of subscription, support and services Cost of product and license revenues
Amortization and impairment of product related intangible assets Total cost of net revenues Gross margin 8,293 127,286 639,884 22,622 126,918 605,983 24,877 365,103 2,061,941 42,707 344,870 1,855,871 130,628 298,659 81,591 126,420 274,874 80,042
405,563 916,279 252,498 390,712 847,958 238,751 Operating expenses Research and development Sales, marketing and services General and administrative Amortization of other intangible assets Restructuring Total operating expenses 701 4,937 8,879
495,152 2,097 11,981 1,588,418 11,671 16,022 1,505,114 511,579 Income from operations Interest income Interest expense Other income, net Income before income taxes Income tax expense (benefit) Net income 128,305 491 (16,639) 3,841 115,998 17,771
$98,227 110,831 2,649 (8,822) 3,456 108,114 (162,743) $270,857 473,523 2,685 (48,326) 7,850 435,732 43,377 $392,355 350,757 16,193 (37,144) 3,735 333,541 (141,159) $474,700 Earnings per share - diluted $0.78 $2.04 $3.10 $3.48 Weighted average shares
outstanding - diluted 125,863 132,655 126,407 136,297 Note: This document should be read in conjunction with the Company’s SEC Filings. 12 citrix 2020 | Q3 Financials
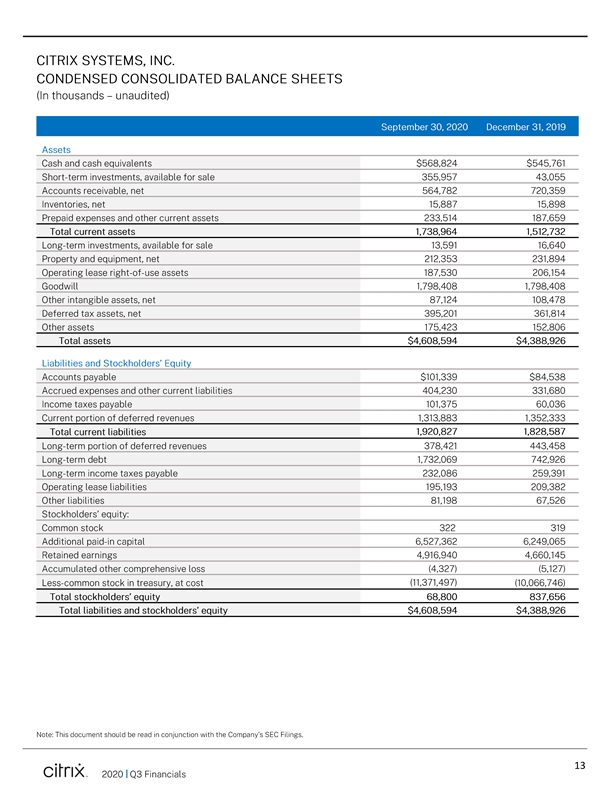
CITRIX SYSTEMS, INC. CONDENSED CONSOLIDATED BALANCE SHEETS (In thousands- unaudited) September 30. 2020December 31. 2019 Assets Cash and cash equivalents $568,824 $545,761 Short-term investments, a available for sale355,95743,055 Accounts receivable, net564,782720,359 Inventories, net15,88715,898 Prepaid expenses and other current assets233,514187,659 Total current assets1,738,9641,512,732 Long-term investments, available for sale13,59116,640 Property and equipment, net212,353231,894 Operating lease right -of-use assets187,530206,154 Goodwill1,798,4081,798,408 Other intangible assets. net87,124108,478 Deferred tax assets. net395,201361,814 Other assets175,423152,806 Totalassets$4,608,594$4,388,926 Liabilities and Stockholders’ Equity Accounts payable $101,339 $84,538 Accrued expenses and other current liabilities404,230331,680 Income taxes payable101,37560,036 Current portion of deferred revenues1,313,8831,352,333 Total current liabilities1,920,8271,828,587 Long-term portion of deferred revenues378,421443,458 Long-term debt1,732,069742,926 Long-term income taxes payable232,086259,391 Operating lease liabilities195,193209,382 Other liabilities Stockholders’ equity:81,19867,526 Common stock322319 Additional paid-in capital6,527,3626,249,065 Retained earnings4,916,9404,660,145 Accumulated other comprehensive loss(4,327)(5,127) Less-common stock 1n treasury, at cost(11,371,497)(10,066,746) Total stockholders’ equity68,800837,656 Total liabilities and stockholders’ equity$4,608,594$4,388,926 Note: This document should be read in conjunction with the Company’s SEC Filings
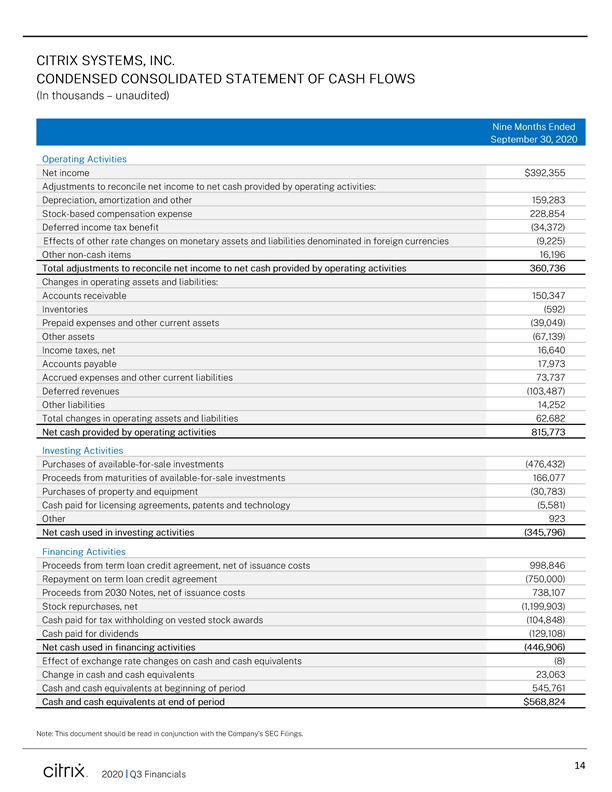
CITRIX SYSTEMS, INC. CONDENSED CONSOLIDATED STATEMENT OF CASH FLOWS (In thousands- unaudited) Nine Months Ended September 30, 2020 Operating Activities Net income Adjustments to reconcile net income to net cash provided by operating activities: Depreciation, amortization and other $392,355 --- 159,283 Stock-based compensation expense Deferred income tax benefit Effects of other rate changes on monetary assets and liabilities denominated in foreign currencies Other non-cash items Total adjustments to reconcile net income to net cash provided by operating activities Changes in operating assets and liabilities: Accounts receivable Inventories Prepaid expenses and other current assets Other assets Income taxes, net Accounts payable Accrued expenses and other current liabilities Deferred revenues Other liabilities Total changes in operating assets and liabilities Net cash provided by operating activities Investing Activities Purchases of available-for-sale investments Proceeds from maturities of available-for-sale investments Purchases of property and equipment Cash paid for licensing agreements, patents and technology Other Net cash used in investing activities Financing Activities Proceeds from term loan credit agreement net of issuance costs Repayment on term loan credit agreement Proceeds from 2030 Notes, net of issuance costs Stock repurchases, net 228,854 (34,372) (9,225) 16,196 360,736 150,347 (592) (39,049) (67,139) 16,640 17,973 73,737 (103,487) 14,252 62,682 815,773 (476,432) 166,077 (30,783) (5,581) 923 (345,796) 998,846 (750,000) 738,107 (1,199,903) Note: This document should be read in conjunction with the Company’s SEC Flings
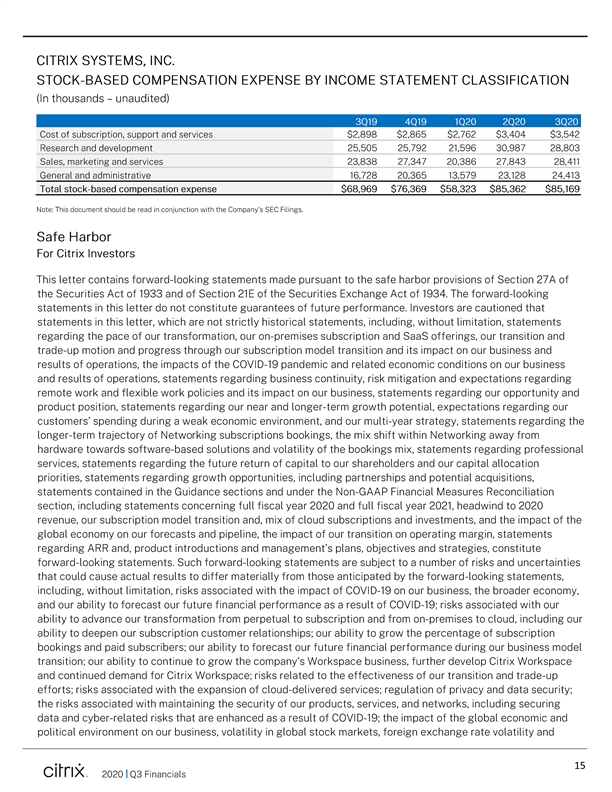
CITRIX SYSTEMS, INC. STOCK-BASED COMPENSATION EXPENSE BY INCOME STATEMENT CLASSIFICATION (In thousands- unaudited) 3019 4019102020203020 Cost of subscription, support and services$2,898$2,865$2,762$3,404$3,542 Research and development25,50525,79221,59630,98728,803 Sales, marketing and services23,83827,34720,38627,84328,411 General and administrative16,72820,36513,57923,12824,413 Total stock-based compensation expense$68,969$76,369$58,323$85,362$85,169 Note: This document should be read in conjunction with the Company’s SEC Filings Safe Harbor For Citrix Investors This letter contains forward-looking statements made pursuant to the safe harbor provisions of Section 27A of the Securities Act of 1933 and of Section 21E of the Securities Exchange Act of 1934, The forward-looking statements in this letter do not constitute guarantees of future performance. Investors are cautioned that statements in this letter, which are not strictly historical statements, including, without limitation, statements regarding the pace of our transformation, our on-premises subscription and SaaS offerings, our transition and trade-up motion and progress through our subscription model transition and its impact on our business and results of operations, the impacts of the COVID-19 pandemic and related economic conditions on our business and results of operations, statements regarding business continu’rty, risk mitigation and expectations regarding remote work and flexible work policies and its impact on our business, statements regarding our opportunity and product position, statements regarding our near and longer-term growth potential, expectations regarding our customers’ spending during a weak economic environment, and our multi-year strategy, statements regarding the longer-term trajectory of Networking subscriptions bookings, the mix shift within Networking away from hardware towards software-based solutions and volatility of the bookings mix, statements regarding professional services, statements regarding the future return of capital to our shareholders and our capital allocation priorities, statements regarding growth opportunities, including partnerships and potenfralacquisitions, statements contained in the Guidance sections and under the Non-GAAP Financial Measures Reconciliation section, including statements concerning full fiscal year 2020 and full fiscal year 2021, headwind to 2020 revenue, our subscription model transition and, mix of cloud subscriptions and investments, and the impact of the global economy on our forecasts and pipeline, the impact of our transition on operating margin, statements regarding ARR and, product introductions and management’s plans, objectives and strategies, constitute forward-looking statements. Such forward-looking statements are subject to a number of risks and uncertainties that could cause actual results to differ materially from those anticipated by the forward-looking statements, including, without limitation, risks associated with the impact of COVID-19 on our business, the broader economy, and our ab’rlity to forecast our future financialperformance as a result of COVID-19; risks associated with our ability to advance our transformation from perpetual to subscription and from on-premises to cloud, including our ability to deepen our subscription customer relationships; our ability to grow the percentage of subscription bookings and paid subscribers; our ability to forecast our future financial performance during our business model transition; our ability to continue to grow the company’s Workspace business, further develop Citrix Workspace and continued demand for Citrix Workspace; risks related to the effectiveness of our transition and trade-up efforts; risks associated with the expansion of cloud-delivered services; regulation of privacy and data security; the risks associated with maintaining the security of our products, services, and networks, including securing data and cyber-related risks that are enhanced as a result of COVID-19; the impact of the global economic and political environment on our business, volatility in global stock markets, foreign exchange rate volatility and
uncertainty in IT spending, including as a result of the COVID-19 pandemic, and changes in the markets for our products, including the Workspace market; developments in the COVID-19 pandemic, related policies or actions to protect public health and safety, and the impact of the foregoing on our liquidity, supply chain, human capital and mobility, operations, marketing events and initiatives, customer demand, pricing impact, and general economic conditions; changes in Citrix’s pricing and licensing models, including our short-term license program, promotional programs and product mix, all of which may impact Citrix’s revenue recognition; our ability to expand our customer base and attract more users within our customer base; the introduction of new products by competitors or the entry of new competitors into the markets for Citrix’s products and services; our ability to protect our innovations and intellectual property, including in higher-risk markets; the concentration of customers in Citrix’s networking business; the company’s ability to innovate and develop new products and services while growing its established virtualization and networking products and services; changes in our revenue mix towards products and services with lower gross margins; seasonal fluctuations in the company’s business; failure to execute Citrix’s sales and marketing plans; failure to successfully partner with key distributors, resellers, system integrators, service providers and strategic partners, such as Microsoft; transactions in key personnel and succession risk; the company’s ability to maintain and expand its business in large enterprise accounts and reliance on large service provider customers; the size, timing and recognition of revenue from significant orders; the success of investments in its product groups, foreign operations and vertical and geographic markets; the ability of Citrix to make suitable acquisitions on favorable terms in the future; risks associated with Citrix’s acquisitions and divestitures, including failure to further develop a and successfully market the technology a and products of acquired companies, failure to achieve or maintain anticipated revenues and operating performance contributions from acquisitions, which could dilute earnings; the recruitment and retention of qualified employees; bankruptcies, insolvencies or other economic conditions that limit our customers’ ability to pay for our services or limit the ability for us to collect payments, including unbilled revenue, which may be enhanced as a result of the COVID-19 pandemic; risks in effectively controlling operating expenses, and our ability to improve our operating margin; ability to effectively manage our capital structure and the impact of related changes on our operating results and financial condition; the effect of new accounting pronouncements on revenue and expense recognition; failure to comply with federal, state and international regulations; litigation and disputes, including challenges to our intellectual property rights or allegations of infringement of the intellectual property rights of others; the ability to maintain and protect our collection of brands; charges in the event of a write-off or impairment of acquired assets, underperforming businesses, investments or licenses; international market readiness, execution and other risks associated with the markets for Citrix’s products and services; risks related to servicing our debt; risks of political uncertainty, and social turmoil and pandemics, including COVID-19; and other risks detailed in Citrix’s filings with the Securities and Exchange Commission. Citrix assumes no obligation to update any forward-looking information contained in this letter or with respect to the announcements described herein. Reconciliation of Non-GAAP Financial Measures to Comparable U.S. GAAP Measures (Unaudited) Pursuant to the requirements of Regulation G, the Company has provided a reconciliation of each non-GAAP financial measure used in this letter a and related conference call or webcast to the most directly comparable GAAP financial measure. These measures differ from GAAP in that they exclude amortization primarily related to acquired intangible assets, stock-based compensation expenses and charge associated with the Company’s restructuring programs, and the related tax effect of those items. The income tax effect on non-GAAP items is calculated based upon the tax laws and statutory income tax rates applicable in the tax jurisdiction(s) of the underlying non-GAAP adjustment. The Company’s basis for these adjustments is described below.
Management uses these non-GAAP measures for internal reporting and forecasting purposes, when publicly providing its business outlook, to evaluate the Company’s performance and to evaluate and compensate the Company’s executives. The Company has provided these non-GAAP financial measures in addition to GAAP financial results because it believes that these non-GAAP financial measures provide useful information to certain investors and financial analysts for comparison across accounting periods not influenced by certain non-cash items or cash charges that are the result of discrete activities that are not used by management when evaluating the Company’s historical and prospective financial performance. In addition, the Company has historically provided this or similar information and understands that some investors and financial analysts find this information helpful in analyzing the Company’s operating margins, operating expenses and net income and comparing the Company’s financial performance to that of its peer companies and competitors. Management typically excludes the amounts described above when evaluating the Company’s operating performance and believes that the resulting non-GAAP measures are useful to investors and financial analysts in assessing the Company’s operating performance due to the following factors: • The Company does not acquire businesses on a predictable cycle. The Company, therefore, believes that the presentation of non-GAAP measures that adjust for the impact of amortization of intangible assets and stock-based compensation expenses and the related tax effects that are primarily related to acquisitions, provide investors and financial analysts with a consistent basis for comparison across accounting periods and, therefore, are useful to investors and financial analysts in helping them to better understand the Company’s operating results and underlying operational trends. • Amortization of intangible assets and the related tax effects are fixed at the time of an acquisition, are then amortized over a period of several years after the acquisition and generally cannot be changed or influenced by management after the acquisition. •Although stock-based compensation is an important aspect of the compensation of the Company’s employees and executives, stock-based compensation expense is generally fixed at the time of grant, then amortized over a period of several years after the grant of the stock-based instrument, and generally cannot be changed or influenced by management after the grant. •The Company has engaged in various restructuring activities over the past several years that have resulted in costs associated with reductions in headcount, consolidation of leased facilities and related costs. Each restructuring activity has been a discrete event based on a unique set of business objectives or circumstances, and each has differed from the others in terms of its operational implementation, business impact and scope. While the Company’s operations previously benefited from the employees and facilities covered by the various restructuring charges, these employees and facilities have benefited different parts of the Company’s business in different ways, and the amount of these charges has varied significantly from period to period. The Company, therefore, believes that the exclusion of these charges will better help investors and financial analysts understand the Company’s operating results and underlying operational trends. These non-GAAP financial measures are not prepared in accordance with accounting principles generally accepted in the United States (“GAAP”) and may differ from the non-GAAP information used by other companies. There are significant limitations associated with the use of non-GAAP financial measures. The additional non -GAAP financial information presented here should be considered in conjunction with, and not as a substitute for or superior to, the financial information presented in accordance with GAAP (such as net income and earnings per share) and should not be considered measures of the Company’s liquidity.
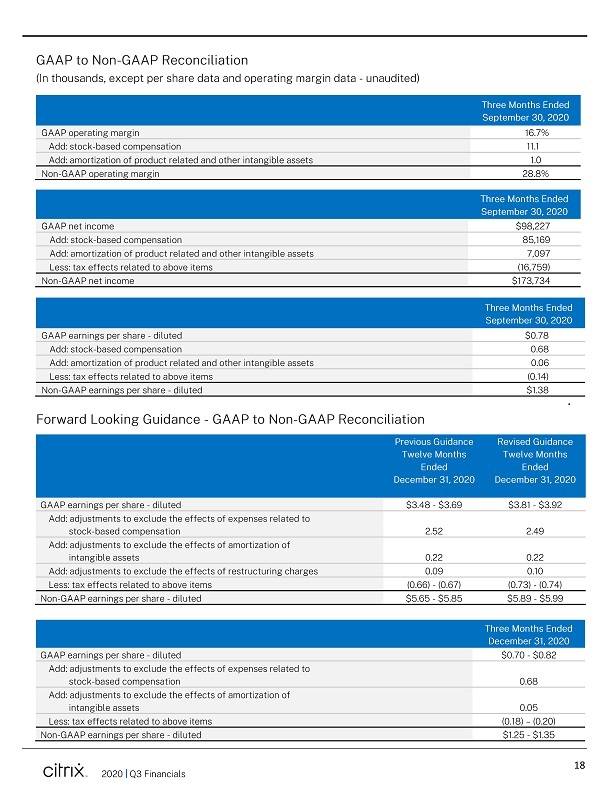
GAAP TO NON-GAAP RECONCILIATION
(IN THOUSANDS,
EXCEPT PER SHARE DATA AND OPERATING MARGIN DATA-UNAUDITED)
THREE MONTHS ENDED SEPTEMBER 30, 2020
GAAP operating margin 16.7% Add: stock-based compensation 11.1
Add: amortization of product
related and other intangible assets 1.0
Non-GAAP operating margin 28.8%
Three
Months Ended September 30. 2020
GAAP net income $98,227
Add: stock-based
compensation 85,169
Add: amortization of product related and other intangible assets 7,097
Less: tax effects related to above items (16,759)
Non-GAAP net income $173,734
Three Months Ended
September 30, 2020
GAAP earn1ngs per share- diluted $0.78
Add: stock-based compensation 0.68
Add: amortization of product related and other intangible assets 0.06
Less: tax effects
related to above items (0.14)
Non-GAAP earnings per share- diluted $1.38
Forward Looking Guidance - GAAP to Non-GAAP Reconciliation
GAAP earnings per
share- diluted $3.48 - $3.69 $3.81 - $3.92
Add: adjustments to exclude the effects of expenses related to
stock-based compensation 2.52 2.49
Add: adjustments to exclude the effects of amortization of
intangible assets 0.22 0.22
Add: adjustments to exclude the effects of
restructuring charges 0.09 0.10
Less: tax effects related to above 1tems (0.66) - (0.67) (0.73)- (0.74)
Non-GAAP earnings per share- diluted $5.65 - $5.85 $5.89 - $5.99
Three Months Ended
December 31.2020
GAAP earnings per share- diluted $0.70 - $0.82
Add: adjustments to exclude the effects of expenses related to
stock - based compensation 0.68
Add: adjustments to exclude the effects of amortization of
intangible assets
0.05
Less: tax effects related to above 1tems (0.18) - (0.20)
Non-GAAP
earnings per share- diluted $1.25- $1.35
2020 | Q3 Financials 18
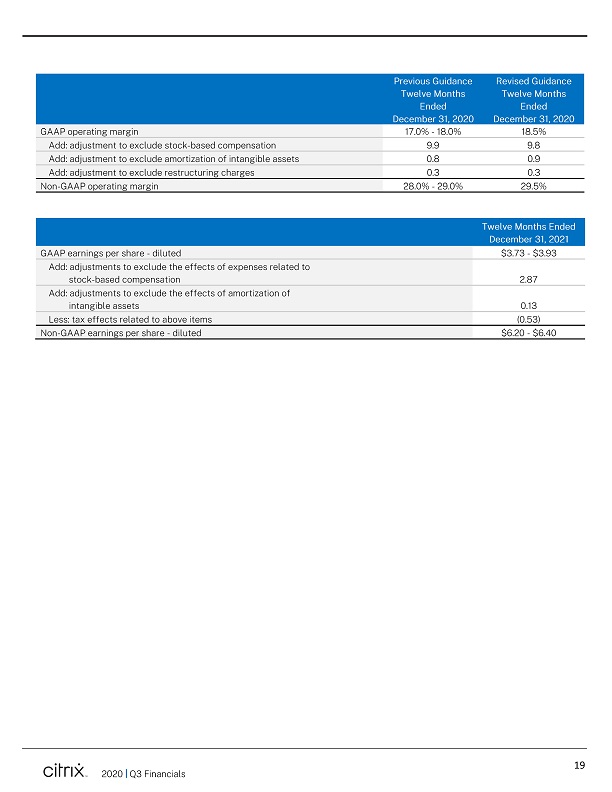
Previous Guidance Reused Guidance
Twelve Months
Twelve Months
Ended Ended
December 31, 2020 December 31. 2020
GAAP operating margin 17.0%- 18.0% 18.5%
Add: adjustment to exclude stock-based compensation
9.9 9.8
Add: adjustment to exclude amortization of intangible assets 0.8 0.9
Add: adjustment to exclude restructuring charges 0.3 0.3
Non-GAAP operating
margin 28.0% - 29.0% 29.5%
Twelve Months Ended
December 31, 2021
GAAP earnings per share- diluted $ 3.73 . $ 3.93
Add: adjustments to exclude the effects of
expenses related to
stock-based compensation 2.87
Add: adjustments to exclude
the effects of amortization of
intangible assets 0.13
Less: tax effects
related to above items (0.53)
Non-GAAP earnings per share- diluted $6.20 - $ 6.40
19
2020 Q3 Financials