Attached files
| file | filename |
|---|---|
| EX-99.1 - EX-99.1 - OLD SECOND BANCORP INC | osbc-20201021ex991f157d7.htm |
| 8-K - 8-K - OLD SECOND BANCORP INC | osbc-20201021x8k.htm |
Exhibit 99.2
| Old Second Bancorp, Inc. Loan Portfolio Disclosures As of June 30, 2020 |
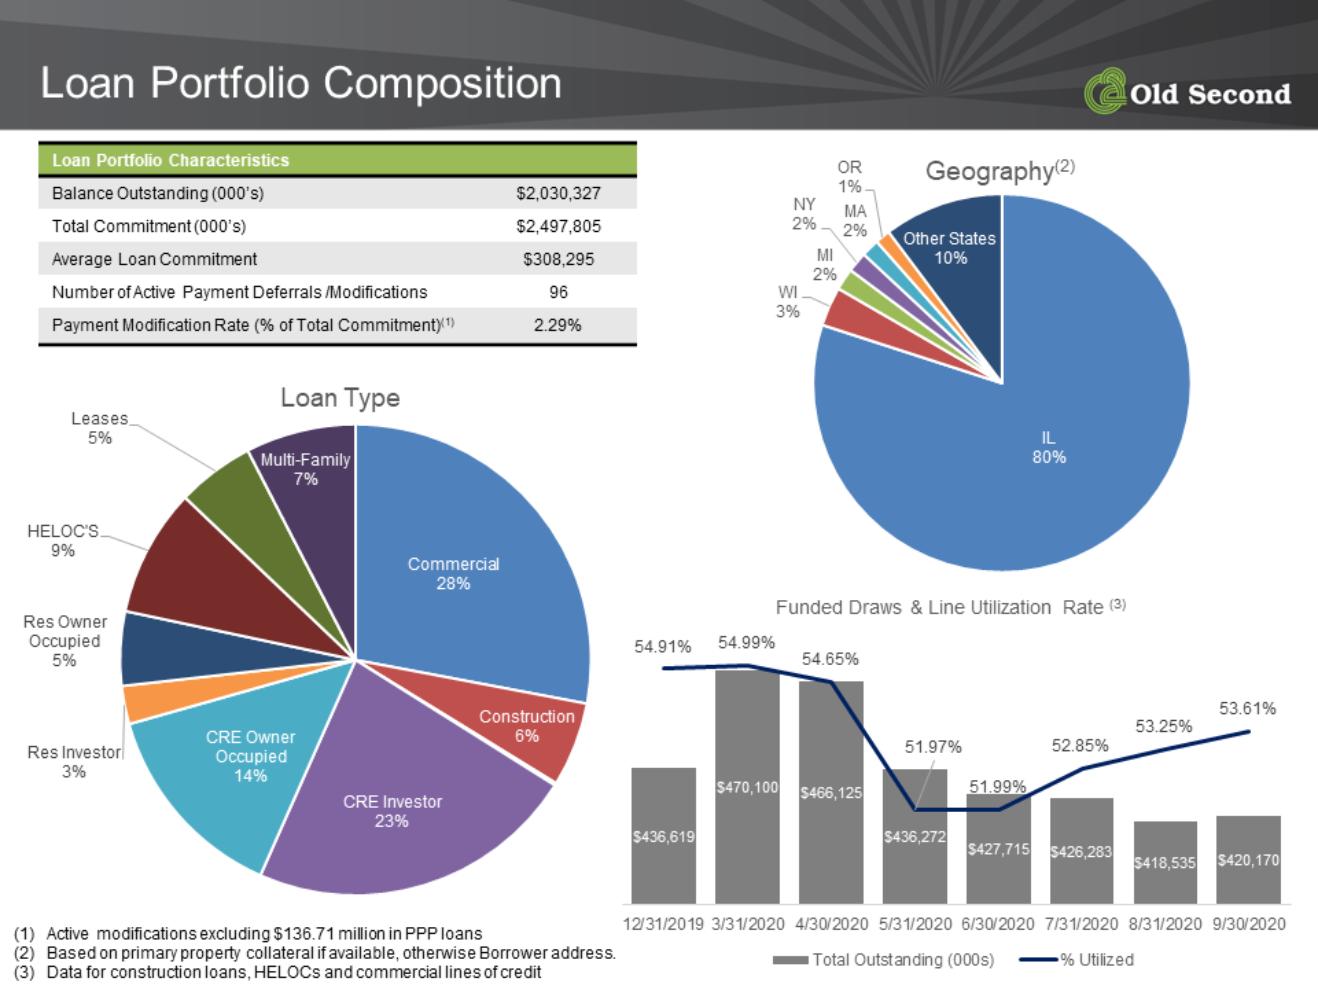
| Loan Portfolio Composition Loan Portfolio Characteristics Balance Outstanding (000’s) $2,052,336 Total Commitment (000’s) $2,539,355 Average Loan Commitment $352,024 Number of Payment Deferrals /Modifications 449 Payment Modification Rate (% of Total Commitment)* 9.03% Loan Portfolio Characteristics • Lending focused on full relationship, small and middle market businesses • Well diversified by industry with minimal exposure to high risk industries • Repayment analysis based on primary operating cash flow, supported by secondary and tertiary repayment sources • Full global cash flow and sensitivity analysis performed on all relationships over $1 million in exposure • Dedicated Leasing, C&I, CRE, Healthcare and Professional Service lending teams Commercial & Industrial 28% Construction 6% CRE Investor 21% CRE Owner- Occupied Farm Land 13% 1% Residential Investor 3% Residential Owner-Occupied 5% HELOC 10% Leasing 5% Multifamily 8% Loan Type IL 81% CA 2% NY 2% WI 4% MI 2% MA 1% Other States 8% Geography* *Based on primary property collateral if available, otherwise borrower address. *Excludes $133.89 million in PPP loans |
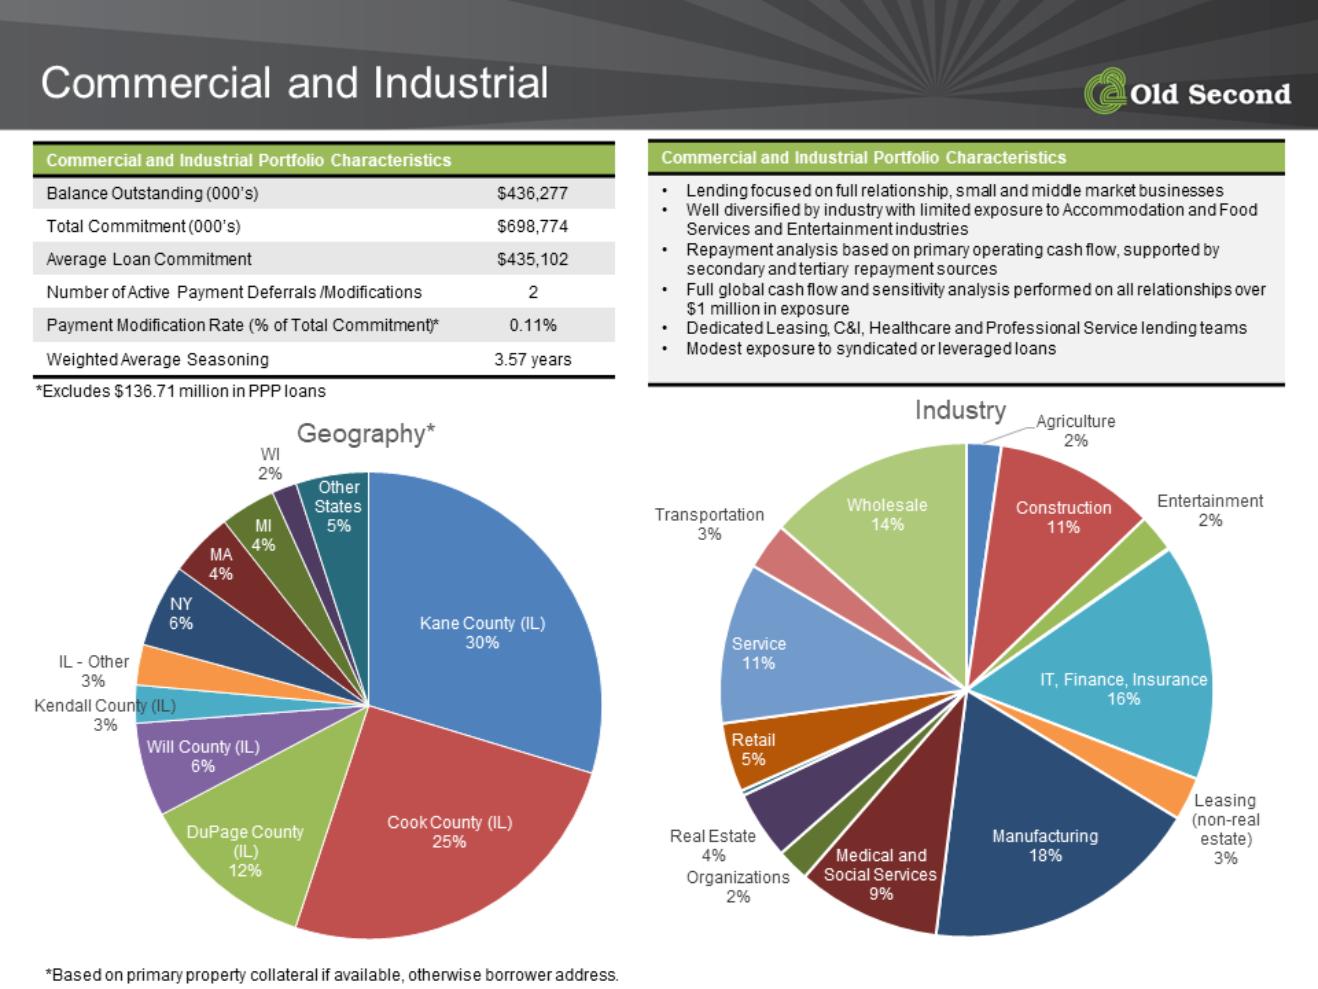
| Commercial and Industrial (includes Leasing) Commercial and Industrial Portfolio Characteristics Balance Outstanding (000’s) $574,935 Total Commitment (000’s) $838,075 Average Loan Commitment $351,247 Number of Payment Deferrals /Modifications 164 Payment Modification Rate (% of Total Commitment)* 6.16%* Weighted Average Seasoning 3.50 years Commercial and Industrial Portfolio Characteristics • Lending focused on full relationship, small and middle market businesses • Well diversified by industry with limited exposure to Accommodation and Food Services and Entertainment industries • Repayment analysis based on primary operating cash flow, supported by secondary and tertiary repayment sources • Full global cash flow and sensitivity analysis performed on all relationships over $1 million in exposure • Dedicated Leasing, C&I, Healthcare and Professional Service lending teams • Modest exposure to syndicated or leveraged loans DuPage County (IL) 11% Kane County (IL) 26% Kendall County (IL) 2% Cook County (IL) 23% Will County (IL) 7% IL Other 2% CA 2% MA 3% MI 3% NY 6% TX 2% WI 2% Other States 11% Geography* *Based on primary property collateral if available, otherwise borrower address. Accomodation and Food Services 2% Agriculture 3% Health Care 8% Information and Finance 13% Manufacturing 18% Administration and Support 2% Construction 15% Other Services 2% Professional Services 6% Rental and Leasing 7% Retail Trade 4% Transportation and Warehousing 6% Wholesale Trade 13% Industry *Excludes $133.89 million in PPP loans |
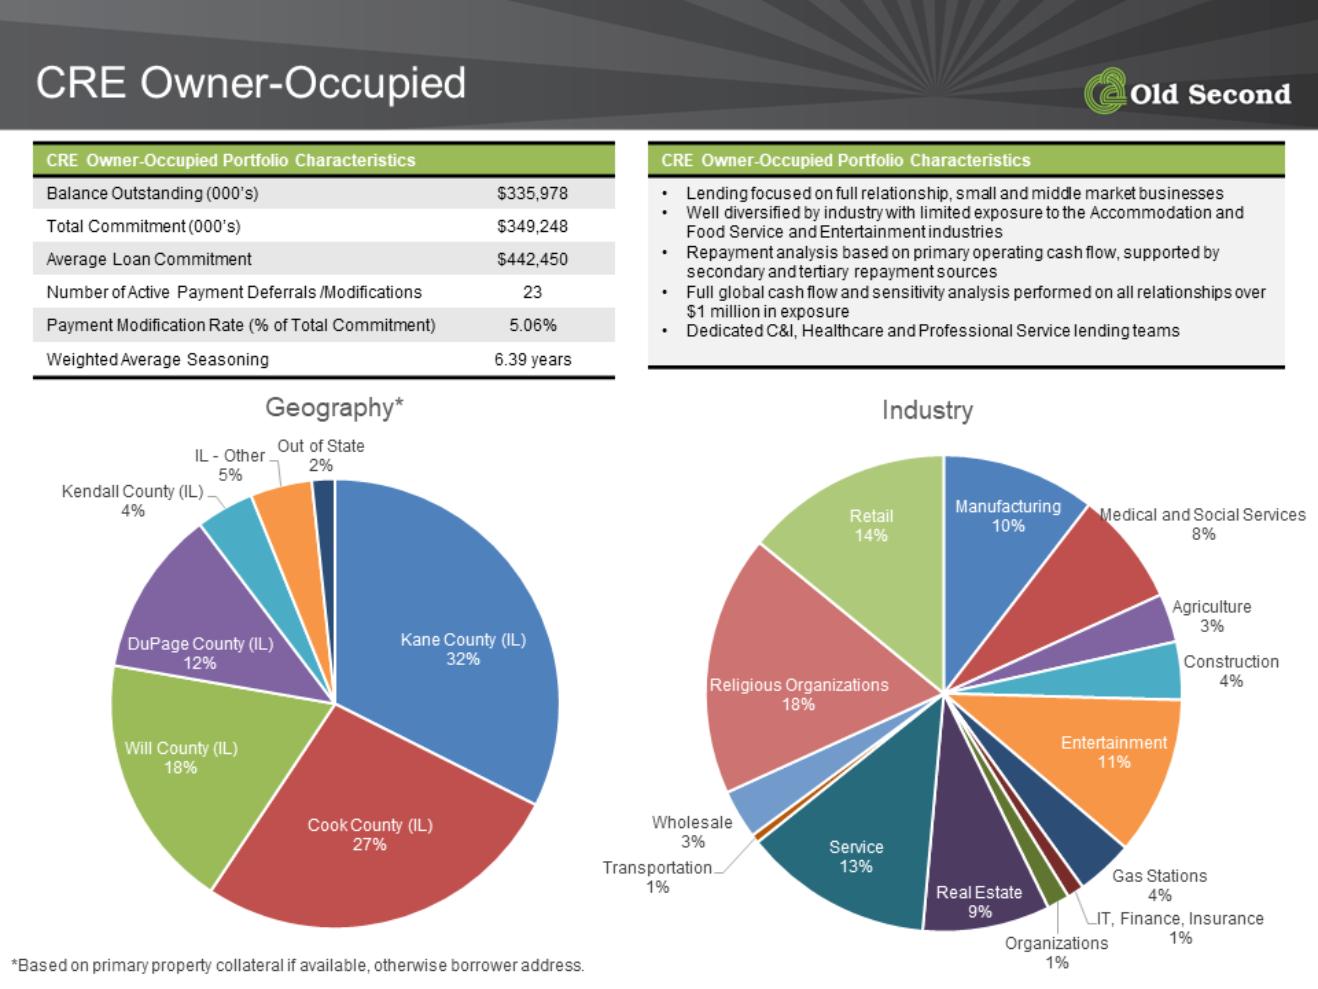
| CRE Owner-Occupied CRE Owner-Occupied Portfolio Characteristics Balance Outstanding (000’s) $343,982 Total Commitment (000’s) $357,453 Average Loan Commitment $549,928 Number of Payment Deferrals /Modifications 72 Payment Modification Rate (% of Total Commitment) 15.97% Weighted Average Seasoning 6.13 years Commercial and Industrial Portfolio Characteristics • Lending focused on full relationship, small and middle market businesses • Well diversified by industry with limited exposure to the Accommodation and Food Service and Entertainment industries • Repayment analysis based on primary operating cash flow, supported by secondary and tertiary repayment sources • Full global cash flow and sensitivity analysis performed on all relationships over $1 million in exposure • Dedicated C&I, Healthcare and Professional Service lending teams DuPage County (IL) 14% Kane County (IL) 28% Kendall County (IL) 5% Cook County (IL) 32% Will County (IL) 17% IL Other 2% Out of State 2% Geography* *Based on primary property collateral if available, otherwise borrower address. Accomodation and Food Services 3% Agriculture 3% Entertainment 7% Education 3% Health Care 9% Information and Finance 1% Manufacturing 10% Administration and Support 1% Construction 4% Other Services 23% Professional Services 4% Rental and Leasing 9% Retail Trade 18% Transportation and Warehousing 1% Wholesale Trade 3% Industry |
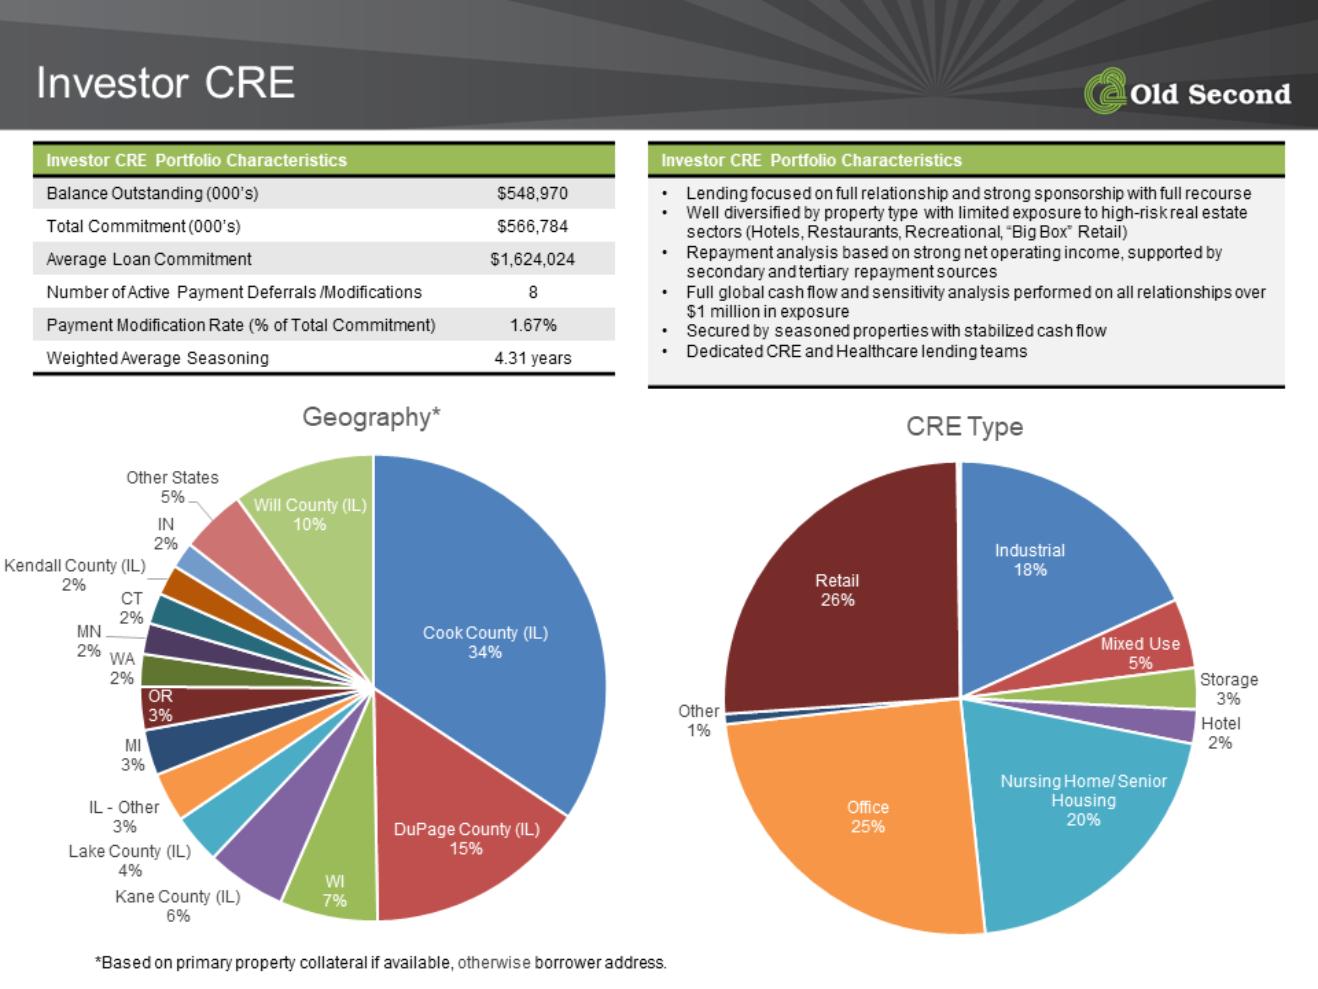
| CRE Investor (includes Multifamily) CRE Investor Portfolio Characteristics Balance Outstanding (000’s) $723,235 Total Commitment (000’s) $735,069 Average Loan Commitment $1,287,336 Number of Payment Deferrals /Modifications 56 Payment Modification Rate (% of Total Commitment) 11.22% Weighted Average Seasoning 4.41 years CRE Investor Portfolio Characteristics • Lending focused on full relationship and strong sponsorship • Well diversified by property type with limited exposure to high-risk real estate sectors (Hotel, Restaurant, Recreational and “Big Box” Retail) • Repayment analysis based on strong net operating income, supported by secondary and tertiary repayment sources • Full global cash flow and sensitivity analysis performed on all relationships over $1 million in exposure • Secured by seasoned properties with stabilized cash flow • Dedicated CRE and Healthcare lending teams Hotel 2% Industrial 13% Medical Office 2% Mini Storage 2% Mixed-Use 3% Office 16% Restaurant 2% Retail 15% Senior Housing 14% Multifamily 27% National Drugstore Chain 4% CRE Type DuPage County (IL) 12% Kane County (IL) 8% Cook County (IL) 47% Will County (IL) 7% IL Other 5% WI 8% MI 3% OH 2% CA 2% Other States 6% Geography* *Based on primary property collateral if available, otherwise borrower address. |
| CRE Non-Owner Occupied (excludes Multifamily) CRE Non-Owner Occupied Portfolio Characteristics Balance Outstanding (000’s) $525,714 Total Commitment (000’s) $535,551 Average Loan Commitment $1,525,785 Number of Payment Deferrals /Modifications 40 Payment Modification Rate (% of Total Commitment) 13.84% Weighted Average Seasoning 4.34 years CRE Non-Owner Occupied Portfolio Characteristics • Lending focused on full relationship and strong sponsorship with full recourse • Well diversified by property type with limited exposure to high-risk real estate sectors (Hotels, Restaurants, Recreational, “Big Box” Retail) • Repayment analysis based on strong net operating income, supported by secondary and tertiary repayment sources • Full global cash flow and sensitivity analysis performed on all relationships over $1 million in exposure • Secured by seasoned properties with stabilized cash flow • Dedicated CRE and Healthcare lending teams DuPage County (IL) 16% Kane County (IL) 9% Cook County (IL) 38% Will County (IL) 8% IL Other 5% CA 3% CT 2% IN 2% MI 3% OH 3% WI 7% Other States 4% Geography* *Based on primary property collateral if available, otherwise borrower address. Hotel 3% Industrial 24% Medical Office 4% Mini Storage 4% Mixed-Use 5% Office 29% Restaurant 3% Retail 27% CRE Type |
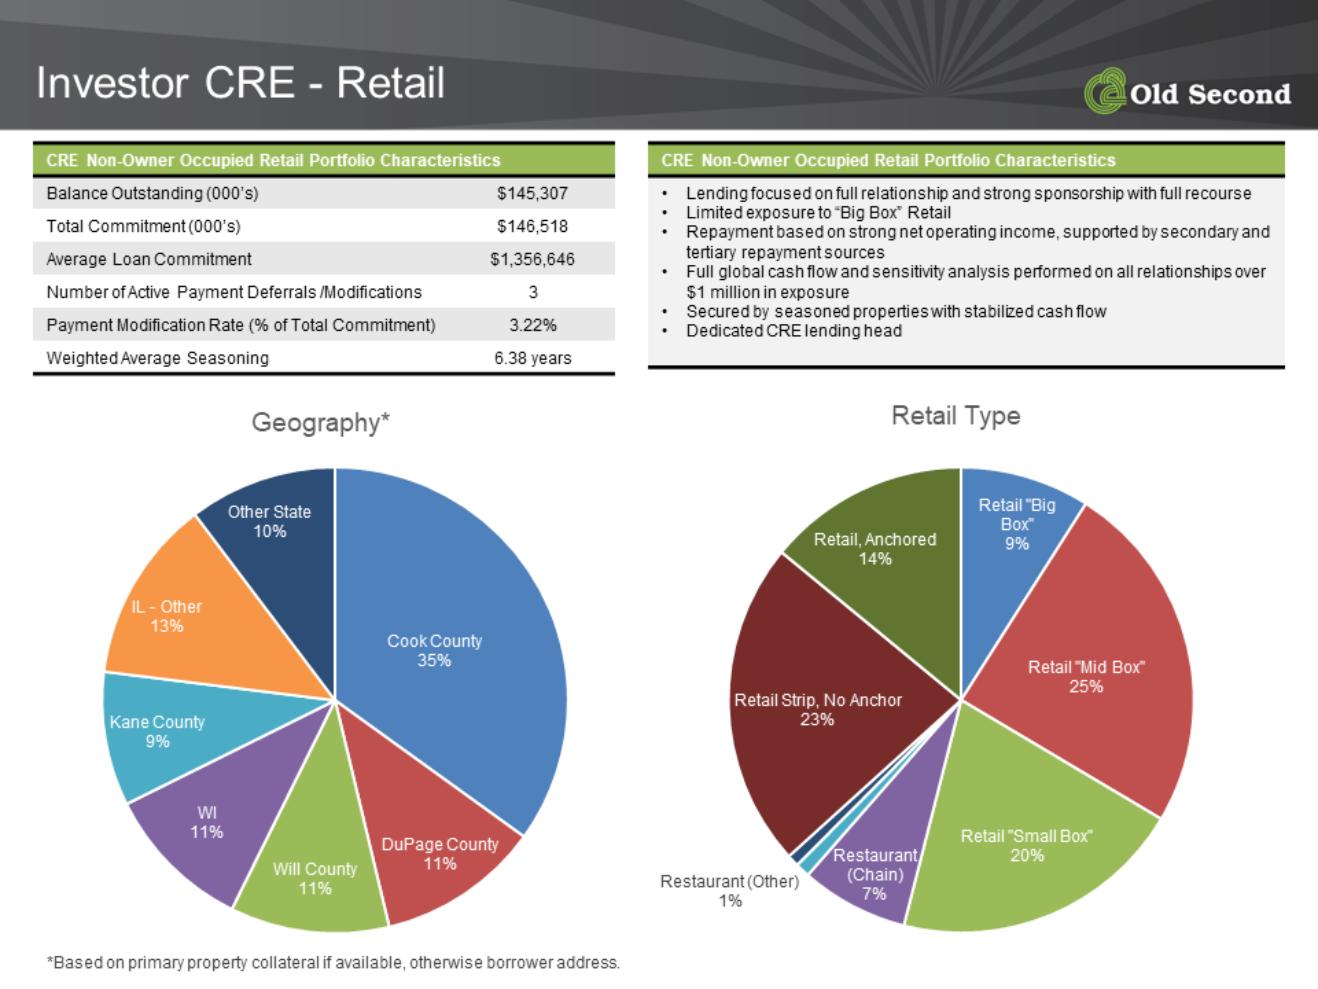
| CRE Non-Owner Occupied Retail CRE Non-Owner Occupied Retail Portfolio Characteristics Balance Outstanding (000’s) $109,284 Total Commitment (000’s) $110,536 Average Loan Commitment $1,300,425 Number of Payment Deferrals /Modifications 15 Payment Modification Rate (% of Total Commitment) 33.89% Weighted Average Seasoning 6.46 years CRE Non-Owner Occupied Retail Portfolio Characteristics • Lending focused on full relationship and strong sponsorship with full recourse • Limited exposure to “Big Box” Retail • Repayment based on strong net operating income, supported by secondary and tertiary repayment sources • Full global cash flow and sensitivity analysis performed on all relationships over $1 million in exposure • Secured by seasoned properties with stabilized cash flow • Dedicated CRE lending head Retail Strip, No Anchor 31% Retail "Big Box" 14% Retail "Mid Box" 5% Retail, Anchored 19% Retail "Small Box" 31% Retail Type DuPage County (IL) 14% Kane County (IL) 16% Cook County (IL) 35% Will County (IL) 9% IL Other 9% WI 14% GA 3% Geography* *Based on primary property collateral if available, otherwise borrower address. |
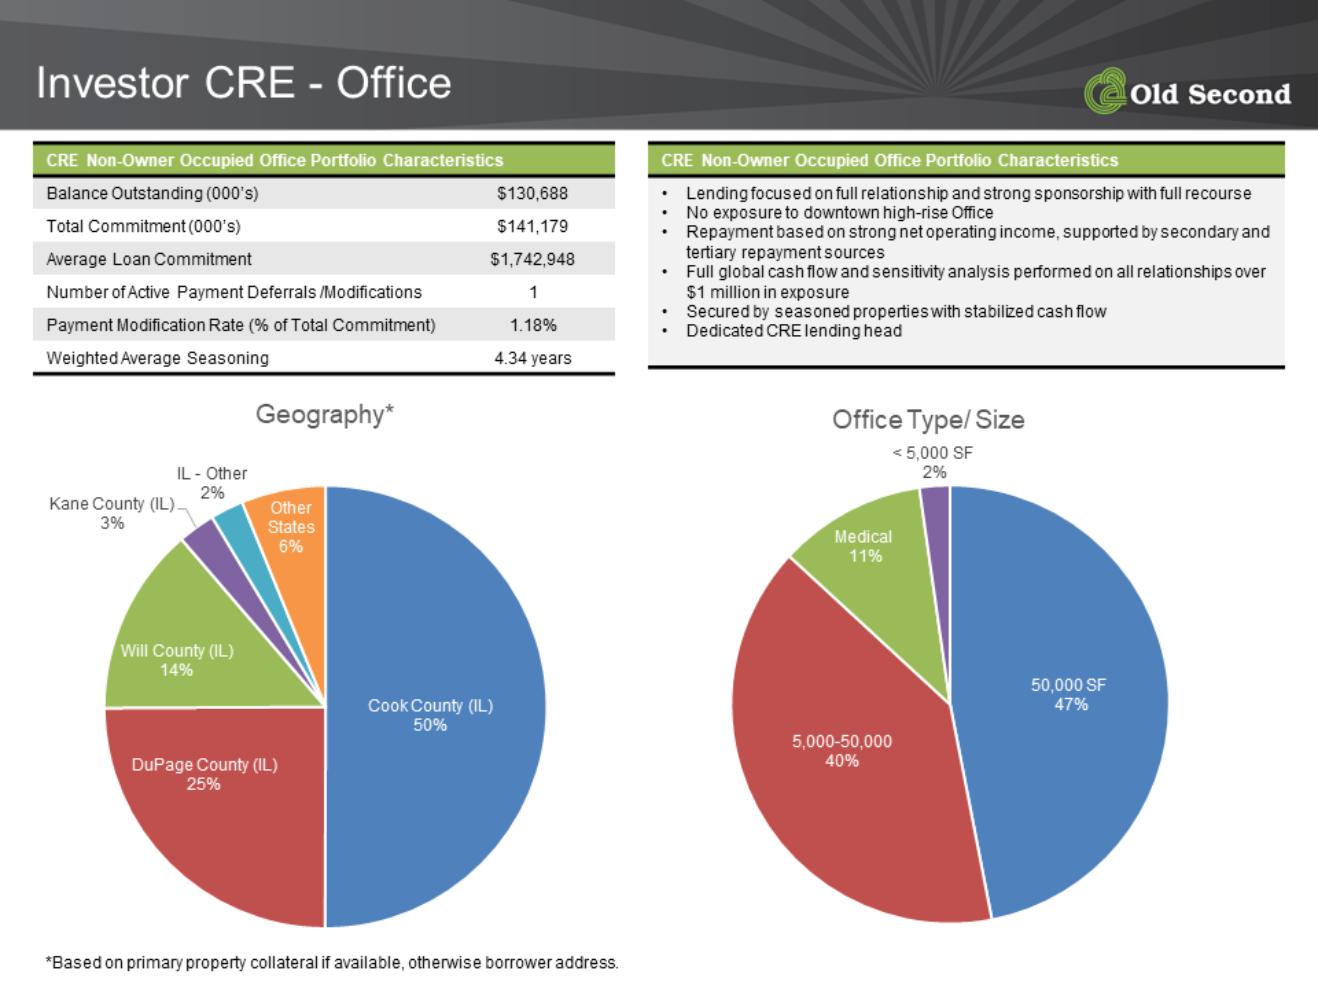
| CRE Non-Owner Occupied Office CRE Non-Owner Occupied Office Portfolio Characteristics Balance Outstanding (000’s) $114,953 Total Commitment (000’s) $118,127 Average Loan Commitment $1,618,172 Number of Payment Deferrals /Modifications 7 Payment Modification Rate (% of Total Commitment) 11.03% Weighted Average Seasoning 4.04 years CRE Non-Owner Occupied Office Portfolio Characteristics • Lending focused on full relationship and strong sponsorship with full recourse • No exposure to downtown high-rise Office • Repayment based on strong net operating income, supported by secondary and tertiary repayment sources • Full global cash flow and sensitivity analysis performed on all relationships over $1 million in exposure • Secured by seasoned properties with stabilized cash flow • Dedicated CRE lending head > 50,000 SF 49% 5,000 - 50,000 SF 4% < 5,000 SF 47% Office Property Size DuPage County (IL) 15% Kane County (IL) 9% Cook County (IL) 57% Will County (IL) 15% IL Other 2% Other States 2% Geography* *Based on primary property collateral if available, otherwise borrower address. |
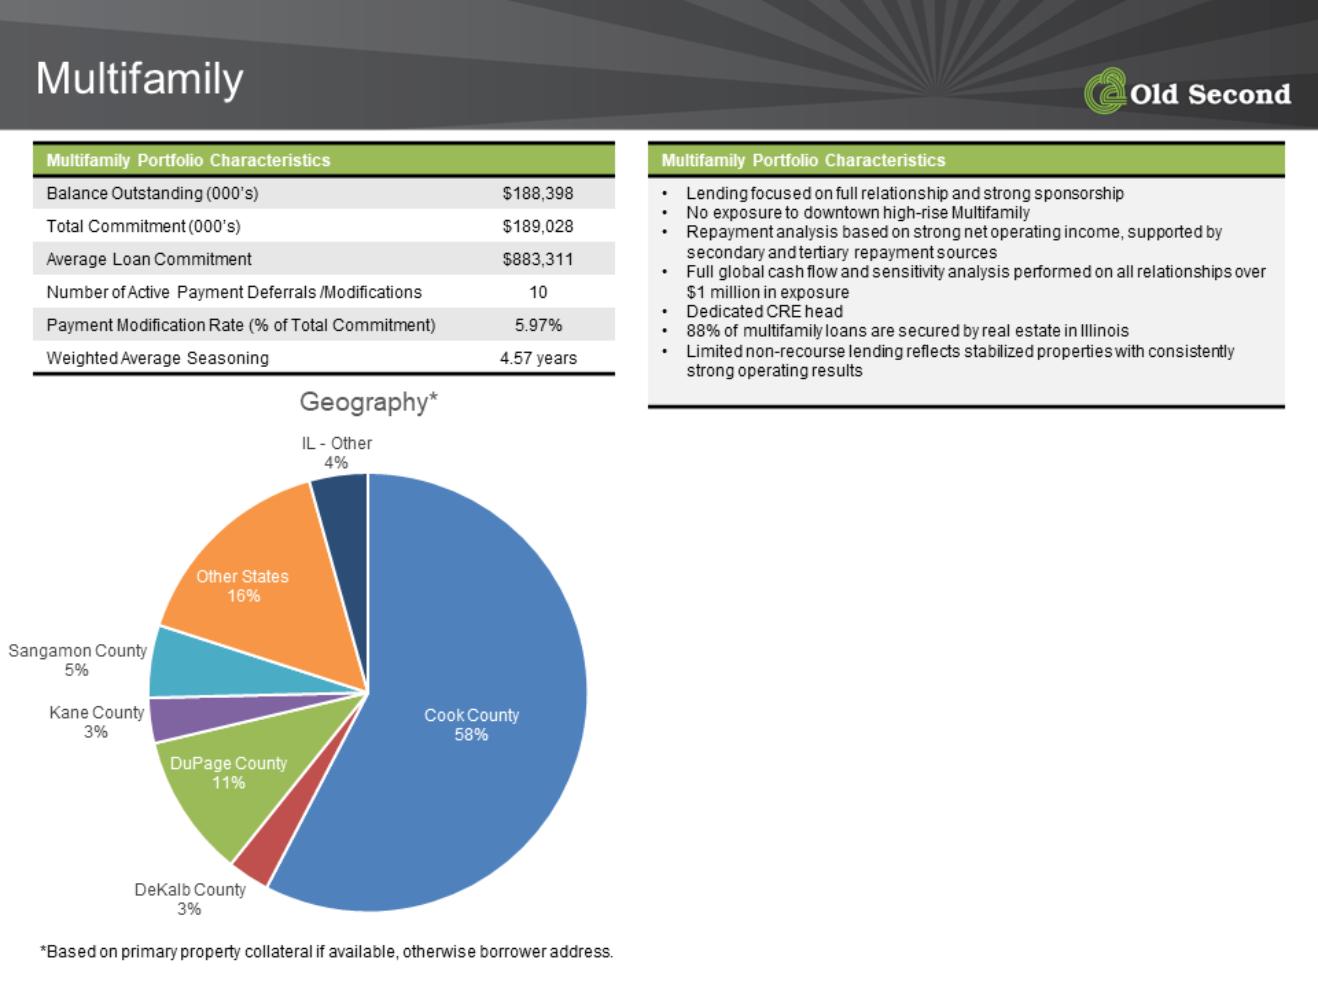
| Multifamily Multifamily Portfolio Characteristics Balance Outstanding (000’s) $197,521 Total Commitment (000’s) $199,519 Average Loan Commitment $906,902 Number of Payment Deferrals /Modifications 16 Payment Modification Rate (% of Total Commitment) 4.34% Weighted Average Seasoning 4.60 years Multifamily Portfolio Characteristics • Lending focused on full relationship and strong sponsorship • No exposure to downtown high-rise Multifamily • Repayment analysis based on strong net operating income, supported by secondary and tertiary repayment sources • Full global cash flow and sensitivity analysis performed on all relationships over $1 million in exposure • Dedicated CRE head • 88% of multifamily loans are secured by real estate in Illinois • Limited non-recourse lending reflects stabilized properties with consistently strong operating results DuPage County (IL) 2% Kane County (IL) 7% Cook County (IL) 72% DeKalb County (IL) 3% IL Other 4% WI 11% Other States 1% Geography* *Based on primary property collateral if available, otherwise borrower address. |
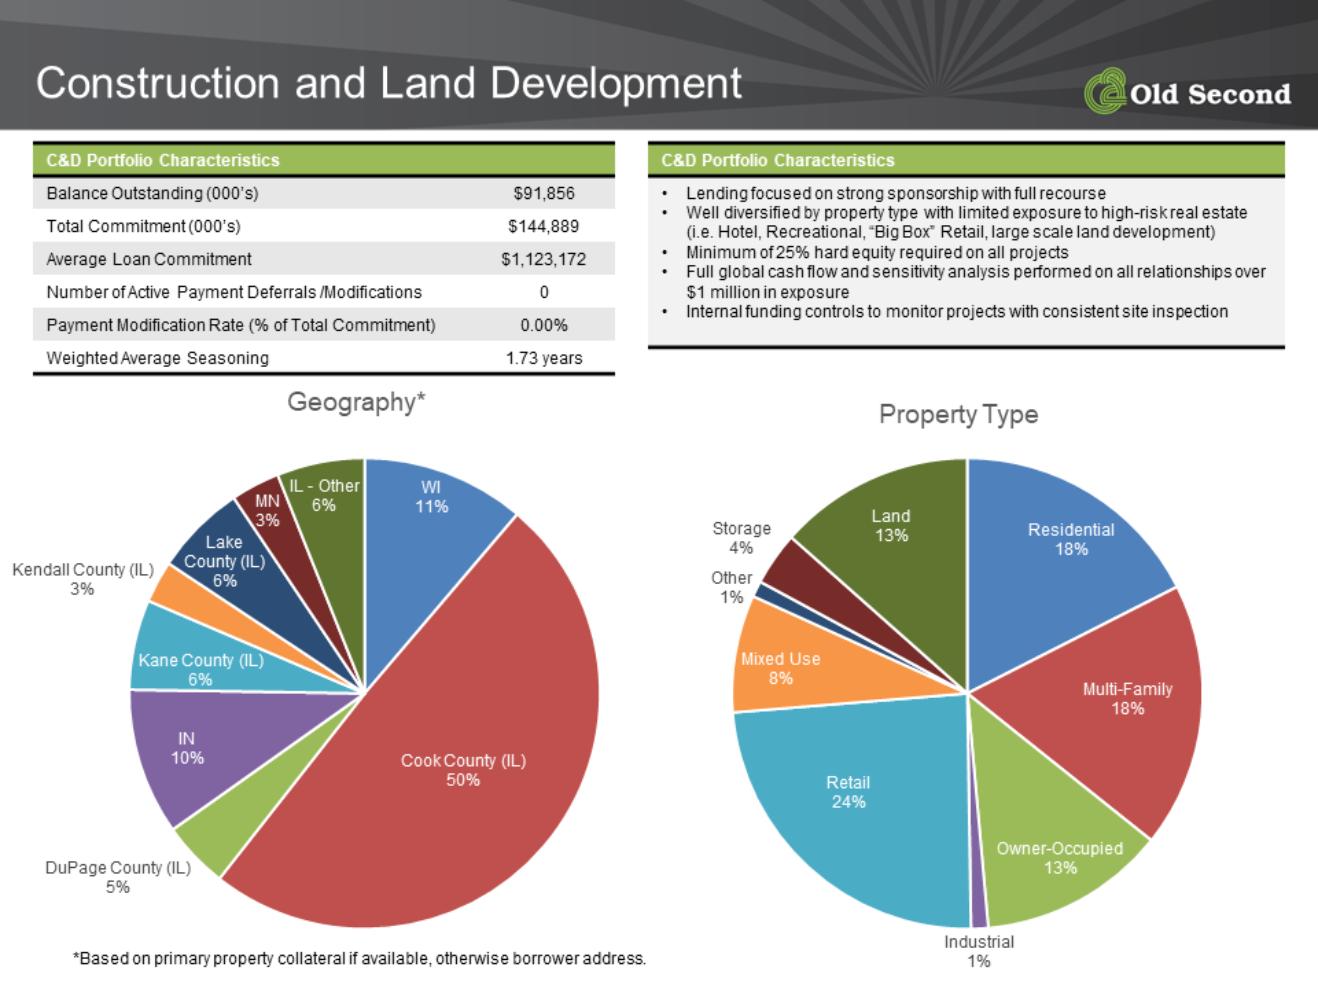
| Construction and Land Development C&D Portfolio Characteristics Balance Outstanding (000’s) $83,939 Total Commitment (000’s) $155,968 Average Loan Commitment $1,624,662 Number of Payment Deferrals /Modifications 2 Payment Modification Rate (% of Total Commitment 1.47% Weighted Average Seasoning 1.60 years C&D Portfolio Characteristics • Lending focused on strong sponsorship with full recourse • Well diversified by property type with limited exposure to high-risk real estate (i.e. Hotel, Recreational, “Big Box” Retail, large scale land development) • Minimum of 25% hard equity required on all projects • Full global cash flow and sensitivity analysis performed on all relationships over $1 million in exposure • Internal funding controls to monitor projects with consistent site inspection Industrial 1% Land 10% Mixed-Use 14% Multifamily 15% Office 7% Recreational 1% Residential 17% Retail 22% Owner-Occupied 13% Property Type DuPage County (IL) 21% Kane County (IL) 5% Cook County (IL) 39% Lake County (IL) 5% Will County (IL) 5% IL Other 3% WI 10% MN 3% IN 9% Geography* *Based on primary property collateral if available, otherwise borrower address. |
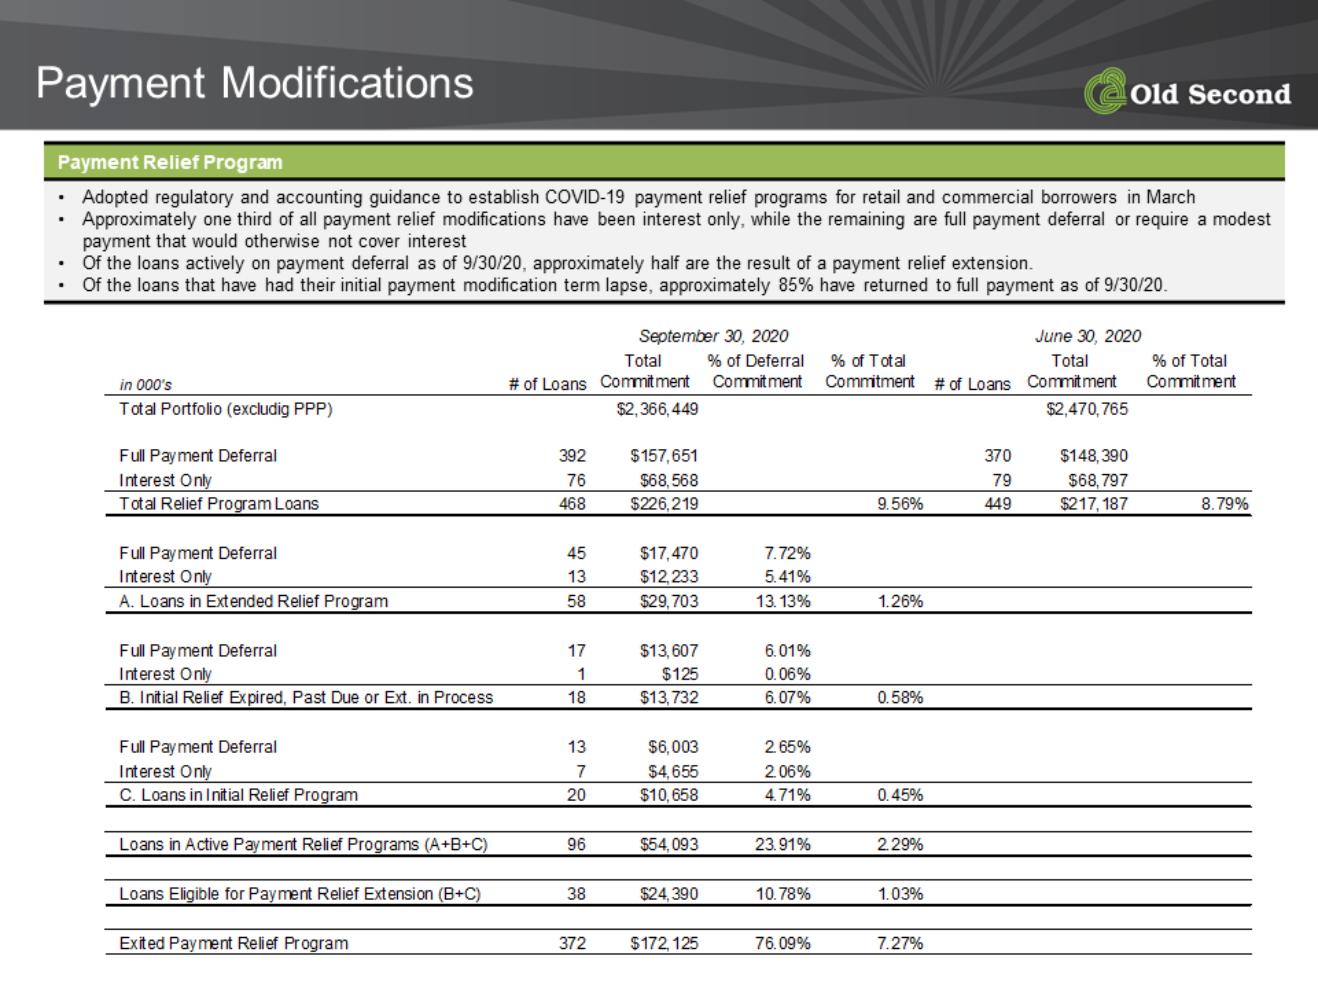
| Payment Modifications Payment Modifications Balance Outstanding (000’s) $216,381 Total Commitment (000’s) $217,188 Average Loan Commitment $483,715 Number of Payment Deferrals /Modifications 449 Payment Modification Rate (% of Total Commitment) 9.03%* Payment Modifications • Adopted regulatory and accounting guidance to establish COVID-19 modification program for retail and commercial borrowers in March • Approximately one third of all payment modifications are interest only, while two thirds are full payment deferral or require a modest payment that would otherwise not cover interest • 85% of payment modifications are for a term of 90 days or less, the remainder are for 120 days or 180 days Payment Deferral Interest Only 55% 32% Payment Modification 13% Modification Type *Five CRE Non-Owner Occupied Retail loans totaling $17.98 million requested payment deferral, but have been making full payments. Excluding these borrowers would reduce the Payment Modification Rate to 8.28% and reduce the % of CRE Non-Owner Occupied payment modifications from 34% to 28% of total modifications. Commercial & Industrial 20% CRE Owner-Occupied 26% CRE Non-Owner Occupied 34% Multifamily 4% Construction 1% HELOC 3% 1-4 Family Closed- End 12% Modifications by Loan Type |
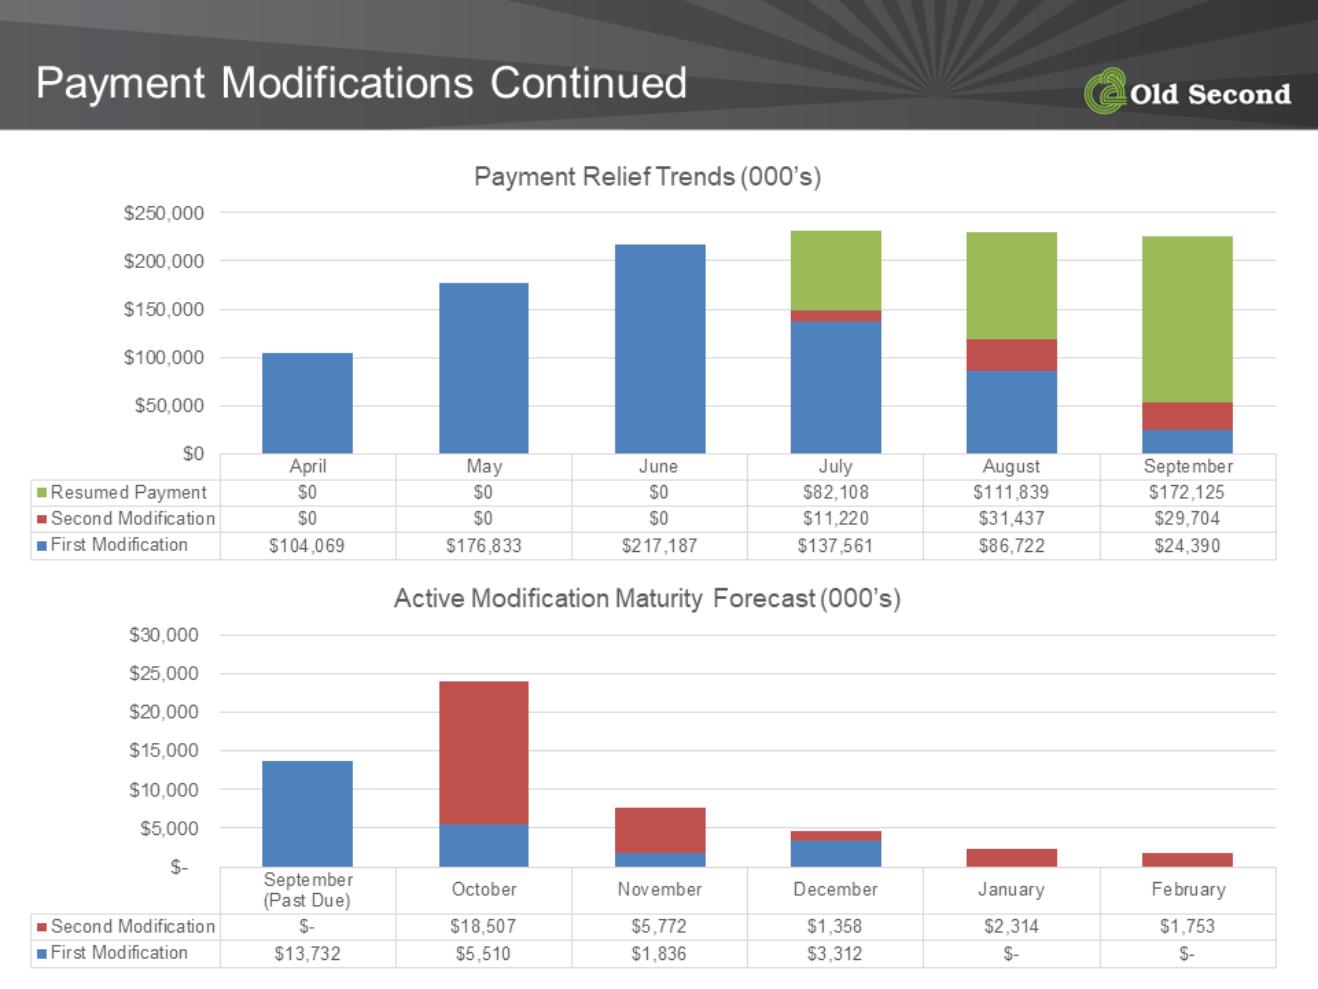
| Payment Modifications Continued • Processed first COVID payment modification in late March and a total of 449 COVID payment modifications through June 30, 2020. • The payment modification requests has abated since the end of May with a total of 42 modifications in progress through June 30, 2020. • Less than 40% of Commercial (C&I, CRE Owner-Occupied, CRE Investor) payment modifications are expected to be extended to 6 months based on early indications from borrowers currently in payment modification arrangements. March April May June % of Total Portfolio 0.09% 4.26% 7.24% 9.03% Construction $- $- $2,599,983 $2,599,983 C&I and Leasing $2,031,669 $23,559,117 $30,403,990 $43,368,509 CRE Owner-Occ. $- $32,729,791 $46,889,418 $57,072,438 CRE Non-Owner $- $24,354,261 $61,894,016 $74,102,754 Multifamily $- $2,805,085 $6,660,132 $8,651,255 Residential and Consumer $- $20,620,675 $28,385,785 $31,392,682 $- $50,000,000 $100,000,000 $150,000,000 $200,000,000 $250,000,000 Payment Modification Trends |
| Payment Modifications Continued Loan Portfolio Total Portfolio Commitment (000’s) % of Total Commitment (000’s) Total Commitment Deferred (000’s) % of Total Portfolio Deferred Weighted LTV CRE-secured Deferred Loans Commercial & Industrial (inc. Leasing) $704,183* 28.22% $43,369 6.16% NA Construction Industry $123,129 4.85% $7,963 6.47% NA Transportation Industry $50,887 2.00% $10,320 20.28% NA Bars & Restaurants $12,316 0.49% $3,759 30.52% NA Day Care Providers $4,119 0.16% $1,775 43.09% NA Real Estate & Leasing $60,615 2.39% $5,000 8.25% NA CRE Owner-Occupied $357,453 14.08% $57,072 15.97% 64% Religious Organizations $60,892 2.40% $18,171 29.84% 67% Day Care Providers $4,446 0.18% $4,446 100.00% 74% Gas Stations $18,988 0.75% $5,575 29.36% 60% Performing Arts Theatre $4,492 0.18% $4,492 100.00% 74% Bars & Restaurants $10,750 0.42% $4,794 44.60% 65% Recreation $17,028 0.67% $2,727 16.01% 26% CRE Non-Owner Occupied $535,551 21.09% $74,103 13.84%** 58% Retail $110,284 4.37% $37,463 33.89%** 59% Hotel $13,224 0.52% $13,224 100.00% 48% Restaurant $12,612 0.50% $1,658 13.15% 36% Office $118,127 4.65% $13,028 11.03% 66% Multifamily $199,519 7.86% $8,651 4.34% 58% • Payment modifications are intended to assist borrowers impacted by COVID-19. As such, businesses most impacted by social distancing guidelines and government shutdown have requested and have been granted payment modification to date (see below). • All loan modifications listed below qualify for temporary suspension of TDR requirements per Section 4013 of the CARES Act. *Excludes $133.89 million in PPP loans. **Excluding five loans that had requested payment deferral, but have continued to make full payment, the CRE Non-Owner Occupied rate would be reduced from 13.84% to 10.50% and the CRE NOO Retail rate would be reduced from 33.89% to 17.66%. |
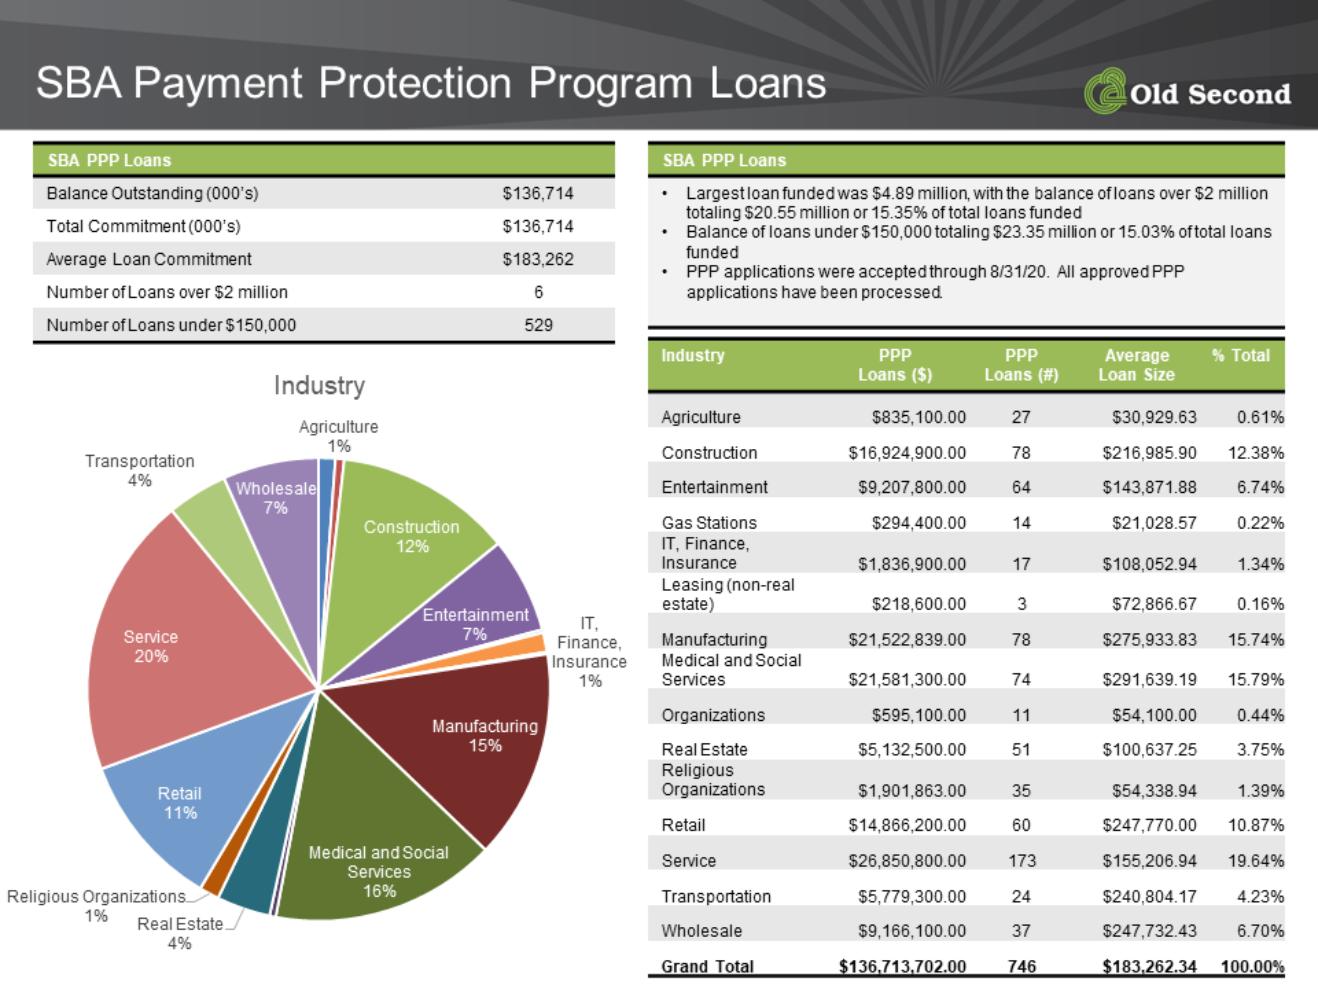
| SBA Payment Protection Program Loans Accomodation and Food Services 6% Entertainment 1% Education 4% Health Care 15% Information and Finance 1% Manufacturing 16% Administration and Support 4% Construction Other Services 13% 5% Professional Services 9% Rental and Leasing 4% Retail Trade 11% Transportation and Warehousing 4% Wholesale Trade 7% Industry April May June Loans Booked 267 630 669 Volume ($) $96,260,916 $131,122,702 $133,892,302 $- $20,000,000 $40,000,000 $60,000,000 $80,000,000 $100,000,000 $120,000,000 $140,000,000 $160,000,000 PPP Funding YTD SBA PPP Loans Balance Outstanding (000’s) $133,892 Total Commitment (000’s) $133,892 Average Loan Commitment $200,138 Number of Loans over $2 million 6 Number of Loans under $150,000 454 SBA PPP Loans • Largest loan funded was $4.89 million, with the balance of loans over $2 million totaling $20.55 million or 15.35% of total loans funded • Balance of loans under $150,000 totaling $23.35 million or 17.44% of total loans funded • Continuing to accept PPP applications, albeit at very low dollar amounts |
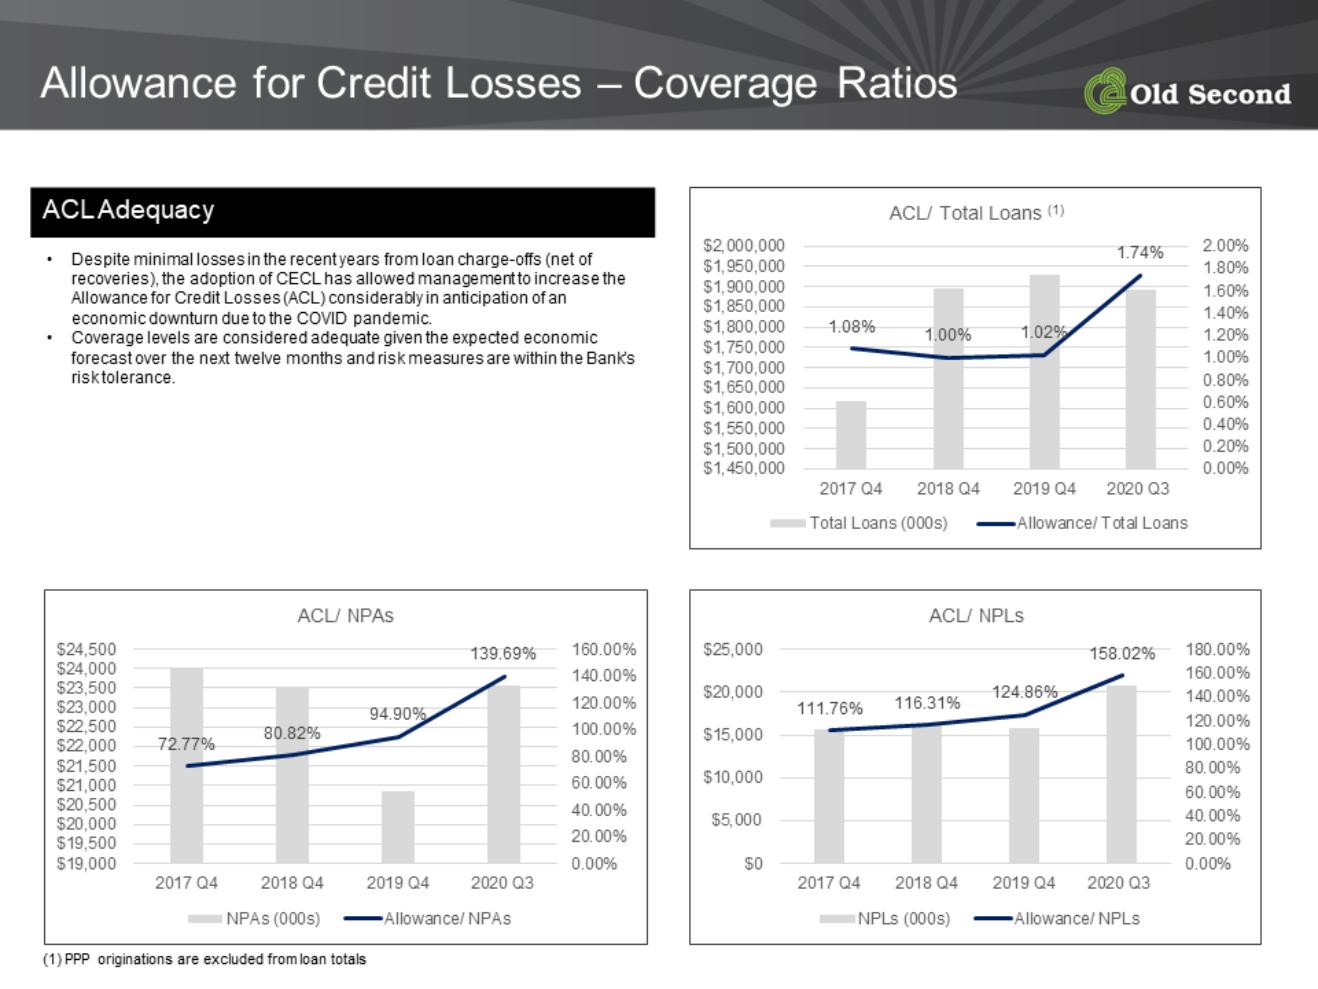
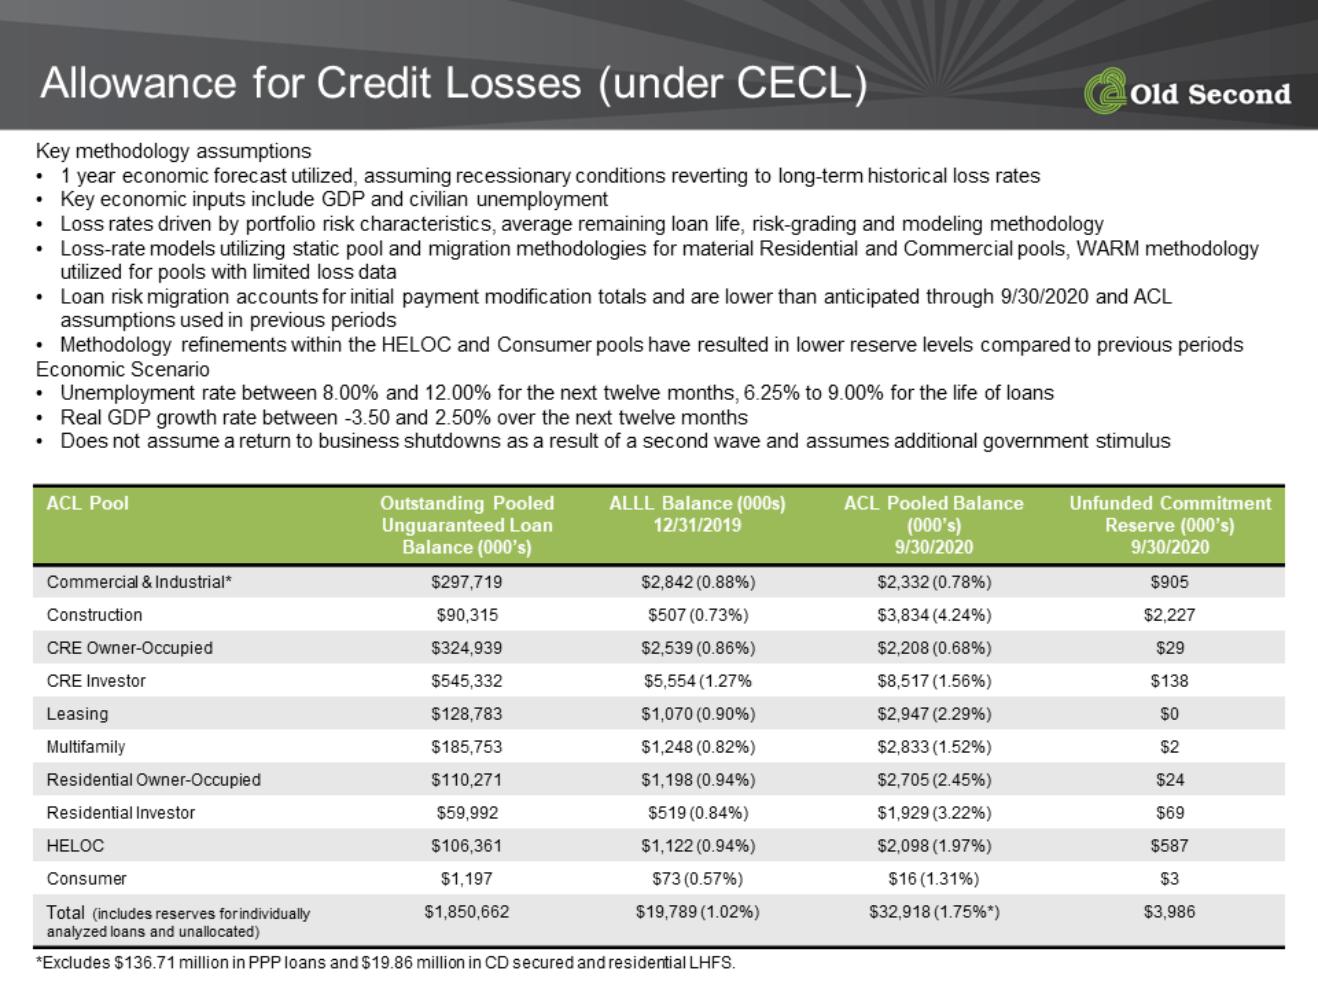
| Allowance for Credit Losses (under CECL) ACL Pool Outstanding Pooled Unguaranteed Loan Balance (000’s) ALLL Balance (000s) 12/31/2019 ACL Pooled Balance (000’s) 6/30/2020 Unfunded Commitment Reserve (000’s) 6/30/2020 Commercial & Industrial* $305,903 $2,842 (0.88%) $2,274 (0.74%) $985 Construction $82,024 $507 (0.73%) $3,498 (4.27%) $3,063 CRE Owner-Occupied $334,688 $2,539 (0.86%) $2,261 (0.68%) $33 CRE Investor $521,973 $5,554 (1.27% $7,599 (1.46%) $0 Leasing $132,009 $1,070 (0.90%) $1,939 (1.47%) $0 Multifamily $195,174 $1,248 (0.82%) $3,036 (1.56%) $9 Residential Owner-Occupied $121,494 $1,198 (0.94%) $3,055 (2.51%) $46 Residential Investor $67,719 $519 (0.84%) $2,207 (3.26%) $65 HELOC $112,927 $1,122 (0.94%) $2,399 (2.12%) $761 Consumer $1,196 $73 (0.57%) $18 (1.48%) $3 Total (includes reserves for individually analyzed loans and unallocated) $1,875,488 $19,789 (1.02%) $31,274 (1.63%*) $4,966 Key methodology assumptions • 1 year economic forecast utilized, assuming recessionary conditions reverting to long-term historical loss rates • Key economic inputs include GDP and civilian unemployment • Loss rates driven by portfolio risk characteristics, average remaining loan life, risk-grading and modeling methodology • Loss-rate models utilizing static pool and migration methodologies for material Residential and Commercial pools, WARM methodology utilized for pools with limited loss data • Loan risk migration accounts for initial payment modification totals and are lower than anticipated through 6/30/2020 and ACL assumptions used in previous periods • Methodology refinements within the HELOC and Consumer pools have resulted in lower reserve levels compared to previous periods Economic Scenario • Unemployment rate between 8.00% and 12.00% for the next twelve months, 6.25% to 10.00% for the life of loans • Real GDP growth rate between -5.00 and 2.00% over the next twelve months • Does not assume a return to business shutdowns as a result of a second wave and assumes additional government stimulus *Excludes $133.89 million in PPP loans |
| Allowance for Credit Losses (under CECL) ACL Pool Outstanding Pooled Unguaranteed Loan Balance (000’s) ALLL Balance (000s) 12/31/2019 ACL Pooled Balance (000’s) 6/30/2020 Unfunded Commitment Reserve (000’s) 6/30/2020 Commercial & Industrial* $305,903 $2,842 (0.88%) $2,274 (0.74%) $985 Construction $82,024 $507 (0.73%) $3,498 (4.27%) $3,063 CRE Owner-Occupied $334,688 $2,539 (0.86%) $2,261 (0.68%) $33 CRE Investor $521,973 $5,554 (1.27% $7,599 (1.46%) $0 Leasing $132,009 $1,070 (0.90%) $1,939 (1.47%) $0 Multifamily $195,174 $1,248 (0.82%) $3,036 (1.56%) $9 Residential Owner-Occupied $121,494 $1,198 (0.94%) $3,055 (2.51%) $46 Residential Investor $67,719 $519 (0.84%) $2,207 (3.26%) $65 HELOC $112,927 $1,122 (0.94%) $2,399 (2.12%) $761 Consumer $1,196 $73 (0.57%) $18 (1.48%) $3 Total (includes reserves for individually analyzed loans and unallocated) $1,875,488 $19,789 (1.02%) $31,274 (1.63%*) $4,966 Key methodology assumptions • 1 year economic forecast utilized, assuming recessionary conditions reverting to long-term historical loss rates • Key economic inputs include GDP and civilian unemployment • Loss rates driven by portfolio risk characteristics, average remaining loan life, risk-grading and modeling methodology • Loss-rate models utilizing static pool and migration methodologies for material Residential and Commercial pools, WARM methodology utilized for pools with limited loss data • Loan risk migration accounts for initial payment modification totals and are lower than anticipated through 6/30/2020 and ACL assumptions used in previous periods • Methodology refinements within the HELOC and Consumer pools have resulted in lower reserve levels compared to previous periods Economic Scenario • Unemployment rate between 8.00% and 12.00% for the next twelve months, 6.25% to 10.00% for the life of loans • Real GDP growth rate between -5.00 and 2.00% over the next twelve months • Does not assume a return to business shutdowns as a result of a second wave and assumes additional government stimulus *Excludes $133.89 million in PPP loans |
| Allowance for Credit Losses (under CECL) ACL Pool Outstanding Pooled Unguaranteed Loan Balance (000’s) ALLL Balance (000s) 12/31/2019 ACL Pooled Balance (000’s) 6/30/2020 Unfunded Commitment Reserve (000’s) 6/30/2020 Commercial & Industrial* $305,903 $2,842 (0.88%) $2,274 (0.74%) $985 Construction $82,024 $507 (0.73%) $3,498 (4.27%) $3,063 CRE Owner-Occupied $334,688 $2,539 (0.86%) $2,261 (0.68%) $33 CRE Investor $521,973 $5,554 (1.27% $7,599 (1.46%) $0 Leasing $132,009 $1,070 (0.90%) $1,939 (1.47%) $0 Multifamily $195,174 $1,248 (0.82%) $3,036 (1.56%) $9 Residential Owner-Occupied $121,494 $1,198 (0.94%) $3,055 (2.51%) $46 Residential Investor $67,719 $519 (0.84%) $2,207 (3.26%) $65 HELOC $112,927 $1,122 (0.94%) $2,399 (2.12%) $761 Consumer $1,196 $73 (0.57%) $18 (1.48%) $3 Total (includes reserves for individually analyzed loans and unallocated) $1,875,488 $19,789 (1.02%) $31,274 (1.63%*) $4,966 Key methodology assumptions • 1 year economic forecast utilized, assuming recessionary conditions reverting to long-term historical loss rates • Key economic inputs include GDP and civilian unemployment • Loss rates driven by portfolio risk characteristics, average remaining loan life, risk-grading and modeling methodology • Loss-rate models utilizing static pool and migration methodologies for material Residential and Commercial pools, WARM methodology utilized for pools with limited loss data • Loan risk migration accounts for initial payment modification totals and are lower than anticipated through 6/30/2020 and ACL assumptions used in previous periods • Methodology refinements within the HELOC and Consumer pools have resulted in lower reserve levels compared to previous periods Economic Scenario • Unemployment rate between 8.00% and 12.00% for the next twelve months, 6.25% to 10.00% for the life of loans • Real GDP growth rate between -5.00 and 2.00% over the next twelve months • Does not assume a return to business shutdowns as a result of a second wave and assumes additional government stimulus *Excludes $133.89 million in PPP loans |
| Allowance for Credit Losses (under CECL) ACL Pool Outstanding Pooled Unguaranteed Loan Balance (000’s) ALLL Balance (000s) 12/31/2019 ACL Pooled Balance (000’s) 6/30/2020 Unfunded Commitment Reserve (000’s) 6/30/2020 Commercial & Industrial* $305,903 $2,842 (0.88%) $2,274 (0.74%) $985 Construction $82,024 $507 (0.73%) $3,498 (4.27%) $3,063 CRE Owner-Occupied $334,688 $2,539 (0.86%) $2,261 (0.68%) $33 CRE Investor $521,973 $5,554 (1.27% $7,599 (1.46%) $0 Leasing $132,009 $1,070 (0.90%) $1,939 (1.47%) $0 Multifamily $195,174 $1,248 (0.82%) $3,036 (1.56%) $9 Residential Owner-Occupied $121,494 $1,198 (0.94%) $3,055 (2.51%) $46 Residential Investor $67,719 $519 (0.84%) $2,207 (3.26%) $65 HELOC $112,927 $1,122 (0.94%) $2,399 (2.12%) $761 Consumer $1,196 $73 (0.57%) $18 (1.48%) $3 Total (includes reserves for individually analyzed loans and unallocated) $1,875,488 $19,789 (1.02%) $31,274 (1.63%*) $4,966 Key methodology assumptions • 1 year economic forecast utilized, assuming recessionary conditions reverting to long-term historical loss rates • Key economic inputs include GDP and civilian unemployment • Loss rates driven by portfolio risk characteristics, average remaining loan life, risk-grading and modeling methodology • Loss-rate models utilizing static pool and migration methodologies for material Residential and Commercial pools, WARM methodology utilized for pools with limited loss data • Loan risk migration accounts for initial payment modification totals and are lower than anticipated through 6/30/2020 and ACL assumptions used in previous periods • Methodology refinements within the HELOC and Consumer pools have resulted in lower reserve levels compared to previous periods Economic Scenario • Unemployment rate between 8.00% and 12.00% for the next twelve months, 6.25% to 10.00% for the life of loans • Real GDP growth rate between -5.00 and 2.00% over the next twelve months • Does not assume a return to business shutdowns as a result of a second wave and assumes additional government stimulus *Excludes $133.89 million in PPP loans |