Attached files
| file | filename |
|---|---|
| 8-K - 8-K - BOK FINANCIAL CORP | bokf-20201021.htm |

Third Quarter 2020 Earnings Conference Call October 21, 2020 1

Legal Disclaimers Forward-Looking Statements: This presentation contains forward-looking statements that are based on management's beliefs, assumptions, current expectations, estimates and projections about BOK Financial Corporation, the financial services industry, the economy generally and the expected or potential impact of the novel coronavirus (COVID-19) pandemic, and the related responses of the government, consumers, and others, on our business, financial condition and results of operations. Words such as “anticipates,” “believes,” “estimates,” “expects,” “forecasts,” “plans,” “projects,” “will,” “intends,” variations of such words and similar expressions are intended to identify such forward-looking statements. Management judgments relating to and discussion of the provision and allowance for credit losses, allowance for uncertain tax positions, accruals for loss contingencies and valuation of mortgage servicing rights involve judgments as to expected events and are inherently forward-looking statements. Assessments that acquisitions and growth endeavors will be profitable are necessary statements of belief as to the outcome of future events based in part on information provided by others which BOK Financial has not independently verified. These various forward-looking statements are not guarantees of future performance and involve certain risks, uncertainties, and assumptions which are difficult to predict with regard to timing, extent, likelihood and degree of occurrence. Therefore, actual results and outcomes may materially differ from what is expected, implied or forecasted in such forward-looking statements. Internal and external factors that might cause such a difference include, but are not limited to changes in government, consumer or business responses to, and ability to treat or prevent further outbreak of, the COVID-19 pandemic, changes in commodity prices, interest rates and interest rate relationships, inflation, demand for products and services, the degree of competition by traditional and nontraditional competitors, changes in banking regulations, tax laws, prices, levies and assessments, the impact of technological advances, and trends in customer behavior as well as their ability to repay loans. For a discussion of risk factors that may cause actual results to differ from expectations, please refer to BOK Financial Corporation’s most recent annual and quarterly reports. BOK Financial Corporation and its affiliates undertake no obligation to update, amend, or clarify forward-looking statements, whether as a result of new information, future events, or otherwise. Non-GAAP Financial Measures: This presentation may refer to non-GAAP financial measures. Additional information on these financial measures is available in BOK Financial’s 10-Q and 10-K filings with the Securities and Exchange Commission which can be accessed at www.BOKF.com. All data is presented as of September 30, 2020 unless otherwise noted. 2

Steven G. Bradshaw Chief Executive Officer 3

Third Quarter Summary Net Income Q3 Q2 Q3 $154.0 ($mil, exc. EPS) 2020 2020 2019 $142.2 Net Income $154.0 $64.7 $142.2 $110.4 Diluted EPS $2.19 $0.92 $2.00 $2.19 $2.00 Net income before taxes $204.6 $80.1 $174.3 $1.56 $62.1 $64.7 $0.88 $0.92 Provision for credit losses $— $135.3 $12.0 Pre-provision net revenue* $204.6 $215.0 $185.9 3Q19 4Q19 1Q20 2Q20 3Q20 Net income attributable to shareholders *Non-GAAP measure Net income per share - diluted Noteworthy items impacting profitability: • Another strong showing from Wealth Management and Mortgage teams • No credit loss provision was needed this quarter • Net interest margin was stable due primarily to an accretion acceleration, with additional support from highly disciplined deposit pricing and an increase in the effectiveness of floors in our commercial loan book • Expense management remains excellent 4

Additional Details Quarterly Year over ($bil) Q3 2020 Growth Year Growth Period-End Loans $23.8 (1.5)% 6.8% Average Loans $24.1 —% 7.6% Period-End Deposits $35.0 3.2% 33.6% Average Deposits $34.6 6.1% 34.8% Fiduciary Assets $52.9 4.7% 7.5% Assets Under Management or in Custody $82.4 3.7% 2.0% • Average quarterly loan growth flat in current economic environment • Average deposit growth largely reflects customers retaining elevated balances in the current economic environment • Assets under management or in custody up significantly on positive market moves and sales and asset retention efforts 5

Stacy Kymes EVP-Corporate Banking 6

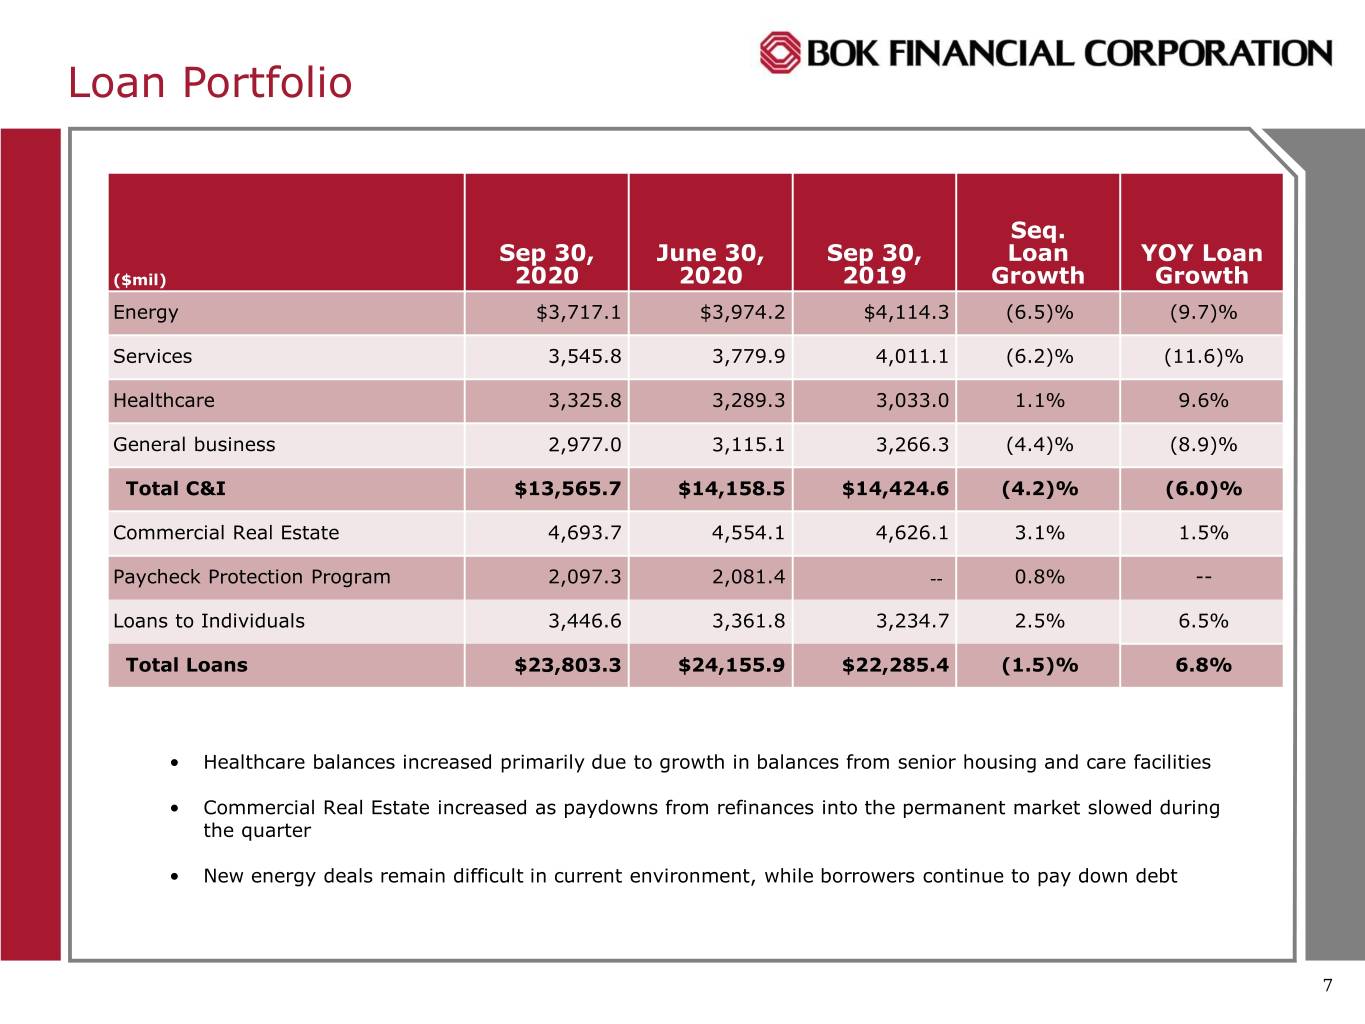
Loan Portfolio Seq. Sep 30, June 30, Sep 30, Loan YOY Loan ($mil) 2020 2020 2019 Growth Growth Energy $3,717.1 $3,974.2 $4,114.3 (6.5)% (9.7)% Services 3,545.8 3,779.9 4,011.1 (6.2)% (11.6)% Healthcare 3,325.8 3,289.3 3,033.0 1.1% 9.6% General business 2,977.0 3,115.1 3,266.3 (4.4)% (8.9)% Total C&I $13,565.7 $14,158.5 $14,424.6 (4.2)% (6.0)% Commercial Real Estate 4,693.7 4,554.1 4,626.1 3.1% 1.5% Paycheck Protection Program 2,097.3 2,081.4 -- 0.8% -- Loans to Individuals 3,446.6 3,361.8 3,234.7 2.5% 6.5% Total Loans $23,803.3 $24,155.9 $22,285.4 (1.5)% 6.8% • Healthcare balances increased primarily due to growth in balances from senior housing and care facilities • Commercial Real Estate increased as paydowns from refinances into the permanent market slowed during the quarter • New energy deals remain difficult in current environment, while borrowers continue to pay down debt 7

COVID-19 Loan Deferrals In Deferral Exited Deferral % of % of # of loans Amount ($mil) segment # of loans Amount ($mil) segment Business Market* 62 $229.4 1.2% 392 $1,312.7 6.6% Individual Market** 294 $34.5 2.1% 378 $36.6 2.2% Total 356 $263.9 1.2% 770 $1,349.3 6.3% * Includes C&I, Energy, Healthcare, CRE and Private Wealth ** Includes Consumer and Mortgage COVID-19 Impacted Areas • Deferred loans declined more than Total Percent of 80% from peak ($mil) Outstanding Portfolio Entertainment and Recreation $574.2 2.41% • Gaming Industries 375.7 1.58% • Identified businesses most • All other Entertainment and Recreation 198.5 0.83% impacted by COVID-19 related Retail 596.3 2.51% mitigation efforts less than 7% of • Convenience Stores & Gas Stations 96.6 0.41% the total BOKF portfolio • Restaurants 278.2 1.17% • Specialty Stores 35.2 0.15% • Close monitoring in place for these 186.4 0.78% • All Other Retail areas Hotels 67.0 0.28% Churches and Religious Organizations 135.2 0.57% Colleges and Universtities 178.0 0.75% Airlines 27.2 0.11% Total COVID-19 Impact Areas $1,577.9 6.63% 8

Key Credit Quality Metrics Non-accruals (mil) Net charge-offs (annualized) to average loans $255.4 0.60% $221.2 $181.0 $172.5 $163.2 0.40% 0.37% 0.31% 0.22% 0.23% 0.19% 0.20% 0.00% 3Q19 4Q19 1Q20 2Q20 3Q20 3Q19 4Q19 1Q20 2Q20 3Q20 Energy Healthcare CRE Residential and Other • Net charge-offs increased slightly to 37 basis points, in-line with historical averages (41 basis points excluding PPP loans) • Total non-accrual loans down $34.2 million • Last five quarter average net charge-offs at • A decrease of $36.2 million in Energy non- 27 basis points continues to be well below accruals historic range of 30 to 40 basis points • Potential problem loans (substandard, • Appropriately reserved with an ALLL of accruing) totaled $623 million at 09/30, 1.76% and combined allowance of 1.88% compared to $626 million at 06/30. including unfunded commitments • Excluding PPP loans, ALLL was 1.93% and combined allowance of 2.06% including unfunded commitments 9

Steven Nell Chief Financial Officer 10

Net Interest Revenue and Margin ($mil) Q3 2020 Q2 2020 Q1 2020 Q4 2019 Q3 2019 Net interest revenue $271.8 $278.1 $261.4 $270.2 $279.1 Net interest margin 2.81% 2.83% 2.80% 2.88% 3.01% Yield on loans 3.60% 3.63% 4.50% 4.75% 5.12% Cost of int-bearing deposits 0.26% 0.34% 0.98% 1.09% 1.17% Cost of wholesale borrowings 0.51% 0.44% 1.57% 1.92% 2.39% • Net interest income decreased $6.3 million from the previous quarter • Net interest margin down only two basis points from previous quarter. Supporting factors include: ◦ An increase in CoBiz discount accretion, which supported the margin by approximately 11bp this quarter. Could normalize in Q4. ◦ Interest-bearing deposit costs down 8 basis points for the quarter ◦ Loan floors in our commercial book more effective as average LIBOR declined 19 basis points • A bit more room to lower the cost of interest-bearing deposits. LIBOR has largely normalized, reducing near-term pressure on loan yields 11

Fees and Commissions Revenue ($mil) Growth: Quarterly, Quarterly, Trailing 12 Q3 2020 Sequential Year over Year Months Brokerage and Trading $69.5 12.1% 58.6% 12.8% Transaction Card 23.5 2.3% 6.6% 1.6% Fiduciary and Asset Management 39.9 (3.2)% (8.5)% (2.1)% Deposit Service Charges and Fees 24.3 10.2% (15.8)% (4.4)% Mortgage Banking 52.0 (3.7)% 72.2% 14.8% Other Revenue 13.7 19.3% (22.3)% (6.9)% Total Fees and Commissions $222.9 4.3% 19.7% 4.8% • Brokerage and Trading continued outperformance due to market volatility and continued strength in the mortgage sector • Fiduciary and Asset Management down largely due to a decrease from seasonal tax preparation fees collected in the second quarter • Mortgage Banking lower rate environment spurred continued strong refinance and purchase volumes following a record quarter • Other Revenue up largely due to comparability with last quarter’s waived overdraft protection fees and fees for excessive withdrawals, along with other fees for our clients in light of the pandemic 12

Expenses %Incr. %Incr. ($mil) Q3 2020 Q2 2020 Q3 2019 Seq. YOY Personnel expense $179.9 $176.2 $162.6 2.1% 10.6% Other operating expense $121.4 $119.2 $116.7 1.9% 4.0% Total operating expense $301.3 $295.4 $279.3 2.0% 7.9% Efficiency Ratio 60.41% 59.57% 59.31% • Personnel expense up only $3.6 million, even with large increases in incentive- based compensation • Non-personnel expense up primarily due to net losses on repossessed assets • Nearly 3% of personnel base company-wide absorbed since March due simply to attrition and increased efficiency • Adds to staff and replacement positions scrutinized at executive level 13

Liquidity & Capital Q3 2020 Q2 2020 Q3 2019 Loan to Deposit Ratio 68.1% 71.3% 85.2% Period End Deposits $35.0 billion $33.9 billion $26.2 billion Available secured wholesale borrowing capacity $12.5 billion $14.6 billion $10.1 billion Common Equity Tier 1 12.1% 11.4% 11.1% Total Capital Ratio 14.1% 13.4% 12.6% Tangible Common Equity Ratio 9.0% 8.8% 8.7% • Deposit growth continues to be strong • Over $12 billion of secured borrowing capacity and over $5 billion of unsecured and contingent liquidity capacity • CET1 and Total Capital are 510bp and 360bp above well-capitalized, respectively 14

Forecast and Assumptions • Loan growth to remain soft, though we’ll be looking for opportunities to grow loans once again in 2021 • Available-for-sale security portfolio yield expected to decrease as prepayments force reinvestment at lower rates • Incremental deposit cost lowering possible, though nearing a bottom. LIBOR has largely normalized, reducing near-term pressure on loan yields • The combination of pressure on asset yields and less room to lower deposit costs will put some pressure on net interest margin • Fee revenues to continue to show strength, and projected to continue at elevated levels in the near to intermediate term, with perhaps some normal seasonal slowdown in mortgage • Operating expenses should remain at relatively same levels as has been seen the past few quarters • Significant loan loss reserve building remains behind us • Quarterly cash dividend will remain in place • Opportunistic share repurchase activity likely to resume in the fourth quarter 15

Steven G. Bradshaw Chief Executive Officer 16

Question and Answer Session 17
