Attached files
| file | filename |
|---|---|
| EX-99.1 - EX-99.1 - National Bank Holdings Corp | nbhc-20201020xex99d1.htm |
| 8-K - 8-K - National Bank Holdings Corp | nbhc-20201020x8k.htm |
Exhibit 99.2
| THIRD QUARTER 2020 NATIONAL BANK HOLDINGS CORPORATION SUPPLEMENTAL DISCLOSURE OCTOBER 20, 2020 EXHIBIT 99.2 |
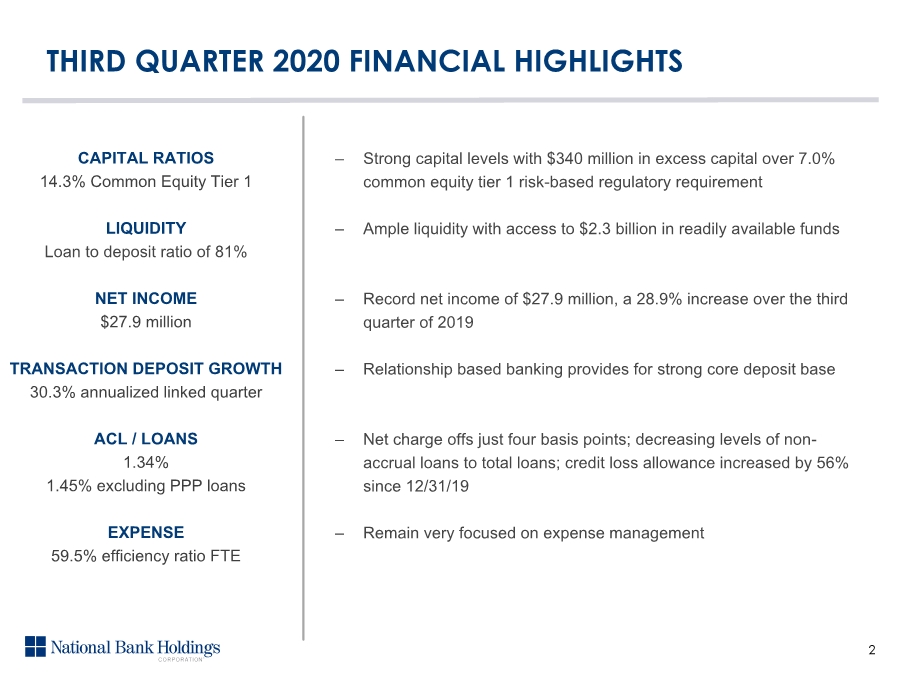
| THIRD QUARTER 2020 FINANCIAL HIGHLIGHTS CAPITAL RATIOS 14.3% Common Equity Tier 1 LIQUIDITY Loan to deposit ratio of 81% NET INCOME $27.9 million TRANSACTION DEPOSIT GROWTH 30.3% annualized linked quarter ACL / LOANS 1.34% 1.45% excluding PPP loans EXPENSE 59.5% efficiency ratio FTE ‒ Strong capital levels with $340 million in excess capital over 7.0% common equity tier 1 risk-based regulatory requirement ‒ Ample liquidity with access to $2.3 billion in readily available funds ‒ Record net income of $27.9 million, a 28.9% increase over the third quarter of 2019 ‒ Relationship based banking provides for strong core deposit base ‒ Net charge offs just four basis points; decreasing levels of non- accrual loans to total loans; credit loss allowance increased by 56% since 12/31/19 ‒ Remain very focused on expense management 2 |
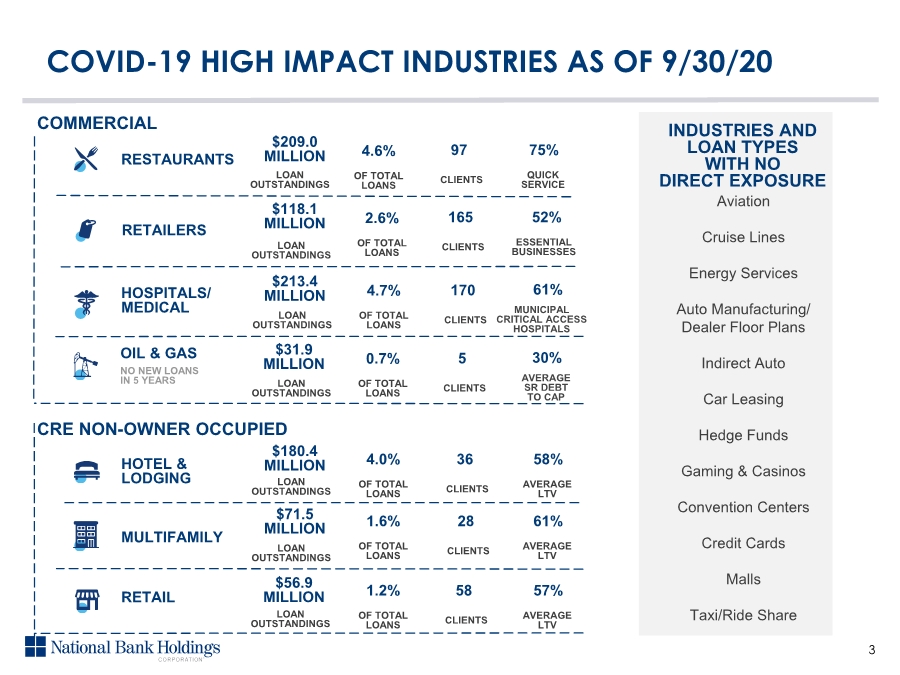
| COVID-19 HIGH IMPACT INDUSTRIES AS OF 9/30/20 RESTAURANTS OIL & GAS RETAILERS LOAN OUTSTANDINGS $209.0 MILLION $118.1 MILLION $31.9 MILLION OF TOTAL LOANS 4.6% OF TOTAL LOANS 2.6% OF TOTAL LOANS 0.7% CLIENTS 97 CLIENTS 165 QUICK SERVICE 75% ESSENTIAL BUSINESSES 52% AVERAGE SR DEBT TO CAP 30% NO NEW LOANS IN 5 YEARS COMMERCIAL MULTIFAMILY RETAIL HOTEL & LODGING INDUSTRIES AND LOAN TYPES WITH NO DIRECT EXPOSURE Aviation Cruise Lines Energy Services Auto Manufacturing/ Dealer Floor Plans Indirect Auto Car Leasing Hedge Funds Gaming & Casinos Convention Centers Credit Cards Malls Taxi/Ride Share $180.4 MILLION $71.5 MILLION $56.9 MILLION OF TOTAL LOANS 4.0% CLIENTS 36 AVERAGE LTV 58% OF TOTAL LOANS 1.6% CLIENTS 28 AVERAGE LTV 61% OF TOTAL LOANS 1.2% CLIENTS 58 AVERAGE LTV 57% CRE NON-OWNER OCCUPIED CLIENTS 5 LOAN OUTSTANDINGS LOAN OUTSTANDINGS LOAN OUTSTANDINGS LOAN OUTSTANDINGS LOAN OUTSTANDINGS 3 HOSPITALS/ MEDICAL $213.4 MILLION OF TOTAL LOANS 4.7% MUNICIPAL CRITICAL ACCESS HOSPITALS 61% CLIENTS 170 LOAN OUTSTANDINGS |
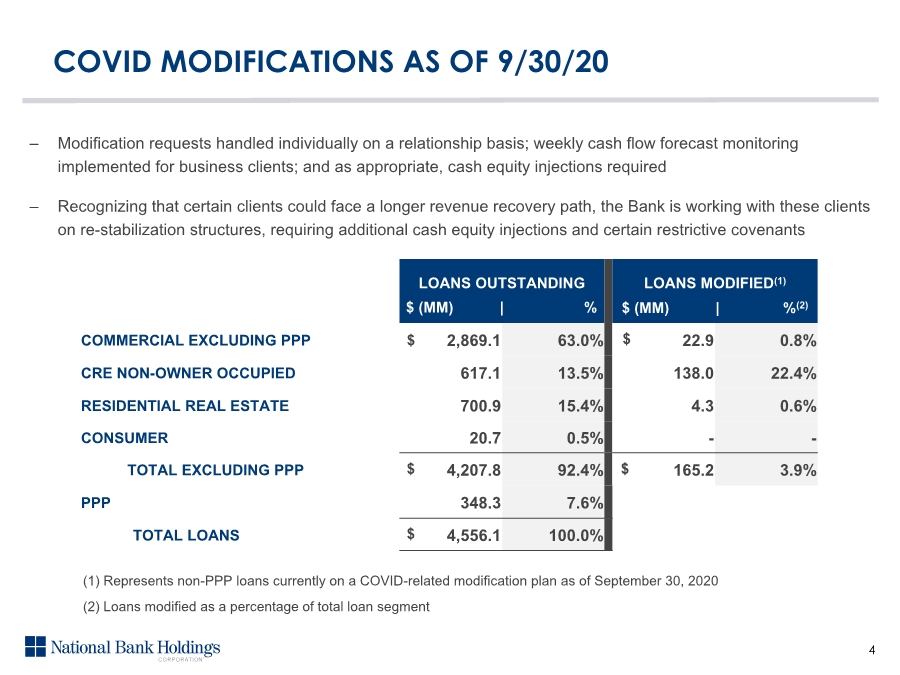
| LOANS OUTSTANDING LOANS MODIFIED(1) COMMERCIAL EXCLUDING PPP 2,869.1 63.0% 22.9 0.8% CRE NON-OWNER OCCUPIED 617.1 13.5% 138.0 22.4% RESIDENTIAL REAL ESTATE 700.9 15.4% 4.3 0.6% CONSUMER 20.7 0.5% -- TOTAL EXCLUDING PPP 4,207.8 92.4% 165.2 3.9% PPP 348.3 7.6% TOTAL LOANS 4,556.1 100.0% $ $ ‒ Modification requests handled individually on a relationship basis; weekly cash flow forecast monitoring implemented for business clients; and as appropriate, cash equity injections required ‒ Recognizing that certain clients could face a longer revenue recovery path, the Bank is working with these clients on re-stabilization structures, requiring additional cash equity injections and certain restrictive covenants COVID MODIFICATIONS AS OF 9/30/20 $ $ $ (MM) | % $ (MM) | %(2) 4 (2) Loans modified as a percentage of total loan segment (1) Represents non-PPP loans currently on a COVID-related modification plan as of September 30, 2020 $ |