Attached files

file filename
EX-99.1 - EX-99.1 - INTERNATIONAL BUSINESS MACHINES CORPibm-20201019xex99d1.htm
8-K - 8-K - INTERNATIONAL BUSINESS MACHINES CORPibm-20201019x8k.htm

Exhibit 99.2

Ex99.2_ibm_ex99_2_page_1.gif

IBM 3Q 2020 Earnings Non-GAAP Supplemental Material October 19, 2020 ibm.com/investor


Ex99.2_ibm_ex99_2_page_2.gif

Non-GAAP Supplemental Materials Reconciliation of Revenue Performance - 3Q 2020 3Q20 Yr/Yr3Q20 Yr/Yr GAAP @CC GAAP @CC Cloud & Cognitive Software 7% 6% Global Technology Services (4%) (4%) Cloud & Data Platforms 20% 19% Infrastructure & Cloud Services (3%) (4%) Cognitive Applications 1% Flat Technology Support Services (6%) (6%) Transaction Processing Platforms (8%) (9%) Cloud 9% 8% Cloud 64% 63% Systems(15%) (16%) Global Business Services (5%) (6%) Systems Hardware (18%) (19%) Consulting (2%) (4%) IBM Z(19%) (20%) Application Management (7%) (8%) Power(15%) (16%) Global Process Services (3%) (3%) Storage(19%) (20%) Cloud 10% 9% Operating Systems Software (7%) (8%) Cloud(4%) (4%) The above reconciles the Non-GAAP financial information contained in the “Cloud & Cognitive Software”, “Global Business Services”, “Global Technology Services”, “Systems”, “Services Segments Details”, “Software & Systems Segment Details”, and “Prepared Remarks” discussions in the company’s earnings presentation. See Exhibit 99.2 included in the company’s Form 8-K dated October 19, 2020 for additional information on the use of these Non-GAAP financial measures. Supplemental Materials 2


IBm ex2_ibm_ex99_2 (v2)_page_3.gif

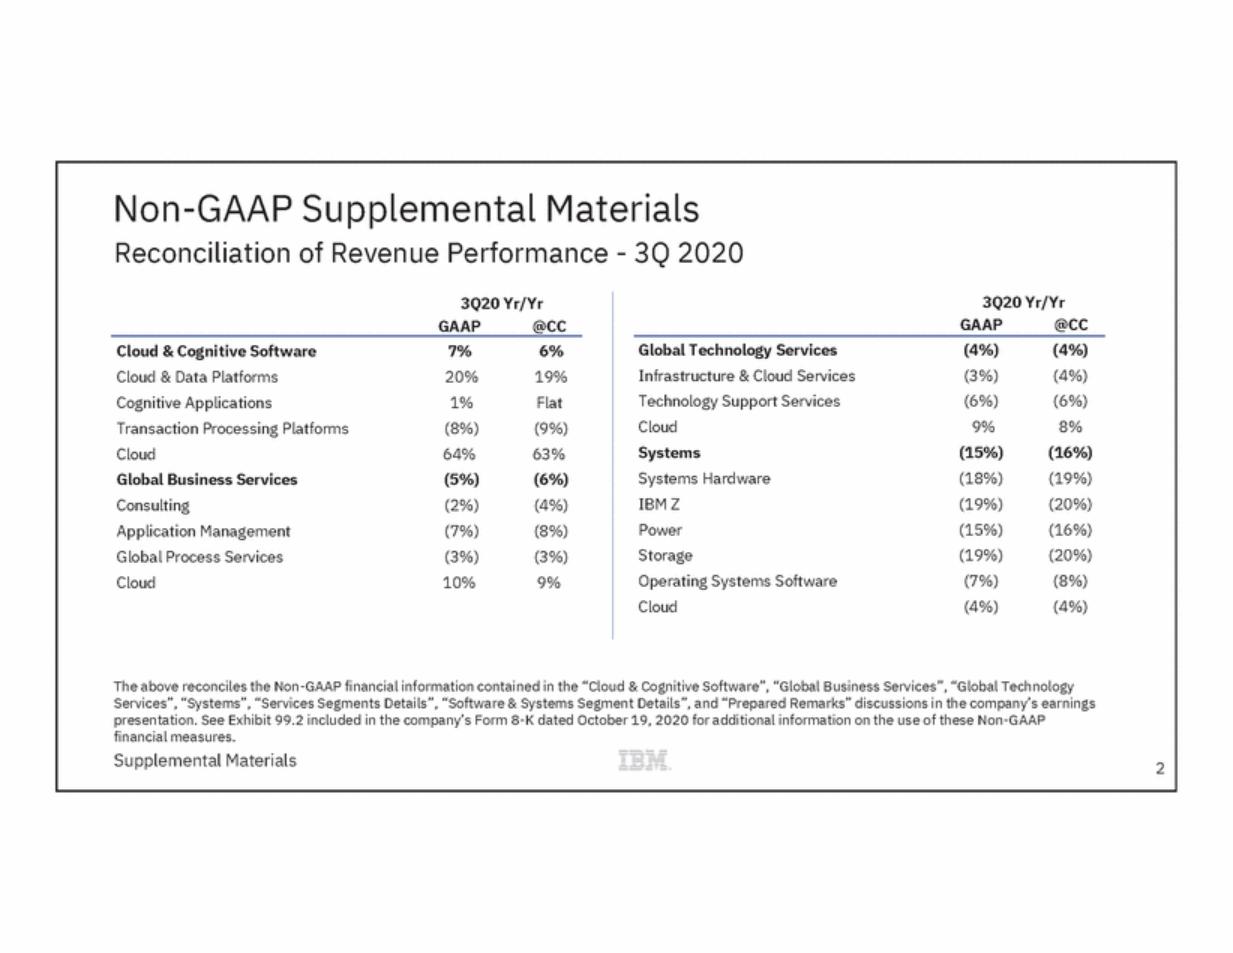
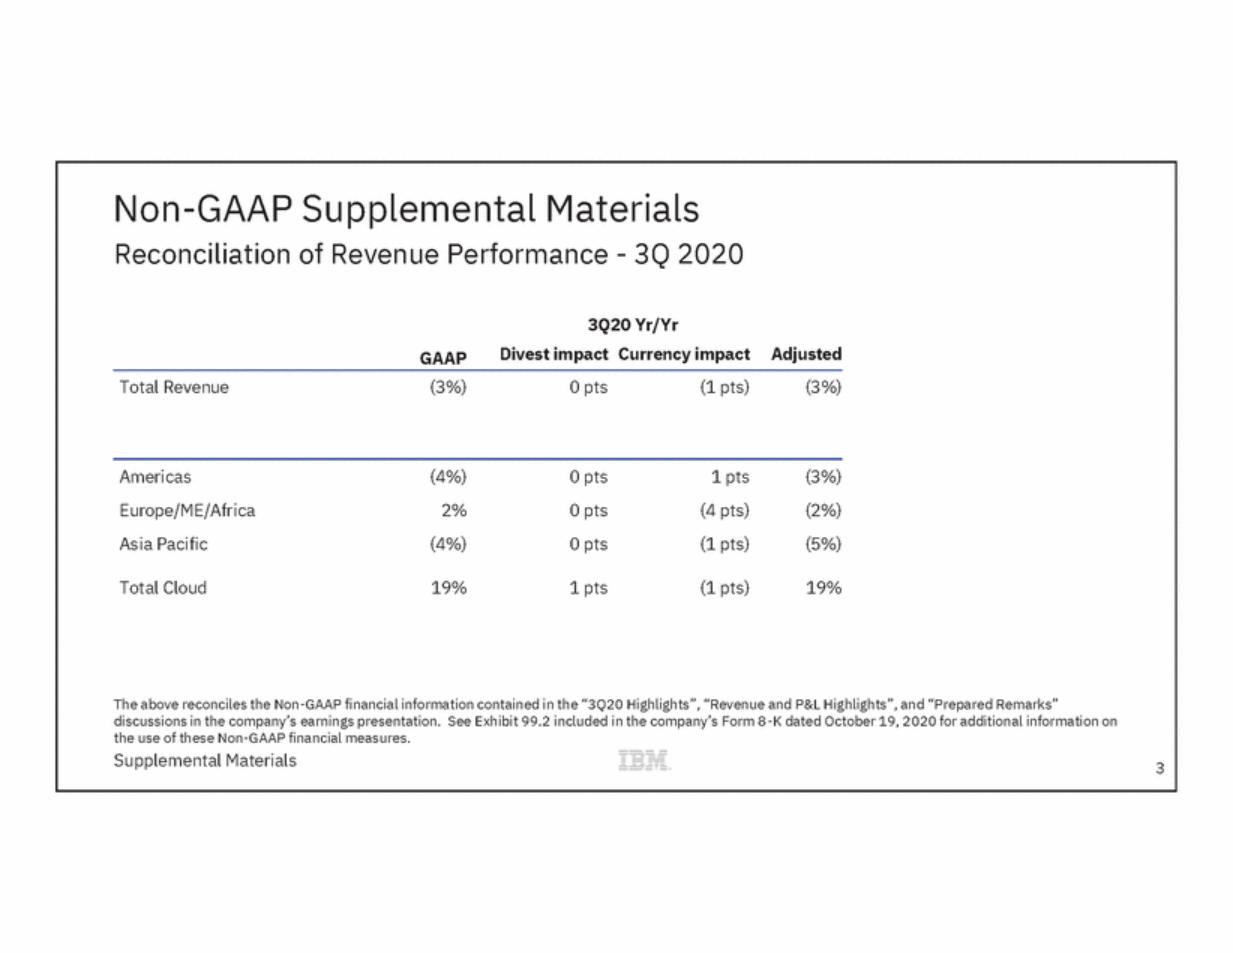
Non-GAAP Supplemental Materials Reconciliation of Revenue Performance - 3Q 2020 3Q20 Yr/Yr GAAPDivest impact Currency impact Adjusted Total Revenue(3%) 0 pts (1 pts) (3%) Americas (4%) 0 pts 1 pts (3%) Europe/ME/Africa 2% 0 pts (4 pts) (2%) Asia Pacific (4%) 0 pts (1 pts) (5%) Total Cloud19% 1 pts (1 pts) 19% The above reconciles the Non-GAAP financial information contained in the “3Q20 Highlights”, “Revenue and P&L Highlights”, and “Prepared Remarks” discussions in the company’s earnings presentation. See Exhibit 99.2 included in the company’s Form 8-K dated October 19, 2020 for additional information on the use of these Non-GAAP financial measures. Supplemental Materials 3


Ex99.2_ibm_ex99_2_page_4.gif

Non-GAAP Supplemental Materials Reconciliation of Revenue for Red Hat, Normalized - 3Q 2020 Three Months Ended September 30, 2020 Red Hat Revenue, Normalized for Historical ComparabilityYr/Yr Red Hat Revenue GAAP Growth Rate 163% Impact from Red Hat revenue prior to acquisition (26 pts) Impact from purchase accounting deferred revenue and intercompany adjustments (120 pts) Red Hat revenue growth rate, normalized for historical comparability (non-GAAP)17% Impact from currency (1 pt) Red Hat revenue growth rate, normalized for historical comparability and adjusting for currency (non-GAAP)16% The above reconciles the Non-GAAP financial information contained in the “3Q20 Highlights” and “Prepared Remarks” discussions in the company’s earnings presentation. See Exhibit 99.2 included in the company’s Form 8-K dated October 19, 2020 for additional information on the use of these Non-GAAP financial measures. Supplemental Materials 4


Ex99.2_ibm_ex99_2_page_5.gif

Non-GAAP Supplemental Materials Reconciliation of Expense Summary - 3Q 2020 3Q20 Non-GAAPOperating GAAPAdjustments(Non-GAAP) SG&A Currency 0 pts 0 pts 0 pts Acquisitions/Divestitures 2 pts 0 pts 2 pts Base* 6 pts (3 pts) 3 pts RD&E Currency 0 pts 0 pts 0 pts Acquisitions/Divestitures 1 pts 0 pts 1 pts Base* 2 pts (4 pts) (2 pts) Operating Expense & Other Income Currency(1 pts) 0 pts (1 pts) Acquisitions/Divestitures1 pts 0 pts 1 pts Base*3 pts (1 pts) 2 pts The above reconciles the Non-GAAP financial information contained in the “Expense Summary” discussion in the company’s earnings presentation. See Exhibit 99.2 included in the company’s Form 8-K dated October 19, 2020 for additional information on the use of these Non-GAAP financial measures. *Represents the percentage change after excluding the impact of currency, acquisitions and divestitures. Supplemental Materials 5


Ex99.2_ibm_ex99_2_page_6.gif

Non-GAAP Supplemental Materials Reconciliation of Free Cash Flow - Last 12 Months 12 Months Ended Sep 2020 Net Cash from Operating Activities per GAAP:$15.8 Less: change in Global Financing (GF) Receivables$2.1 Net Cash from Operating Activities (Excluding GF Receivables)$13.7 Capital Expenditures, Net ($2.9) Free Cash Flow (Excluding GF Receivables)$10.8 $ in billions The above reconciles the Non-GAAP financial information contained in the “3Q20 Highlights” and “Prepared Remarks” discussions in the company’s earnings presentation. See Exhibit 99.2 included in the company’s Form 8-K dated October 19, 2020 for additional information on the use of these Non-GAAP financial measures. Supplemental Materials 6


Ex99.2_ibm_ex99_2_page_7.gif

ibm.com/investor