Attached files
| file | filename |
|---|---|
| EX-23.1 - EX-23.1 - Guild Holdings Co | d38084dex231.htm |
| EX-10.69 - EX-10.69 - Guild Holdings Co | d38084dex1069.htm |
Table of Contents
As filed with the Securities and Exchange Commission on October 20, 2020.
Registration No. 333-249225
UNITED STATES
SECURITIES AND EXCHANGE COMMISSION
Washington, D.C. 20549
Amendment No. 3
to
FORM S-1
REGISTRATION STATEMENT
UNDER
THE SECURITIES ACT OF 1933
Guild Holdings Company
(Exact name of registrant as specified in its charter)
| Delaware | 6162 | 85-2453154 | ||
| (State or other jurisdiction of incorporation or organization) |
(Primary Standard Industrial Classification Code Number) |
(I.R.S. Employer Identification Number) |
5887 Copley Drive
San Diego, California 92111
(858) 560-6330
(Address, including zip code, and telephone number, including area code, of registrant’s principal executive offices)
Mary Ann McGarry
Chief Executive Officer
5887 Copley Drive
San Diego, California 92111
(858) 560-6330
(Name, address, including zip code, and telephone number, including area code, of agent for service)
With copies to:
| David E. Shapiro, Esq. | William J. Cernius, Esq. | |
| Mark F. Veblen, Esq. | Lewis W. Kneib, Esq. | |
| Mark A. Stagliano, Esq. | Latham & Watkins LLP | |
| Wachtell, Lipton, Rosen & Katz | 355 South Grand Avenue, Suite 100 | |
| 51 West 52nd Street | Los Angeles, California 90071 | |
| New York, New York 10019 (212) 403-1000 |
(213) 485-1234 |
Approximate date of commencement of proposed sale to the public: As soon as practicable after the effective date of this Registration Statement.
If any of the securities being registered on this form are to be offered on a delayed or continuous basis pursuant to Rule 415 under the Securities Act of 1933, check the following box. ☐
If this form is filed to register additional securities for an offering pursuant to Rule 462(b) under the Securities Act, check the following box and list the Securities Act registration statement number of the earlier effective registration statement for the same offering. ☐
If this form is a post-effective amendment filed pursuant to Rule 462(c) under the Securities Act, check the following box and list the Securities Act registration statement number of the earlier effective registration statement for the same offering. ☐
If this form is a post-effective amendment filed pursuant to Rule 462(d) under the Securities Act, check the following box and list the Securities Act registration statement number of the earlier effective registration statement for the same offering. ☐
Indicate by check mark whether the registrant is a large accelerated filer, an accelerated filer, a non-accelerated filer, a smaller reporting company or an emerging growth company. See the definitions of “large accelerated filer,” “accelerated filer,” “smaller reporting company” and “emerging growth company” in Rule 12b-2 of the Exchange Act.
| Large accelerated filer | ☐ | Accelerated filer | ☐ | |||
| Non-accelerated filer | ☒ | Smaller reporting company | ☐ | |||
| Emerging growth company | ☒ | |||||
If an emerging growth company, indicate by check mark if the registrant has elected not to use the extended transition period for complying with any new or revised financial accounting standards provided pursuant to Section 7(a)(2)(B) of the Securities Act. ☐
CALCULATION OF REGISTRATION FEE
|
| ||||||||
| Title of Each Class of Securities to Be Registered |
Amount to be Registered(1)(2) |
Proposed Maximum Offering Price Per Share(2) |
Proposed Maximum Aggregate Offering Price(1)(2) |
Amount of Registration Fee(3) | ||||
| Class A common stock, par value $0.01 per share |
9,775,000 | $19.00 | $185,725,000.00 | $20,262.60 | ||||
|
| ||||||||
|
| ||||||||
| (1) | Estimated solely for the purpose of calculating the registration fee pursuant to Rule 457(a) under the Securities Act of 1933, as amended. |
| (2) | Includes offering price of any additional shares that the underwriters have the option to purchase, if any. See “Underwriting.” |
| (3) | Previously paid. |
The registrant hereby amends this Registration Statement on such date or dates as may be necessary to delay its effective date until the registrant shall file a further amendment which specifically states that this Registration Statement shall thereafter become effective in accordance with Section 8(a) of the Securities Act of 1933 or until the Registration Statement shall become effective on such date as the Securities and Exchange Commission, acting pursuant to said Section 8(a), may determine.
Table of Contents
The information in this preliminary prospectus is not complete and may be changed. We may not sell these securities until the registration statement filed with the Securities and Exchange Commission is effective. This preliminary prospectus is not an offer to sell nor does it seek an offer to buy these securities in any jurisdiction where the offer or sale is not permitted.
Subject to Completion, dated October 20, 2020
8,500,000 Shares

Guild Holdings Company
Class A Common Stock
This is the initial public offering of shares of Class A common stock of Guild Holdings Company. The selling stockholders identified in this prospectus are offering 8,500,000 shares of our Class A common stock. All of the shares of Class A common stock being sold in this offering are being sold by the selling stockholders. Guild will not receive any of the proceeds from the sale of the shares in this offering.
Prior to this offering, there has been no public market for our Class A common stock. We currently anticipate that the initial public offering price per share of our Class A common stock will be between $17.00 and $19.00 per share.
Following this offering, Guild Holdings Company will have two classes of authorized common stock. The Class A common stock offered hereby will have one vote per share. The Class B common stock will have 10 votes per share. McCarthy Capital Mortgage Investors, LLC (“MCMI”), an entity controlled by McCarthy Partners Management, LLC, a registered investment adviser (“McCarthy Partners” and, together with its affiliates, predecessors and the various funds it manages, including MCMI, “McCarthy Capital”), will hold 100% of our issued and outstanding Class B common stock after this offering and will control approximately 94.8% of the combined voting power of our outstanding common stock. As a result, MCMI will be able to control any action requiring the general approval of our stockholders, including the election of our Board of Directors, the adoption of amendments to our amended and restated certificate of incorporation and amended and restated bylaws and the approval of any merger or sale of substantially all of our assets.
We have applied to list our Class A common stock on the New York Stock Exchange (the “NYSE”) under the symbol “GHLD.”
We are an “emerging growth company,” as that term is used in the Jumpstart Our Business Startups Act of 2012, and, under applicable Securities and Exchange Commission (“SEC”) rules, we have elected to take advantage of certain reduced public company reporting requirements for this prospectus and future filings.
We will be a “controlled company” under the corporate governance rules for NYSE-listed companies and will be exempt from certain corporate governance requirements of such rules. See “Risk Factors—Risks Related to Our Organization and Structure,” “Management—Controlled Company” and “Principal and Selling Stockholders.”
Investing in our Class A common stock involves risks. See “Risk Factors” beginning on page 29 of this prospectus.
| Per Share | Total | |||||||
| Initial public offering price |
$ | $ | ||||||
| Underwriting discounts and commissions(1) |
$ | $ | ||||||
| Proceeds to selling stockholders, before expenses |
$ | $ | ||||||
| (1) | See “Underwriting” for additional information regarding the underwriting discount and certain expenses payable to the underwriters. |
The selling stockholders have granted the underwriters an over-allotment option for a period of 30 days to purchase up to an additional 1,275,000 shares of our Class A common stock.
At our request, the underwriters have reserved up to 425,000 shares of Class A common stock, or up to 5% of the shares of Class A common stock offered by this prospectus for sale, at the initial public offering price, to certain individuals associated with us. See “Underwriting—Reserved Share Program.”
Neither the SEC nor any state securities commission or other regulatory body has approved or disapproved of these securities or determined if this prospectus is truthful or complete. Any representation to the contrary is a criminal offense.
The underwriters expect to deliver the shares of Class A common stock on or about , 2020.
| Wells Fargo Securities | BofA Securities | J.P. Morgan | ||
| JMP Securities |
| Compass Point | C.L. King & Associates |
The date of this prospectus is , 2020
Table of Contents
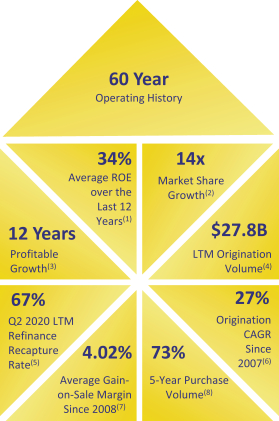
| (1) | Average annual ROE from 2008 through 2019. |
| (2) | Share of total originations from 2007 through the twelve months ended June 30, 2020, based on Guild’s origination data and data from Inside Mortgage Finance. |
| (3) | Based on Guild’s annual net income and market share from 2008-2019. |
| (4) | Guild’s origination volume for the twelve months ended June 30, 2020. |
| (5) | Guild’s recapture rate for the twelve months ended June 30, 2020. Refinance recapture rate is equal to the total UPB of Guild’s clients that refinanced their mortgage with Guild in a given period, divided by the total UPB of the clients that refinanced their mortgage. This calculation excludes clients to whom Guild did not actively market due to contractual prohibitions or other business reasons. |
| (6) | Equal to the compound annual growth rate of Guild’s annual origination volume from 2007 through the twelve months ended June 30, 2020. |
| (7) | Average gain-on-sale margin from January 1, 2008 through June 30, 2020. Represents the components of loan origination fees and gain-on-sale of loans, net divided by total in-house origination to derive basis points. |
| (8) | Percent of Guild’s total origination volume that consisted of purchase mortgages for the five years ended December 31, 2019. |
Table of Contents
| 1 | ||||
| 20 | ||||
| SUMMARY HISTORICAL CONSOLIDATED FINANCIAL AND OPERATING DATA |
23 | |||
| 29 | ||||
| 56 | ||||
| 58 | ||||
| 60 | ||||
| 61 | ||||
| 62 | ||||
| 64 | ||||
| SELECTED HISTORICAL CONSOLIDATED FINANCIAL AND OPERATING DATA |
66 | |||
| MANAGEMENT’S DISCUSSION AND ANALYSIS OF FINANCIAL CONDITION AND RESULTS OF OPERATIONS |
68 | |||
| 111 | ||||
| 139 | ||||
| 145 | ||||
| 154 | ||||
| 157 | ||||
| 160 | ||||
| 162 | ||||
| 169 | ||||
| MATERIAL U.S. FEDERAL INCOME TAX CONSIDERATIONS FOR NON-U.S. HOLDERS OF CLASS A COMMON STOCK |
172 | |||
| 175 | ||||
| 182 | ||||
| 182 | ||||
| 182 | ||||
| F-1 |
Through and including , 2020 (the 25th day after the date of this prospectus), all dealers effecting transactions in these securities, whether or not participating in this offering, may be required to deliver a prospectus. This is in addition to a dealer’s obligation to deliver a prospectus when acting as an underwriter and with respect to an unsold allotment or subscription.
We and the selling stockholders have not, and the underwriters have not, authorized anyone to provide any information, other than the information contained in this prospectus or in any free writing prospectuses we have prepared, or to make any representations to you. We, the selling stockholders and the underwriters take no responsibility for, and can provide no assurance as to the reliability of, any other information that others may give you. You must not rely on any unauthorized information or representations. This prospectus is an offer to sell only the shares of our Class A common stock offered hereby by the selling stockholders and only under circumstances and in jurisdictions where it is lawful to do so. The information contained in this prospectus is current only as of its date, regardless of the time of delivery of this prospectus or of any sale of our Class A common stock. Our business, financial condition, results of operations and prospects may have changed since that date.
For investors outside of the United States: We and the selling stockholders have not, and the underwriters have not, done anything that would permit this offering or possession or distribution of this prospectus or any free writing prospectus we may provide to you in connection with this offering in any jurisdiction where action for that purpose is required, other than in the United States. You are required to
i
Table of Contents
inform yourselves about and to observe any restrictions relating to this offering and the distribution of this prospectus and any such free writing prospectus outside of the United States.
INDUSTRY AND OTHER DATA
Certain industry data and market data included in this prospectus were obtained from independent third-party surveys, market research, publicly available information, reports of governmental agencies and industry publications and surveys. Except as otherwise specified, such data is derived from Inside Mortgage Finance Publications, Inc. Copyright © 2020 Used with permission, Mortgage Bankers Association, Ellie Mae, STRATMOR Group, CoreLogic and the U.S. Consumer Financial Protection Bureau. Information and data derived from the Mortgage Bankers Association and STRATMOR Peer Group Roundtables Program (Spring 2020), large independent mortgage lenders peer set, includes participating independent mortgage lenders with more than $5 billion of origination volume during the year ended December 31, 2019. Not all independent mortgage lenders of that size may be included in the peer set. Information and data derived from the Mortgage Bankers Association 2020 Servicing Operations Study (2019 data), mid-size independent mortgage servicers and banks peer set, includes participating independent mortgage servicers and banks with servicing portfolios of less than 700,000 loans as of December 31, 2019. Not all independent mortgage servicers and banks servicing portfolios of that size may be included in the peer set. Management’s estimates presented herein are based upon management’s review of independent third-party surveys and industry publications prepared by a number of sources and other publicly available information. All of the industry data, market data and related estimates used in this prospectus involve a number of assumptions and limitations, and you are cautioned not to give undue weight to such data and estimates. Although we have no reason to believe that the information from these surveys and industry publications included in this prospectus is not reliable, we have not independently verified this information and cannot guarantee its accuracy or completeness. In addition, we believe that industry data, market data and related estimates provide general guidance but are inherently imprecise. The industry in which we operate is subject to a high degree of uncertainty and risk due to a variety of factors, including those described in the section titled “Risk Factors.” These and other factors could cause results to differ materially from those expressed in the estimates made by independent parties and by us.
TRADEMARKS AND TRADE NAMES
Our logo and any trade names of Guild appearing in this prospectus are our property. This prospectus also contains trademarks and trade names of other companies, which are the property of their respective owners. Solely for convenience, trademarks and trade names referred to in this prospectus may appear without the ® or ™ symbols, but such references are not intended to indicate, in any way, that we will not assert, to the fullest extent under applicable law, our rights or the rights of the applicable licensor to these trademarks and trade names.
ASSUMPTIONS AND EXCLUSIONS
Except as otherwise noted, all information in this prospectus (including, but not limited to, the number of shares of our Class A common stock and shares of our Class B common stock to be outstanding after the completion of this offering) assumes:
| • | the occurrence of the “reorganization transactions” described in the section of this prospectus entitled “Organizational Structure”; |
| • | that the underwriters do not exercise their option to purchase up to 1,275,000 additional shares from the selling stockholders; |
| • | an initial public offering price of $18.00 per share (the midpoint of the estimated public offering price range set forth on the front cover of this prospectus); |
ii
Table of Contents
| • | the filing and effectiveness of our amended and restated certificate of incorporation (“certificate of incorporation”) and amended and restated bylaws (“bylaws”) upon the closing of this offering; |
| • | the exclusion of 1,200,278 shares of our Class A common stock (subject to adjustment for fractional shares) we expect to issue pursuant to restricted stock units we intend to grant in connection with this offering under our 2020 Omnibus Incentive Plan (the “2020 Plan”), which we plan to adopt in connection with this offering, based on the midpoint of the estimated price range set forth on the front cover of this prospectus; and |
| • | the exclusion of 4,299,722 additional shares of our Class A common stock (subject to adjustment for fractional shares) that will remain available for issuance pursuant to future awards under our 2020 Plan based on the midpoint of the estimated price range set forth on the front cover of this prospectus. |
FINANCIAL STATEMENTS AND BASIS OF PRESENTATION
Unless otherwise indicated or the context otherwise requires, references in this prospectus to (i) the “Issuer” refer to Guild Holdings Company, a Delaware corporation, and the issuer of the shares of our Class A common stock offered hereby and (ii) “Guild Mortgage Co.” refer to Guild Mortgage Company, a California corporation, our operating company prior to this offering and an entity that will become a wholly owned subsidiary of the Issuer in connection with the reorganization transactions described in this prospectus. The Issuer was formed as a Delaware corporation on August 11, 2020 and, prior to the consummation of the reorganization transactions and this offering, did not conduct any activities other than those incidental to our formation and this offering.
Prior to the consummation of the reorganization transactions and in reference to events which took place prior to the consummation of the reorganization transactions, unless the context requires otherwise, the words “Guild,” “we,” the “Company,” “us,” and “our” refer to Guild Mortgage Company, a California corporation, and its consolidated subsidiaries. Subsequent to the consummation of the reorganization transactions and in reference to events which are to take place subsequent to the consummation of the reorganization transactions, unless the context requires otherwise, the words “Guild,” “we,” the “Company,” “us,” and “our” refer to Guild Holdings Company, a Delaware corporation, and its consolidated subsidiaries. Prior to the consummation of the reorganization transactions, Guild was a wholly owned subsidiary of Guild Mortgage Company, LLC, a California limited liability company, which changed its name to Guild Investors, LLC, on September 22, 2020. This prospectus refers to that former parent entity, both before and after such name change, as “Guild Investors, LLC.” See “Organizational Structure” for additional information.
All financial information presented in this prospectus is derived from the consolidated financial statements of Guild Mortgage Co. included elsewhere in this prospectus. All financial information presented in this prospectus has been prepared in U.S. dollars in accordance with generally accepted accounting principles in the United States of America (“GAAP”), except for the presentation of the following non-GAAP measures: Adjusted Net Income, Adjusted EBITDA and Adjusted Return on Equity. See “Selected Historical Consolidated Financial and Operating Data—Non-GAAP Financial Measures” and “Management’s Discussion and Analysis of Financial Condition and Results of Operations—Non-GAAP Financial Measures” in this prospectus for further information regarding our use of these non-GAAP financial measures, including limitations related to such measures, and a reconciliation of such measures to the nearest comparable financial measures calculated and presented in accordance with GAAP.
iii
Table of Contents
This summary highlights information appearing elsewhere in this prospectus. This summary does not contain all of the information you should consider before investing in shares of our Class A common stock. You should read this entire prospectus carefully, including the sections titled “Risk Factors” and “Management’s Discussion and Analysis of Financial Condition and Results of Operations” and the financial statements and related notes appearing at the end of this prospectus, before making any investment decision. In this prospectus, we make certain forward-looking statements, including expectations relating to our future performance. These expectations reflect our management’s view of our prospects and are subject to the risks described under “Risk Factors” and “Cautionary Note Regarding Forward-Looking Statements.” Our expectations for our future performance may change after the date of this prospectus, and there is no guarantee that such expectations will prove to be accurate.
Company Overview
We are a growth-oriented mortgage company that employs a relationship-based loan sourcing strategy to execute on our mission of delivering the promise of home ownership in neighborhoods and communities across the United States. Our business model is centered on providing a personalized mortgage-borrowing experience that is delivered by our knowledgeable loan officers and supported by our diverse product offerings. Throughout these individualized interactions, we work to earn our clients’ trust and confidence as a financial partner that can help them find their way through life’s changes and build for the future.
We believe our business would be difficult to replicate. Guild was established in 1960, and we are among the longest-operating seller-servicers in the United States. Over the course of our operating history, we have navigated numerous economic cycles and market dislocations. We have also expanded our retail origination footprint to 31 states within the United States, and we have developed end-to-end technology systems, a reputable brand, industry expertise and many durable relationships with our clients and members of our referral network.
We have adapted to changes in market conditions by remaining dedicated to what matters most to our business: building relationships with our clients and referral partners in an effort to create “clients for life.” We have made it a priority to extend the lifecycle of our client relationships with a persistent focus on the client experience to drive our long-term performance. As a result of our client-focused strategy, during the twelve months ended June 30, 2020, we had an overall recapture rate of 61%. Recapture rate is calculated as the total unpaid principal balance (“UPB”) of our clients that originated a new mortgage with us in a given period, divided by the total UPB of our clients that paid off their existing mortgage and originated a new mortgage in the same period. This calculation excludes clients to whom we did not actively market due to contractual prohibitions or other business reasons.
Our business model benefits from the complementary relationship between our origination and servicing segments which, together, have propelled our performance through interest rate and market cycles.
1
Table of Contents
Our Business Model
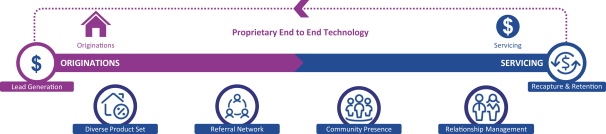
| • | Our origination strategy focuses on increasing purchase-mortgage business and providing a superior personalized mortgage-borrowing experience that encourages our clients to return to us. This strategy allows us to generate consistent origination volume—calculated as the total dollar volume of loans originated—through differing market environments, contributes to our servicing segment and facilitates business from repeat clients. |
| • | Our in-house servicing platform creates opportunities to extend our relationship with clients and generate refinance and purchase volume that replenishes run-off from our servicing portfolio. In coordination with our portfolio recapture team, our loan officers handle recapture activity for their existing client base directly, rather than outsourcing that function through a call center. This approach creates a continuous client relationship that we believe encourages repeat business. In addition, our scalable servicing platform provides a recurring stream of revenue that is complementary to our origination business. |
In 2007, seeing an opportunity to expand the Company’s sales and production strategy and grow its market share, a management-led partnership that included a majority investment from McCarthy Capital acquired the Company from its founder. Our senior leadership team continues to own a meaningful percentage of our business. As of June 30, 2020, our senior leadership team would have owned approximately 25% of the shares of our outstanding common stock on a pro forma basis after giving effect to the completion of the reorganization transactions and, upon completion of this offering, our senior leadership team will own approximately 21% of the shares of our outstanding common stock. As a result, we believe that the economic interests of senior leadership are substantially aligned with those of our stockholders.
Following the acquisition of the Company from its founder in 2007, we embarked on a growth strategy focused on prudently expanding our geographic footprint beyond the West Coast. Through steady organic growth and a series of targeted acquisitions, we grew our annual origination volume from $1.4 billion for the year ended December 31, 2007 to $27.8 billion for the twelve months ended June 30, 2020, and grew our servicing portfolio from $2.5 billion of UPB as of December 31, 2007 to $52.8 billion of UPB as of June 30, 2020. Unless otherwise indicated, the UPB of our servicing portfolio excludes any subserviced loans. Furthermore, we grew our share of the U.S. residential mortgage origination market from 7 basis points for the year ended December 31, 2007 to 94 basis points for the twelve months ended June 30, 2020, based on our origination data and market data from Inside Mortgage Finance. We expect to continue to expand our business in the geographic areas in which we already serve our clients, as well as in new markets throughout the United States.
2
Table of Contents
Guild’s Annual Origination Volume and Market Share
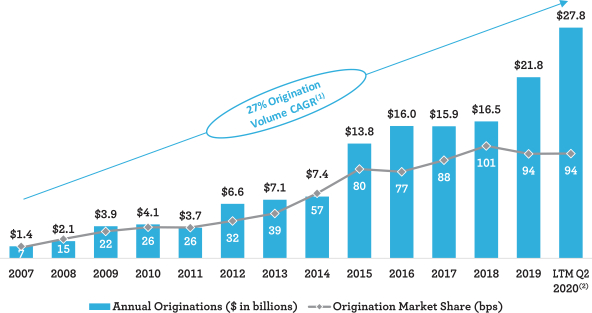
Source: Inside Mortgage Finance Publications, Inc. Copyright © 2020. Used with permission.
| (1) | CAGR is equal to the compound annual growth rate of Guild’s annual origination volume for the year ended December 31, 2007 through the twelve months ended June 30, 2020. |
| (2) | Last twelve months ended June 30, 2020. |
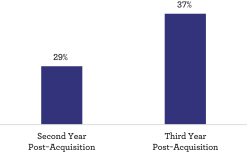
Our productivity today, and our ability to scale in the future, is made possible by our purpose-built technology platform that provides an end-to-end solution for prospecting, application gathering, underwriting, compliance, quality control, servicing and client retention. Our experienced loan officers use this technology platform and our custom-built client relationship management system, Guild 360, to find new clients, close new loans and enhance and expand existing client relationships. Guild 360 provides a comprehensive view of the client lifecycle, identifying lead generation opportunities in an effort to anticipate client needs for refinancings and new purchases. In addition to improving the productivity of our own employees, our technology has empowered the five businesses we acquired at least two years ago to increase origination volume by an average of 29% in the second year post-acquisition.
We recognize that the mortgage borrowing process is not one-size-fits-all. We understand that preferences with respect to how and when mortgage borrowers would like to interact with their lender are varied: sometimes, clients want to self-serve on the internet, while at other times, they prefer to speak in person or talk over the phone. For example, according to a 2019 survey of recent and prospective homebuyers conducted by PricewaterhouseCoopers, although digital interactions are more popular earlier on in the lending process, borrowers prefer in-person or over-the-phone interaction during later stages of the borrowing process. Our business model provides clients with both a comprehensive digital interface and an experienced team that delivers high-tech, high-touch client service, allowing clients to engage with us in whatever format and frequency provides them the most comfort and convenience.
Our business has generated a profit each year since 2008, and our net income has grown substantially over this time period. For the six months ended June 30, 2020, our total net revenue was $604.3 million, net income was $110.8 million, annualized return on equity was 48.5% and Adjusted Net Income was $238.2 million. For the same period, Adjusted EBITDA was $325.8 million and annualized Adjusted Return
3
Table of Contents
on Equity was 104.4%. For the fiscal year ended December 31, 2019, our total net revenue was $712.9 million, net income was $5.6 million, return on equity was 1.3%, Adjusted Net Income was $139.1 million, Adjusted EBITDA was $201.5 million and Adjusted Return on Equity was 32.8%. For information on how we use these non-GAAP measures and a reconciliation of them to their most comparable GAAP measures, see “Summary Historical Consolidated Financial and Other Data” and “Management’s Discussion and Analysis of Financial Condition and Results of Operations—Non-GAAP Financial Measures.”
Market Opportunity
We believe our proven growth strategy, deep referral network and personalized client service position us to capitalize on opportunities resulting from the following market conditions.
Large Addressable Market
Mortgage loans are the largest class of consumer debt in the United States. According to the New York Federal Reserve, there was approximately $10.2 trillion of residential mortgage debt outstanding as of June 30, 2020.
From 2007 through the year ended December 31, 2019, annual first-lien residential mortgage originations in the United States have averaged approximately $1.8 trillion and, over that period, conventional conforming or government mortgages accounted for approximately 82% of first-lien residential mortgage originations in the United States, according to Inside Mortgage Finance. Guild’s product offerings include both conventional conforming and government-eligible loans, and such loans have constituted over 90% of our cumulative origination volume from 2007 through June 30, 2020.
Demographic Trends and Borrower Preferences Support our Focus on Mortgage Purchase Volume and First-Time Homebuyers
From 2007 through the year ended December 31, 2019, annual purchase-mortgage volume in the United States averaged $0.8 trillion and on average accounted for approximately 47% of annual first-lien residential mortgage volume, according to Inside Mortgage Finance. From 2007 through the year ended December 31, 2018, first-time homebuyers accounted for approximately 46% of annual mortgage purchase volume, according to a March 2020 study published by the Consumer Financial Protection Bureau (the “CFPB”).
Over the next decade, according to Inside Mortgage Finance, approximately 45 million people will turn 34, the median age of a first-time homebuyer, potentially generating increased demand for mortgage purchase loans. Our focus on purchase-mortgage business and personalized client service could position us to capitalize on this market opportunity because younger generations of first-time and repeat homebuyers often choose to communicate with their lenders in-person. According to a 2019 Ellie Mae study, 79% of Millennial and 78% of Generation X consumers reported meeting with their lender in person often or sometimes.
4
Table of Contents
Frequency of In-Person Communication With Lender
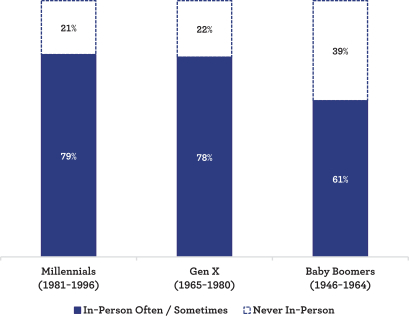
Source: Ellie Mae.
The Mortgage Industry is Highly Fragmented
According to Inside Mortgage Finance, since 2010, non-bank lenders have increased their share of annual first-lien residential mortgage originations from approximately 16% to more than 50%, and the aggregate share of loans originated by the top 10 originators fell from 73% to 42%, as the largest national banks reduced their presence in the mortgage sector. Further, the top five companies in the retail mortgage market comprised only 17.3% of total originations in 2019, according to Inside Mortgage Finance. This market fragmentation creates significant opportunity for us to continue to grow.
We believe that our employees’ local presence in the communities that we serve and our long-standing referral networks position us to succeed in a large, fragmented market. We believe that many borrowers, and first-time homebuyers in particular, rely on recommendations from real estate professionals, homebuilders, current and past homeowners, financial planners and other members within their communities to identify their mortgage lender. Our local presence positions us to capture origination volume generated by such referral networks and to provide expertise and advice to borrowers that is specific to the communities in which they are looking to purchase homes.
Considerable Barriers to Entry
The residential mortgage industry is characterized by high barriers to entry. Mortgage lenders must obtain approval from Freddie Mac, Fannie Mae and Ginnie Mae and maintain various state licenses in order to originate, sell and service conventional conforming and federal and GSE-backed loans. In addition, sophisticated technology, origination and servicing processes and regulatory expertise are required to build and manage a successful mortgage business.
Over the course of our long operating history, we have developed strong relationships with Freddie Mac, Fannie Mae and Ginnie Mae, as well as state regulatory authorities. We have also invested heavily in
5
Table of Contents
our technology and in developing our infrastructure and internal processes. Furthermore, our management team has an average of 24 years of experience managing through various market and regulatory environments. We believe these long-standing relationships, and the time and resources we have dedicated to developing our brand and infrastructure, provide a competitive advantage and position our business for continued success.
Our Strengths
Differentiated Access to Purchase Loans Enables Durable Origination Volume and Attractive Margins
Our strategy has generated significant origination volume, including a high percentage of purchase money volume. Over the five years ended December 31, 2019, we have originated more than $84.1 billion of total volume, including $61.4 billion of purchase volume. Our purchase volume represents 73% of our total origination volume over that period, compared to 58% of total origination volume in the United States, according to Inside Mortgage Finance. Further, Guild achieved a higher purchase mix than the industry average each year since 2007. We believe our focus on purchase loans makes our business more stable by making it less sensitive to interest rate changes and less dependent on refinance activity, which enhances our ability to generate more consistent returns through market cycles.
Purchase Origination Volume As a Percentage of Total Originations
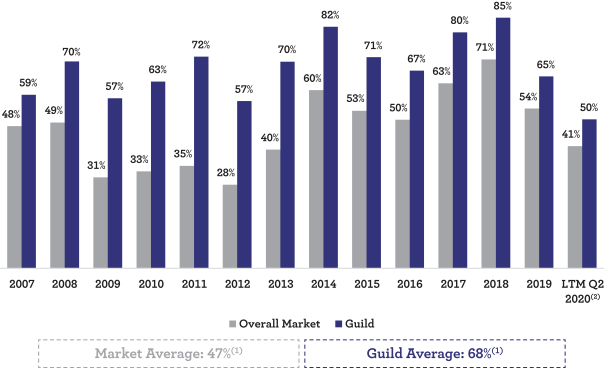
Source: Inside Mortgage Finance Publications, Inc. Copyright © 2020. Used with permission.
| (1) | Average based on periods shown in the chart above. |
| (2) | Last twelve months ended June 30, 2020. |
We source a majority of our loans through an established referral network of realtors, builders and other partners (our “referral partners”) with whom we have developed longstanding relationships over years of positive interactions. This network provides us with direct and frequent leads for loans to homebuyers who are seeking a personalized experience and access to our diverse product offerings, including affordable lending solutions designed to serve the first-time homebuyer market. Our loan officers educate our clients
6
Table of Contents
on the unique aspects of the products that we offer and help them to identify the product that will best suit their needs. This tailored and interactive approach to the lending process helped us achieve Money Magazine’s Best Mortgage Company for First Time Home Buyers award in 2020. Further, we believe our focus on service over price, and the value we provide to our clients, has enabled us to generate attractive gain-on-sale margins.
Guild’s Historical Gain-on-Sale Margins(1)
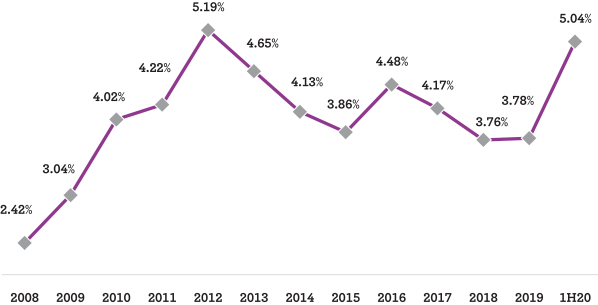
| (1) | Represents the components of loan origination fees and gain on sale of loans, net described under “Management’s Discussion and Analysis of Financial Condition and Results of Operations—Our Components of Revenue” divided by total in-house origination to derive basis points. |
Proven Track Record of Navigating through Market Cycles and Executing on Growth Strategies
We have demonstrated our ability to adapt and successfully operate through various market conditions and interest rate environments. Since 1960, we have operated through eight recessions and a wide range of housing market conditions, consistently evolving our risk management framework and operating culture in order to continue serving our clients. We have been profitable each year since 2008, and we believe our track record is largely due to our expertise in the mortgage market, nimble operating style and balanced business model.
Following the acquisition of the Company from its founder in 2007, we shifted our focus to actively growing our origination franchise and scaling our servicing portfolio. In the 12 years since then, we have grown annual origination volume by 19 times and our servicing portfolio dollar volume by 21 times, using a combination of organic and inorganic growth strategies. Through productivity gains from our evolving technology platform, recruiting new loan officers and executing on our targeted acquisition strategy, we have grown in our existing markets and also expanded into new geographies. The success of our acquisition strategy has also supported our profitability.
Our Strategy is Tailored to Address Homebuyer Needs and Promote Deep Referral Network Relationships
We believe that borrowers often prefer to work with people and companies that are present in their neighborhoods and are able to deliver customized solutions to fit their specific needs. Understanding these
7
Table of Contents
unique needs is the reason we feel it is vital to be in the communities we serve, living and working with our clients and members of our referral networks.
We provide an individualized lending approach, a broad product set and the operational and regulatory expertise required to meet our clients’ needs. Through our decentralized fulfillment model, we perform underwriting and closing services on a regional basis, which allows us to recognize and adapt to the intricacies of each region and build relationships between our fulfillment team and our local loan officers. Our origination processes are designed to deliver reliable service and on-time closings.
We believe that our referral networks and local community presence position us to succeed in a highly fragmented market. Our local presence positions us to capture loan volume generated by these referral networks and provide tailored advice that acknowledges the fact that purchasing a home is an emotional life decision and borrowers have varied preferences with respect to the mortgage lending process. We provide our clients with the opportunity to engage with us in whatever manner they may prefer—whether that may be in person, online or over the phone. Our technology platform furthers our ability to deliver reliable service and on-time closings by creating milestones and swim lanes to provide clear accountability with respect to meeting closing deadlines.
Internally-Developed Technology Platform Underpins Loan Officer Productivity and Fosters Repeat Business
We leverage our robust technology platform and coaching program to increase our loan officers’ productivity and overall recapture rates.
Our technology platform provides loan officers with end-to-end support from client acquisition to loan closing and client retention. Our loan officers benefit from our custom-built technology platform and our data repository, which has been developed over the course of our long operating history. We continue to build our data repository through our ongoing origination activity, and we have added data from more than 525,000 transactions since January 1, 2010. By utilizing this data to further develop our platform and to curate suggested customer touchpoints, we foster a balanced combination of personalized and digital strategies for lead nurturing, as well as client education and communication, that we believe gives our loan officers a competitive edge.
In addition, our technology platform adds substantial value to loan officers that cannot be replicated or transferred to our peers. This helps us to generate strong loan officer loyalty and benefit from high retention rates among our top performing loan officers. The loan officers responsible for 71% of our production volume over the last five years are still with the Company today.
This technology-focused approach to managing client relationships, coupled with our loan officers’ strong referral networks and other relationships within their communities, has contributed to the increase in our overall recapture rate from 37% for the year ended December 31, 2017 to 61% for the twelve months ended June 30, 2020. In addition, for the year ended December 31, 2019, Guild’s portfolio recapture volume—calculated as the dollar volume of originations for existing retail clients who refinanced or received a new purchase mortgage during that period—totaled $4.9 billion, which resulted in a 26% purchase recapture rate, a 64% refinance recapture rate and a 56% overall recapture rate—outperforming the average overall recapture rate of 25% for large independent mortgage lenders participating in the Mortgage Bankers Association and STRATMOR Peer Group Roundtables Program (Spring 2020). We believe our ability to achieve purchase and refinance recapture rates in excess of market averages is a testament to our innovative platform and business model.
8
Table of Contents
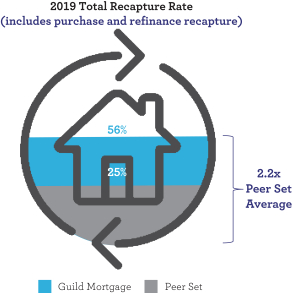
Source: Company information and Mortgage Bankers Association and STRATMOR Peer Group Roundtables Program (Spring 2020), large independent mortgage lenders peer set.
We also empower our loan officers through the Company’s coaching program, Elevate, which is designed to support loan officers at each stage of their careers and provides a roadmap to develop highly productive partnerships with referral networks. The program is taught by our highest producing loan officers and allows participants to learn effective solutions from their peers that are in the market originating mortgages on a day-to-day basis. The program also furthers our goal of creating a collaborative culture by engaging our national sales team to share best practices with their peers around the country. Participating loan officers have consistently achieved increased average productivity following participation in the program.
Strong Culture Set by Experienced Management Team
At the heart of our Company is our culture, grounded in strong values, innovation, creativity and collaboration. We believe our culture sets us apart and is the backbone of our success. It has enabled us to continuously innovate and evolve to navigate the dynamic mortgage market.
Guild is an inclusive organization and encourages open and honest dialogue across employees, clients and partners. We have a diverse leadership team that fills key roles in each of our business lines. Our leadership team has an average of 24 years of industry experience, has worked at Guild for an average of 21 years and includes top performers from the businesses that Guild has acquired. We have high employee retention, as well as a successful recruiting program, because we empower our employees, maintain a culture that supports collaboration and development and provide our employees with the tools and resources they need to be successful.
We also believe strongly in supporting the communities in which we operate. To that end, Guild and its employees give back to the neighborhoods and communities we serve through sustained investment of time and resources, including through our Guild Giving Foundation.
Further, our management team is well respected across the mortgage industry and has developed strong relationships with our financing counterparties, our referral networks and the investors to which we
9
Table of Contents
sell the majority of the loans that we originate—Fannie Mae, Freddie Mac and Ginnie Mae. Because of these relationships, we often have unique opportunities to work on, and shape, pilot programs for new products. This allows us to stay at the leading edge of product development, provide our clients with a broad solution set and further develop our relationships with stakeholders critical to the success of our business.
Our Growth Strategies
We have increased our origination volume from $1.4 billion for the year ended December 31, 2007 to $27.8 billion for the twelve months ended June 30, 2020. Our strategy has proven to be scalable as we have further penetrated many of our existing markets and expanded our presence across the United States. We believe that we are well positioned to continue capturing additional origination business through our well-recognized brand, internally-developed technology platform and differentiated position in the purchase market.
Increase Our Market Share in Existing MSAs and Continue Building Our Team of Loan Officers
We are a top-10 lender in 26 of the 50 largest metropolitan statistical areas (“MSAs”) in which we operate according to CoreLogic, and our share of total origination volume has grown by 14 times over the last 12 years through June 30, 2020, based on our origination data and data from Inside Mortgage Finance. Our hands-on approach in local communities has allowed us to continually capture increased business as we strengthen and broaden our relationships in the MSAs in which we operate. Our ability to improve the productivity of our existing loan officers through more effective use of our technology platform and our talent development programs further supports our growth efforts. For illustrative purposes, if we were able to capture an additional 1% of market share in the states where we currently operate an in-state retail location, we could add $15.8 billion to our annual origination volume, according to origination volume data for the year ended December 31, 2019 from the Mortgage Bankers Association.
We believe we can continue to generate growth by adding loan officers to our team with recruiting efforts that leverage our reputation for providing the tools, data and support that allow loan officers to develop their business. We focus on recruiting the right loan officers to the Guild team, namely those who we believe will not only add incremental origination volume but will also fit well with our culture and further our mission to be a trusted partner for our clients. By maintaining our strong culture and continually developing our loan officers using our proprietary coaching program and technology platform, we have been able to efficiently scale our business.
Expand the Geographic Footprint of our Business
Our retail operations cover 31 states, with our largest presence on the West Coast. By continuing to execute our growth strategy, we believe we can grow our geographic footprint to include all 50 states over the long term. According to the Mortgage Bankers Association, the states where we did not operate an in-state retail location as of June 30, 2020 accounted for approximately 29% of total origination volume in 2019. We believe this could create an opportunity for us to grow our origination volume through continued market expansion.
10
Table of Contents
Our Origination Footprint and MSA Market Share(1)
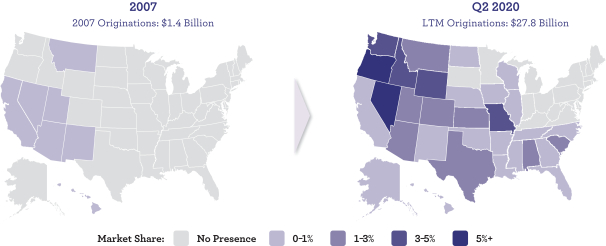
Source: CoreLogic.
| (1) | Indicates MSA market share only for states where the Company operates in-state retail locations. |
Over the last 12 years through December 31, 2019, we acquired six businesses with 391 loan officers. To identify targets that fit best with Guild, we look for independent lenders who share our values and our commitment to innovation, creativity and collaboration. We prefer to partner with lenders that have a strong foothold in their market and a clearly defined approach to sustaining that success. We have also thoughtfully structured our past acquisitions to include an earn-out component designed to minimize up-front premium paid and ensure an attractive return on investment. Following an acquisition, we fully integrate each business operationally, on-boarding the acquired business to our platform, while allowing its management team to continue executing the strategy that has been successful for them in the past. After a target business has been integrated into the Guild platform, we strive to support growth organically in the same way we do in our existing MSAs. We also strive to generate synergies and support profitability by improving execution and increasing gain-on-sale margins for the businesses that we acquire. For the four businesses that we acquired at least three years ago, originations increased by an average of 37% in the third year following those acquisitions. We believe this demonstrates the soundness of our approach to acquisitions and our ability to successfully integrate acquired businesses into the Guild organization.
Average Increase in Volume per Acquisition
Given the fragmented nature of the mortgage market, we believe we can continue to generate meaningful growth through acquisitions. There were more than 900 independent mortgage lenders in the United States as of December 31, 2019, according to a June 2020 report published by the CFPB. We
11
Table of Contents
believe this provides a large pool of potential targets for new acquisitions. Over the twelve months ended June 30, 2020, our share of mortgage originations accounted for 94 basis points of total residential mortgage originations in the United States, with our market share in the states where we have our strongest presence reaching more than 5%.
Enhance Productivity and Ancillary Fee Opportunities through Continued Investment in our Technology Platform
The mortgage industry is continually evolving, and our technology platform has been built to adapt with the market and our strategies. Our technology platform is the backbone of our regulatory efforts and the processes we use to effectively and efficiently onboard, underwrite, close and service mortgages. These functions are essential to providing outstanding client service and running our business efficiently. We continue to invest in our technology platform, and we believe our investment will continue to enhance our productivity and allow us to differentiate ourselves in the market place as it has to date, with the average number of loans closed per producer per month increasing from two during the year ended December 31, 2007 to ten in July of 2020. As of June 30, 2020, we employed 67 programmers and 92 other technology professionals who maintain and develop our systems.
Monthly Loan Closings by Job Function(1)
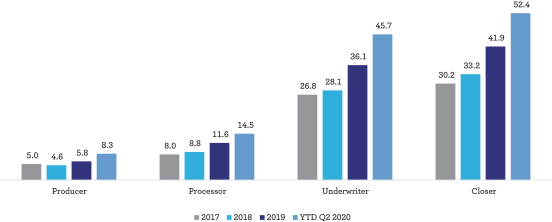
| (1) | Based on first-lien, retail funded units and average headcount over the period. |
Additionally, using our data repository and adaptable technology platform, we have an opportunity to identify and offer our client base relevant ancillary products, such as title, property and casualty, life and umbrella insurance and other products and services complementary to the mortgages that we originate. Ancillary product offerings like these could increase the value of the services that we provide to our clients, further solidifying our position as a trusted partner in their financial decisions, and also create an opportunity to earn ancillary fee income through sourcing high-quality, timely and actionable referrals to insurance companies and other potential partners.
Summary of Risk Factors
You should consider carefully the risks described under the “Risk Factors” section beginning on page 29 and elsewhere in this prospectus. These risks could materially and adversely affect our business, financial condition, operating results, cash flow and prospects, which could cause the trading
12
Table of Contents
price of our Class A common stock to decline and could result in a partial or total loss of your investment. These risks include, among others, those related to:
| • | changes in macro-economic conditions and in U.S. residential real estate market conditions, including changes in prevailing interest rates or monetary policies and the effects of the ongoing COVID-19 pandemic; |
| • | disruptions in the secondary home loan market and their effects on our ability to sell the loans that we originate; |
| • | changes in certain U.S. government-sponsored entities and government agencies, including Fannie Mae, Freddie Mac, Ginnie Mae, the Federal Housing Administration (the “FHA”), the U.S. Department of Agriculture (the “USDA”) and the U.S. Department of Veterans Affairs (the “VA”), or their current roles; |
| • | the effects of our existing and future indebtedness on our liquidity and our ability to operate our business; |
| • | failure to maintain and improve the technological infrastructure that supports our origination and servicing platform; |
| • | any cybersecurity breaches or other attacks involving our computer systems or those of our third-party service providers; |
| • | our inability to secure additional capital, if needed, to operate and grow our business; |
| • | the impact of operational risks, including employee or consumer fraud, the obligation to repurchase sold loans in the event of a documentation error, and data processing system failures and errors; |
| • | failure to comply with, or material changes to, the various laws, regulations and practices, and interpretations thereof, applicable to our business; |
| • | changes in accounting rules, tax legislation and other legislation; |
| • | risks related to our being a public company; and |
| • | risks related to our Class A common stock, our dual class common stock structure and this offering. |
Our Principal Stockholder
Following the completion of the reorganization transactions and this offering, MCMI will own 100% of our issued and outstanding Class B common stock and will control approximately 94.8% of the combined voting power of our outstanding common stock. As a result, MCMI will control any action requiring the general approval of our stockholders, including the election of our Board of Directors, the adoption of amendments to our certificate of incorporation and bylaws and the approval of any merger or sale of substantially all of our assets. Because MCMI will control more than 50% of the combined voting power of our outstanding common stock, we will be a “controlled company” under the corporate governance rules for NYSE-listed companies. Therefore we will be permitted to, and we intend to, elect not to comply with certain corporate governance requirements of the NYSE. For more information on the implications of this distinction, see “Risk Factors—Risks Related to our Class A Common Stock and this Offering,” “Management—Controlled Company,” and “Principal and Selling Stockholders.”
Two members of our Board of Directors serve as members of the investment team at McCarthy Capital: Patrick Duffy, the Chairman of our Board of Directors, serves as the President and Managing Partner of McCarthy Capital and Mike Meyer serves as the Portfolio Director of McCarthy Capital. For more information, see “Management. ”
13
Table of Contents
Corporate Information
Guild Mortgage Co. was incorporated in the State of California on August 10, 1960. The Issuer was incorporated in the State of Delaware on August 11, 2020, in connection with our reorganization under the laws of the State of Delaware. See “Organizational Structure.” Our principal executive office is located at 5887 Copley Drive, San Diego, California 92111, and our telephone number at that address is (858) 560-6330. Our website address is www.guildmortgage.com. Information contained on or accessible through our website is not incorporated by reference into this prospectus, and you should not consider that information to be part of this prospectus or in deciding whether to purchase shares of our Class A common stock.
Implications of Being an Emerging Growth Company
We qualify as an “emerging growth company” as defined in the Jumpstart Our Business Startups Act of 2012 (the “JOBS Act”). As an emerging growth company, we may take advantage of specified reduced disclosure and other requirements that are otherwise applicable generally to public companies, including:
| • | presenting only two years of audited financial statements in addition to any required unaudited interim financial statements with correspondingly reduced “Management’s Discussion and Analysis of Financial Condition and Results of Operations” disclosure in this prospectus; |
| • | not being required to comply with any requirement that may be adopted by the Public Company Accounting Oversight Board regarding mandatory audit firm rotation or a supplement to the auditor’s report providing additional information about the audit and the financial statements; |
| • | reduced disclosure about our executive compensation arrangements in our periodic reports, proxy statements and registration statements; |
| • | exemption from the requirements to hold non-binding advisory votes on executive compensation and stockholder approval of any golden parachute payments not previously approved; and |
| • | exemption from the auditor attestation requirement in the assessment of our internal control over financial reporting pursuant to Section 404 of the Sarbanes-Oxley Act of 2002, as amended (the “Sarbanes-Oxley Act”). |
We may take advantage of these exemptions until we are no longer an emerging growth company. We will remain an emerging growth company until the earliest of (i) the end of the fiscal year following the fifth anniversary of the completion of this offering, (ii) the first fiscal year after our annual gross revenues exceed $1.07 billion, (iii) the date on which we have, during the immediately preceding three-year period, issued more than $1.0 billion in non-convertible debt securities, or (iv) the end of any fiscal year in which the market value of our common stock held by non-affiliates exceeds $700.0 million as of the end of the second quarter of that fiscal year (and we have been a public company for at least 12 months and have filed one annual report on Form 10-K). We may choose to take advantage of some, but not all, of the available exemptions. We have taken advantage of certain reduced reporting obligations in this prospectus. Accordingly, the information contained herein may be different than the information you receive from other public companies in which you hold stock.
In addition, the JOBS Act provides that an emerging growth company can take advantage of an extended transition period for complying with new or revised accounting standards. This allows an emerging growth company to delay the adoption of certain accounting standards until those standards would otherwise apply to private companies. We have elected to avail ourselves of this exemption and, therefore, while we are an emerging growth company we will not be subject to new or revised accounting standards at the same time that they become applicable to other public companies that are not emerging growth companies.
14
Table of Contents
Recent Developments
COVID-19 Pandemic
Business Operations and Liquidity
We continue to closely monitor the economic impact resulting from the COVID-19 pandemic. Although we experienced record origination volume and increased profit margins in our origination segment during the six months ended June 30, 2020, the COVID-19 pandemic has had a negative impact on the financial results of our servicing segment. The federal government enacted the CARES Act, which allows borrowers with federally backed loans to request a temporary mortgage forbearance. As a result of the CARES Act forbearance requirements, we have recorded, and expect to record additional, increases in delinquencies in our servicing portfolio. As of June 30, 2020, the 60-plus day delinquency rate on our servicing portfolio was 3.5%, compared to a 60-plus day delinquency rate of 1.5% as of February 28, 2020. This increased delinquency rate on our servicing portfolio may require us to finance substantial amounts of advances of principal and interest, property taxes, insurance premiums and other expenses to protect investors’ interests in the properties securing the loans. These advances and payments, coupled with increased servicing costs and lower servicing revenue, have negatively affected and will continue to negatively affect our cash position. Additionally, we are currently prohibited from collecting certain servicing-related fees, such as late fees, and initiating foreclosure proceedings. As a result, we expect the effects of the CARES Act forbearance requirements to reduce our servicing income and increase our servicing expenses.
As of August 31, 2020, approximately 4.70% of the loans in our servicing portfolio had elected the forbearance option compared to the industry average of 7.16%, as reported by the Mortgage Bankers Association and, as of September 30, 2020, approximately 4.32% of the loans in our servicing portfolio had elected the forbearance option compared to the industry average of 6.81%, as reported by the Mortgage Bankers Association. Of the 4.70% of the loans in our servicing portfolio that had elected forbearance as of August 31, 2020, approximately 27.6% remained current on their August payments and, of the 4.32% of the loans in our servicing portfolio that had elected forbearance as of September 30, 2020, approximately 25.6% remained current on their September payments. We believe our portfolio has performed better than the industry average because of our in-house servicing capabilities and timely response to the COVID-19 pandemic and that our performance is a testament to the strength of our client relationships. Our in-house servicing team and local loan officers continue to work with our clients to understand forbearance plans and determine the best paths forward for their unique circumstances. By maintaining relationships with our clients throughout the loan lifecycle, and supporting our clients during times of uncertainty, we position ourselves to capture future business.
Servicing Portfolio Forbearance
(as of period end)
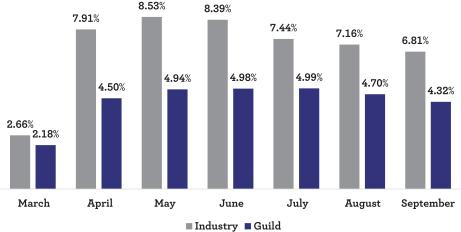
Source: Mortgage Bankers Association.
15
Table of Contents
Employee Safety
We are also continuing to focus on the wellbeing and safety of our employees. Since March, we have moved to a remote working environment for the majority of our employees and, for those that are coming into our offices, we have instituted additional health and safety precautions, such as restricting visitors, providing masks and mandating more frequent sanitizing of our offices.
Increased Liquidity
During the three months ended June 30, 2020 (the “second quarter of 2020”), to support our increased loan origination volume, we increased the capacity of our existing loan funding facilities by $165.0 million, of which $90.0 million represented a temporary increase in capacity. Subsequent to June 30, 2020, we increased the capacity of all of our existing loan funding facilities by an aggregate amount equal to $739.0 million, of which $90.0 million represented a temporary increase in capacity. We added one additional loan funding facility during the second quarter of 2020 with a total facility size of $100.0 million, for which we subsequently increased the capacity by $100.0 million during the three months ended September 30, 2020 (the “third quarter of 2020”). As of the date of this prospectus, the aggregate available amount under our loan facilities was approximately $2.9 billion.
During the second quarter of 2020, we renewed one of our MSR notes payable and increased the aggregate committed amount under that MSR note payable by $27.0 million. In the third quarter of 2020, we renewed another MSR note payable and increased the aggregate amount available under that MSR note payable by $15.0 million. In addition, in September 2020, we drew down $22.0 million under one of our MSR notes payable. See “—Liquidity, Capital Resources and Cash Flows” for further information regarding our funding facilities.
The extent to which the COVID-19 pandemic affects our business, results of operations and financial condition will ultimately depend on future developments, which are highly uncertain and cannot be predicted, including the scope and duration of the pandemic and actions taken by governmental authorities and other third parties in response to the pandemic. See “Risk Factors—The COVID-19 pandemic has had, and will likely continue to have, an adverse effect on our business, and its ultimate effect on our business and financial results will depend on future developments, which are highly uncertain and cannot be predicted, including the scope and duration of the pandemic and actions taken or to be taken by government authorities in response to the pandemic.”
Preliminary Estimated Results as of and for the Three and Nine Months Ended September 30, 2020
Our origination volume was $10.0 billion for the third quarter of 2020. For the third quarter of 2020, based on preliminary results, we expect to report net income between $178.0 million and $187.0 million and annualized return on equity between 120% and 125%. Over the same time period, we expect to report Adjusted EBITDA between $259.0 million and $273.0 million, Adjusted Net Income between $189.0 million and $200.0 million and annualized Adjusted Return on Equity between 127% and 133%. For information on how we use these non-GAAP measures and a reconciliation of them to their most comparable GAAP measures, see “Summary Historical Consolidated Financial and Other Data” and “Management’s Discussion and Analysis of Financial Condition and Results of Operations—Non-GAAP Financial Measures” in addition to the reconciliation tables provided below.
We believe the increases in net income for the third quarter of 2020 compared to the second quarter of 2020, were driven primarily by an increase in loan originations. We expect to report that net income increased from $123.3 million for the second quarter of 2020 to a preliminary range of $178.0 million to $187.0 million for the third quarter of 2020. During the third quarter of 2020, we saw favorable market conditions lead to strong demand and origination volume. We do not know how long these favorable market conditions will continue going forward. There is no assurance that these results are indicative of our results in any future period.
16
Table of Contents
The estimated results and ranges of results as of and for the three and nine months ended September 30, 2020 that are provided above and in the tables below (the “preliminary estimated results”) are preliminary and may change. We have yet to complete our normal review procedures for the three and nine months ended September 30, 2020 and, as such, our final results for this period may differ from the preliminary estimated results. Any such changes could be material. The preliminary estimated results should not be viewed as a substitute for full interim financial information prepared in accordance with GAAP. The preliminary estimated results are not necessarily indicative of the results to be achieved for the remainder of 2020 or any future period. KPMG LLP has not audited, reviewed, compiled or performed any procedures with respect to the estimated results. Accordingly, KPMG LLP does not express an opinion or any other form of assurance with respect thereto.
We have presented the following preliminary estimated results and our actual results as of and for the three months and the nine months ended September 30, 2020 and 2019, respectively:
| As of September 30, | ||||||||||||
| 2020 | 2019 | |||||||||||
| (in thousands) |
Low | High | (Actual) | |||||||||
| Cash, cash equivalents and restricted cash |
$ | 246,000 | $ | 259,000 | $ | 106,416 | ||||||
| Warehouse lines of credit |
1,864,000 | 1,960,000 | 1,557,263 | |||||||||
| Notes payable |
203,000 | 213,000 | 153,000 | |||||||||
| Total stockholder’s equity |
685,000 | 694,000 | 381,951 | |||||||||
| Three Months Ended September 30, |
Nine Months Ended September 30, |
|||||||||||||||||||||||
| 2020 | 2019 | 2020 | 2019 | |||||||||||||||||||||
| (in thousands) |
Low | High | (Actual) | Low | High | (Actual) | ||||||||||||||||||
| Total gain-on-sale margin range (bps)(1) |
548 | 576 | 379 | 514 | 541 | 381 | ||||||||||||||||||
| (1) | Represents the components of loan origination fees and gain on sale of loans, net described under “Management’s Discussion and Analysis of Financial Condition and Results of Operations—Description of Certain Components of Financial Data—Our Components of Revenue” divided by total in-house origination to derive basis points. For the third quarter of 2020, based on preliminary results, we expect to report gain-on-sale margin based on pull-through adjusted lock volume between 4.76% and 5.01%. For the third quarter of 2019, we reported gain-on-sale margin based on pull-through adjusted lock volume of 3.60%. For the nine months ended September 30, 2020, based on preliminary results, we expect to report gain-on-sale margin based on pull-through adjusted lock volume between 4.25% and 4.47%. For the nine months ended September 30, 2019, we reported gain-on-sale margin based on pull-through adjusted lock volume of 3.40%. Gain-on-sale margin based on pull-through adjusted lock volume represents the components of loan origination fees and gain on sales of loans, net described under “Management’s Discussion and Analysis of Financial Condition and Results of Operations—Description of Certain Components of Financial Data—Our Components of Revenue” divided by pull-through adjusted lock volume. |
| Three Months Ended September 30, |
Nine Months Ended September 30, |
|||||||||||||||
| 2020 | 2019 | 2020 | 2019 | |||||||||||||
| (in thousands) |
(Actual) | (Actual) | ||||||||||||||
| Loan origination volume |
$ | 10,046,462 | $ | 7,126,419 | $ | 24,605,336 | $ | 15,669,257 | ||||||||
| Total locked volume(1) |
13,127,156 | 8,358,522 | 33,805,309 | 19,630,574 | ||||||||||||
| Pull-through adjusted lock volume(2) |
11,570,275 | 7,493,415 | 29,795,999 | 17,598,810 | ||||||||||||
| (1) | Total locked volume represents the aggregate dollar value of the potential loans for which the Company has agreed to extend credit to consumers at specified rates for a specified period of time, |
17
Table of Contents
| subject to certain contingencies that are described in the interest rate lock commitments between the Company and each of those consumers. The total locked volume for a given period is representative of the interest rate lock commitments that the Company has initially entered into during that period. |
| (2) | Pull-through adjusted lock volume is equal to total locked volume multiplied by pull-through rates of 88.14%, 89.65%, 88.14% and 89.65% for the three months ended September 30, 2020 and September 30, 2019 and the nine months ended September 30, 2020 and September 30, 2019, respectively. We estimate the pull-through rate based on changes in pricing and actual borrower behavior using a historical analysis of loan closing data and “fallout” data with respect to the number of commitments that have historically remained unexercised. |
| Three Months Ended September 30, |
Nine Months Ended September 30, |
|||||||||||||||||||||||
| 2020 | 2019 | 2020 | 2019 | |||||||||||||||||||||
| (in thousands) |
Low | High | (Actual) | Low | High | (Actual) | ||||||||||||||||||
| Net income (loss) |
$ | 178,000 | $ | 187,000 | $ | 8,496 | $ | 286,000 | $ | 301,000 | $ | (38,502 | ) | |||||||||||
| Adjusted Net Income |
189,000 | 200,000 | 58,623 | 422,000 | 444,000 | 111,526 | ||||||||||||||||||
| Adjusted EBITDA |
259,000 | 273,000 | 77,125 | 578,000 | 608,000 | 157,261 | ||||||||||||||||||
| Return on equity(1) |
120 | % | 125 | % | 9 | % | 70 | % | 73 | % | (12 | )% | ||||||||||||
| Adjusted Return on Equity(2) |
127 | % | 133 | % | 62 | % | 103 | % | 107 | % | 36 | % | ||||||||||||
| (1) | For the three months ended September 30, 2020 and September 30, 2019 and the nine months ended September 30, 2020 and September 30, 2019, return on equity is shown on an annualized basis. |
| (2) | For the three months ended September 30, 2020 and September 30, 2019 and the nine months ended September 30, 2020 and September 30, 2019, Adjusted Return on Equity is shown on an annualized basis. |
The following tables reconcile net income (loss) to Adjusted Net Income and Adjusted EBITDA and the calculation of Adjusted Return on Equity to return on equity, the most directly comparable financial measures calculated and presented in accordance with GAAP.
| Reconciliation of Net Income (Loss) to Adjusted Net Income (in thousands) |
Three Months Ended September 30, |
Nine Months Ended September 30, |
||||||||||||||||||||||
| 2020 | 2019 | 2020 | 2019 | |||||||||||||||||||||
| Low | High | (Actual) | Low | High | (Actual) | |||||||||||||||||||
| Net income (loss) |
$ | 178,000 | $ | 187,000 | $ | 8,496 | $ | 286,000 | $ | 301,000 | $ | (38,502 | ) | |||||||||||
| Add adjustments: |
||||||||||||||||||||||||
| Change in fair value of MSRs due to model inputs and assumptions |
9,000 | 10,000 | 63,062 | 157,000 | 165,000 | 194,104 | ||||||||||||||||||
| Change in fair value of contingent liabilities due to acquisitions |
6,000 | 7,000 | 4,222 | 26,000 | 27,000 | 7,276 | ||||||||||||||||||
| Tax impact of adjustments |
(4,000 | ) | (4,000 | ) | (17,157 | ) | (47,000 | ) | (49,000 | ) | (51,352 | ) | ||||||||||||
|
|
|
|
|
|
|
|
|
|
|
|
|
|||||||||||||
| Adjusted Net Income |
$ | 189,000 | $ | 200,000 | $ | 58,623 | $ | 422,000 | $ | 444,000 | $ | 111,526 | ||||||||||||
|
|
|
|
|
|
|
|
|
|
|
|
|
|||||||||||||
18
Table of Contents
| Reconciliation of Net Income (Loss) to Adjusted EBITDA (in thousands) |
Three Months Ended September 30, |
Nine Months Ended September 30, |
||||||||||||||||||||||
| 2020 | 2019 | 2020 | 2019 | |||||||||||||||||||||
| Low | High | (Actual) | Low | High | (Actual) | |||||||||||||||||||
| Net income (loss) |
$ | 178,000 | $ | 187,000 | $ | 8,496 | $ | 286,000 | $ | 301,000 | $ | (38,502 | ) | |||||||||||
| Add adjustments: |
||||||||||||||||||||||||
| Interest expense on non-funding debt |
2,000 | 2,000 | 2,194 | 6,000 | 7,000 | 6,797 | ||||||||||||||||||
| Income tax provision |
62,000 | 65,000 | (2,661 | ) | 98,000 | 103,000 | (18,050 | ) | ||||||||||||||||
| Depreciation and amortization |
2,000 | 2,000 | 1,812 | 5,000 | 5,000 | 5,636 | ||||||||||||||||||
| Change in fair value of MSRs due to model inputs and assumptions |
9,000 | 10,000 | 63,062 | 157,000 | 165,000 | 194,104 | ||||||||||||||||||
| Change in fair value of contingent liabilities due to acquisitions |
6,000 | 7,000 | 4,222 | 26,000 | 27,000 | 7,276 | ||||||||||||||||||
|
|
|
|
|
|
|
|
|
|
|
|
|
|||||||||||||
| Adjusted EBITDA |
$ | 259,000 | $ | 273,000 | $ | 77,125 | $ | 578,000 | $ | 608,000 | $ | 157,261 | ||||||||||||
|
|
|
|
|
|
|
|
|
|
|
|
|
|||||||||||||
| Adjusted Return on Equity Calculation (in thousands, except where in |
Three Months Ended September 30, |
Nine Months Ended September 30, |
||||||||||||||||||||||
| 2020 | 2019 | 2020 | 2019 | |||||||||||||||||||||
| Low | High | (Actual) | Low | High | (Actual) | |||||||||||||||||||
| Numerator: Adjusted Net Income |
$ | 189,000 | $ | 200,000 | $ | 58,623 | $ | 422,000 | $ | 444,000 | $ | 111,526 | ||||||||||||
| Denominator: Average stockholder’s equity |
595,812 | 600,312 | 377,704 | 544,031 | 551,531 | 411,446 | ||||||||||||||||||
|
|
|
|
|
|
|
|
|
|
|
|
|
|||||||||||||
| Adjusted Return on Equity(1) |
127 | % | 133 | % | 62 | % | 103 | % | 107 | % | 36 | % | ||||||||||||
|
|
|
|
|
|
|
|
|
|
|
|
|
|||||||||||||
| Return on equity(2) |
120 | % | 125 | % | 9 | % | 70 | % | 73 | % | (12 | )% | ||||||||||||
| (1) | For the three months ended September 30, 2020 and September 30, 2019 and the nine months ended September 30, 2020 and September 30, 2019, Adjusted Return on Equity is shown on an annualized basis. |
| (2) | For the three months ended September 30, 2020 and September 30, 2019 and the nine months ended September 30, 2020 and September 30, 2019, return on equity is shown on an annualized basis. |
19
Table of Contents
Issuer
| Guild Holdings Company, a Delaware corporation. |
| Class A common stock offered by the selling stockholders |
8,500,000 shares (or 9,775,000 shares if the underwriters exercise in full their option to purchase an additional 1,275,000 shares of Class A common stock from the selling stockholders). |
| Class A common stock to be outstanding immediately after this offering |
21,174,758 shares (or 22,135,966 shares if the underwriters exercise in full their option to purchase an additional 1,275,000 shares of Class A common stock from the selling stockholders). |
| If, immediately after this offering, MCMI were to elect to convert all of its shares of our Class B common stock into shares of our Class A common stock, 60,000,000 shares of our Class A common stock would be outstanding. |
| Class B common stock to be outstanding immediately after this offering |
38,825,242 shares (or 37,864,034 shares if the underwriters exercise in full their option to purchase an additional 1,275,000 shares of Class A common stock from the selling stockholders). Upon the completion of this offering, all of the outstanding shares of our Class B common stock will be held by MCMI. See “Description of Capital Stock.” |
| Voting rights |
Each share of our Class A common stock entitles its holder to one vote per share and each share of our Class B common stock entitles its holder to 10 votes per share. |
| All classes of our common stock with voting rights generally vote together as a single class on all matters submitted to a vote of our stockholders. |
| Upon the completion of the reorganization transactions and this offering, the outstanding shares of our Class B common stock will be entitled to an aggregate of approximately 94.8% of the combined voting power of our outstanding common stock, and the outstanding shares of our Class A common stock will be entitled to an aggregate of approximately 5.2% of the combined voting power of our outstanding common stock. |
| Conversion rights |
Each share of our Class B common stock is convertible at any time, at the option of the holder, into one share of our Class A common stock. |
| Each share of our Class B common stock will automatically convert into one share of our Class A common stock (a) immediately prior to any sale or other transfer of such share by a holder of such share, subject to certain limited exceptions, such as transfers to permitted transferees, or (b) if MCMI, any other investment funds affiliated with McCarthy Partners, and any company or other entity controlled by, controlling or under common control with MCMI or any such investment fund (other |
20
Table of Contents
| than any portfolio company) (collectively, the “McCarthy Investors”) own shares of our Class B common stock representing less than 10% of the aggregate number of shares of our issued and outstanding common stock. See “Description of Capital Stock.” |
| Use of proceeds |
We will not receive any proceeds from the sale of shares of shares of our Class A common stock by the selling stockholders in this offering. See “Use of Proceeds.” |
| Dividend policy |
We do not anticipate declaring or paying any regular cash dividends on our capital stock in the foreseeable future. Instead, we anticipate that most or all of our future earnings will be retained to support our operations and finance the growth and development of our business. Any future determination to declare and pay cash dividends, if any, will be made at the discretion of our Board of Directors and will depend on a variety of factors. See “Dividend Policy.” |
| Controlled company |
Upon completion of this offering, MCMI will continue to beneficially own more than 50% of the combined voting power of our outstanding common stock. As a result, we will be permitted, and intend, to avail ourselves of the “controlled company” exemptions under the rules of the NYSE, including exemptions from certain of the corporate governance listing requirements. See “Management—Controlled Company.” |
| Listing |
We have applied to list our Class A common stock on the NYSE under the symbol “GHLD.” |
| Reserved Share Program |
At our request, the underwriters have reserved for sale, at the initial public offering price, up to 425,000 shares of Class A common stock, or 5% of the shares of Class A common stock offered by this prospectus, for sale to certain persons associated with us. The sales will be made at our direction through a reserved share program. If these persons purchase Class A common stock, it will reduce the number of shares of Class A common stock available for sale to the general public. Any reserved shares of Class A common stock that are not so purchased will be offered by the underwriters to the general public on the same terms as the other shares of Class A common stock offered by this prospectus. See “Underwriting—Reserved Share Program” for more information. |
| Risk factors |
You should read the “Risk Factors” section beginning on page 29 and the other information included in this prospectus for a discussion of factors to consider before deciding to invest in shares of our Class A common stock. |
Except as otherwise noted, all information in this prospectus (including, but not limited to, the number of shares of our Class A common stock and shares of our Class B common stock to be outstanding after the completion of this offering) assumes:
| • | the occurrence of the reorganization transactions; |
| • | that the underwriters do not exercise their option to purchase up to 1,275,000 additional shares of our Class A common stock from the selling stockholders; |
21
Table of Contents
| • | an initial public offering price of $18.00 per share (the midpoint of the estimated public offering price range set forth on the front cover of this prospectus); |
| • | the filing and effectiveness of our amended and restated certificate of incorporation and amended and restated bylaws upon the closing of this offering; |
| • | the exclusion of 1,200,278 shares of our Class A common stock (subject to adjustment for fractional shares) we expect to issue pursuant to restricted stock units we intend to grant in connection with this offering under the 2020 Plan, which we plan to adopt in connection with this offering, based on the midpoint of the estimated price range set forth on the front cover of this prospectus; and |
| • | the exclusion of 4,299,722 additional shares of our Class A common stock (subject to adjustment for fractional shares) that will remain available for issuance pursuant to future awards under our 2020 Plan based on the midpoint of the estimated price range set forth on the front cover of this prospectus. |
22
Table of Contents
SUMMARY HISTORICAL CONSOLIDATED FINANCIAL AND OPERATING DATA
The following tables present summary historical consolidated financial and operating data of Guild Mortgage Co. as of the dates and for the periods indicated. The summary consolidated statements of operations data presented below for the years ended December 31, 2019 and December 31, 2018 and the summary consolidated balance sheet data as of December 31, 2019 and December 31, 2018 have been derived from Guild Mortgage Co.’s audited consolidated financial statements included elsewhere in this prospectus. The summary consolidated statements of operations data presented below for the six-month periods ended June 30, 2020 and June 30, 2019 and the summary consolidated balance sheet data as of June 30, 2020 have been derived from Guild Mortgage Co.’s unaudited condensed consolidated financial statements included elsewhere in this prospectus. This prospectus does not include financial statements of the Issuer because it has only been formed for the purpose of effecting the reorganization transactions and, until the consummation of the reorganization transactions, will hold no material assets and will not engage in any operations. See “Organizational Structure.”
The summary consolidated historical financial and operating data are not necessarily indicative of the results to be expected in any future period. You should read the following summary historical financial and operating data in conjunction with the sections of this prospectus entitled “Selected Historical Consolidated Financial and Operating Data” and “Management’s Discussion and Analysis of Financial Condition and Results of Operations” and Guild Mortgage Co.’s audited and unaudited consolidated financial statements and related notes included elsewhere in this prospectus. The summary historical financial and operating data in this section are not intended to replace, and are qualified in their entirety by, Guild Mortgage Co.’s audited and unaudited consolidated financial statements and related notes included elsewhere in this prospectus.
| Six Months Ended June 30, |
Year Ended December 31, |
|||||||||||||||
| 2020 | 2019 | 2019 | 2018 | |||||||||||||
| Statements of Income (Loss) Data |
||||||||||||||||
| (in thousands) | ||||||||||||||||
| Revenue |
||||||||||||||||
| Loan origination fees and gain on sale of loans, net |
$ | 733,293 | $ | 327,503 | $ | 820,814 | $ | 616,608 | ||||||||
| Loan servicing and other fees |
76,310 | 68,437 | 142,705 | 123,681 | ||||||||||||
| Valuation adjustment of mortgage servicing rights |
(204,810 | ) | (160,222 | ) | (255,219 | ) | (17,050 | ) | ||||||||
| Interest income (expense), net |
(492 | ) | 2,194 | 3,396 | (326 | ) | ||||||||||
| Other income (expense) |
(4 | ) | 1,181 | 1,193 | 6 | |||||||||||
|
|
|
|
|
|
|
|
|
|||||||||
| Net revenue |
604,297 | 239,093 | 712,889 | 722,919 | ||||||||||||
|
|
|
|
|
|
|
|
|
|||||||||
| Expense |
||||||||||||||||
| Salaries, commissions and benefits |
376,898 | 241,316 | 578,170 | 510,253 | ||||||||||||
| General and administrative |
48,192 | 28,624 | 63,983 | 50,976 | ||||||||||||
| Occupancy, equipment and communication |
26,955 | 26,942 | 53,678 | 52,483 | ||||||||||||
| Depreciation and amortization |
3,146 | 3,824 | 7,333 | 7,180 | ||||||||||||
| Provision for foreclosure losses |
1,860 | 774 | 3,895 | 4,434 | ||||||||||||
|
|
|
|
|
|
|
|
|
|||||||||
| Total expenses |
457,051 | 301,480 | 707,059 | 625,326 | ||||||||||||
|
|
|
|
|
|
|
|
|
|||||||||
| Income (loss) before income tax (benefit) expense |
147,246 | (62,387 | ) | 5,830 | 97,593 | |||||||||||
| Income tax (benefit) expense |
36,465 | (15,389 | ) | 253 | 24,260 | |||||||||||
|
|
|
|
|
|
|
|
|
|||||||||
| Net income (loss) |
$ | 110,781 | $ | (46,998 | ) | $ | 5,577 | $ | 73,333 | |||||||
|
|
|
|
|
|
|
|
|
|||||||||
23
Table of Contents
| As of June 30, | As of December 31, | |||||||||||
| 2020 | 2019 | 2018 | ||||||||||
| Balance Sheet Data |
||||||||||||
| (in thousands) |
||||||||||||
| Assets |
||||||||||||
| Cash, cash equivalents and restricted cash |
$ | 148,462 | $ | 106,735 | $ | 62,755 | ||||||
| Mortgage loans held for sale |
1,982,521 | 1,504,842 | 966,171 | |||||||||
| Derivative asset |
141,629 | 19,922 | 12,541 | |||||||||
| Mortgage servicing rights, net |
336,687 | 418,402 | 511,852 | |||||||||
| Other assets |
1,093,706 | 557,512 | 484,932 | |||||||||
|
|
|
|
|
|
|
|||||||
| Total assets |
$ | 3,703,005 | $ | 2,607,413 | $ | 2,038,251 | ||||||
|
|
|
|
|
|
|
|||||||
| Liabilities and stockholder’s equity |
||||||||||||
| Warehouse lines of credit |
$ | 1,689,291 | $ | 1,303,187 | $ | 839,734 | ||||||
| Notes payable |
188,000 | 218,000 | 160,000 | |||||||||
| Other liabilities |
1,318,902 | 680,195 | 597,576 | |||||||||
|
|
|
|
|
|
|
|||||||
| Total liabilities |
3,196,193 | 2,201,382 | 1,597,310 | |||||||||
|
|
|
|
|
|
|
|||||||
| Total stockholder’s equity |
$ | 506,812 | $ | 406,031 | $ | 440,941 | ||||||
|
|
|
|
|
|
|
|||||||
Non-GAAP Financial Measures
To supplement Guild Mortgage Co.’s financial statements presented in accordance with GAAP and to provide investors with additional information regarding Guild Mortgage Co.’s GAAP financial results, we have presented in this prospectus Adjusted Net Income, Adjusted EBITDA and Adjusted Return on Equity, which are non-GAAP financial measures. These non-GAAP financial measures are not based on any standardized methodology prescribed by GAAP and are not necessarily comparable to similarly titled measures presented by other companies.
Adjusted Net Income. We define Adjusted Net Income as earnings before the change in the fair value measurements related to our mortgage servicing rights (“MSRs”) and contingent liabilities related to completed acquisitions due to changes in valuation assumptions. The fair value of our MSRs is estimated based on a projection of expected future cash flows and the fair value of our contingent liabilities related to completed acquisitions is estimated based on a projection of expected future earn-out payments. Adjusted Net Income is also adjusted by applying an implied tax effect to these adjustments. The Company excludes the change in the fair value of its MSRs due to changes in model inputs and assumptions from Adjusted Net Income and Adjusted EBITDA because the Company believes this non-cash, non-realized adjustment to total revenues is not indicative of the Company’s operating performance or results of operation but rather reflects changes in model inputs and assumptions (e.g., discount rates and prepayment speed assumptions) that impact the carrying value of the Company’s MSRs from period to period.
Adjusted EBITDA. We define Adjusted EBITDA as earnings before interest (without adjustment for net warehouse interest related to loan fundings and payoff interest related to loan prepayments), taxes, depreciation and amortization exclusive of any change in the fair value measurements of the MSRs due to valuation assumptions and contingent liabilities from business acquisitions. The Company excludes the change in the fair value of its MSRs due to changes in model inputs and assumptions from Adjusted Net Income and Adjusted EBITDA because the Company believes this non-cash, non-realized adjustment to total revenues is not indicative of the Company’s operating performance or results of operation but rather reflects changes in model inputs and assumptions (e.g., discount rates and prepayment speed assumptions) that impact the carrying value of the Company’s MSRs from period to period.
24
Table of Contents
Adjusted Return on Equity. We define Adjusted Return on Equity as Adjusted Net Income as a percentage of average beginning and ending stockholder’s equity during the period. For periods of less than one year, Adjusted Return on Equity is shown on an annualized basis.
We use these non-GAAP financial measures to evaluate our operating performance, to establish budgets and to develop operational goals for managing our business. These non-GAAP financial measures are designed to evaluate operating results exclusive of fair value adjustments that are not indicative of management’s operating performance. Accordingly, we believe that these financial measures provide useful information to investors and others in understanding and evaluating our operating results, enhancing the overall understanding of our past performance and future prospects. We have presented certain of these non-GAAP financial measures for the twelve months ended June 30, 2020 and June 30, 2019 because the twelve months ended June 30, 2020 provides the most current twelve-month period data that is available for comparison against certain historical annual metrics included in this prospectus and the data for the twelve months ended June 30, 2019 provides data for the comparable twelve-month period.
Our non-GAAP financial measures are not prepared in accordance with GAAP and should not be considered in isolation of, or as an alternative to, measures prepared in accordance with GAAP. There are a number of limitations related to the use of these non-GAAP financial measures rather than net income (loss), which is the most directly comparable financial measure calculated and presented in accordance with GAAP for Adjusted Net Income and Adjusted EBITDA, and return on equity, which is the most directly comparable financial measure calculated and presented in accordance with GAAP for Adjusted Return on Equity. These limitations include that these non-GAAP financial measures are not based on a comprehensive set of accounting rules or principles and many of the adjustments to the GAAP financial measures reflect the exclusion of items that are recurring and may be reflected in the Company’s financial results for the foreseeable future. In addition, other companies may use other measures to evaluate their performance, all of which could reduce the usefulness of our non-GAAP financial measures as tools for comparison.
The following tables reconcile Adjusted Net Income and Adjusted EBITDA to net income (loss), the most directly comparable financial measures calculated and presented in accordance with GAAP.
| Reconciliation of Net ($ in thousands) |
Six Months Ended June 30, |
Twelve Months Ended June 30, |
Years ended December 31, |
|||||||||||||||||||||
| 2020 | 2019 | 2020 | 2019 | 2019 | 2018 | |||||||||||||||||||
| Net income (loss) |
$ | 110,781 | $ | (46,998 | ) | 163,356 | $ | (33,173 | ) | $ | 5,577 | $ | 73,333 | |||||||||||
| Add adjustments: |
||||||||||||||||||||||||
| Change in fair value of MSRs due to model inputs and assumptions |
151,080 | 130,734 | 191,744 | 152,016 | 171,398 | (26,178 | ) | |||||||||||||||||
| Change in fair value of contingent liabilities due to acquisitions |
20,025 | 3,054 | 24,891 | (157 | ) | 7,920 | (2,642 | ) | ||||||||||||||||
| Tax impact of adjustments(1) |
(43,718 | ) | (34,183 | ) | (55,351 | ) | (38,776 | ) | (45,816 | ) | 7,364 | |||||||||||||
|
|
|
|
|
|
|
|
|
|
|
|
|
|||||||||||||
| Adjusted Net Income |
$ | 238,168 | $ | 52,607 | $ | 324,640 | $ | 79,910 | $ | 139,079 | $ | 51,877 | ||||||||||||
|
|
|
|
|
|
|
|
|
|
|
|
|
|||||||||||||
| (1) | Implied tax rate used is 25.5%. |
25
Table of Contents
| Reconciliation of Net Income (Loss) to Adjusted ($ in thousands) |
Six Months Ended June 30, |
Years ended December 31, |
||||||||||||||
| 2020 | 2019 | 2019 | 2018 | |||||||||||||
| Net income (loss) |
$ | 110,781 | $ | (46,998 | ) | $ | 5,577 | $ | 73,333 | |||||||
| Add adjustments: |
||||||||||||||||
| Interest expense on non-funding debt |
4,291 | 4,603 | 8,980 | 7,019 | ||||||||||||
| Income tax provision |
36,465 | (15,389 | ) | 253 | 24,260 | |||||||||||
| Depreciation and amortization |
3,146 | 3,824 | 7,333 | 7,180 | ||||||||||||
| Change in fair value of MSRs due to model inputs and assumptions |
151,080 | 130,734 | 171,398 | (26,178 | ) | |||||||||||
| Change in fair value of contingent liabilities due to acquisitions |
20,025 | 3,054 | 7,920 | (2,642 | ) | |||||||||||
|
|
|
|
|
|
|
|
|
|||||||||
| Adjusted EBITDA |
$ | 325,788 | $ | 79,828 | $ | 201,461 | $ | 82,972 | ||||||||
|
|
|
|
|
|
|
|
|
|||||||||
| Adjusted Return on ($ in thousands, except |
Six Months Ended June 30, |
Twelve Months Ended June 30, |
Years ended December 31, |
|||||||||||||||||||||
| 2020 | 2019 | 2020 | 2019 | 2019 | 2018 | |||||||||||||||||||
| Numerator: Adjusted Net Income |
$ | 238,168 | $ | 52,607 | $ | 324,640 | $ | 79,910 | $ | 139,079 | $ | 51,877 | ||||||||||||
| Denominator: Average stockholder’s equity |
456,422 | 407,199 | 440,134 | 410,287 | 423,486 | 429,244 | ||||||||||||||||||
|
|
|
|
|
|
|
|
|
|
|
|
|
|||||||||||||
| Adjusted Return on Equity(1) |
104.4 | % | 25.8 | % | 73.8 | % | 19.5 | % | 32.8 | % | 12.1 | % | ||||||||||||
|
|
|
|
|
|
|
|
|
|
|
|
|
|||||||||||||
| Return on equity(2) |
48.5 | % | (23.1 | )% | 37.1 | % | (8.1 | )% | 1.3 | % | 17.1 | % | ||||||||||||
| (1) | For the six months ended June 30, 2020 and June 30, 2019, Adjusted Return on Equity is shown on an annualized basis. |
| (2) | For the six months ended June 30, 2020 and June 30, 2019, return on equity is shown on an annualized basis. |
| Reconciliation of Net Income (in thousands) |
Three Months Ended September 30, |
Nine Months Ended September 30, |
||||||||||||||||||||||
| 2020 | 2019 | 2020 | 2019 | |||||||||||||||||||||
| Low | High | (Actual) | Low | High | (Actual) | |||||||||||||||||||
| Net income (loss) |
$ | 178,000 | $ | 187,000 | $ | 8,496 | $ | 286,000 | $ | 301,000 | $ | (38,502 | ) | |||||||||||
| Add adjustments: |
||||||||||||||||||||||||
| Change in fair value of MSRs due to model inputs and assumptions |
9,000 | 10,000 | 63,062 | 157,000 | 165,000 | 194,104 | ||||||||||||||||||
| Change in fair value of contingent liabilities due to acquisitions |
6,000 | 7,000 | 4,222 | 26,000 | 27,000 | 7,276 | ||||||||||||||||||
| Tax impact of adjustments |
(4,000 | ) | (4,000 | ) | (17,157 | ) | (47,000 | ) | (49,000 | ) | (51,352 | ) | ||||||||||||
|
|
|
|
|
|
|
|
|
|
|
|
|
|||||||||||||
| Adjusted Net Income |
$ | 189,000 | $ | 200,000 | $ | 58,623 | $ | 422,000 | $ | 444,000 | $ | 111,526 | ||||||||||||
|
|
|
|
|
|
|
|
|
|
|
|
|
|||||||||||||
26
Table of Contents
| Reconciliation of Net Income (in thousands) |
Three Months Ended September 30, |
Nine Months Ended September 30, |
||||||||||||||||||||||
| 2020 | 2019 | 2020 | 2019 | |||||||||||||||||||||
| Low | High | (Actual) | Low | High | (Actual) | |||||||||||||||||||
| Net income (loss) |
$ | 178,000 | $ | 187,000 | $ | 8,496 | $ | 286,000 | $ | 301,000 | $ | (38,502 | ) | |||||||||||
| Add adjustments: |
||||||||||||||||||||||||
| Interest expense on non-funding debt |
2,000 | 2,000 | 2,194 | 6,000 | 7,000 | 6,797 | ||||||||||||||||||
| Income tax provision |
62,000 | 65,000 | (2,661 | ) | 98,000 | 103,000 | (18,050 | ) | ||||||||||||||||
| Depreciation and amortization |
2,000 | 2,000 | 1,812 | 5,000 | 5,000 | 5,636 | ||||||||||||||||||
| Change in fair value of MSRs due to model inputs and assumptions |
9,000 | 10,000 | 63,062 | 157,000 | 165,000 | 194,104 | ||||||||||||||||||
| Change in fair value of contingent liabilities due to acquisitions |
6,000 | 7,000 | 4,222 | 26,000 | 27,000 | 7,276 | ||||||||||||||||||
|
|
|
|
|
|
|
|
|
|
|
|
|
|||||||||||||
| Adjusted EBITDA |
$ | 259,000 | $ | 273,000 | $ | 77,125 | $ | 578,000 | $ | 608,000 | $ | 157,261 | ||||||||||||
|
|
|
|
|
|
|
|
|
|
|
|
|
|||||||||||||
| Adjusted Return on Equity (in thousands, except where in |
Three Months Ended September 30, |
Nine Months Ended September 30, |
||||||||||||||||||||||
| 2020 | 2019 | 2020 | 2019 | |||||||||||||||||||||
| Low | High | (Actual) | Low | High | (Actual) | |||||||||||||||||||
| Numerator: Adjusted Net Income |
$ | 189,000 | $ | 200,000 | $ | 58,623 | $ | 422,000 | $ | 444,000 | $ | 111,526 | ||||||||||||
| Denominator: Average stockholder’s equity |
595,812 | 600,312 | 377,704 | 544,031 | 551,531 | 411,446 | ||||||||||||||||||
|
|
|
|
|
|
|
|
|
|
|
|
|
|||||||||||||
| Adjusted Return on Equity(1) |
127 | % | 133 | % | 62 | % | 103 | % | 107 | % | 36 | % | ||||||||||||
|
|
|
|
|
|
|
|
|
|
|
|
|
|||||||||||||
| Return on equity(2) |
120 | % | 125 | % | 9 | % | 70 | % | 73 | % | (12 | )% | ||||||||||||
| (1) | For the three months ended September 30, 2020 and September 30, 2019 and the nine months ended September 30, 2020 and September 30, 2019, Adjusted Return on Equity is shown on an annualized basis. |
| (2) | For the three months ended September 30, 2020 and September 30, 2019 and the nine months ended September 30, 2020 and September 30, 2019, return on equity is shown on an annualized basis. |
27
Table of Contents
The following table reconciles the valuation adjustment of mortgage servicing rights from the Company’s consolidated statements of income to the change in fair value of MSRs due to model inputs and assumptions included in the reconciliation tables above.
| Reconciliation of ($ in thousands) |
Six Months Ended June 30, |
Twelve Months Ended June 30, |
Year ended December 31, |
|||||||||||||||||||||
| 2020 | 2019 | 2020 | 2019 | 2019 | 2018 | |||||||||||||||||||
| Valuation adjustment of mortgage servicing rights |
$ | (204,810 | ) | $ | (160,222 | ) | $ | (299,807 | ) | $ | (203,842 | ) | $ | (255,219 | ) | $ | (17,050 | ) | ||||||
| Subtract adjustment: |
||||||||||||||||||||||||
| Change in fair value of MSRs due to collection/realization of cash flows |
(53,730 | ) | (29,488 | ) | (108,063 | ) | (51,826 | ) | (83,821 | ) | (43,228 | ) | ||||||||||||
|
|
|
|
|
|
|
|
|
|
|
|
|
|||||||||||||
| Change in fair value of MSRs due to model inputs and assumptions |
$ | (151,080 | ) | $ | (130,734 | ) | $ | (191,744 | ) | $ | (152,016 | ) | $ | (171,398 | ) | $ | 26,178 | |||||||
|
|
|
|
|
|
|
|
|
|
|
|
|
|||||||||||||
28
Table of Contents
Investing in our Class A common stock involves risks. You should carefully consider the risks and uncertainties described below, together with all of the other information included in this prospectus, including the financial statements and the related notes appearing at the end of this prospectus, before deciding to invest in our Class A common stock. Our business, financial condition, operating results, cash flow and prospects could be materially and adversely affected by any of these risks or uncertainties. In that case, the trading price of our Class A common stock could decline, and you could lose all or part of your investment. The risks and uncertainties described below are not the only ones we face. Additional risks and uncertainties that we are unaware of or that we currently see as immaterial may also adversely affect our business. Some statements in this prospectus, including statements included in the following risk factors, constitute forward-looking statements. Please refer to “Cautionary Note Regarding Forward-Looking Statements.”
Risks Related to Our Business
The COVID-19 pandemic has had, and will likely continue to have, an adverse effect on our business, and its ultimate effect on our business and financial results will depend on future developments, which are highly uncertain and cannot be predicted, including the scope and duration of the pandemic and actions taken or to be taken by government authorities in response to the pandemic.
The COVID-19 pandemic has negatively affected, and continues to negatively affect, the national economy and the local economies in the communities in which we operate and has created unprecedented economic, financial and health disruptions that have, and will likely continue to have, an adverse effect on our business. The pandemic has also caused significant volatility and disruption in the financial markets. In the event of a prolonged economic downturn or other economic disruption or changes in the broader economy, housing market, debt markets or otherwise, real estate transactions, the volume of mortgages we originate and the value of the homes that serve as collateral for the loans that we service may decrease significantly.
The COVID-19 pandemic is also affecting our mortgage servicing operations. The federal government enacted the Coronavirus Aid, Relief, and Economic Security Act (the “CARES Act”), which allows borrowers with federally backed loans to request a temporary mortgage forbearance. As a result of the CARES Act forbearance requirements, we have recorded, and expect to record additional, increases in delinquencies in our servicing portfolio, which may require us to finance substantial amounts of advances of principal and interest, property taxes, insurance premiums and other expenses to protect investors’ interests in the properties securing the loans. We expect that a borrower who has experienced a loss of employment or a reduction of income may not repay the forborne payments at the end of the forbearance period, or at all. Additionally, we are prohibited from collecting certain servicing-related fees, such as late fees, and initiating foreclosure proceedings. As a result, we expect the effects of the CARES Act forbearance requirements to reduce our servicing income, increase our servicing expenses and require significant cash outlays.
The COVID-19 pandemic may also affect our liquidity. We fund substantially all of the mortgage loans we close through borrowings under our loan funding facilities. Given the broad impact of COVID-19 on the financial markets, our future ability to borrow money to fund our current and future loan production and other cash needs is unknown. Our mortgage origination liquidity could also be affected if our lenders curtail access to uncommitted mortgage warehouse financing capacity or impose higher costs to access such capacity. Our liquidity may be further constrained as there may be less demand by investors to acquire our mortgage loans in the secondary market. In addition, we may be required to use significant amounts of cash to fund advances for loans subject to forbearance requirements or that are delinquent.
Our business operations may also be disrupted if significant portions of our workforce are unable to work effectively, including because of illness, quarantines, government actions or other restrictive measures in connection with the pandemic. As a result of the pandemic, a significant portion of our
29
Table of Contents
employees have been working remotely. Although some government authorities were in varying stages of lifting or modifying some of these measures, some have already, and others may in the future, reinstitute these measures or impose new, more restrictive measures, if the risks, or the perception of the risks, related to the COVID-19 pandemic worsen at any time. Such restrictive measures could also slow certain aspects of our operations that depend on third parties such as appraisers, closing agents and others for loan-related verifications.
The extent to which the COVID-19 pandemic impacts our business, results of operations, and financial condition will ultimately depend on future developments, which are highly uncertain and cannot be predicted, including the scope and duration of the pandemic and actions taken by governmental authorities and other third parties in response to the pandemic.
A disruption in the secondary home loan market or our ability to sell the loans that we originate could have a detrimental effect on our business.
Demand in the secondary market for home loans and our ability to sell the mortgages that we originate depends on many factors that are beyond our control, including general economic conditions, the willingness of lenders to provide funding for and purchase home loans and changes in regulatory requirements. Our inability to sell the mortgages that we originate in the secondary market in a timely manner and on favorable terms could be detrimental to our business. In particular, we sell the majority of the mortgages that we originate to Fannie Mae, Freddie Mac and Ginnie Mae, and the gain recognized from these sales represents a significant portion of our revenues and net earnings. If it is not possible or economical for us to continue selling mortgages to the GSEs, or other loan purchasers, our business, prospects, financial condition and results of operations could be materially and adversely affected.
Macroeconomic and U.S. residential real estate market conditions could materially and adversely affect our revenue and results of operations.
Our business has been, and will continue to be, affected by a number of factors that are beyond our control, including the health of the U.S. residential real estate industry, which is seasonal, cyclical, and affected by changes in general economic conditions, including the effects of the COVID-19 pandemic. Furthermore, our clients’ and potential clients’ income, and thus their ability and willingness to make home purchases and mortgage payments, may be negatively affected by macroeconomic factors such as unemployment, wage deflation, changes in property values and taxes and the availability and cost of credit. As a result, these macroeconomic factors can adversely affect our origination volume.
Increased delinquencies could also increase the cost of servicing existing mortgages and could be detrimental to our business. Lower servicing fees could result in decreased cash flow, and also could decrease the estimated value of our MSRs, resulting in recognition of losses when we write down those values. In addition, an increase in delinquencies lowers the interest income we receive on cash held in collection and other accounts and increases our obligation to advance certain principal, interest, tax and insurance obligations owed by the delinquent mortgage loan borrower.
We highly depend on certain U.S. government-sponsored entities and government agencies, and any changes in these entities or their current roles could materially and adversely affect our business, financial condition and results of operations.
A substantial portion of the loans we originate are loans eligible for sale to Fannie Mae and Freddie Mac, and government insured or guaranteed loans, such as loans backed by the FHA, the VA and the USDA eligible for Ginnie Mae securities issuance. The future of the GSEs, Fannie Mae and Freddie Mac, is uncertain, including with respect to how long they will continue to be in existence, the extent of their roles in the market and what forms they will have, and whether they will be government agencies, government-sponsored agencies or private for-profit entities. If the operation of the GSEs is discontinued or reduced, if there is a significant change in their capital structure, financial condition, activity levels or roles in the
30
Table of Contents
primary or secondary mortgage markets or in their underwriting criteria or if we lose approvals with those agencies or our relationships with those agencies is otherwise adversely affected, our business, financial condition and results of operations could be adversely affected.
Changes in prevailing interest rates or U.S. monetary policies may have a detrimental effect on our business. Our hedging strategies may not be successful in mitigating interest rate risk.
Our profitability is directly affected by changes in interest rates. The market value of closed loans held for sale and interest rate locks generally change along with interest rates. As such, volatility in prevailing interest rates may have a detrimental effect on our financial performance and results of operations. Many factors beyond our control impact interest rates, including economic conditions, governmental monetary policies, inflation, recession, changes in unemployment, the money supply, and disorder and instability in domestic and foreign financial markets. Changes in monetary policies of U.S. government agencies could influence not only consumer demand for mortgages but also the fair value of our financial assets and liabilities.
We pursue hedging strategies to mitigate our exposure to adverse changes in interest rates, including with respect to loans held for sale and interest rate locks. Hedging interest rate risk, however, is a complex process, requiring sophisticated models and constant monitoring, and is not a perfect science. Due to interest rate fluctuations, hedged assets and liabilities will appreciate or depreciate in market value. The effect of this unrealized appreciation or depreciation will generally be offset by income or loss on the derivative instruments that are linked to the hedged assets and liabilities. If we engage in derivative transactions, we will be exposed to credit and market risk. If the counterparty fails to perform, counterparty risk exists to the extent of the fair value gain in the derivative. Interest rate risk exists to the extent that interest rates change in ways that are significantly different from what we expected when we entered into the derivative transaction. In addition, we may not engage in hedging strategies with respect to all or a portion of our exposure to changes in interest rates at any given time, or may engage in hedging strategies to a degree or in a manner that is different from that of other companies in our industry. Failure to manage interest rate risk could have a material adverse effect on our business. See “Management’s Discussion and Analysis of Financial Condition and Results of Operations—Quantitative and Qualitative Disclosures about Market Risk.”
Our servicing rights are subject to termination with or without cause.
The servicing agreements under which we service mortgage loans for GSE and non-GSE loan purchasers require that we comply with certain servicing guidelines and abide by certain financial covenants. Under the terms of our master servicing agreements with the GSEs and non-GSEs that purchase the loans we originate, the loan purchasers generally retain the right to terminate us as servicer of the loans we service on their behalf, with or without cause. If we were to have our MSRs terminated on a material portion of our servicing portfolio, or if our costs related to servicing mortgages were increased by the way of additional fees, fines or penalties or an increase in related compliance costs, this could materially and adversely affect our business.
Our existing and any future indebtedness could adversely affect our ability to operate our business, our financial condition or the results of our operations.
Our existing and any future indebtedness could have important consequences, including:
| • | requiring us to dedicate a substantial portion of our cash flow to payments on our indebtedness, which would reduce the amount of cash flow available to fund working capital, capital expenditures or other corporate purposes; |
| • | increasing our vulnerability to general adverse economic, industry and market conditions; |
| • | subjecting us to restrictive covenants that may reduce our ability to take certain corporate actions or obtain further debt or equity financing; |
31
Table of Contents
| • | limiting our ability to plan for and respond to business opportunities or changes in our business or industry; and |
| • | placing us at a competitive disadvantage compared to our competitors that have less debt or better debt servicing options. |
Failure to make payments or comply with other covenants under our existing debt instruments could result in an event of default. If an event of default occurs and the lender accelerates the amounts due, we may need to seek additional financing, which may not be available on acceptable terms, in a timely manner or at all. In that event, we may not be able to make accelerated payments, and the lender could seek to enforce security interests in the collateral securing such indebtedness, which includes substantially all of our assets.
Our mortgage loan origination and servicing activities rely on our loan funding facilities to fund mortgage loans and otherwise operate our business. If one or more of those facilities are terminated, we may be unable to find replacement financing at commercially favorable terms, or at all, which could be detrimental to our business.
We fund substantially all of the mortgage loans we close through borrowings under our loan funding facilities and funds generated by our operations. Our borrowings are in turn generally repaid with the proceeds we receive from mortgage loan sales. We currently, and may in the future continue to, depend upon a handful of lenders to provide the primary funding facilities for our loans. As of the date of this prospectus, we had seven warehouse lines of credit pursuant to master repurchase agreements, which provide us with an aggregate maximum borrowing capacity of approximately $2.9 billion. Additionally, as of June 30, 2020, we were party to (i) a term loan credit agreement with one of our warehouse banks, which agreement is collateralized by our Fannie Mae MSRs and provides for a term loan facility of $100.0 million (which can be increased to up to $150.0 million), (ii) a loan and security agreement with one of our warehouse banks, which agreement is collateralized by our Ginnie Mae MSRs and provides for a revolving facility of up to $135.0 million (which can be increased to up to $200.0 million) and (iii) a loan and security agreement with one of our warehouse banks, which agreement is collateralized by our Freddie Mac MSRs and provides for a revolving facility of up to $50.0 million.
In the event that any of our loan funding facilities is terminated or is not renewed, or if the principal amount that may be drawn under our funding agreements were to decrease significantly, we may be unable to find replacement financing on commercially favorable terms, or at all, which could be detrimental to our business. Further, if we are unable to refinance or obtain additional funds for borrowing, our ability to maintain or grow our business could be limited.
Our ability to refinance existing debt and borrow additional funds is affected by a variety of factors, including:
| • | limitations imposed under existing and future financing facilities that contain restrictive covenants and borrowing conditions that may limit our ability to raise additional debt; |
| • | a decline in liquidity in the credit markets; |
| • | prevailing interest rates; |
| • | the financial strength of the lenders from whom we borrow; |
| • | the decision of lenders from whom we borrow to reduce their exposure to mortgage loans due to a change in such lenders’ strategic plan, future lines of business or otherwise; |
| • | the amount of eligible collateral pledged on advance facilities, which may be less than the borrowing capacity of the facility; |
| • | the large portion of our loan funding facilities that is uncommitted; |
32
Table of Contents
| • | more stringent financial covenants in our refinanced facilities, with which we may not be able to comply; and |
| • | accounting changes that impact calculations of covenants in our debt agreements. |
If the refinancing or borrowing guidelines become more stringent and those changes result in increased costs to comply or decreased origination volume, those changes could be detrimental to our business.
Our loan funding facilities contain covenants that include certain financial requirements, including maintenance of maximum adjusted leverage ratio, minimum net worth, minimum tangible net worth, minimum current ratio, minimum liquidity, positive quarterly income and other customary debt covenants, as well as limitations on additional indebtedness, dividends, sales of assets, and declines in the mortgage loan servicing portfolio’s fair value. A breach of these covenants can result in an event of default under these facilities and as such allow the lenders to pursue certain remedies. In addition, our loan facilities include cross default or cross acceleration provisions that could result in most, if not all, facilities terminating if an event of default or acceleration of maturity occurs under a facility. If we are unable to meet or maintain the necessary covenant requirements or satisfy, or obtain waivers for, the continuing covenants, we may lose the ability to borrow under all of our financing facilities, which could be detrimental to our business.
Our business depends on our ability to maintain and improve the technology infrastructure that supports our origination and servicing platform, and any significant disruption in service on our platform could harm our business, brand, operating results, financial condition and prospects.
Our ability to service our clients depends on the reliable performance of our technology infrastructure. Interruptions, delays or failures in these systems, whether due to adverse weather conditions, natural disasters, power loss, computer viruses, cybersecurity attacks, physical break-ins, terrorism, hardware failures, errors in our software or otherwise, could be prolonged and could affect the security or availability of our platform and our ability to originate and service mortgages. Furthermore, we may incur significant expense maintaining, updating and adapting our technology infrastructure, and our disaster recovery planning may be insufficient to prevent or mitigate these and other events or occurrences. The reliability and security of our systems, and those of certain third parties, is important not only to facilitating our origination and servicing of mortgages, but also to maintaining our reputation and ensuring the proper protection of our confidential and proprietary information and the data of mortgage borrowers and other third parties that we possess or control or to which we have access. Operational failures or prolonged disruptions or delays in the availability of our systems could harm our business, brand, reputation, operating results, financial condition and prospects.
Our risk management strategies may not be fully effective in mitigating our risk exposures in all market environments or against all types of risk.
We have devoted significant resources to develop our risk management policies and procedures and expect to continue to do so in the future. Nonetheless, our risk management strategies may not be fully effective in mitigating our risk exposure in all market environments or against all types of risk, including market, interest rate, credit, liquidity, operational, cybersecurity, legal, regulatory and compliance risks, as well as other risks that we may not have identified or anticipated. As our products and services change and grow and the markets in which we operate evolve, our risk management strategies may not always adapt to those changes in a timely or effective manner. Some of our methods of managing risk are based upon our use of observed historical market behavior and management’s judgment. As a result, these methods may not predict future risk exposures, which could be different or significantly greater than the historical measures indicate. Although we employ a broad and diversified set of risk monitoring and risk mitigation techniques, those techniques and the judgments that accompany their application cannot anticipate every economic and financial outcome or the timing of such outcomes. Any of these circumstances could have an adverse effect on our business, financial condition and results of operations.
33
Table of Contents
Pressure from existing and new competitors may adversely affect our business, operating results, financial condition and prospects.
We operate in a highly competitive industry that could become even more competitive due to economic, legislative, regulatory and technological changes. We face significant competition for clients from bank and non-bank competitors, including national and regional banks, mortgage banking companies, financial technology companies and correspondent lenders. Many of our competitors are significantly larger and have significantly more resources, greater name recognition and more extensive and established retail footprints than we do.
Our ability to compete successfully will depend on a number of factors, including, among other things, our ability to build and maintain long-term client relationships while ensuring high ethical standards and sound lending and servicing practices, the scope, relevance and pricing of products and services that we offer, our clients’ satisfaction with our products and services, industry and general economic trends and our ability to keep pace with technological advances in the industry.
Our failure to compete effectively in our markets could restrain our growth or cause us to lose market share, which could have a material adverse effect on our business, prospects, financial condition and results of operations. We may also face a competitive disadvantage as a result of our concentration in the northwest United States and will be unable, as compared to our more geographically diversified peers, to spread our operating costs across a broader market. Furthermore, a cyclical decline in the industry’s overall level of originations, or decreased demand for loans due to a higher interest rate environment, may lead to increased competition for remaining loan originations. Any increase in these competitive pressures could have an adverse effect on our business, prospects, financial condition and results of operations.
Our failure to maintain or grow our historical referral relationships with our referral partners may materially and adversely affect our business, operating results, financial condition and prospects.
A substantial portion of our mortgage origination leads are sourced through an established network of referral partners with which we have longstanding relationships. We rely on being a preferred provider to realtors, builders and other partners with whom we have relationships. Our failure to maintain or grow these relationships could significantly decrease our origination volume and materially and adversely affect our business, operating results, financial condition and prospects. In addition, changes in the real estate and home construction industries, or in the relationships between those industries and the mortgage industry, could adversely affect our business and operating results, financial condition and prospects. For example, in recent years, there has been an increase in products and services designed to facilitate home sales without the involvement of realtors, and if the role of realtors in the sales process declines, our business could be adversely affected if we are unable to adapt to that development in a manner that preserves our loan origination leads.
If we are not able to continue the historical levels of growth in our market share in the mortgage origination and servicing industry, we may not be able to maintain our historical earnings trends.
Since 2007, Guild Mortgage Co. has consummated six acquisitions that significantly contributed to our growth, particularly in new geographies. We are currently pursuing a growth strategy focused on growing market share in existing markets, as well as expanding opportunistically into new markets. This strategy may not sustain our historical rate of growth or our ability to grow at all. Our ability to execute our growth strategy depends on a variety of factors, such as economic conditions and competition, which are beyond our control, and access to capital and liquidity to fund such growth. Our ability to execute our growth strategy also depends on our ability to identify attractive acquisition targets, execute such transactions in a timely manner and successfully integrate acquired businesses, and we may not be able to do so in the future. Future acquisitions may not provide the same benefit to us, or otherwise be as successful, as past acquisitions. In addition, we may issue equity in acquisition transactions, which would dilute our existing investors, and/or debt to finance such transactions, which would increase our leverage
34
Table of Contents
and expose us to additional risks relating to indebtedness. We may not be able to obtain the financing necessary to fund internal growth and we may not pursue growth through new acquisitions. Sustainable growth requires that we manage our risks by following prudent origination and servicing standards, hiring and retaining qualified loan officers and other employees, and successfully implementing strategic projects and initiatives. Our growth strategy may also change from time to time as a result of various internal and external factors. For example, natural disasters and other events beyond our control may also adversely affect our growth. If we are not able to continue our historical levels of growth, we may not be able to maintain these historical earnings trends. The absence of, or our inability to pursue and take advantage of, growth opportunities, or our inability to manage our growth successfully, could have a material adverse effect on our business, financial condition, results of our operations and prospects.
We may be adversely affected by a decline in our ability to recapture loans from borrowers who refinance.
The size of our servicing portfolio is subject to “run-off.” For example, mortgage loans we service may be repaid at maturity, prepaid prior to maturity, refinanced with a mortgage not serviced by us, liquidated through foreclosure, deed-in-lieu of foreclosure or other liquidation process, or repaid through standard amortization of principal. Due to this run-off, our ability to maintain the size of our servicing portfolio, and to generate new originations, depends in part on our ability to continue originating loans with respect to which we will maintain the servicing rights and recapturing loans from existing clients who are in the market to refinance. Clients who refinance their mortgages are not obligated to refinance their loans with us and may choose to do so with a different lender. If we are unsuccessful in maintaining or increasing our share of loan originations or in recapturing our existing loans that are refinanced, our servicing portfolio may become increasingly subject to run-off and/or our loan originations may decline. This could adversely affect our business, financial condition, results of operations and prospects.
We are required to make servicing advances that can be subject to delays in recovery or may not be recoverable in certain circumstances.
During any period in which our clients are not making payments on loans we service, including during defaults, delinquencies, forbearances and in certain circumstances where a client prepays a loan, we generally are required under our servicing agreements to advance our own funds to pay principal and interest, property taxes and insurance premiums, legal expenses and other expenses. In addition, in the event a loan serviced by us defaults or becomes delinquent, or to the extent a mortgagee under such loan is allowed to enter into a forbearance by applicable law or regulation, the repayment to us of any advance related to such events may be delayed until the loan is repaid or refinanced or liquidation occurs. Any delay or impairment in our ability to collect an advance may materially and adversely affect our liquidity, and delays in reimbursements of us, or our inability to be reimbursed, for advances could be detrimental to our business. Market disruptions such as the COVID-19 pandemic and the response, including through the CARES Act and the temporary period of forbearance that is being offered for clients unable to pay on certain mortgage loans as a result of the COVID-19 pandemic, as well as any extension or expansion of such periods of forbearance or similar or additional actions, may also increase the number of defaults, delinquencies or forbearances related to the loans we service, increasing the advances we make for such loans, which we may not recover in a timely manner or at all. In addition, any regulatory actions that lengthen the foreclosure process could increase the amount of servicing advances that we are required to make, lengthen the time it takes for us to be reimbursed for such advances and increase the costs incurred during the foreclosure process. While we have in the past utilized prepayments and payoffs to make advances, such sources, and other sources of liquidity available to us, may not be sufficient in the future, and our business, financial condition and results of operations could be materially and adversely affected as a result of required advances. As of August 31, 2020, loans representing approximately 4.7% of the loans in our servicing portfolio were in forbearance.
35
Table of Contents
If we are unable to attract, integrate and retain qualified personnel, our ability to develop and successfully grow our business could be harmed.
Our business depends on our ability to retain our key executives and management and to hire, develop and retain qualified loan officers and other employees. Our ability to expand our business depends on our being able to hire, train and retain sufficient numbers of employees to staff our in-house servicing centers, as well as other personnel. Our success in recruiting highly skilled and qualified personnel can depend on factors outside of our control, including the strength of the general economy and local employment markets and the availability of alternative forms of employment. Furthermore, the spread of COVID-19 may adversely affect our ability to recruit and retain personnel. If the services of any of our key personnel should become unavailable for any reason, we may not be able to identify and hire qualified persons on terms acceptable to us, which could have a material and adverse effect on our business, operating results, financial condition and prospects.
We may acquire other businesses or technologies, which could divert our management’s attention, result in additional dilution to our stockholders and otherwise disrupt our operations and harm our operating results, financial condition and prospects.
We may determine to emphasize the growth of our business through the acquisition of complementary businesses and technologies rather than through internal development. The identification of suitable acquisition candidates can be difficult, time-consuming and costly, and we may not be able to successfully complete identified acquisitions or the acquisitions may cause diversion of management time and focus away from operating our business. Following any acquisition, we may face difficulty integrating acquired businesses, including technology, finance and accounting and sales and marketing functions; challenges retaining acquired employees; future write-offs of intangibles or other assets; and potential litigation, claims or other known and unknown liabilities.
Depending on the condition of any business or technology we may acquire, that acquisition may, at least in the near term, adversely affect our financial condition and operating results and, if not successfully integrated with our organization, may continue to have these effects over a longer period. We may not realize the anticipated benefits of any acquisitions and we may not be successful in overcoming these risks or any other problems encountered in connection with potential acquisitions. The greater our emphasis on acquisitions, the greater these risks will become. Furthermore, although we have previously acquired other loan origination businesses, we can provide no assurances that we will be successful in identifying additional future opportunities that meet our acquisition criteria or that, once identified, we will be successful in completing an acquisition or integrating an acquired business, and any future acquisitions may not provide the same benefits to us, or otherwise be as successful, as past acquisitions. Our inability to overcome these risks could have an adverse effect on our profitability, return on equity and return on assets, our ability to implement our business strategy and enhance stockholder value, which, in turn, could have a material and adverse effect on our business, operating results, financial condition and prospects.
A substantial portion of our assets are measured at fair value. If our estimates of their value prove to be inaccurate, we may be required to write them down, which could adversely affect our business and financial condition.
We record the value of our MSRs, interest rate lock commitments (“IRLCs”), mortgage loans held for sale (“MLHS”), the contingent liabilities related to our completed acquisitions and our inventory of loans for which we have repurchase rights at fair value. Fair value determinations require many assumptions and complex analyses for which we cannot control many of the underlying factors. If our estimates prove to be incorrect, we may be required to write down the value of these assets, which could adversely affect our earnings, financial condition and liquidity. See “Management’s Discussion and Analysis of Financial Condition and Results of Operations—Quantitative and Qualitative Disclosures about Market Risk—Fair Value Risk” for more information.
36
Table of Contents
In particular, our estimates of the fair value of our MSRs are based on the cash flows projected to result from the servicing of the related mortgage loans and continually fluctuate due to a number of factors, including prepayment rates and other market conditions that affect the number of loans that ultimately become delinquent or are repaid or refinanced. These estimates are calculated by a third party using complex financial models that account for a high number of variables that drive cash flows associated with MSRs and anticipate changes in those variables over the life of the MSR. As such, the accuracy of our estimates of the fair value of our MSRs are highly dependent upon the reasonableness of the results of such models and the variables and assumptions that we build into them. If loan delinquencies or prepayment speeds are higher than anticipated or other factors perform worse than modeled, the recorded value of certain of our MSRs may decrease, which could adversely affect our business, financial condition and results of operations.
We may from time to time be subject to litigation, which may be extremely costly to defend, could result in substantial judgment or settlement costs and could subject us to other remedies.
From time to time, we have been, and may continue to be, involved in various legal proceedings, including, but not limited to, actions related to our lending and servicing practices as well as alleged violations of the local, state and federal laws to which our business is subject. See “Business—Legal and Regulatory Proceedings.” Claims may be expensive to defend and may divert management’s time away from our operations, regardless of whether they are meritorious or ultimately lead to a judgment against us. We cannot assure you that we will be able to successfully defend or resolve any current or future litigation matters, and the resolution of such matters may result in significant financial payments by, or penalties imposed upon, us, restrictions on our business and operations, or other remedies, in which case those litigation matters could have a material and adverse effect on our business, operating results, financial condition and prospects.
We rely on internal models to manage risk and to make business decisions. The failure of our internal models to produce reliable or accurate results could have a material and adverse effect on our business, operating results, financial condition and prospects.
We measure and monitor our risk exposures, evaluate risk profiles associated with loans and products, and manage our business using internally-generated models. For example, we use models to measure and monitor our exposures to interest rate, credit and other market risks. The information provided by these models is used in making business decisions relating to strategies, initiatives, transactions, pricing and products. Models are inherently imperfect predictors of actual results because they are based on historical data available to us and our assumptions about factors such as future mortgage loan demand, default rates, market trends and other factors. The failure of our internal models to produce reliable or accurate results could have a material and adverse effect on our business, operating results, financial condition and prospects.
The success and growth of our business will depend upon our ability to adapt to and implement technological changes.
The mortgage industry is continually undergoing rapid technological change with frequent introductions of new products and services. We seek to differentiate ourselves by the range of mortgage programs we offer and rely on our internally-developed technology to make our platform available to our loan officers, evaluate mortgage applicants and service loans. Our future success and growth depend, in part, upon our ability to develop new products and services that satisfy changing client demand and use technology to provide a desirable client experience and to create additional efficiencies in our operations. If we fail to predict demand and develop, commercially market and achieve acceptance of attractive products and services, our business and prospects could be adversely affected. In addition, the implementation of technological changes and upgrades to maintain current systems and integrate new ones may also cause service interruptions, transaction processing errors and system conversion delays, may cause us to fail to
37
Table of Contents
comply with applicable laws, and may cause us to incur additional expenses, which may be substantial. Failure to keep pace successfully with technological change affecting the mortgage industry and avoid interruptions, errors and delays could have material adverse effect on our business, financial condition or results of operations.
Our corporate culture has contributed to our success and if we are unable to maintain it, our business, financial condition and results of operations could be harmed.
We believe our corporate culture has been a critical component to the success of our business. As we develop the infrastructure of a public company and continue to grow, however, it may be difficult to maintain that culture, which could reduce our ability to innovate and operate effectively. Any failure to maintain the key aspects of our culture could result in decreased employee satisfaction and increased difficulty in recruiting and retaining employees and could compromise the quality of the service that we
provide to our clients, all of which are important to our success and to the effective execution of our business strategy. In the event that we are unable to maintain our corporate culture, our business, financial condition and results of operations could be harmed.
The current economic environment poses significant challenges and could adversely affect our business, financial condition and results of operations.
We are operating in a challenging and uncertain economic environment. The mortgage industry continues to be affected by uncertainty in the real estate market, the credit markets, and the global financial market generally. The uncertainty in economic conditions has subjected us and other financial services companies to increased regulatory scrutiny. In addition, deterioration in local economic conditions in our markets could result in losses beyond that provided for in our allowance for credit losses and result in increased mortgage delinquencies, problem assets and foreclosures. This may also result in declining demand for products and services, which could adversely affect our business, financial condition and results of operations.
Adverse events to our clients could occur, which can result in substantial losses that could adversely affect our financial condition.
A client’s ability or willingness to repay his or her mortgage may be adversely affected by numerous factors, including a loss of or change in employment or income, weak macro-economic conditions, increases in payment obligations to other lenders and deterioration in the value of the home that serves as collateral for the loan. Increases in delinquencies or defaults related to these and other factors may adversely affect our business, financial condition, liquidity and results of operations and may also cause decreased demand in the secondary market for loans originated through Guild. In addition, higher risk loans incur greater servicing costs because they require more frequent interaction with clients and closer monitoring and oversight. We may not be able to pass along these additional servicing costs associated with higher-risk loans to our clients and they could result in substantial losses that could adversely affect our financial condition.
Our business could be materially and adversely affected by a cybersecurity breach or other vulnerability involving our computer systems or those of certain of our third-party service providers.
Our systems and those of certain of our third-party service providers could be vulnerable to hardware and cybersecurity issues. Our operations depend upon our ability to protect our computer equipment against damage from fire, power loss, telecommunications failure or a similar catastrophic event. We could also experience a breach by intentional or negligent conduct on the part of employees or other sources. Any damage or failure that causes an interruption in our operations or those of our third-party service providers could have an adverse effect on our business, operating results, financial condition and prospects. In addition, our operations depend upon our ability to protect the computer systems and network infrastructure we use against damage from cybersecurity attacks by sophisticated third parties with
38
Table of Contents
substantial computing resources and capabilities and other disruptive problems caused by the internet or other users. These disruptions could jeopardize the security of information stored in and transmitted through our computer systems and network infrastructure, including personal or confidential information of our clients, employees and others, which may result in significant liability and damage our reputation.
It is difficult or impossible to defend against every risk being posed by changing technologies as well as criminals intent on committing cyber-crime and any measures we employ may not be successful in preventing, detecting or stopping attacks. The increasing sophistication and resources of cyber criminals and other non-state threat actors and increased actions by nation-state actors make keeping up with new threats difficult and could result in a breach of security. Controls employed by our information technology department and our third-party service providers, including cloud vendors, could prove inadequate. A breach of our security that results in unauthorized access to our data could expose us to a disruption or challenges relating to our daily operations, as well as to data loss, litigation, damages, fines and penalties, significant increases in compliance costs and reputational damage, any of which could have a material and adverse effect on our business, operating results, financial condition and prospects.
A number of the states, counties and cities in which we maintain branch offices have issued shelter-in-place and similar orders in response to the COVID-19 pandemic. As a result, a significant portion of our employees have been working remotely. This transition to a remote work environment may exacerbate certain risks to our business, including increasing the stress on, and our vulnerability to disruptions of, our technology infrastructure and computer systems, increased risk of phishing and other cybersecurity attacks, and increased risk of unauthorized dissemination of personal or confidential information.
To the extent we or our systems rely on third-party service providers, through either a connection to, or an integration with, those third-parties’ systems, the risk of cybersecurity attacks and loss, corruption or unauthorized publication of our information or the confidential information of our clients, employees and others may increase. Third-party risks may include ineffective security measures, data location uncertainty and the possibility of data storage in inappropriate jurisdictions where laws or security measures may be inadequate.
Any or all of the issues described above could adversely affect our ability to attract new clients and continue our relationship with existing clients and could subject us to governmental or third-party lawsuits, investigations, regulatory fines or other actions or liability, thereby harming our business, operating results, financial condition and prospects.
Potential changes in applicable technology and consumer outreach techniques could have a material and adverse effect on our business, operating results, financial condition and prospects.
Changes in technology and consumer outreach techniques continue to shape the mortgage origination and servicing landscape. In recent years, consumers’ behavior patterns, in particular their propensity to use online sources for research, product comparison and guidance, have changed and continue to change. Similarly, available technologies for reaching targeted groups of consumers also continues to evolve, as do laws and regulations relating to such technologies. We expect that we will incur costs in the future to adjust our systems to adapt to changing behaviors and technologies, as well as changing laws and regulations. In the future, technological innovations and changes in the way consumers engage with technology, and such laws and regulations, may materially and adversely affect our operating results, financial condition and prospects, if our business model and technological infrastructure do not evolve accordingly.
In addition, we derive a portion of our website traffic from consumers who search for mortgage lenders through internet search engines. An important factor in attracting consumers to our website is whether we are prominently displayed in response to certain internet searches. Search engines may revise their algorithms from time to time, which could cause our website to be listed less prominently in algorithmic search results and lead to decreased traffic to our website. We may also be listed less prominently as a
39
Table of Contents
result of other factors, such as new websites, changes we make to our website or technical issues with the search engine itself. If we are listed less prominently in, or removed altogether from, search result listings for any reason, the traffic to our websites would decline and we may not be able to replace this traffic. An attempt to replace this traffic may require us to increase our marketing expenditures, which would also increase our cost of client acquisition and harm our business, operating results, financial condition and prospects.
Operating and growing our business may require additional capital, and if capital is not available to us, our business, operating results, financial condition and prospects may suffer.
Operating and growing our business is expected to require further investments in our technology and operations. We may be presented with opportunities that we want to pursue, and unforeseen challenges may present themselves, any of which could cause us to require additional capital. If our cash needs exceed our expectations or we experience rapid growth, we could experience strain in our cash flow, which could adversely affect our operations in the event we were unable to obtain other sources of liquidity. If we seek to raise funds through equity or debt financing, those funds may prove to be unavailable, may only be available on terms that are not acceptable to us or may result in significant dilution to you or higher levels of leverage. If we are unable to obtain adequate financing or financing on terms satisfactory to us, when we require it, our ability to continue to pursue our business objectives and to respond to business opportunities, challenges or unforeseen circumstances could be significantly limited, and our business, operating results, financial condition and prospects could be materially and adversely affected.
We are subject to certain operational risks, including, but not limited to, employee or customer fraud, the obligation to repurchase sold loans in the event of a documentation error, and data processing system failures and errors.
Employee errors and employee and client misconduct could subject us to financial losses or regulatory sanctions and seriously harm our reputation. Misconduct by our employees could include, among other things, improper use of confidential information and fraud. It is not always possible to prevent employee errors and misconduct or documentation errors, and the precautions we take to prevent and detect this activity may not be effective in all cases. In addition, we rely heavily upon information supplied by third parties, including the information contained in credit applications, property appraisals, title information and valuation, employment and income documentation, in deciding which loans we will originate, as well as the terms of those loans. If any of the information upon which we rely is misrepresented, either fraudulently or inadvertently, and the misrepresentation is not detected prior to the mortgage being funded, the value of that mortgage may be significantly lower than expected, or we may fund a mortgage that we would not have funded or on terms we would not have extended. Whether a misrepresentation is made by the mortgage applicant or another third party, we generally bear the risk of loss associated with such misrepresentation. A loan subject to a material misrepresentation is typically unsellable or subject to repurchase if it is sold prior to detection of the misrepresentation. The sources of the misrepresentations are often difficult to identify, and it is often difficult to recover any of the monetary losses we may suffer. These risks could adversely affect our business, results of operation, financial condition and reputation.
We may be required to repurchase mortgage loans that we have sold, or indemnify purchasers of our mortgage loans, if these loans fail to meet certain criteria or characteristics or under other circumstances.
At the time a loan is sold to an investor, we make certain representations and warranties. If defects are subsequently discovered in these representations and warranties that cause a loan to no longer satisfy the applicable investor eligibility requirements, we may be required to repurchase that loan. We are also required to indemnify several of our investors for borrowers’ prepayments and defaults. In addition, with respect to delinquent Ginnie Mae mortgage loans that we service, we are required to repurchase such loans prior to foreclosing and liquidating the mortgaged properties securing such loans. For the six months ended June 30, 2020, Ginnie Mae accounted for 37.5% of the UPB of our servicing portfolio.
40
Table of Contents
As of June 30, 2020, we have recorded a reserve of $11.1 million for repurchase and indemnification obligations. Actual repurchase and indemnification obligations could materially exceed the reserves we have recorded in our financial statements. There can be no guarantee that future losses will not be in excess of the recorded liability.
We are required to make significant estimates and assumptions in the preparation of our financial statements. These estimates and assumptions may not be accurate and they, as well as the accounting principles generally accepted in the United States, are subject to change.
The preparation of our consolidated financial statements in conformity with GAAP requires our management to make significant estimates and assumptions that affect the reported amounts of our assets and liabilities and disclosures of contingent assets and liabilities at the date of the consolidated financial statements, and the reported amounts of income and expense during the reporting periods. Critical estimates are made by management in determining, among other things, estimates of fair value and allowance for credit losses. If our underlying estimates and assumptions prove to be incorrect or if events occur that require us to revise our previous estimates or assumptions, our business, operating results, financial condition and prospects may be materially and adversely affected.
In addition, changes in GAAP or in accounting interpretations or assumptions could impact our financial statements and our ability to timely prepare our financial statements. A change in these principles or interpretations could also have a significant effect on our reported financial results and could require us to alter our accounting systems in a manner that could increase our operating costs and affect the content of and our ability to timely prepare our financial statements. Our inability to timely prepare our financial statements in the future could materially and adversely affect our share price.
Seasonality may cause fluctuations in our financial results.
The mortgage origination industry can be seasonal. We typically experience an increase in our mortgage origination activity during the second and third quarters and reduced activity in the first and fourth quarters as homebuyers tend to purchase their homes during the spring and summer in order to move to a new home before the start of the school year. Accordingly, our loan origination revenues varies from quarter to quarter and comparisons of sequential quarters may not be meaningful.
If we fail to protect our brand and reputation, our ability to grow our business and increase the volume of mortgages we originate and service may be adversely affected.
Maintaining strong brand recognition and a reputation for trustworthiness and for delivering a superior client experience is important to our business. If we fail to protect our brand and deliver on these expectations, or if negative public opinion relating to Guild or other mortgage industry participants resulting from actual or alleged conduct in mortgage origination, servicing or other activities, government oversight or regulation, litigation or other matters should occur, these events could harm our reputation and damage our ability to attract and retain clients or maintain our referral network, which could adversely affect our business.
We could be forced to incur greater expense marketing our brand or maintaining our reputation in the future to preserve our position in the market and, even with such greater expense, we may not be successful in doing so. Many of our competitors have more resources than we do and can spend more advertising their brands and services. If we are unable to maintain or enhance consumer awareness of our brand cost-effectively and maintain our reputation, or otherwise experience negative publicity, our business, operating results, financial condition and prospects could be materially and adversely affected.
Employee litigation and unfavorable publicity could adversely affect our business.
Our employees may, from time to time, bring lawsuits against us regarding employment issues. Any such employee litigation could be attempted on a class or representative basis. This litigation can be
41
Table of Contents
expensive and time-consuming regardless of whether the claims against us are valid or whether we are ultimately determined to be liable, and could divert management’s attention from our business. We could also be adversely affected by negative publicity, litigation costs resulting from the defense of these claims and the diversion of time and resources from our operations.
Failure to comply with fair lending laws and regulations could lead to a wide variety of sanctions that could have a material adverse effect on our business, financial condition and results of operations.
Antidiscrimination statutes, such as the Fair Housing Act, the Equal Credit Opportunity Act (the “ECOA”) and other fair lending laws and regulations prohibit creditors from discriminating against loan applicants and borrowers based on certain characteristics, such as race, religion and national origin. The Department of Justice and other federal agencies, including the CFPB, are responsible for enforcing these laws and regulations and have taken the position that these laws apply not only to intentional discrimination, but also to neutral practices that have a “disparate impact” on a group that shares a characteristic that a creditor may not consider in making credit decisions protected classes (i.e., creditor, servicing or marketing practices that have a disproportionate negative effect on a protected class of individuals). To the extent that this “disparate impact” theory continues to apply, we will be faced with significant administrative burdens in attempting to comply, and potential liability for failures to comply. A successful regulatory challenge to our performance under these fair lending laws and regulations could result in a wide variety of sanctions, including damages and civil money penalties. Such sanctions could have a material adverse effect on our business, financial condition and results of operations.
We are subject to certain risks associated with adverse weather conditions and man-made or natural events.
Weather conditions and man-made or natural events such as tornadoes, hurricanes, earthquakes, fires, floods, drought, power losses, telecommunications failures, strikes, health pandemics and similar events can adversely impact properties that collateralize loans we own or service, as well as properties where we do business and our business operations generally. Any uninsured loss related to such events could result in the loss of cash flow from, and the asset value of, the affected properties, and could adversely affect us disproportionately from other participants in the mortgage industry due to the geographic characteristics of our business, which could have an adverse effect on our business, financial condition, liquidity and results of operations.
Exposure to additional income tax liabilities could affect our future profitability.
We are subject to income taxes in the United States and various state jurisdictions. Our effective tax rate and profitability could be subject to volatility or adversely affected by a number of factors, including:
| • | changes in applicable tax laws and regulations, or their interpretation and application, including the possibility of retroactive effect; |
| • | changes in accounting and tax standards or practice; |
| • | changes in the mix of earnings and losses in state jurisdictions with differing tax rates; |
| • | changes in the valuation of deferred tax assets and liabilities; and |
| • | our operating results before taxes. |
In addition, we may be subject to audits of our income, sales and other taxes by U.S. federal, state and local taxing authorities. Outcomes from these audits could have a material and adverse effect on our operating results, financial condition and prospects.
Changes in tax laws may adversely affect us, and the Internal Revenue Service (the “IRS”) or a court may disagree with our tax positions, which may result in adverse effects on our financial condition or the value of our common stock.
The Tax Cuts and Jobs Act (the “TCJA”), enacted on December 22, 2017, significantly affected U.S. tax law, including by changing how the U.S. imposes tax on certain types of income of corporations and by
42
Table of Contents
reducing the U.S. federal corporate income tax rate to 21%. It also imposed new limitations on a number of tax benefits, including deductions for business interest, use of net operating loss carryforwards, taxation of foreign income and the foreign tax credit, among others.
The CARES Act, enacted on March 27, 2020, in response to the COVID-19 pandemic, further amended the U.S. federal tax code, including in respect of certain changes that were made by the TCJA, generally on a temporary basis.
It is possible that future tax law changes will increase the rate of the corporate income tax significantly, impose new limitations on deductions, credits or other tax benefits, or make other changes that may adversely affect our business, cash flows or financial performance. In addition, the IRS has yet to issue guidance on a number of important issues regarding the changes made by the TCJA and the CARES Act. In the absence of such guidance, we will take positions with respect to a number of unsettled issues. It is possible that the IRS or a court will not agree with the positions taken by us, in which case additional taxes, tax penalties and interest may be imposed that could adversely affect our business, cash flows or financial performance.
If we are unable to adequately protect our intellectual property, our ability to compete could be harmed.
We do not currently have any trademarks, patents or trademark or patent applications pending to protect our intellectual property rights, but we have developed systems and processes relating to our mortgage products and services. We rely on a combination of trade secret laws and contractual agreements, as well as our internal system access security protocols, to establish, maintain and protect our intellectual property rights and technology. Despite efforts to protect our intellectual property, these laws, agreements and systems may not be sufficient to effectively prevent unauthorized disclosure or unauthorized use of our trade secrets or other confidential information or to prevent third parties from misappropriating our technology and offering similar or superior functionality. Monitoring and protecting our intellectual property rights can be challenging and costly, and we may not be effective in policing or prosecuting such unauthorized use or disclosure.
Furthermore, legal standards relating to the validity, enforceability and scope of protection of intellectual property rights are uncertain. Third parties also may take actions that diminish the value of our proprietary rights or our reputation or cause consumer confusion through the use of similar service names or domain names. Any of these results could harm our business, operating results, financial condition and prospects.
Although we enter into confidentiality and invention assignment agreements with our employees and enter into confidentiality agreements with third parties, including suppliers and other partners, we cannot guarantee that we have entered into agreements with each party that has or may have had access to our proprietary information, know-how and trade secrets. Moreover, it is possible that these agreements will be effective in controlling access to, distribution, use, misuse, misappropriation, reverse engineering or disclosure of our proprietary information, know-how and trade secrets. Further, these agreements may not prevent our competitors from independently developing technologies that are substantially equivalent or superior to our products and platform capabilities. These agreements may be breached, and we may not have adequate remedies for any such breach.
We may become subject to intellectual property disputes that are costly and may subject us to significant liability and increased costs of doing business.
Third parties may be able to successfully challenge, oppose, invalidate, render unenforceable, dilute, misappropriate or circumvent our intellectual property rights. Our success depends, in part, on our ability to develop and commercialize our products and services without infringing, misappropriating or otherwise violating the intellectual property rights of third parties. However, we may not be aware that our products or services are infringing, misappropriating or otherwise violating third-party intellectual property rights and such third parties may bring claims alleging such infringement, misappropriation or violation.
43
Table of Contents
Actions we may take to enforce our intellectual property rights may be expensive and divert management’s attention away from the ordinary operation of our business, and our inability to secure and protect our intellectual property rights could materially and adversely affect our brand and business, operating results, financial condition and prospects. Furthermore, enforcement actions, even if successful, may not result in an adequate remedy. In addition, many companies have the capability to dedicate greater resources to enforce their intellectual property rights and to defend claims that may be brought against them. If a third party is able to obtain an injunction preventing us from accessing such third-party intellectual property rights, or if we cannot license or develop alternative technology for any infringing aspect of our business, we could be forced to limit or stop sales of our products and platform capabilities or cease business activities related to that intellectual property.
Although we carry general liability insurance, our insurance may not cover potential claims of this type or may not be adequate to indemnify us for all liability that may be imposed. We cannot predict the outcome of lawsuits and cannot ensure that the results of any such actions will not have an adverse effect on our business, financial condition or results of operations. Claims could subject us to significant liability for damages and could result in our having to stop using technology found to be in violation of a third party’s rights. Further, we might be required to seek a license for third-party intellectual property, which may not be available on reasonable royalty or other terms. Alternatively, we could be required to develop alternative non-infringing technology, which could require significant effort and expense. If we cannot license or develop technology for any infringing aspect of our business, we could be forced to limit our services, which could affect our ability to compete effectively. Any of these events or results could harm our business, operating results, financial condition and prospects.
Risks Related to Regulatory Environment
Our mortgage loan origination and servicing activities are subject to a highly complex legal and regulatory framework, and non-compliance with or changes in laws and regulations governing our industry could harm our business, operating results, financial condition and prospects.
The mortgage industry is subject to a highly complex legal and regulatory framework. In addition to the licensing requirements for each of the jurisdictions in which we originate loans, we must comply with a number of federal, state and local consumer protection and other laws including, among others, the Truth in Lending Act, the Real Estate Settlement Procedures Act, the ECOA, the Fair Credit Reporting Act, the Fair Housing Act, the Telephone Consumer Protection Act (“TCPA”), the Gramm-Leach-Bliley Act, the Electronic Fund Transfer Act, the Servicemembers Civil Relief Act, Military Lending Act, the Homeowners Protection Act, the Home Mortgage Disclosure Act, the Secure and Fair Enforcement for Mortgage Licensing Act of 2008 (the “SAFE Act”), the Federal Trade Commission Act, the Dodd Frank Wall Street Reform and Consumer Protection Act of 2010 (“Dodd-Frank Act”), the CARES Act, federal, state and local laws designed to discourage predatory lending and servicing practices, prohibit unfair, deceptive, or abusive acts or practices, protect customer privacy, and regulate debt collection and consumer credit reporting, and state foreclosure laws. These and other laws and regulations directly affect our business and require constant compliance monitoring and internal and external audits and examinations by federal and state regulators. Changes to the laws, regulations and guidelines relating to the origination and servicing of mortgages, including those already adopted and those to be adopted in response to the COVID-19 pandemic, their interpretation or the manner in which they are enforced could render our current business practices non-compliant or make compliance more difficult or expensive.
It is possible that we are not, and will not in the future be, in full compliance with current and future laws and regulations, or interpretations of the foregoing. Our failure, or the failure of our loan officers, other employees, correspondent sellers or others with whom we have business relationships, to operate in compliance with any of the laws, regulations and guidelines relating to the origination and servicing of mortgages could result in, among other things, the loss of licenses and approvals required for us to engage in the business of originating and servicing mortgage loans, governmental investigations and enforcement actions, damage to our brand and reputation, civil and criminal liability and administrative penalties, which
44
Table of Contents
could have a material and adverse effect on our business, operating results, financial condition and prospects.
We are subject to state licensing and operational requirements. Our failure to obtain and maintain the appropriate state licenses would prohibit us from originating or servicing mortgages in those states and adversely affect our operations.
Because we are not a federally chartered depository institution, we do not benefit from exemptions to state mortgage lending, loan servicing or debt collection licensing and regulatory requirements. In most states in which we operate, a regulatory agency or agencies regulates and enforces laws relating to mortgage servicing companies and mortgage origination companies such as us. These rules and regulations generally require that we seek and maintain certain licenses and comply with certain business practice standards, including requirements as to the form and content of contracts and other documentation and the licensing of our employees. As a non-bank mortgage lender, we are subject to licensure, regulation and supervision by every state, district and territory in which we do business. States examine non-bank mortgage lenders and servicers periodically, depending on state law requirements and other factors such as the lender’s size and compliance history. These examinations may include a review of the non-bank lender’s compliance with all federal and state consumer protection laws, compliance management system and internal controls. Complying with this regulatory framework requires a meaningful dedication of management and financial resources. Changes to existing state legislation or the adoption of new state legislation, as well as our entry into new markets in states in which we had not previously operated, could increase our compliance costs. This could render business in any one state or states cost-prohibitive and could materially affect our business and our growth strategy. Any failure to comply with these licensing and operational requirements could have a material and adverse effect on our business, operating results, financial condition and prospects.
Changes in the guidelines of the GSEs, FHA, VA, USDA and Ginnie Mae could adversely affect our business.
We are required to follow specific guidelines and eligibility standards that impact the way we service and originate GSE and U.S. government agency loans, including guidelines and standards with respect to credit standards for mortgage loans, our staffing levels and other servicing practices and the servicing and ancillary fees that we may charge. In addition, we are required to meet certain minimum financial requirements relating to our net worth, capital ratio and liquidity in order to sell the loans that we originate to certain investors, including the GSEs. A change in these guidelines could require us to expend additional resources to originate and service mortgages or make it more difficult for us to do so profitably or at all and a failure to meet applicable financial requirements could materially impair our ability to originate and service loans, any of which could have a material and adverse effect on our business, operating results, financial condition and prospects.
In addition, changes in the nature or extent of the guarantees provided by Fannie Mae, Freddie Mac, Ginnie Mae, the USDA or the VA, or the insurance provided by the FHA, or coverage provided by private mortgage insurers, could also have broad adverse market implications. Any future increases in guarantee fees or changes to their structure or increases in the premiums we are required to pay to the FHA or private mortgage insurers for insurance or to the VA or the USDA for guarantees could increase mortgage origination costs and insurance premiums for our clients. These industry changes could result in reduced demand for our mortgage services and consequently our origination volume and reduced profitability for us, which could materially and adversely affect our business, operating results, financial condition and prospects.
45
Table of Contents
The CFPB continues to be active in its monitoring of the loan origination and servicing sectors, and its issuance of new rules and regulations and enforcement of existing rules and regulations could result in enforcement actions, fines and penalties.
As a non-depository lending and servicing institution, we are subject to the regulatory authority of the CFPB, including, without limitation, its authority to conduct investigations, bring enforcement actions, impose monetary penalties, require remediation of practices, pursue administrative proceedings or litigation, and obtain cease and desist orders for violations of applicable federal consumer financial laws. The CFPB has been active in investigations and enforcement actions and has issued civil money penalties to parties when the CFPB has determined that such parties have violated the laws and regulations it enforces. Our failure to comply with the federal consumer protection laws, rules and regulations to which we are subject, whether actual or alleged, could expose us to enforcement actions or potential litigation liabilities.
We may not be able to maintain compliance with all current and potentially applicable U.S. federal and state laws and regulations with respect to data privacy and cybersecurity, and related actions by regulatory authorities or changes in legislation and regulation in the jurisdictions in which we operate could have a material adverse effect on our business.
We are subject to a variety of laws and regulations with respect to data privacy and the collection, processing, storing, sharing, disclosing, using, transfer and protecting of personal information and other data. These laws and regulations constantly evolve and remain subject to significant change. Because we store, process and use data, including our clients’ personal information, we are subject to complex and evolving federal, state and local laws and regulations regarding privacy, data protection and other matters. The application and interpretation of these laws and regulations are often uncertain. Compliance with existing and emerging privacy and cybersecurity regulations could result in increased compliance costs and lead to changes in business practices and policies, and any failure to protect the confidentiality of client information could result in enforcement actions and penalties or other remedies, adversely affect our reputation and result in private litigation against us, any of which could materially and adversely affect our business, operating results, financial condition and prospects.
Our communications with potential and existing clients are subject to laws regulating telephone and email marketing practices.
We make telephone calls and send emails and text messages to potential and existing clients. The United States regulates marketing by telephone and email and the laws and regulations governing the use of emails and telephone calls for marketing purposes continue to evolve, and changes in technology, the marketplace or consumer preferences may lead to the adoption of additional laws or regulations or changes in interpretation of existing laws or regulations. New laws or regulations, or changes to the manner in which existing laws and regulations or interpreted or enforced, may further restrict our ability to contact potential and existing customers by phone and email and could render us unable to communicate with consumers in a cost-effective fashion. The TCPA prohibits companies from making telemarketing calls to numbers listed in the Federal Do-Not-Call Registry and imposes other obligations and limitations on making phone calls and sending text messages to consumers. The Controlling the Assault of Non-Solicited Pornography and Marketing Act regulates commercial email messages and specifies penalties for the transmission of commercial email messages that do not comply with certain requirements, such as providing an opt-out mechanism for stopping future emails from senders. We may be required to comply with these and similar laws, rules and regulations. Failure to comply with obligations and restrictions related to telephone, text message and email marketing could subject us to lawsuits, fines, statutory damages, consent decrees, injunctions, adverse publicity and other losses that could harm our business.
46
Table of Contents
Changes in government regulation of the internet and other aspects of our business, as well as a failure to comply with existing or future regulations and laws, could adversely affect our operations.
We are subject to regulations and laws specifically governing the internet and marketing over the internet. These laws and regulations, which continue to evolve, cover privacy and data protection, data security, anti-spam, pricing, content protection, copyrights, distribution, mobile and other communications, advertising practices, electronic contracts, consumer protections, internet neutrality, the provision of online payment services, unencumbered internet access to our services, the design and operation of websites and the characteristics and quality of offerings online. It is possible that these regulations and laws may be interpreted and applied differently across jurisdictions. In addition, it is not clear how existing laws and regulations governing issues such as property ownership, consumer protection, libel and personal privacy apply to the internet, as many of these laws were adopted prior to the advent of the internet and do not contemplate or address the unique issues they raise when applied to the internet. Any failure, or perceived failure, by us to comply with such regulations could result in damage to our reputation, a loss in business and proceedings or actions against us by governmental entities or others.
Future regulations, or changes in laws and regulations or their existing interpretations or applications, could also impose a significant burden by requiring us to change our business practices, raise compliance costs or other costs of doing business and materially adversely affect our business, financial condition and operating results. We cannot guarantee that we will be able to make the appropriate changes and modifications in a commercially reasonable manner, or at all.
Risks Related to Our Organization and Structure
We will be controlled by MCMI, and MCMI’s interests may conflict with our interests and the interests of our other stockholders.
After giving effect to the reorganization transactions and this offering, MCMI will hold all of our issued and outstanding Class B common stock and will control approximately 94.8% of the combined voting power of our outstanding common stock. As a result, MCMI will be able to control any action requiring the general approval of our stockholders, including the election of our Board of Directors, the adoption of amendments to our certificate of incorporation and bylaws and the approval of any merger or sale of substantially all of our assets. So long as MCMI continues to directly or indirectly own a significant amount of our equity, even if such amount is less than a majority of the combined voting power of our outstanding common stock, MCMI will continue to be able to substantially influence the outcome of votes on all matters requiring approval by the stockholders, including our ability to enter into certain corporate transactions. The interests of MCMI could conflict with or differ from our interests or the interests of our other stockholders. For example, the concentration of ownership held by MCMI could delay, defer or prevent a change of control of our Company or impede a merger, takeover or other business combination that may otherwise be attractive to us or our other stockholders.
We will be a “controlled company” within the meaning of the NYSE rules and, as a result, we will be permitted, and intend to elect, to rely on exemptions from certain corporate governance requirements that provide protection to stockholders of other companies.
After giving effect to the reorganization transactions and the closing of this offering, MCMI will continue to control a majority of the combined voting power of our outstanding common stock, and, as a result, we will be a controlled company under the applicable rules of the NYSE. As a controlled company, we will be permitted, and intend, to elect not to comply with certain corporate governance requirements of the NYSE, including the requirements that:
| • | a majority of our Board of Directors consist of independent directors; |
| • | we have a nominating and corporate governance committee that is composed entirely of independent directors; and |
| • | we have a compensation committee that is composed entirely of independent directors. |
47
Table of Contents
These requirements will not apply to us as long as we remain a controlled company. Accordingly, as an investor in our Class A common stock, you may not have the same protections afforded to stockholders of companies that are subject to all of the corporate governance requirements of the NYSE.
Our directors and executive officers have significant control over our business.
After giving effect to the reorganization transactions and the closing of this offering, our directors and executive officers will beneficially own, directly or indirectly, in the aggregate, approximately 32.6% of the outstanding shares of our Class A common stock and 100% of the outstanding shares of our Class B common stock (to the extent the Chairman of our Board of Directors may be deemed to beneficially own all of the shares of our Class B common stock beneficially owned by MCMI), representing an aggregate of approximately 96.5% of the combined voting power of our outstanding common stock. As a result, in addition to their day-to-day management roles, our executive officers and directors will be able to exercise significant influence on our business as stockholders, including influence over election of members of the Board of Directors and the authorization of other corporate actions requiring stockholder approval.
We are a holding company and depend upon distributions from Guild Mortgage Co. to meet our obligations.
We are a holding company with no material assets other than our ownership of equity interests in Guild Mortgage Co., which, following the completion of the reorganization transactions, will be our wholly owned subsidiary. See “Organizational Structure.” Our ability to pay dividends and to pay taxes and cover other expenses will depend on the financial results and cash flows of Guild Mortgage Co. As the sole member of Guild Mortgage Co., we intend to cause Guild Mortgage Co. to make distributions to us in amounts sufficient to meet our obligations. Certain laws and regulations, however, may result in restrictions on Guild Mortgage Co.’s ability to make distributions to us. To the extent that we need funds and Guild Mortgage Co. is restricted from making such distributions under applicable law or regulation or under the terms of any of its financing arrangements, we may not be able to obtain funds on terms acceptable to us or at all and as a result could suffer an adverse effect on our liquidity and financial condition.
Risks Related to Being a Public Company
We may incur significant additional costs and expenses, including costs and expenses associated with obligations relating to being a public company, which will require significant resources and management attention and may divert focus from our business operations, and we may generate losses in the future.
We incur significant expenses in developing our technology, marketing and providing the products and services we offer and acquiring clients, and our costs may increase due to our continued new product development and general administrative expenses, such as legal and accounting expenses related to becoming and being a public company. We have not been required in the past to comply with the requirements of the SEC, to file periodic reports with the SEC or to have our consolidated financial statements completed, reviewed or audited and filed within a specified time. As a public company following completion of this offering, we will be required to file periodic reports containing our consolidated financial statements with the SEC within a specified time following the completion of quarterly and annual periods. As a public company, we will incur significant legal, accounting, insurance and other expenses. Compliance with these reporting requirements and other rules of the SEC and the rules of the NYSE will increase our legal and financial compliance costs and make some activities more time-consuming and costly. Furthermore, the need to establish the corporate infrastructure demanded of a public company may divert management’s attention from implementing our growth strategy, which could prevent us from successfully implementing our strategic initiatives and improving our business, operating results, financial condition and prospects. If we fail to manage these additional costs or increase our revenue, we may incur losses in the future.
48
Table of Contents
Our quarterly operating results or other operating metrics may fluctuate significantly and may not meet expectations of research analysts, which could cause the trading price of our Class A common stock to decline.
Our quarterly operating results and other operating metrics have fluctuated in the past and may in the future fluctuate as a result of a number of factors, many of which are outside of our control and may be difficult to predict. Period-to-period variability or unpredictability of our results could result in our failure to meet our expectations or those of any analysts that cover us or investors with respect to revenue or other operating results for a particular period. If we fail to meet or exceed such expectations for these or any other reasons, the market price of our Class A common stock could decline significantly, and we could face litigation, including securities class action litigation.
If we fail to correct any material weakness that we identify in our internal control over financial reporting or otherwise fail to maintain effective internal control over financial reporting, we may not be able to report our financial results accurately and timely, in which case our business may be harmed, investors may lose confidence in the accuracy and completeness of our financial reports and the price of our Class A common stock may decline.
Our management is responsible for establishing and maintaining adequate internal control over financial reporting and for evaluating and reporting on our system of internal control. Our internal control over financial reporting is a process designed to provide reasonable assurance regarding the reliability of financial reporting and the preparation of financial statements for external purposes in accordance with GAAP. As a public company, we will be required to comply with the Sarbanes-Oxley Act and other rules that govern public companies. In particular, we will be required to certify our compliance with Section 404 of the Sarbanes-Oxley Act beginning with our second annual report on Form 10-K, which will require us to furnish annually a report by management on the effectiveness of our internal control over financial reporting. In addition, unless we remain an emerging growth company and elect transitional relief available to emerging growth companies, our independent registered public accounting firm will be required to report on the effectiveness of our internal control over financial reporting, beginning as of that second annual report.
If we identify material weaknesses in our internal control over financial reporting in the future, if we cannot comply with the requirements of the Sarbanes-Oxley Act in a timely manner or attest that our internal control over financial reporting is effective, or if our independent registered public accounting firm cannot express an opinion as to the effectiveness of our internal control over financial reporting when required, we may not be able to report our financial results accurately and timely. As a result, investors, counterparties and consumers may lose confidence in the accuracy and completeness of our financial reports. As a result, access to capital markets and perceptions of our creditworthiness could be adversely affected, and the market price of our Class A common stock could decline. In addition, we could become subject to investigations by the stock exchange on which our securities are listed, the SEC or other regulatory authorities, which could require additional financial and management resources. These events could have a material and adverse effect on our business, operating results, financial condition and prospects.
If we fail to implement and maintain effective disclosure controls and procedures, we may not be able to meet applicable reporting requirements, which could materially and adversely affect us.
Upon completion of this offering, we will become subject to the informational requirements of the Exchange Act and will be required to file reports and other information with the SEC. As a publicly-traded company, we will be required to maintain disclosure controls and procedures that are designed to ensure that information required to be disclosed in the reports that we file with, or submit to, the SEC is recorded, processed, summarized and reported, within the time periods specified in the SEC’s rules and forms. They include controls and procedures designed to ensure that information required to be disclosed in reports filed with, or submitted to, the SEC is accumulated and communicated to management, including our
49
Table of Contents
principal executive and principal financial officers, to allow timely decisions regarding required disclosure. Effective disclosure controls and procedures are necessary for us to provide reliable reports, effectively prevent and detect fraud, and to operate successfully as a public company. Designing and implementing effective disclosure controls and procedures is a continuous effort that requires significant resources and devotion of time. We may discover deficiencies in our disclosure controls and procedures that may be difficult or time consuming to remediate in a timely manner. Any failure to maintain effective disclosure controls and procedures or to timely effect any necessary improvements thereto could cause us to fail to meet our reporting obligations (which could affect the listing of our Class A common stock on the NYSE). Additionally, ineffective disclosure controls and procedures could also adversely affect our ability to prevent or detect fraud, harm our reputation and cause investors to lose confidence in our reports filed with, or submitted to, the SEC, which would likely have a negative effect on the trading price of our Class A common stock.
We are an “emerging growth company,” and the reduced disclosure requirements applicable to emerging growth companies may make our common stock less attractive to investors.
We are an “emerging growth company,” as defined in the JOBS Act. We could continue to be considered an emerging growth company for up to five years, although we would lose that status sooner if our gross revenues exceed $1.07 billion, if we issue more than $1.0 billion in nonconvertible debt in a three-year period or if the fair value of our common stock held by non-affiliates exceeds $700.0 million (and we have been a public company for at least 12 months and have filed one annual report on Form 10-K). For as long as we continue to be an emerging growth company, we intend to take advantage of an exemption from the provisions of Section 404(b) of the Sarbanes-Oxley Act requiring that our independent registered public accounting firm provide an attestation report on the effectiveness of our internal control over financial reporting. An attestation report by our auditor would require additional procedures by them that could detect problems with our internal control over financial reporting that are not detected by management. If our system of internal control over financial reporting is not determined to be appropriately designed or operating effectively, it could require us to restate financial statements, cause us to fail to meet reporting obligations and cause investors to lose confidence in our reported financial information, all of which could lead to a significant decline in the market price of our Class A common stock. In addition, we may take advantage of exemptions from various reporting requirements that are applicable to other public companies that are not emerging growth companies, including reduced disclosure obligations regarding executive compensation in our periodic reports and proxy statements and exemptions from the requirements of holding a nonbinding advisory vote on executive compensation and stockholder approval of any golden parachute payments not previously approved. It is unclear whether investors will find our Class A common stock less attractive because we may rely on these exemptions. If some investors find our Class A common stock less attractive as a result, there may be a less active trading market for our Class A common stock and our stock price may be more volatile.
In addition, the JOBS Act provides that an emerging growth company can take advantage of an extended transition period for complying with new or revised accounting standards. This allows an emerging growth company to delay the adoption of certain accounting standards until those standards would otherwise apply to private companies. We have elected to avail ourselves of this exemption from new or revised accounting standards and, therefore, while we are an emerging growth company, we will not be subject to new or revised accounting standards at the same time that they become applicable to other public companies that are not emerging growth companies. As a result, our financial statements may not be comparable to companies that comply with new or revised accounting pronouncements as of public company effective dates, and we will incur additional costs in connection with complying with the accounting standards applicable to public companies at such time or times as they become applicable to us.
50
Table of Contents
Risks Related to our Class A Common Stock and this Offering
An active trading market for our Class A common stock may not develop, and you may not be able to resell your shares of our Class A common stock at or above the initial offering price.
Prior to this offering, there has been no public market for our Class A common stock. We cannot predict the extent to which investor interest in us will lead to the development of a trading market on the NYSE or otherwise, or how liquid that market might become. If an active market does not develop, you may have difficulty selling any shares of our Class A common stock that you purchase in this offering. The initial public offering price for the shares of our Class A common stock has been determined by negotiations between us and the representatives of the underwriters, and may not be indicative of prices that will prevail in the open market following this offering. An inactive market may also impair our ability to raise capital by selling shares of our Class A common stock and may impair our ability to acquire or make investments in companies, products or technologies for which we may issue equity securities as consideration or for financing purposes.
Sales of a substantial number of shares of our common stock by our existing stockholders in the public market could cause the price of our Class A common stock to fall.
Sales of a substantial number of shares of our common stock in the public market, or the perception that these sales might occur, could significantly reduce the market price of our Class A common stock. If our existing stockholders sell, or indicate an intention to sell, substantial amounts of our common stock (including shares of our Class B common stock that would convert to Class A common stock in connection with such sales) in the public market after the lock-up and legal restrictions on resale discussed in this prospectus expire, the trading price of our Class A common stock could substantially decline. Furthermore, after the reorganization transactions and the completion of this offering, 100% of our outstanding Class B common stock will be held by MCMI, and approximately 32.6% of our outstanding Class A common stock will be beneficially owned by our executive officers and directors, and we will have entered into a registration rights agreement with these stockholders. If one or more of them were to sell a substantial portion of the shares they hold, it could cause our the price of our Class A common stock to decline.
Based on shares outstanding as of the date of this prospectus, on the closing of this offering, we will have outstanding a total of 21,174,758 shares of Class A common stock and 38,825,242 shares of Class B common stock. This includes the 8,500,000 shares of Class A common stock that are being sold in this offering, which may be resold in the public market immediately. The remaining 12,674,758 shares of our Class A common stock, which represent an aggregate of approximately 59.9 % of our outstanding shares of Class A common stock after this offering, are currently, and will be following the closing of this offering, restricted as a result of securities laws or lock-up agreements but will be able to be sold, subject to any applicable volume limitations, under federal securities laws with respect to affiliate sales. The selling stockholders and each of our directors and executive officers have entered into lock-up agreements with the underwriters under which the holders of such securities have agreed that, subject to certain exceptions, without the prior written consent of Wells Fargo Securities, LLC, BofA Securities, Inc. and J.P. Morgan Securities LLC, they will not (i) transfer or dispose of any shares of the common stock, preferred stock or other capital stock of the Company, or any securities convertible into or exercisable or exchangeable for common stock, preferred stock or other capital stock of the Company; (ii) enter into any other agreement or transaction that transfers to another any of the economic consequences of ownership of any common stock of the Company or any securities convertible into or exercisable or exchangeable for common stock of the Company; or (iii) file any registration statement under the Securities Act with the SEC with respect to the offering of common stock or other capital stock or any securities convertible into or exercisable or exchangeable for any common stock or other capital stock of the Company (other than any registration statement filed pursuant to Rule 462(b) under the Securities Act to register securities to be sold to the underwriters pursuant to the underwriting agreement), or publicly announce any intention to do any of the foregoing. Shares of our Class A common stock purchased by any of our directors or executive officers in this offering would also be subject to the foregoing restrictions on transfer, as well as restrictions on
51
Table of Contents
disposition imposed by applicable law. The foregoing restrictions will remain in effect for 180 days following the date of this prospectus. Upon the expiration of the foregoing restrictions, our securityholders subject to a lock-up agreement will be able to sell our shares in the public market. In addition, the underwriters may, in their sole discretion, release all or some portion of the shares subject to lockup agreements prior to the expiration of the foregoing restrictions. For a description of these lock-up agreements, see the “Shares Eligible for Future Sale” and “Underwriting” sections of this prospectus.
In addition, as of the date of this prospectus, there were 4,299,722 shares of Class A common stock (subject to adjustment for fractional shares) available for issuance pursuant to future awards under our equity incentive plans that will become eligible for sale in the public market to the extent permitted by the provisions of various vesting schedules, the lock-up agreements discussed above and Rules 144 and 701 under the Securities Act. Moreover, we intend to register all shares of Class A common stock that we may issue under our employee benefit plans. Once we register these shares, they can be freely sold in the public market upon issuance, subject to the lock-up agreements and the restrictions imposed on our affiliates under Rule 144.
The market price for our Class A common stock may be subject to substantial fluctuations, which may make it difficult for you to sell your shares at the volumes, prices and times desired.
The market price of our Class A common stock may be highly volatile, which may make it difficult for you to sell your shares at the volumes, prices and times desired. Some factors that may have a significant effect on the market price of our Class A common stock include:
| • | actual or anticipated fluctuations in our operating results or those of our competitors’; |
| • | actual or anticipated changes in the growth rate of mortgage originations and mortgage servicing income or the growth rate of our businesses or those of companies that investors deem comparable to us; |
| • | changes in economic or business conditions; |
| • | changes in governmental regulation; and |
| • | publication of research reports about us, our competitors, or our industry, or changes in, or failure to meet, estimates made by securities analysts or ratings agencies of our financial and operating performance, or lack of research reports by industry analysts or ceasing of analyst coverage. |
If securities or industry analysts do not publish research or publish inaccurate or unfavorable research about us or our business, the price of our Class A common stock and trading volume could decline.
The trading market for our Class A common stock will depend, in part, on the research and reports that securities or industry analysts publish about us or our business. We do not currently have and may never obtain research coverage by securities and industry analysts. If no securities or industry analysts commence coverage of the Company, the trading price for our Class A common stock would be negatively impacted. If we obtain securities or industry analyst coverage and if one or more of the analysts who cover us downgrades our Class A common stock or publishes inaccurate or unfavorable research about us or our business, our share price would likely decline. If one or more of these analysts cease coverage of us or fail to publish reports on us regularly, demand for our Class A common stock could decrease, which could cause our stock price and trading volume to decline. In addition, if our operating results fail to meet the expectations of securities analysts, our stock price would likely decline.
You will experience immediate and substantial dilution in the book value of the shares you purchase in this offering.
If you purchase shares of our Class A common stock in this offering, you will experience immediate and substantial dilution of $11.48 per share, representing the difference between the initial public offering
52
Table of Contents
price of $18.00 per share, which is the midpoint of the price range listed on the front cover of this prospectus, and our pro forma net tangible book value per share after giving effect to the reorganization transactions. See the “Dilution” section of this prospectus.
Our issuance of capital stock in connection with financings, acquisitions, investments, our equity incentive plans or otherwise would dilute all other stockholders.
We may issue capital stock in the future. Any such issuance would result in dilution to all other stockholders. In the future, we may issue stock, including as a grant of equity awards to employees, directors and consultants under our equity incentive plans, to raise capital through equity financings or to acquire or make investments in companies, products or technologies for which we may issue equity securities as consideration or for financing purposes. Any such issuances of capital stock in the future may cause stockholders to experience significant dilution of their ownership interests and the per share value of our Class A common stock to decline.
We do not intend to pay dividends in the foreseeable future.
We do not anticipate declaring or paying regular cash dividends on our Class A common stock in the foreseeable future. Instead, we anticipate that most or all of our future earnings will be retained to support our operations and finance the growth and development of our business. Any future determination to declare and pay cash dividends, if any, will be made at the discretion of our Board of Directors and will depend on a variety of factors, including applicable laws, our financial condition, results of operations, contractual restrictions, capital requirements, business prospects, general business or financial market conditions, and other factors our Board of Directors may deem relevant. Investors should not purchase our Class A common stock with the expectation of receiving cash dividends. See “Dividend Policy.”
Certain provisions in our certificate of incorporation and bylaws and of Delaware law may prevent or delay an acquisition of Guild, which could decrease the trading price of our Class A common stock.
Our certificate of incorporation and bylaws will contain, and Delaware law contains, provisions that are intended to deter coercive takeover practices and inadequate takeover bids by making such practices or bids unacceptably expensive to the bidder and to encourage prospective acquirers to negotiate with our Board of Directors rather than to attempt a hostile takeover. These provisions include, among others, those establishing:
| • | a dual class common stock structure, which provides MCMI with the ability to control the outcome of matters requiring stockholder approval, even if it beneficially owns significantly less than a majority of the shares of our outstanding common stock; |
| • | the division of our Board of Directors into three classes of directors, with each class serving a staggered three-year term, which could have the effect of making the replacement of incumbent directors more time-consuming and difficult; |
| • | the inability of our stockholders to call a special meeting; |
| • | the inability of our stockholders to act by written consent after the McCarthy Investors cease to beneficially own a majority of the combined voting power of our capital stock; |
| • | rules regarding how stockholders may present proposals or nominate directors for election at stockholder meetings; |
| • | the right of our Board of Directors to issue preferred stock without stockholder approval; |
53
Table of Contents
| • | the inability of stockholders to remove directors without cause after the McCarthy Investors cease to beneficially own a majority of the combined voting power of our capital stock; and |
| • | the ability of our directors, not our stockholders, to fill vacancies on the Board of Directors. |
In addition, because we will not elect to be exempt from Section 203 of the Delaware General Corporation Law (the “DGCL”), this provision could also delay or prevent a change of control that you may favor. Section 203 of the DGCL provides that, subject to limited exceptions, a person that acquires, or is affiliated with a person that acquires, more than 15% of the outstanding voting stock of a Delaware corporation (an “interested stockholder”) must not engage in any business combination with that corporation, including by merger, consolidation or acquisitions of additional shares, for a three-year period following the date on which the person became an interested stockholder, unless (i) prior to such time, the board of directors of such corporation approved either the business combination or the transaction that resulted in the stockholder becoming an interested stockholder; (ii) upon consummation of the transaction that resulted in the stockholder becoming an interested stockholder, the interested stockholder owned at least 85% of the voting stock of such corporation at the time the transaction commenced (excluding for purposes of determining the voting stock outstanding (but not the outstanding voting stock owned by the interested stockholder) the voting stock owned by directors who are also officers or held in employee benefit plans in which the employees do not have a confidential right to tender or vote stock held by the plan); or (iii) on or subsequent to such time the business combination is approved by the board of directors of such corporation and authorized at a meeting of stockholders by the affirmative vote of at least two-thirds of the outstanding voting stock of such corporation not owned by the interested stockholder.
We believe these provisions will protect our stockholders from coercive or otherwise unfair takeover tactics by requiring potential acquirers to negotiate with our Board of Directors and by providing our Board of Directors with more time to assess any acquisition proposal. These provisions are not intended to make Guild immune from takeovers. However, these provisions will apply even if the offer may be considered beneficial by some stockholders and could delay or prevent an acquisition that our Board of Directors determines is not in the best interests of Guild and its stockholders. These provisions may also prevent or discourage attempts to remove and replace incumbent directors.
Our Board of Directors will have the ability to issue blank check preferred stock, which may discourage or impede acquisition attempts or other transactions.
Our Board of Directors will have the power, subject to applicable law, to issue series of preferred stock that could, depending on the terms of the series, impede the completion of a merger, tender offer or other takeover attempt. For instance, subject to applicable law, a series of preferred stock may impede a business combination by including class voting rights, which would enable the holder or holders of such series to block a proposed transaction. Our Board of Directors will make any determination to issue shares of preferred stock based on its judgment as to our and our stockholders’ best interests. Our Board of Directors, in so acting, could issue shares of preferred stock having terms which could discourage an acquisition attempt or other transaction that some, or a majority, of the stockholders may believe to be in their best interests or in which stockholders would have received a premium for their stock over the then-prevailing market price of the stock.
Our certificate of incorporation will contain an exclusive forum provision that may discourage lawsuits against us and our directors and officers.
Our certificate of incorporation will provide that, unless the Board of Directors otherwise determines, the state courts in the State of Delaware or, if no state court located within the State of Delaware has jurisdiction, the federal court for the District of Delaware, will be the sole and exclusive forum for any derivative action or proceeding brought on behalf of Guild, any action asserting a claim of breach of a fiduciary duty owed by any director or officer of Guild to Guild or Guild’s stockholders, any action asserting a claim against Guild or any director or officer of Guild arising pursuant to any provision of the DGCL or
54
Table of Contents
Guild’s certificate of incorporation or bylaws, or any action asserting a claim against Guild or any director or officer of Guild governed by the internal affairs doctrine under Delaware law (collectively, the “covered actions”). This exclusive forum provision will apply to all covered actions, including any covered action in which the plaintiff chooses to assert a claim or claims under federal law in addition to a claim or claims under Delaware law, although stockholders will not be deemed to have waived our compliance with the federal securities laws and the rules and regulations thereunder. This exclusive forum provision does not apply to actions that do not assert any covered Delaware state law claims, such as, for example, any action asserting solely federal securities law claims, and the enforceability of similar choice of forum provisions in other companies’ organizational documents has been challenged in legal proceedings and it is possible that, in connection with claims arising under federal securities laws or otherwise, a court could find this exclusive forum provision to be inapplicable or unenforceable.
This exclusive forum provision may limit the ability of Guild’s stockholders to bring a claim in a judicial forum that such stockholders find favorable for disputes with Guild or Guild’s directors or officers, which may discourage such lawsuits against Guild and Guild’s directors and officers. Alternatively, if a court were to find this exclusive forum provision inapplicable to, or unenforceable in respect of, one or more of the specified types of actions or proceedings described above, Guild may incur additional costs associated with resolving such matters in other jurisdictions or forums, which could materially and adversely affect Guild’s business, financial condition or results of operations.
The dual class structure of our common stock may adversely affect the trading market for our Class A common stock.
We cannot predict the potential effects our dual class structure may have on our Class A common stock, such as a lower or more volatile market price. In 2017, S&P Dow Jones and FTSE Russell announced that they would begin excluding most newly public companies with multiple classes of shares of common stock from being added to certain indices, including the Russell 2000, the S&P 500, the S&P MidCap 400 and the S&P SmallCap 600. As a result, our dual class capital structure would make us ineligible for inclusion in any of these indices, and mutual funds, exchange-traded funds and other investment vehicles that attempt to passively track these indices likely will not invest in our stock. Furthermore, we cannot assure you that other stock indices will not take a similar approach to S&P Dow Jones or FTSE Russell in the future. It is unclear what effect, if any, these policies will have on the valuations of publicly traded companies excluded from these indices. Given the sustained flow of investment funds into passive strategies that seek to track certain indices, however, it is possible that exclusion from such indices could make our Class A common stock less attractive to investors. As a result, the market price of our Class A common stock could be adversely affected.
55
Table of Contents
CAUTIONARY NOTE REGARDING FORWARD-LOOKING STATEMENTS
This prospectus contains forward-looking statements. These forward-looking statements reflect our current views with respect to, among other things, future events and our financial performance. These statements are often, but not always, made through the use of words or phrases such as “may,” “should,” “could,” “predict,” “potential,” “believe,” “will likely result,” “expect,” “continue,” “will,” “anticipate,” “seek,” “estimate,” “intend,” “plan,” “projection,” “would” and “outlook,” or the negative version of those words or other comparable words or phrases of a future or forward-looking nature. These forward-looking statements are not historical facts and are based on current expectations, estimates and projections about our industry, management’s beliefs and certain assumptions made by management, many of which, by their nature, are inherently uncertain and beyond our control. Accordingly, we caution you that any such forward-looking statements are not guarantees of future performance and are subject to risks, assumptions and uncertainties that are difficult to predict. Although we believe that the expectations reflected in these forward-looking statements are reasonable as of the date made, actual results may prove to be materially different from the results expressed or implied by the forward-looking statements.
There are or will be important factors that could cause our actual results to differ materially from those indicated in these forward-looking statements, including, but not limited to, the following:
| • | any changes in macro-economic conditions and in U.S. residential real estate market conditions, including changes in prevailing interest rates or monetary policies and the effects of the ongoing COVID-19 pandemic; |
| • | any disruptions in the secondary home loan market and their effects on our ability to sell the loans that we originate; |
| • | any changes in certain U.S. government-sponsored entities and government agencies, including Fannie Mae, Freddie Mac, Ginnie Mae, the FHA, the USDA and the VA, or their current roles; |
| • | the effects of any termination of our servicing rights; |
| • | the effects of our existing and future indebtedness on our liquidity and our ability to operate our business; |
| • | any failure to maintain and improve the technological infrastructure that supports our origination and servicing platform; |
| • | any failure to maintain or grow our historical referral relationships with our referral partners; |
| • | any failure to continue the historical levels of growth in our market share in the mortgage origination and servicing industry; |
| • | any decline in our ability to recapture loans from borrowers who refinance; |
| • | our inability to attract, integrate and retain qualified personnel; |
| • | our failure to identify, develop and integrate acquisitions of other companies or technologies, or any diversion of our management’s attention due to the foregoing; |
| • | inaccuracies in the estimates of the fair value of the substantial portion of our assets that are measured on that basis (including our MSRs); |
| • | the failure of the internal models that we use to manage risk and make business decisions to produce reliable or accurate results; |
| • | the costs of potential litigation and claims; |
| • | the degree of business and financial risk associated with certain of our loans; |
| • | any cybersecurity breaches or other attacks involving our computer systems or those of our third-party service providers; |
56
Table of Contents
| • | any changes in applicable technology and consumer outreach techniques; |
| • | our inability to secure additional capital, if needed, to operate and grow our business; |
| • | the impact of operational risks, including employee or consumer fraud, the obligation to repurchase sold loans in the event of a documentation error, and data processing system failures and errors; |
| • | any repurchase or indemnficiation obligations caused by the failure of the loans that we originate to meet certain criteria or characteristics; |
| • | the seasonality of the mortgage origination industry; |
| • | any failure to protect our brand and reputation; |
| • | the risks associated with adverse weather conditions and man-made or natural events; |
| • | our exposure to additional income tax liabilities and changes in tax laws, or disagreements with the IRS regarding our tax positions; |
| • | any failure to adequately protect our intellectual property and the costs of any potential intellectual property disputes; |
| • | any non-compliance with the complex laws and regulations governing our industry and the related costs associated with maintaining and monitoring compliance; |
| • | any changes in the laws and regulations governing our industry that would require us to change our business practices, raise compliance costs or other costs of doing business; |
| • | our control by, and any conflicts of interest with, MCMI; |
| • | the significant influence on our business that members of our board and management team will be able to exercise as stockholders; |
| • | our dependence, as a holding company, upon distributions from Guild Mortgage Co. to meet our obligations; |
| • | the risks related to our becoming a public company; |
| • | the risks related to our status as an “emerging growth company” and a “controlled company”; |
| • | the risks related to our Class A common stock, our dual class common stock structure and this offering; and |
| • | the other risks, uncertainties and factors set forth in this prospectus, including those set forth under “Risk Factors.” |
The foregoing factors should not be construed as exhaustive and should be read together with the other cautionary statements included in this prospectus. If one or more events related to these or other risks or uncertainties materialize, or if our underlying assumptions prove to be incorrect, actual results may differ materially from what we anticipate. Many of the important factors that will determine these results are beyond our ability to control or predict. Accordingly, you should not place undue reliance on any such forward-looking statements. Any forward-looking statement speaks only as of the date on which it is made, and, except as otherwise required by law, we do not undertake any obligation to publicly update or review any forward-looking statement, whether as a result of new information, future developments or otherwise. New factors emerge from time to time, and it is not possible for us to predict which will arise. In addition, we cannot assess the impact of each factor on our business or the extent to which any factor, or combination of factors, may cause actual results to differ materially from those contained in any forward-looking statements.
57
Table of Contents
The Reorganization Transactions
Prior to the completion of this offering, we will consummate an internal reorganization, which we refer to as the “reorganization transactions.” Prior to the commencement of the reorganization transactions, all of Guild Mortgage Co.’s outstanding equity interests were owned by MCMI and certain other stockholders through their interests in Guild Investors, LLC. In connection with the reorganization transactions, the following steps have occurred or will occur:
| • | the Issuer was incorporated in Delaware as a wholly owned subsidiary of Guild Investors, LLC on August 11, 2020; |
| • | in October 2020, Guild Mortgage Co. declared and paid cash dividends to Guild Investors, LLC in an aggregate amount of approximately $27.2 million; |
| • | Guild Investors, LLC will contribute 100% of the shares of Guild Mortgage Co. to the Issuer, making Guild Mortgage Co. a wholly owned subsidiary of the Issuer, and Guild Mortgage Co. will then be converted into a limited liability company; |
| • | the Issuer will amend and restate its certificate of incorporation to, among other things: (1) authorize the issuance of two classes of common stock: Class A common stock and Class B common stock and (2) effect a reclassification and stock split of its 100 existing shares of common stock into 14,766,709 shares of Class A common stock and 45,233,291 shares of Class B common stock; and |
| • | Guild Investors, LLC will be dissolved and its members will receive a pro rata liquidating distribution of shares of the Issuer’s common stock (with MCMI receiving shares of the Issuer’s Class B common stock and all other members receiving shares of the Issuer’s Class A common stock). |
The reorganization transactions are intended, among other things, to provide for the Issuer in this offering to be a Delaware corporation and to simplify the organizational structure for Guild Mortgage Co.’s equityholders prior to this offering.
58
Table of Contents
The following diagram depicts our organizational structure following the reorganization transactions and this offering.
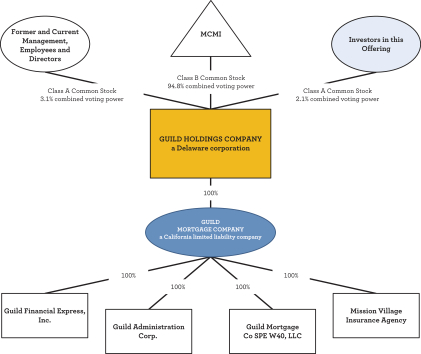
| * | This chart is provided for illustrative purposes only and does not purport to represent all legal entities within our organizational structure. |
Upon completion of the transactions described above and this offering:
| • | the Issuer will consolidate the financial results of Guild Mortgage Co. and its subsidiaries and all of our business operations will continue to be conducted through Guild Mortgage Co. and its consolidated subsidiaries; |
| • | the Issuer will be a Delaware corporation and its authorized capital stock will consist of 250,000,000 shares of Class A common stock, par value $0.01 per share, 100,000,000 shares of Class B common stock, par value $0.01 per share, and 50,000,000 shares of preferred stock, par value $0.01 per share; |
| • | MCMI will hold all of the outstanding shares of the Issuer’s Class B common stock, representing approximately 94.8% of the combined voting power of the Issuer’s outstanding capital stock (or 94.5%, if the underwriters exercise in full their option to purchase an additional 1,275,000 shares of Class A common stock from the selling stockholders); and |
| • | investors purchasing shares of our Class A common stock in this offering will collectively hold 8,500,000 shares of the Issuer’s Class A common stock, representing an aggregate of 2.1% of the combined voting power of the Issuer’s outstanding common stock (or 9,775,000 shares and 2.4%, if the underwriters exercise in full their option to purchase an additional 1,275,000 shares of Class A common stock from the selling stockholders). |
The reorganization transactions, including the conversion of Guild Mortgage Co. from a corporation to a limited liability company, are not expected to result in any material U.S. federal income tax consequences to the Issuer and its subsidiaries under current law.
59
Table of Contents
We will not receive any proceeds from the sale of shares of our Class A common stock by the selling stockholders in this offering (including any proceeds from the sale of shares of our Class A common stock that such selling stockholders may sell pursuant to the underwriters’ option to purchase additional shares of our Class A common stock). The selling stockholders will receive all of the proceeds from the sale of shares of our Class A common stock in this offering.
60
Table of Contents
We do not anticipate declaring or paying any regular cash dividends on our Class A common stock in the foreseeable future. Instead, we anticipate that most or all of our future earnings will be retained to support our operations and finance the growth and development of our business. Any future determination to declare and pay cash dividends, if any, will be made at the discretion of our Board of Directors and will depend on a variety of factors, including applicable laws, our financial condition, results of operations, contractual restrictions, capital requirements, business prospects, general business or financial market conditions, and other factors our Board of Directors may deem relevant. As a Delaware corporation, we will be subject to certain restrictions on dividends under DGCL. Generally, a Delaware corporation may only pay dividends either out of “surplus” or out of the current or the immediately preceding year’s net profits. Surplus is defined as the excess, if any, at any given time, of the total assets of a corporation over its total liabilities and statutory capital. The value of a corporation’s assets can be measured in a number of ways and may not necessarily equal their book value.
Investors should not purchase our Class A common stock with the expectation of receiving cash dividends.
61
Table of Contents
The following table sets forth our cash, cash equivalents and restricted cash and our capitalization as of June 30, 2020, on:
| • | an actual basis; and |
| • | a pro forma basis to give effect to the reorganization transactions described under “Organizational Structure” and this offering. |
The selling stockholders are selling all of the shares of our Class A common stock to be sold in this offering. We will not receive any of the proceeds from the sale of shares of our Class A common stock by the selling stockholders in this offering, including any proceeds from the sale of shares of our Class A common stock that such selling stockholders may sell pursuant to the underwriters’ option to purchase additional shares of our Class A common stock.
You should read the following table in conjunction with the financial statements and related notes included elsewhere in this prospectus and the sections of the prospectus titled “Selected Historical Consolidated Financial and Operating Data,” “Management’s Discussion and Analysis of Financial Condition and Results of Operations” and “Description of Capital Stock.”
| As of June 30, 2020 | ||||||||
| Actual | Pro Forma | |||||||
| (in thousands) | ||||||||
| Cash, Cash Equivalents and Restricted Cash |
$ | 148,462 | $ | 121,296 | ||||
|
|
|
|
|
|||||
| Debt |
$ | 1,883,455 | $ | 1,883,455 | ||||
| Stockholder’s Equity |
||||||||
| Common stock, par value $100 per share; 2,000 shares authorized; 928 shares issued and outstanding, actual; no shares issued and outstanding, pro forma |
$ | 93 | — | |||||
| Class A common stock, par value $0.01 per share; no shares authorized, issued and outstanding, actual; 250,000,000 shares authorized, 21,174,758 shares issued and outstanding, pro forma |
— | $ | 212 | |||||
| Class B common stock, par value $0.01 per share; no shares authorized, issued and outstanding, actual; 100,000,000 shares authorized, 38,825,242 shares issued and outstanding, pro forma |
— | $ | 388 | |||||
| Additional paid-in capital |
$ | 21,992 | $ | 21,992 | ||||
| Retained earnings |
$ | 484,727 | $ | 431,400 | ||||
|
|
|
|
|
|||||
| Total Stockholder’s Equity |
$ | 506,812 | $ | 453,992 | ||||
|
|
|
|
|
|||||
| Total Capitalization |
$ | 2,390,267 | $ | 2,337,447 | ||||
|
|
|
|
|
|||||
In connection with the reorganization transactions and upon completion of this offering, the amount of deferred compensation on Guild Mortgage Co.’s balance sheet (approximately $61.9 million as of June 30, 2020) will be adjusted to reflect the valuation of the Issuer based on the price established by the underwriters for the sale by the selling stockholders of shares of our Class A common stock in this offering. The amount of this obligation, assuming an initial public offering price of $18.00 per share (the midpoint of the estimated price range set forth on the front cover of this prospectus), would have been $93.1 million as of June 30, 2020 on a pro forma basis after giving effect to the reorganization transactions and this offering.
In addition, in connection with the reorganization transactions and upon completion of this offering, the amount of accrued compensation and benefits on Guild Mortgage Co.’s balance sheet (approximately $65.3 million as of June 30, 2020) will be adjusted to reflect the valuation of certain stock appreciation rights of Guild Mortgage Co. based on the price established by the underwriters for the sale by the selling stockholders of shares of our Class A common stock in this offering. Such rights will be terminated in connection with this offering and the holders will have the right to receive a payment in cash equal to the intrinsic value of such terminated rights, with such payment to be made on or about the first anniversary of this offering subject to continued employment (or upon an earlier qualifying termination of employment).
62
Table of Contents
The amount of this obligation, assuming an initial public offering price of $18.00 per share (the midpoint of the estimated price range set forth on the front cover of this prospectus) would have been $68.5 million as of June 30, 2020 on a pro forma basis after giving effect to the reorganization transactions and this offering.
63
Table of Contents
If you invest in shares of our Class A common stock in this offering, your ownership interest will be immediately diluted to the extent of the difference between the initial public offering price per share of our Class A common stock and the net tangible book value per share of our common stock.
Our pro forma net tangible book value as of June 30, 2020 would have been approximately $391.2 million, or $6.52 per share of our common stock, representing the amount of total tangible assets less our total liabilities (in the case of pro forma net tangible book value), divided by the total number of shares of common stock outstanding (in the case of pro forma net tangible book value per share), in each case, after giving effect to the reorganization transactions.
We will not receive any proceeds from the sale of the shares of our Class A common stock offered by the selling stockholders in this offering. Consequently, this offering will not result in any change to our pro forma net tangible book value per share, prior to giving effect to the payment of estimated fees and expenses in connection with this offering. Purchasing shares of our Class A common stock in this offering will result in pro-forma net tangible book value dilution to the investors purchasing in this offering of $11.48 per share. Dilution per share to investors purchasing in this offering is determined by subtracting the pro forma net tangible book value per share from the initial public offering price per share of our Class A common stock paid by investors purchasing in this offering. The following table illustrates this dilution on a per share basis:
| Assumed initial public offering price per share(1) |
$ | 18.00 | ||
| Pro forma net tangible book value per share as of June 30, 2020(2) |
$ | 6.52 | ||
|
|
|
|||
| Dilution per share to investors purchasing shares of our Class A common stock in this offering |
$ | 11.48 | ||
|
|
|
| (1) | Represents the midpoint of the estimated price range set forth on the front cover of this prospectus. |
| (2) | Reflects 60,000,000 outstanding shares of common stock on a pro forma basis after giving effect to the reorganization transactions, consisting of (i) 21,174,758 shares of our Class A common stock and (ii) 38,825,242 shares of our Class B common stock. |
The dilution information discussed above is illustrative only and will change based on the actual initial public offering price.
The following table summarizes, as of June 30, 2020, on the pro forma basis described above, the total number of shares of common stock owned by existing stockholders and to be owned by investors purchasing in this offering, the total consideration paid and the average price per share paid or to be paid by existing stockholders holding shares of Class A common stock and shares of Class B common stock and investors purchasing shares of Class A common stock in this offering at an assumed initial public offering price of $18.00 per share, which is the midpoint of the estimated price range set forth on the front cover of this prospectus, before deducting estimated underwriting discounts and commissions and estimated offering expenses.
| Shares of Common Stock Purchased |
Total Consideration | Average Price |
||||||||||||||||||
| Number | Percent | Amount | Percent | Per Share | ||||||||||||||||
| Existing stockholders(1) |
51,500,000 | 85.8 | % | $ | 506,812,000 | 76.8 | % | $ | 9.84 | |||||||||||
| Investors in this offering |
8,500,000 | 14.2 | 153,000,000 | 23.2 | 18.00 | |||||||||||||||
|
|
|
|
|
|
|
|
|
|
|
|||||||||||
| Total |
60,000,000 | 100.0 | % | $ | 659,812,000 | 100.0 | % | $ | 11.00 | |||||||||||
|
|
|
|
|
|
|
|
|
|
|
|||||||||||
| (1) | The total consideration provided by the existing stockholders is equal to the equity of Guild Mortgage Co. as of June 30, 2020. |
64
Table of Contents
The table above assumes no exercise of the underwriters’ option to purchase additional shares of our Class A common stock. If the underwriters exercise in full their option to purchase additional shares of our Class A common stock, the percentage of shares of our common stock held by existing stockholders would be decreased to 83.7% of the total number of shares of our common stock outstanding after this offering, and the number of shares of common stock held by investors purchasing in this offering would be increased to 16.3% of the total number of shares of our common stock outstanding after this offering.
In addition, following the completion of this offering, we may choose to raise capital due to market conditions or strategic considerations even if we believe we have sufficient funds for our current or future operating plans. To the extent that capital is raised through the sale of equity or convertible debt securities, the issuance of such securities could result in further dilution to our stockholders.
65
Table of Contents
SELECTED HISTORICAL CONSOLIDATED FINANCIAL AND OPERATING DATA
The following tables present selected historical consolidated financial and operating data of Guild Mortgage Co. as of the dates and for the periods indicated. The selected consolidated statements of operations data presented below for the years ended December 31, 2019 and December 31, 2018 and the selected consolidated balance sheet data as of December 31, 2019 and December 31, 2018 have been derived from Guild Mortgage Co.’s audited consolidated financial statements included elsewhere in this prospectus. The selected consolidated statements of operations data presented below for the six-month periods ended June 30, 2020 and June 30, 2019 and the selected consolidated balance sheet data as of June 30, 2020 have been derived from Guild Mortgage Co.’s unaudited condensed consolidated financial statements included elsewhere in this prospectus. This prospectus does not include financial statements of the Issuer because it has only been formed for the purpose of effecting the reorganization transactions and, until the consummation of the reorganization transactions, will hold no material assets and will not engage in any operations. See “Organizational Structure.”
The selected consolidated historical financial and operating data are not necessarily indicative of the results to be expected in any future period. You should read the following selected historical financial and operating data in conjunction with the section of this prospectus entitled “Management’s Discussion and Analysis of Financial Condition and Results of Operations” and Guild Mortgage Co.’s audited and unaudited consolidated financial statements and related notes included elsewhere in this prospectus. The selected historical financial and operating data in this section are not intended to replace, and are qualified in their entirety by, Guild Mortgage Co.’s audited and unaudited financial statements and related notes included elsewhere in this prospectus.
| Six Months Ended June 30, |
Year Ended December 31, |
|||||||||||||||
| 2020 | 2019 | 2019 | 2018 | |||||||||||||
| Statements of Income (Loss) Data |
||||||||||||||||
| (in thousands) | ||||||||||||||||
| Revenue |
||||||||||||||||
| Loan origination fees and gain on sale of loans, net |
$ | 733,293 | $ | 327,503 | $ | 820,814 | $ | 616,608 | ||||||||
| Loan servicing and other fees |
76,310 | 68,437 | 142,705 | 123,681 | ||||||||||||
| Valuation adjustment of mortgage servicing rights |
(204,810 | ) | (160,222 | ) | (255,219 | ) | (17,050 | ) | ||||||||
| Interest income (expense), net |
(492 | ) | 2,194 | 3,396 | (326 | ) | ||||||||||
| Other income (expense) |
(4 | ) | 1,181 | 1,193 | 6 | |||||||||||
|
|
|
|
|
|
|
|
|
|||||||||
| Net revenue |
604,297 | 239,093 | 712,889 | 722,919 | ||||||||||||
|
|
|
|
|
|
|
|
|
|||||||||
| Expense |
||||||||||||||||
| Salaries, commissions and benefits |
376,898 | 241,316 | 578,170 | 510,253 | ||||||||||||
| General and administrative |
48,192 | 28,624 | 63,983 | 50,976 | ||||||||||||
| Occupancy, equipment and communication |
26,955 | 26,942 | 53,678 | 52,483 | ||||||||||||
| Depreciation and amortization |
3,146 | 3,824 | 7,333 | 7,180 | ||||||||||||
| Provision for foreclosure losses |
1,860 | 774 | 3,895 | 4,434 | ||||||||||||
|
|
|
|
|
|
|
|
|
|||||||||
| Total expenses |
457,051 | 301,480 | 707,059 | 625,326 | ||||||||||||
|
|
|
|
|
|
|
|
|
|||||||||
| Income (loss) before income tax (benefit) expense |
147,246 | (62,387 | ) | 5,830 | 97,593 | |||||||||||
| Income tax (benefit) expense |
36,465 | (15,389 | ) | 253 | 24,260 | |||||||||||
|
|
|
|
|
|
|
|
|
|||||||||
| Net income (loss) |
$ | 110,781 | $ | (46,998 | ) | $ | 5,577 | $ | 73,333 | |||||||
|
|
|
|
|
|
|
|
|
|||||||||
66
Table of Contents
| As of June 30, | As of December 31, | |||||||||||
| 2020 | 2019 | 2018 | ||||||||||
| Balance Sheet Data |
||||||||||||
| (in thousands) |
||||||||||||
| Assets |
||||||||||||
| Cash, cash equivalents and restricted cash |
$ | 148,462 | $ | 106,735 | $ | 62,755 | ||||||
| Mortgage loans held for sale |
1,982,521 | 1,504,842 | 966,171 | |||||||||
| Derivative assets |
141,629 | 19,922 | 12,541 | |||||||||
| Mortgage servicing rights, net |
336,687 | 418,402 | 511,852 | |||||||||
| Other assets |
1,093,706 | 557,512 | 484,932 | |||||||||
|
|
|
|
|
|
|
|||||||
| Total assets |
3,703,005 | 2,607,413 | 2,038,251 | |||||||||
|
|
|
|
|
|
|
|||||||
| Liabilities and equity |
||||||||||||
| Warehouse lines of credit |
1,689,291 | 1,303,187 | 839,734 | |||||||||
| Notes payable |
188,000 | 218,000 | 160,000 | |||||||||
| Other liabilities |
1,318,902 | 680,195 | 597,576 | |||||||||
|
|
|
|
|
|
|
|||||||
| Total liabilities |
3,196,193 | 2,201,382 | 1,597,310 | |||||||||
|
|
|
|
|
|
|
|||||||
| Total stockholder’s equity |
$ | 506,812 | $ | 406,031 | $ | 440,941 | ||||||
|
|
|
|
|
|
|
|||||||
67
Table of Contents
MANAGEMENT’S DISCUSSION AND ANALYSIS OF
FINANCIAL CONDITION AND RESULTS OF OPERATIONS
The following Management’s Discussion and Analysis of Financial Condition and Results of Operations is intended to highlight and supplement data and information presented elsewhere in this prospectus, including the consolidated financial statements and related notes, and should be read in conjunction with the sections “Prospectus Summary—Summary Historical Consolidated Financial and Operating Data,” “Selected Historical Consolidated Financial and Operating Data,” and the consolidated financial statements and notes thereto included elsewhere in this prospectus. The following discussion includes forward-looking statements that reflect our plans, estimates and assumptions and involve numerous risks and uncertainties, including, but not limited to, those described in the “Risk Factors” section of this prospectus. See also “Cautionary Note Regarding Forward-Looking Statements.” Future results could differ significantly from the historical results presented in this section.
Data as of and for the years ended December 31, 2019 and 2018 have been derived from Guild Mortgage Co.’s audited consolidated financial statements included elsewhere in this prospectus. Data as of and for the six-month periods ended June 30, 2020 and 2019 have been derived from Guild Mortgage Co.’s unaudited condensed consolidated financial statements included elsewhere in this prospectus. This prospectus does not include financial statements of the Issuer because it was formed for the purpose of effecting the reorganization transactions and, until the consummation of the reorganization transactions, will not hold any material assets and will not engage in any operations. See “Organizational Structure.”
Business and Executive Overview
We started our business in 1960 and are among the longest-operating seller servicers in the United States. We are a growth-oriented mortgage company that employs a relationship-based loan sourcing strategy to execute our mission of delivering the promise of home ownership in neighborhoods and communities across the United States. Our business model is centered on providing a personalized mortgage-borrowing experience that is delivered by our knowledgeable loan officers and supported by our diverse product offerings. Throughout these individualized interactions, we work to earn our clients’ trust and confidence as a financial partner that can help them find their way through life’s changes and build for the future. Through steady organic growth and a series of targeted acquisitions, we grew our annual origination volume from $1.4 billion for the year ended December 31, 2007 to $27.8 billion for the twelve months ended June 30, 2020 and grew our servicing portfolio from $2.5 billion of UPB as of December 31, 2007 to $52.8 billion of UPB as of June 30, 2020. Unless otherwise indicated, the UPB of our servicing portfolio excludes any subserviced loans.
68
Table of Contents
Guild’s Annual Origination Volume and Market Share
Source: Inside Mortgage Finance Publications, Inc. Copyright © 2020. Used with permission.
| (1) | CAGR is equal to the compound annual growth rate of Guild’s annual origination volume for the year ended December 31, 2007 through the twelve months ended June 30, 2020. |
| (2) | Last twelve months ended June 30, 2020. |
Servicing Portfolio Growth
(UPB as of period end)(1)
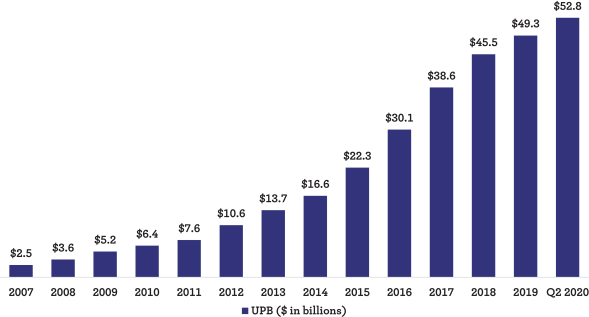
| (1) | Excludes subservicing portfolio of $1.1 billion as of June 30, 2020. |
69
Table of Contents
Executive Summary of Results of Operations for Periods Presented
Six Months Ended June 30, 2020 Summary
For the six months ended June 30, 2020, we originated $14.6 billion of mortgage loans compared to $8.6 billion for the six months ended June 30, 2019, representing a 69.5% increase for the six months ended June 30, 2020 compared to that for the six months ended June 30, 2019. Our servicing portfolio as of June 30, 2020 was $52.8 billion of UPB compared to $47.4 billion of UPB as of June 30, 2019, with the weighted average size of the portfolio increasing 9.9% over that time. We generated $110.8 million of net income for the six months ended June 30, 2020 compared to $47.0 million of net loss for the six months ended June 30, 2019. We generated $238.2 million of Adjusted Net Income for the six months ended June 30, 2020 compared to $52.6 million for the six months ended June 30, 2019, representing a 352.7% increase, and we generated $325.8 million of Adjusted EBITDA for the six months ended June 30, 2020 compared to $79.8 million for the six months ended June 30, 2019, representing a 308.1% increase. Please see “—Non-GAAP Financial Measures” for further information regarding our use of Adjusted Net Income and Adjusted EBITDA, including limitations related to such non-GAAP measures and a reconciliation of such measures to net income (loss), the nearest comparable financial measure calculated and presented in accordance with GAAP.
The above-described increase in net income, Adjusted Net Income and Adjusted EBITDA was primarily due to the increase in loan origination fees and gain on sale of loans, net of $405.8 million or 123.9% for the six months ended June 30, 2020 compared to that for the six months ended June 30, 2019. The increase in loan origination fees and gain on sale of loans, net was driven by the increase in origination volume described above and increased profit margins on overall loan sales to investors, which increased 122 basis points or 32.1% for the six months ended June 30, 2020 compared to that for the six months ended June 30, 2019. Our increased origination volume also resulted in an increase in variable salaries, commission and benefits expense of $135.6 million or 56.2% for the six months ended June 30, 2020 compared to that for the six months ended June 30, 2019.
Net income for the six months ended June 30, 2020 included a loss of $204.8 million due to a decrease in the fair value of our MSRs resulting from the valuation model impact of a decrease in projected duration of cash flow collections during the period. According to the Mortgage Finance Forecast from the Mortgage Bankers Association (the “MBA Mortgage Finance Forecast”), average 30-year mortgage rates declined by approximately 80 basis points from June 30, 2019 to June 30, 2020. A decline of this nature generally results in higher prepayment speeds and a subsequent downward adjustment to the fair value of our MSRs for the loans that still exist in our portfolio. However, when rates decline, our origination volume generally increases as refinance opportunities increase.
Management believes that maintaining both an origination segment and a servicing segment provides us with a more balanced business model in both rising and declining interest rate environments, compared to other industry participants that predominately focus on either origination or servicing, instead of both. In addition, one of our business strategies is to seek to recapture mortgage transactions when our borrowers prepay their loans. During the twelve months ended June 30, 2020, we had a 26% purchase recapture rate, a 67% refinance recapture rate and a 61% overall recapture rate, compared to 24%, 49% and 40%, respectively, for the twelve months ended June 30, 2019. Recapture rate is calculated as the total UPB of our clients that originated a new mortgage with us in a given period, divided by the total UPB of our clients that paid off their existing mortgage and originated a new mortgage in the same period. This calculation excludes clients to whom we did not actively market due to contractual prohibitions or other business reasons.
Year Ended December 31, 2019 Summary
For the year ended December 31, 2019, we originated $21.8 billion of mortgage loans compared to $16.5 billion for the year ended December 31, 2018, representing an increase of $5.3 billion or 32.3% for the year ended December 31, 2019 compared to that for the year ended December 31, 2018. Our servicing
70
Table of Contents
portfolio as of December 31, 2019 was $49.3 billion of UPB compared to $45.5 billion of UPB as of December 31, 2018, with the weighted average size of the portfolio increasing 12.8% over that time. We generated $5.6 million of net income for the year ended December 31, 2019 compared to $73.3 million for the year ended December 31, 2018. We generated $139.1 million of Adjusted Net Income for the year ended December 31, 2019 compared to $51.9 million for the year ended December 31, 2018, representing a 168.1% increase, and we generated $201.5 million of Adjusted EBITDA for the year ended December 31, 2019 compared to $83.0 million for the year ended December 31, 2018, representing a 142.8% increase. Please see “—Non-GAAP Financial Measures” for further information regarding our use of Adjusted Net Income and Adjusted EBITDA, including limitations related to such non-GAAP measures and a reconciliation of such measures to net income, the nearest comparable financial measure calculated and presented in accordance with GAAP.
The above-described increase in Adjusted Net Income and Adjusted EBITDA was primarily due to the increase in loan origination fees and gain on sale of loans, net of $204.2 million for the year ended December 31, 2019 compared to that for the year ended December 31, 2018. Our increased origination volume also resulted in an increase in variable salaries, commission and benefits expense of $67.9 million or 13.3% for the year ended December 31, 2019 compared to that for the year ended December 31, 2018. Additionally, our income from loan servicing and other fees increased by $19.0 million or 15.4% for the year ended December 31, 2019 compared to that for the year ended December 31, 2018, primarily driven by the 12.8% increase in the average size of our servicing portfolio for the year ended December 31, 2019 compared to that for the year ended December 31, 2018.
Net income for the year ended December 31, 2019 included a loss of $255.2 million due to a decrease in the fair value of our MSRs resulting from the valuation model impact of a decrease in projected duration of cash flow collections during the period. According to the MBA Mortgage Finance Forecast, average 30-year mortgage rates declined by 110 basis points from December 31, 2018 to December 31, 2019. A decline of this nature generally results in higher prepayment speeds and a subsequent downward adjustment to the fair value of our MSRs for the loans that still exist in our portfolio. However, when rates decline, our origination volume generally increases as refinance opportunities increase. For the year ended December 31, 2019, we had a 26% purchase recapture rate, a 64% refinance recapture rate and a 56% overall recapture rate, compared to 24%, 40% and 34%, respectively, for the year ended December 31, 2018.
Recent Developments
COVID-19 Pandemic
Business Operations and Liquidity
We continue to closely monitor the economic impact resulting from the COVID-19 pandemic. Although we experienced record origination volume and increased profit margins in our origination segment during the six months ended June 30, 2020, the COVID-19 pandemic has had a negative impact on the financial results of our servicing segment. The federal government enacted the CARES Act, which allows borrowers with federally backed loans to request a temporary mortgage forbearance. As a result of the CARES Act forbearance requirements, we have recorded, and expect to record additional, increases in delinquencies in our servicing portfolio. As of June 30, 2020, the 60-plus day delinquency rate on our servicing portfolio was 3.5%, compared to a 60-plus day delinquency rate of 1.5% as of February 28, 2020. This increased delinquency rate on our servicing portfolio may require us to finance substantial amounts of advances of principal and interest, property taxes, insurance premiums and other expenses to protect investors’ interests in the properties securing the loans. These advances and payments, coupled with increased servicing costs and lower servicing revenue, have negatively affected and will continue to negatively affect our cash position. Additionally, we are currently prohibited from collecting certain servicing-related fees, such as late fees, and initiating foreclosure proceedings. As a result, we expect the effects of the CARES Act forbearance requirements to reduce our servicing income and increase our servicing expenses.
71
Table of Contents
As of August 31, 2020, approximately 4.70% of the loans in our servicing portfolio had elected the forbearance option compared to the industry average of 7.16%, as reported by the Mortgage Bankers Association and, as of September 30, 2020, approximately 4.32% of the loans in our servicing portfolio had elected the forbearance option compared to the industry average of 6.81%, as reported by the Mortgage Bankers Association. Of the 4.70% of the loans in our servicing portfolio that had elected forbearance as of August 31, 2020, approximately 27.6% remained current on their August payments and, of the 4.32% of the loans in our servicing portfolio that had elected forbearance as of September 30, 2020, approximately 25.6% remained current on their September payments. We believe our portfolio has performed better than the industry average because of our in-house servicing capabilities and timely response to the COVID-19 pandemic and that our performance is a testament to the strength of our client relationships. Our in-house servicing team and local loan officers continue to work with our clients to understand forbearance plans and determine the best paths forward for their unique circumstances. By maintaining relationships with our clients throughout the loan lifecycle, and supporting our clients during times of uncertainty, we position ourselves to capture future business.
Servicing Portfolio Forbearance
(as of period end)
Source: Mortgage Bankers Association.
Employee Safety
We are also continuing to focus on the wellbeing and safety of our employees. Since March, we have moved to a remote working environment for the majority of our employees and, for those that are coming into our offices, we have instituted additional health and safety precautions, such as restricting visitors, providing masks and mandating more frequent sanitizing of our offices.
Increased Liquidity
During the second quarter of 2020, to support our increased loan origination volume, we increased the capacity of our existing loan funding facilities by $165.0 million, of which $90.0 million represented a temporary increase in capacity. Subsequent to June 30, 2020, we increased the capacity of all of our existing loan funding facilities by an aggregate amount equal to $739.0 million, of which $90.0 million represented a temporary increase in capacity. We added one additional loan funding facility during the second quarter of 2020 with a total facility size of $100.0 million, for which we subsequently increased the capacity by $100.0 million during the third quarter of 2020. As of the date of this prospectus, the aggregate available amount under our loan facilities was approximately $2.9 billion.
72
Table of Contents
During the second quarter of 2020, we renewed one of our MSR notes payable and increased the aggregate committed amount under that MSR note payable by $27.0 million. In the third quarter of 2020, we renewed another MSR note payable and increased the aggregate amount available under that MSR note payable by $15.0 million. In addition, in September 2020, we drew down $22.0 million under one of our MSR notes payable. See “—Liquidity, Capital Resources and Cash Flows” for further information regarding our funding facilities.
The extent to which the COVID-19 pandemic affects our business, results of operations and financial condition will ultimately depend on future developments, which are highly uncertain and cannot be predicted, including the scope and duration of the pandemic and actions taken by governmental authorities and other third parties in response to the pandemic. See “Risk Factors—The COVID-19 pandemic has had, and will likely continue to have, an adverse effect on our business, and its ultimate effect on our business and financial results will depend on future developments, which are highly uncertain and cannot be predicted, including the scope and duration of the pandemic and actions taken or to be taken by government authorities in response to the pandemic.”
Description of Certain Components of Financial Data
The primary components of our revenue and expenses are described below.
Our Components of Revenue
Loan origination fees and gain on sale of loans, net — This represents all income recognized from the time when a loan is originated until the time when a loan is subsequently sold to an investor and includes cash and non-cash components. Each component is described below:
| • | Gain (loss) on sale of loans — Net proceeds from the difference between the quoted loan price committed to the client and the price received from the investor at loan sale, net of miscellaneous investor fees charged. |
| • | Origination fees — Fees collected from the client, which typically include processing, underwriting, funding, credit report, tax service, flood certification and appraisal fees, net of any associated third-party costs. |
| • | The fair value of the MSRs at time of sale — After a loan is sold to an investor, we record the value of the MSR at fair value. Fair value is estimated based on the present value of future cash flows. We utilize a third-party valuation service to determine this estimated value based on variables such as contractual servicing fees, ancillary fees, the cost to service, discount rate and estimated prepayment speeds. |
| • | Changes in the fair value of IRLC and MLHS — When the client accepts an interest rate lock, we record the estimated fair value of the loan. We also evaluate several factors to determine the likelihood of the loan closing and discount the value of any IRLCs we consider to have a lower probability of closing. The probability of the loan ultimately closing changes as the stage of the loan progresses from application to underwriting submission, loan approval and funding. Loans that close and are held for sale are commonly referred to as mortgage loans held for sale or “MLHS.” MLHS are also recorded at fair value. We typically determine the fair value of our MLHS based on investor committed pricing; however, we determine the fair value of any MLHS that is not allocated to a commitment based on current delivery trade prices. |
| • | Changes in the fair value of forward delivery commitments — We enter into forward delivery commitments to hedge against changes in the interest rates associated with our IRLCs and MLHS. Our hedging policies are set by our risk management function and are monitored daily. Typically, when the fair value of an IRLC or MLHS increases, the fair value of any related forward contract decreases. |
73
Table of Contents
| • | Investor reserve provision — At the time a loan is sold to an investor, we make certain representations and warranties. If defects are subsequently discovered in these representations and warranties that cause a loan to no longer satisfy the applicable investor eligibility requirements, we may be required to repurchase that loan. We are also required to indemnify several of our investors for borrowers’ prepayments and defaults. We estimate the potential for these losses based on our recent and historical loan repurchase and indemnification experience and as our success rate on appeals. We also screen market conditions for any indications of a rise in delinquency rates, which may result in a heightened exposure to loss. |
Loan servicing and other fees — Loan servicing and other fees consist of:
| • | Loan servicing income — This represents the contractual fees that Guild earns by servicing loans for various investors. Fees are calculated based on a percentage of the outstanding principal balance and is recognized into revenue as related payments are received. |
| • | Other ancillary fees — We may also collect other ancillary fees from the client, such as late fees and nonsufficient funds fees. |
| • | Impound interest — We are required to pay interest to our clients annually based on the average escrow account balances that we hold in trust for the payment of their property taxes and insurance. |
Valuation adjustment of mortgage servicing rights — We have elected to recognize MSRs at fair value. This requires that we periodically reevaluate the valuation of our MSRs following our initial analysis at the time of sale. A third party conducts a monthly valuation of our MSRs, and we record any changes to the fair value of our MSRs that result from changes in valuation model inputs or assumptions and collections of servicing cash flows in accordance with such third-party analysis. Changes in the fair value of our MSRs result in an adjustment to the value of our MSRs. See “Quantitative and Qualitative Disclosure about Market Risk—Fair Value Risk—MSRs” and “Critical Accounting Policies—Mortgage Servicing Rights” for additional information regarding the valuation of our MSRs.
Interest income — Interest income consists primarily of interest earned on MLHS.
Interest expense — Interest expense consists primarily of interest paid on funding and non-funding debt facilities collateralized by our MLHS and MSRs. We define funding debt as all other debt related to operations, such as warehouse lines of credit and our early buyout facility, which we use to repurchase certain delinquent GNMA loans. Non-funding debt includes the note agreements collateralized by our MSRs (our “MSR notes payable”). See “Description of Certain Indebtedness” for further details about our indebtedness. We also record related bank charges and payoff as interest expense. Payoff interest expense is equal to the difference between what we collect in interest from our clients and what we remit in interest to the investors who purchase the loans that we originate. In most cases, we are required to remit a full month of interest to those investors, regardless of the date on which the client prepays during the payoff month, resulting in additional interest expense.
Other income — Other income typically includes dividend and fair value adjustments related to marketable securities that are generally immaterial to our operating results.
Our Components of Expenses
Salaries, commissions and benefits — Salaries, commissions and benefits expense includes all payroll, incentive compensation and employee benefits paid to our employees, as well as expenses incurred in connection with our use of employment and temporary help agencies. Our loan officers are paid incentive compensation based on origination volume, resulting in a variable pay structure that fluctuates.
General and administrative — General and administrative expense primarily includes costs associated with professional services, attendance at conferences and meetings, office expenses, liability insurance, business licenses and other miscellaneous costs.
74
Table of Contents
In addition, within general and administrative expense, we record any adjustments to the fair value of the contingent liabilities related to our completed acquisitions. The purchase and sale agreements with respect to each of the six acquisitions that we have completed provided for contingent future consideration commonly known as “earn-out payments.” These payments are estimated based on the present value of future cash flows during the earn-out period. The earn-out periods for our acquisitions span from three to five years, and the earn-out periods for three of our acquisitions are still ongoing.
Occupancy, equipment and communication — Occupancy, equipment and communication includes expenses related to the commercial office spaces we lease, as well as telephone and internet service and miscellaneous leased equipment used for operations. See “Contractual Obligations” for a summary of future lease obligations.
Depreciation and amortization — We depreciate furniture and equipment on a straight-line basis for a period of up to five years and we record amortization expense related to our leasehold improvements on rented space. That amortization expense is recognized over the shorter of the lease term or the useful life of the asset. We also record costs related to the maintenance of software, which consist of both internal and external costs incurred in connection with software development and testing, as well as any costs associated with the implementation of new software. These costs are amortized over a three-year period.
Provision for foreclosure losses — We may incur a loss on government loans related to unreimbursed interest and costs associated with foreclosure. We reserve for government loans based on historical loss experience as well as for loan-specific issues related to foreclosure.
Income tax (benefit) expense — We are subject to federal and state income tax. We record this expense based on our effective federal and state tax rates. These effective rates are adjusted for permanent non-deductible differences and reconciliation differences from prior years. We also evaluate material temporary differences to determine whether any additional adjustments to this expense are required.
Future Public Company Expenses
In connection with our becoming and being a public company, we expect our expenses to increase, including, but not limited to, our legal, accounting and insurance expenses. Although we do not anticipate any increase in these expenses to have a material effect on our overall results of operations, our historical results of operations may not be indicative of our future results of operations. If we fail to manage these additional costs or to maintain or increase our revenue, we may incur losses in the future.
75
Table of Contents
Key Performance Indicators
Management reviews several key performance indicators to evaluate our business results, measure our performance and identify trends to inform our business decisions. Summary data for these key performance indicators is listed below. Please refer to the “—Components of Results of Operations” for additional metrics that management reviews in conjunction with the consolidated financial statements.
| Six Months Ended June 30, |
||||||||||||||||
| ($ and units in thousands) |
2020 | 2019 | Change | % Change | ||||||||||||
| Origination Data |
||||||||||||||||
| $ Total in-house origination(1) |
$ | 14,558,875 | $ | 8,542,837 | $ | 6,016,038 | 70.4 | % | ||||||||
| # Total in-house origination |
52 | 33 | 19 | 57.6 | % | |||||||||||
| $ Retail in-house origination |
$ | 14,186,728 | $ | 8,265,074 | $ | 5,921,654 | 71.6 | % | ||||||||
| # Retail in-house origination |
50 | 31 | 19 | 61.3 | % | |||||||||||
| $ Retail brokered origination(2) |
$ | 42,423 | $ | 69,963 | $ | (27,540 | ) | (39.4 | )% | |||||||
| Total origination |
$ | 14,601,298 | $ | 8,612,800 | $ | 5,988,498 | 69.5 | % | ||||||||
| Gain-on-sale margin (bps)(3) |
504 | 383 | 121 | 31.6 | % | |||||||||||
| 30-year conventional conforming par rate(4) |
3.2 | % | 4.0 | % | (0.8 | )% | (20.0 | )% | ||||||||
| Servicing Data |
||||||||||||||||
| UPB (period end)(5) |
$ | 52,794,328 | $ | 47,399,200 | $ | 5,395,128 | 11.4 | % | ||||||||
| Loans serviced (period end) |
249 | 229 | 20 | 8.7 | % | |||||||||||
| MSR multiple (period end)(6) |
2.2 | 2.9 | (0.7 | ) | (24.1 | )% | ||||||||||
| Weighted average coupon |
4.0 | % | 4.3 | % | (0.3 | )% | (7.0 | )% | ||||||||
| Loan payoff(7) |
$ | 8,223,361 | $ | 2,730,731 | $ | 5,492,630 | 201.1 | % | ||||||||
| Loan delinquency rate 60-plus days (period end) |
3.5 | % | 1.2 | % | 2.3 | % | 191.7 | % | ||||||||
| (1) | Includes retail and correspondent loans and excludes brokered loans. |
| (2) | Brokered loans are defined as loans we originate in the retail channel that are processed by us, but underwritten and closed by another lender. These loans are typically for products we choose not to offer in house. |
| (3) | Represents the components of loan origination fees and gain on sale of loans, net described under “—Our Components of Revenue” divided by total in-house origination to derive basis points. Our gain-on-sale margin based on pull-through adjusted locked volume was 407 basis points and 329 basis points for the six months ended June 30, 2020 and June 30, 2019, respectively. Gain-on-sale margin based on pull-through adjusted locked volume represents the components of loan origination fees and gain on sales of loans, net described under “—Our Components of Revenue” divided by pull-through adjusted lock volume. Pull-through adjusted lock volume is equal to total locked volume multiplied by pull-through rates of 87.20% and 88.35% for the six months ended June 30, 2020 and June 30, 2019, respectively. We estimate the pull-through rate based on changes in pricing and actual borrower behavior using a historical analysis of loan closing data and “fallout” data with respect to the number of commitments that have historically remained unexercised. For additional information regarding our total locked volume and pull-through adjusted lock volume for the six months ended June 30, 2020 and June 30, 2019, see “—Results of Operations for the Six Months Ended June 30, 2020 and 2019—Revenue—Loan Origination Fees and Gain on Sale of Loans, Net.” |
| (4) | Represents the average 30-year conventional conforming note rate published monthly according to the MBA Mortgage Monthly Finance Forecast. |
| (5) | Excludes subserviced portfolio of $1.1 billion and $0.8 billion as of June 30, 2020 and June 30, 2019, respectively. |
| (6) | Represents a metric used to determine the relative value of our MSRs in relation to our annualized retained servicing fee. It is calculated by dividing (a) the fair market value of our MSRs as of a |
76
Table of Contents
| specified date by (b) the weighted average annualized retained servicing fee for our servicing portfolio as of such date. We exclude purchased MSRs from this calculation because our servicing portfolio consists primarily of originated MSRs and, consequently, purchased MSRs do not have a material impact on our weighted average service fee. |
| (7) | Represents the gross amount of UPB paid off from our servicing portfolio. |
| Year Ended December 31, |
||||||||||||||||
| ($ and units in thousands) |
2019 | 2018 | Change | % Change | ||||||||||||
| Origination Data |
||||||||||||||||
| $ Total in-house origination(1) |
$ | 21,711,668 | $ | 16,409,729 | $ | 5,301,939 | 32.3 | % | ||||||||
| # Total in-house origination |
81 | 66 | 15 | 22.7 | % | |||||||||||
| $ Retail in-house origination |
$ | 20,938,310 | $ | 15,736,212 | $ | 5,202,098 | 33.1 | % | ||||||||
| # Retail in-house origination |
77 | 62 | 15 | 24.2 | % | |||||||||||
| $ Retail brokered origination(2) |
$ | 136,106 | $ | 105,145 | $ | 30,961 | 29.4 | % | ||||||||
| Total originations |
$ | 21,847,774 | $ | 16,514,874 | $ | 5,332,900 | 32.3 | % | ||||||||
| Gain-on-sale margin (bps)(3) |
378 | 376 | 2 | 0.5 | % | |||||||||||
| 30-year conventional conforming par rate(4) |
3.7 | % | 4.8 | % | (1.1 | )% | (22.9 | )% | ||||||||
| Servicing Data |
||||||||||||||||
| UPB (period end)(5) |
$ | 49,326,579 | $ | 45,496,129 | $ | 3,830,450 | 8.4 | % | ||||||||
| Loans serviced (period end) |
237 | 221 | 16 | 7.2 | % | |||||||||||
| MSR multiple (period end)(6) |
2.9 | 3.9 | (1.0 | ) | (25.6 | )% | ||||||||||
| Weighted average coupon |
4.2 | % | 4.3 | % | (0.1 | )% | (2.3 | )% | ||||||||
| Loan payoffs(7) |
$ | 9,374,095 | $ | 3,701,085 | $ | 5,673,010 | 153.3 | % | ||||||||
| Loan delinquency rate 60-plus days (period end) |
1.6 | % | 1.4 | % | 0.2 | % | 14.3 | % | ||||||||
| (1) | Includes retail and correspondent loans and excludes brokered loans. |
| (2) | Brokered loans are defined as loans we originate in the retail channel that are processed by us, but underwritten and closed by another lender. These loans are typically for products we choose not to offer in house. |
| (3) | Represents the components of loan origination fees and gain on sale of loans, net described under “—Our Components of Revenue” divided by total in-house origination to derive basis points. Our gain-on-sale margin based on pull-through adjusted lock volume was 359 basis points and 369 basis points for the years ended December 31, 2019 and December 31, 2018, respectively. Gain-on-sale margin based on pull-through adjusted lock volume represents the components of loan origination fees and gain on sales of loans, net described under “—Our Components of Revenue” divided by pull-through adjusted lock volume. Pull-through adjusted lock volume is equal to total locked volume multiplied by pull-through rates of 89.40% and 88.80% for the years ended December 31, 2019 and December 31, 2018, respectively. We estimate the pull-through rate based on changes in pricing and actual borrower behavior using a historical analysis of loan closing data and “fallout” data with respect to the number of commitments that have historically remained unexercised. For additional information regarding our total locked volume and pull-through adjusted lock volume for the years ended December 31, 2019 and December 31, 2018, see “—Results of Operations for the Years Ended December 31, 2019 and 2018—Revenue—Loan Origination Fees and Gain on Sale of Loans, Net.” |
| (4) | Represents the 30-year average conventional conforming note rate published monthly according to the MBA Mortgage Monthly Finance Forecast. |
| (5) | Excludes subserviced portfolio of $1.3 billion and $0.8 billion as of December 31, 2019 and December 31, 2018, respectively. |
| (6) | Represents a metric used to determine the relative value of our MSRs in relation to our annualized retained servicing fee. It is calculated by dividing (a) the fair market value of our MSRs as of a specified date by (b) the weighted average annualized retained servicing fee for our servicing portfolio as of such date. We exclude purchased MSRs from this calculation because our servicing portfolio |
77
Table of Contents
| consists primarily of originated MSRs and, consequently, purchased MSRs do not have a material impact on our weighted average service fee. |
| (7) | Represents the gross amount of UPB paid off from our servicing portfolio. |
Non-GAAP Financial Measures
To supplement Guild Mortgage Co.’s financial statements presented in accordance with GAAP and to provide investors with additional information regarding Guild Mortgage Co.’s GAAP financial results, we have presented in this prospectus Adjusted Net Income, Adjusted EBITDA and Adjusted Return on Equity, which are non-GAAP financial measures. These non-GAAP financial measures are not based on any standardized methodology prescribed by GAAP and are not necessarily comparable to similarly titled measures presented by other companies.
Adjusted Net Income. We define Adjusted Net Income as earnings before the change in the fair value measurements related to our MSRs and contingent liabilities related to completed acquisitions due to changes in valuation assumptions. The fair value of our MSRs is estimated based on a projection of expected future cash flows and the fair value of our contingent liabilities related to completed acquisitions is estimated based on a projection of expected future earn-out payments. Adjusted Net Income is also adjusted by applying an implied tax effect to these adjustments. The Company excludes the change in the fair value of its MSRs due to changes in model inputs and assumptions from Adjusted Net Income and Adjusted EBITDA because the Company believes this non-cash, non-realized adjustment to total revenues is not indicative of the Company’s operating performance or results of operation but rather reflects changes in model inputs and assumptions (e.g., discount rates and prepayment speed assumptions) that impact the carrying value of the Company’s MSRs from period to period.
Adjusted EBITDA. We define Adjusted EBITDA as earnings before interest (without adjustment for net warehouse interest related to loan fundings and payoff interest related to loan prepayments), taxes, depreciation and amortization exclusive of any change in the fair value measurements of the MSRs due to valuation assumptions and contingent liabilities from business acquisitions. The Company excludes the change in the fair value of its MSRs due to changes in model inputs and assumptions from Adjusted Net Income and Adjusted EBITDA because the Company believes this non-cash, non-realized adjustment to total revenues is not indicative of the Company’s operating performance or results of operation but rather reflects changes in model inputs and assumptions (e.g., discount rates and prepayment speed assumptions) that impact the carrying value of the Company’s MSRs from period to period.
Adjusted Return on Equity. We define Adjusted Return on Equity as Adjusted Net Income as a percentage of average beginning and ending stockholder’s equity during the period. For periods of less than one year, Adjusted Return on Equity is shown on an annualized basis.
We use these non-GAAP financial measures to evaluate our operating performance, to establish budgets and to develop operational goals for managing our business. These non-GAAP financial measures are designed to evaluate operating results exclusive of fair value adjustments that are not indicative of management’s operating performance. Accordingly, we believe that these financial measures provide useful information to investors and others in understanding and evaluating our operating results, enhancing the overall understanding of our past performance and future prospects. We have presented certain of these non-GAAP financial measures for the twelve months ended June 30, 2020 and June 30, 2019 because the twelve months ended June 30, 2020 provides the most current twelve-month period data that is available for comparison against certain historical annual metrics included in this prospectus and the data for the twelve months ended June 30, 2019 provides data for the comparable twelve-month period.
Our non-GAAP financial measures are not prepared in accordance with GAAP and should not be considered in isolation of, or as an alternative to, measures prepared in accordance with GAAP. There are a number of limitations related to the use of these non-GAAP financial measures rather than net income (loss), which is the most directly comparable financial measure calculated and presented in accordance with GAAP for Adjusted Net Income and Adjusted EBITDA, and return on equity, which is the most directly
78
Table of Contents
comparable financial measure calculated and presented in accordance with GAAP for Adjusted Return on Equity. These limitations include that these non-GAAP financial measures are not based on a comprehensive set of accounting rules or principles and many of the adjustments to the GAAP financial measures reflect the exclusion of items that are recurring and may be reflected in the Company’s financial results for the foreseeable future. In addition, other companies may use other measures to evaluate their performance, all of which could reduce the usefulness of our non-GAAP financial measures as tools for comparison.
The following tables reconcile Adjusted Net Income and Adjusted EBITDA to net income (loss) and Adjusted Return on Equity to return on equity, the most directly comparable financial measures calculated and presented in accordance with GAAP.
| Reconciliation of Net Income (Loss) to Adjusted Net Income |
Six Months Ended June 30, |
Twelve Months Ended June 30, |
Years ended December 31, |
|||||||||||||||||||||
| ($ in thousands) |
2020 | 2019 | 2020 | 2019 | 2019 | 2018 | ||||||||||||||||||
| Net income (loss) |
$ | 110,781 | $ | (46,998 | ) | $ | 163,356 | $ | (33,173 | ) | $ | 5,577 | $ | 73,333 | ||||||||||
| Add adjustments: |
||||||||||||||||||||||||
| Change in fair value of MSRs due to model inputs and assumptions |
151,080 | 130,734 | 191,744 | 152,016 | 171,398 | (26,178 | ) | |||||||||||||||||
| Change in fair value of contingent liabilities due to acquisitions |
20,025 | 3,054 | 24,891 | (157 | ) | 7,920 | (2,642 | ) | ||||||||||||||||
| Tax impact of adjustments(1) |
(43,718 | ) | (34,183 | ) | (55,351 | ) | (38,776 | ) | (45,816 | ) | 7,364 | |||||||||||||
|
|
|
|
|
|
|
|
|
|
|
|
|
|||||||||||||
| Adjusted Net Income |
$ | 238,168 | $ | 52,607 | $ | 324,640 | $ | 79,910 | $ | 139,079 | $ | 51,877 | ||||||||||||
|
|
|
|
|
|
|
|
|
|
|
|
|
|||||||||||||
| (1) | Implied tax rate used is 25.5%. |
| Reconciliation of Net Income (Loss) to Adjusted EBITDA | Six Months Ended June 30, |
Years ended December 31, |
||||||||||||||
| ($ in thousands) |
2020 | 2019 | 2019 | 2018 | ||||||||||||
| Net income (loss) |
$ | 110,781 | $ | (46,998 | ) | $ | 5,577 | $ | 73,333 | |||||||
| Add adjustments: |
||||||||||||||||
| Interest expense on non-funding debt |
4,291 | 4,603 | 8,980 | 7,019 | ||||||||||||
| Income tax provision |
36,465 | (15,389 | ) | 253 | 24,260 | |||||||||||
| Depreciation and amortization |
3,146 | 3,824 | 7,333 | 7,180 | ||||||||||||
| Change in fair value of MSRs due to model inputs and assumptions |
151,080 | 130,734 | 171,398 | (26,178 | ) | |||||||||||
| Change in fair value of contingent liabilities due to acquisitions |
20,025 | 3,054 | 7,920 | (2,642 | ) | |||||||||||
|
|
|
|
|
|
|
|
|
|||||||||
| Adjusted EBITDA |
$ | 325,788 | $ | 79,828 | $ | 201,461 | $ | 82,972 | ||||||||
|
|
|
|
|
|
|
|
|
|||||||||
| Adjusted Return on Equity Calculation | Six Months Ended June 30, |
Twelve Months Ended June 30, |
Years ended December 31, |
|||||||||||||||||||||
| ($ in thousands, except where in |
2020 | 2019 | 2020 | 2019 | 2019 | 2018 | ||||||||||||||||||
| Numerator: Adjusted Net Income |
$ | 238,168 | $ | 52,607 | $ | 324,640 | $ | 79,910 | $ | 139,079 | $ | 51,877 | ||||||||||||
| Denominator: Average stockholder’s equity |
456,422 | 407,199 | 440,134 | 410,287 | 423,486 | 429,244 | ||||||||||||||||||
|
|
|
|
|
|
|
|
|
|
|
|
|
|||||||||||||
| Adjusted Return on Equity(1) |
104.4 | % | 25.8 | % | 73.8 | % | 19.5 | % | 32.8 | % | 12.1 | % | ||||||||||||
|
|
|
|
|
|
|
|
|
|
|
|
|
|||||||||||||
| Return on equity(2) |
48.5 | % | (23.1 | )% | 37.1 | % | (8.1 | )% | 1.3 | % | 17.1 | % | ||||||||||||
79
Table of Contents
| (1) | For the six months ended June 30, 2020 and June 30, 2019, Adjusted Return on Equity is shown on an annualized basis. |
| (2) | For the six months ended June 30, 2020 and June 30, 2019, return on equity is shown on an annualized basis. |
| Reconciliation of Net Income (Loss) |
Three Months Ended September 30, | Nine Months Ended September 30, | ||||||||||||||||||||||
| 2020 | 2019 | 2020 | 2019 | |||||||||||||||||||||
| (in thousands) |
Low | High | (Actual) | Low | High | (Actual) | ||||||||||||||||||
| Net income (loss) |
$ | 178,000 | $ | 187,000 | $ | 8,496 | $ | 286,000 | $ | 301,000 | $ | (38,502 | ) | |||||||||||
| Add adjustments: |
||||||||||||||||||||||||
| Change in fair value of MSRs due to model inputs and assumptions |
9,000 | 10,000 | 63,062 | 157,000 | 165,000 | 194,104 | ||||||||||||||||||
| Change in fair value of contingent liabilities due to acquisitions |
6,000 | 7,000 | 4,222 | 26,000 | 27,000 | 7,276 | ||||||||||||||||||
| Tax impact of adjustments |
(4,000 | ) | (4,000 | ) | (17,157 | ) | (47,000 | ) | (49,000 | ) | (51,352 | ) | ||||||||||||
|
|
|
|
|
|
|
|
|
|
|
|
|
|||||||||||||
| Adjusted Net Income |
$ | 189,000 | $ | 200,000 | $ | 58,623 | $ | 422,000 | $ | 444,000 | $ | 111,526 | ||||||||||||
|
|
|
|
|
|
|
|
|
|
|
|
|
|||||||||||||
| Reconciliation of Net Income (Loss) |
Three Months Ended September 30, | Nine Months Ended September 30, | ||||||||||||||||||||||
| 2020 | 2019 | 2020 | 2019 | |||||||||||||||||||||
| (in thousands) |
Low | High | (Actual) | Low | High | (Actual) | ||||||||||||||||||
| Net income (loss) |
$ | 178,000 | 187,000 | $ | 8,496 | $ | 286,000 | $ | 301,000 | $ | (38,502 | ) | ||||||||||||
| Add adjustments: |
||||||||||||||||||||||||
| Interest expense on non-funding debt |
2,000 | 2,000 | 2,194 | 6,000 | 7,000 | 6,797 | ||||||||||||||||||
| Income tax provision |
62,000 | 65,000 | (2,661 | ) | 98,000 | 103,000 | (18,050 | ) | ||||||||||||||||
| Depreciation and amortization |
2,000 | 2,000 | 1,812 | 5,000 | 5,000 | 5,636 | ||||||||||||||||||
| Change in fair value of MSRs due to model inputs and assumptions |
9,000 | 10,000 | 63,062 | 157,000 | 165,000 | 194,104 | ||||||||||||||||||
| Change in fair value of contingent liabilities due to acquisitions |
6,000 | 7,000 | 4,222 | 26,000 | 27,000 | 7,276 | ||||||||||||||||||
|
|
|
|
|
|
|
|
|
|
|
|
|
|||||||||||||
| Adjusted EBITDA |
$ | 259,000 | $ | 273,000 | $ | 77,125 | $ | 578,000 | $ | 608,000 | $ | 157,261 | ||||||||||||
|
|
|
|
|
|
|
|
|
|
|
|
|
|||||||||||||
| Adjusted Return on Equity Calculation | Three Months Ended September 30, | Nine Months Ended September 30, | ||||||||||||||||||||||
| 2020 | 2019 | 2020 | 2019 | |||||||||||||||||||||
| (in thousands, except where in |
Low | High | (Actual) | Low | High | (Actual) | ||||||||||||||||||
| Numerator: Adjusted Net Income |
$ | 189,000 | $ | 200,000 | $ | 58,623 | $ | 422,000 | $ | 444,000 | $ | 111,526 | ||||||||||||
| Denominator: Average stockholder’s equity |
595,812 | 600,312 | 377,704 | 544,031 | 551,531 | 411,446 | ||||||||||||||||||
|
|
|
|
|
|
|
|
|
|
|
|
|
|||||||||||||
| Adjusted Return on Equity(1) |
127 | % | 133 | % | 62 | % | 103 | % | 107 | % | 36 | % | ||||||||||||
|
|
|
|
|
|
|
|
|
|
|
|
|
|||||||||||||
| Return on equity(2) |
120 | % | 125 | % | 9 | % | 70 | % | 73 | % | (12 | )% | ||||||||||||
| (1) | For the three months ended September 30, 2020 and September 30, 2019 and the nine months ended September 30, 2020 and September 30, 2019, Adjusted Return on Equity is shown on an annualized basis. |
80
Table of Contents
| (2) | For the three months ended September 30, 2020 and September 30, 2019 and the nine months ended September 30, 2020 and September 30, 2019, return on equity is shown on an annualized basis. |
The following table reconciles the valuation adjustment of mortgage servicing rights from the Company’s consolidated statements of income to the change in fair value of MSRs due to model inputs and assumptions included in the reconciliation tables above.
| Reconciliation of valuation adjustment of mortgage servicing rights to change in fair value of MSRs due to model inputs and assumptions |
Six Months Ended June 30, | Twelve Months Ended June 30, |
Year ended December 31, | |||||||||||||||||||||
| ($ in thousands) |
2020 | 2019 | 2020 | 2019 | 2019 | 2018 | ||||||||||||||||||
| Valuation adjustment of mortgage servicing rights |
$ | (204,810 | ) | $ | (160,222 | ) | $ | (299,807 | ) | $ | (203,842 | ) | $ | (255,219 | ) | $ | (17,050 | ) | ||||||
| Subtract adjustment: |
||||||||||||||||||||||||
| Change in fair value of MSRs due to collection/realization of cash flows |
(53,730 | ) | (29,488 | ) | (108,063 | ) | (51,826 | ) | (83,821 | ) | (43,228 | ) | ||||||||||||
|
|
|
|
|
|
|
|
|
|
|
|
|
|||||||||||||
| Change in fair value of MSRs due to model inputs and assumptions |
$ | (151,080 | ) | $ | (130,734 | ) | $ | (191,744 | ) | $ | (152,016 | ) | $ | (171,398 | ) | $ | 26,178 | |||||||
|
|
|
|
|
|
|
|
|
|
|
|
|
|||||||||||||
Results of Operations for the Six Months Ended June 30, 2020 and 2019
| Consolidated Statement of Income |
Six Months Ended June 30, |
|||||||||||||||
| ($ in thousands) |
2020 | 2019 | $ Change | % Change | ||||||||||||
| Loan origination fees and gain on sale of loans, net |
$ | 733,293 | $ | 327,503 | $ | 405,790 | 123.9 | % | ||||||||
| Loan servicing and other fees |
76,310 | 68,437 | 7,873 | 11.5 | % | |||||||||||
| Valuation adjustment of mortgage servicing rights |
(204,810 | ) | (160,222 | ) | (44,588 | ) | 27.8 | % | ||||||||
| Interest income |
26,949 | 25,327 | 1,622 | 6.4 | % | |||||||||||
| Interest expense |
(27,441 | ) | (23,133 | ) | (4,308 | ) | 18.6 | % | ||||||||
| Other (expense) income |
(4 | ) | 1,181 | (1,185 | ) | NM | ||||||||||
|
|
|
|
|
|
|
|
|
|||||||||
| Net revenue |
604,297 | 239,093 | 365,204 | 152.7 | % | |||||||||||
|
|
|
|
|
|
|
|
|
|||||||||
| Salaries, commission and benefits |
376,898 | 241,316 | 135,582 | 56.2 | % | |||||||||||
| Occupancy, equipment and communication |
26,955 | 26,942 | 13 | 0.0 | % | |||||||||||
| General and administrative |
48,192 | 28,624 | 19,568 | 68.4 | % | |||||||||||
| Provision for foreclosure losses |
1,860 | 774 | 1,086 | 140.3 | % | |||||||||||
| Depreciation and amortization |
3,146 | 3,824 | (678 | ) | (17.7 | )% | ||||||||||
|
|
|
|
|
|
|
|
|
|||||||||
| Total expense |
457,051 | 301,480 | 155,571 | 51.6 | % | |||||||||||
|
|
|
|
|
|
|
|
|
|||||||||
| Income (loss) before income tax (benefit) expense |
147,246 | (62,387 | ) | 209,633 | NM | |||||||||||
| Income tax (benefit) expense |
36,465 | (15,389 | ) | 51,854 | NM | |||||||||||
|
|
|
|
|
|
|
|
|
|||||||||
| Net income (loss) |
$ | 110,781 | $ | (46,998 | ) | $ | 157,779 | NM | ||||||||
|
|
|
|
|
|
|
|
|
|||||||||
Net income totaled $110.8 million for the six months ended June 30, 2020 compared to a net loss of $47.0 million for the six months ended June 30, 2019. This change was primarily driven by increased revenue earned from loan origination fees and gain on sale of loans, net of $405.8 million or 123.9% for the six months ended June 30, 2020 compared to that for the six months ended June 30, 2019. According to the MBA Mortgage Finance Forecast, average 30-year mortgage rates declined approximately 80 basis
81
Table of Contents
points from June 30, 2019 to June 30, 2020, which led to an increase in refinance activity. Refinance activity represented 59% of origination volume in the U.S. mortgage market during the six months ended June 30, 2020 compared to 29% of the origination volume during the six months ended June 30, 2019, according to Inside Mortgage Finance. As consumer demand for refinancing increased, our profit margins increased. Our origination volume increased 69.5% for the six months ended June 30, 2020 compared to that for the six months ended June 30, 2019. Our income from loan servicing and other fees increased by $7.9 million or 11.5% for the six months ended June 30, 2020 compared to that for the six months ended June 30, 2019. These increases in loan origination fees and gain on sale of loans, net and loan servicing and other fees were partially offset by a loss associated with the decrease in the fair value of our MSRs resulting from the valuation model impact of a decrease in projected duration of cash flow collections during the period, as described further below. In a declining mortgage interest rate environment, it is typical for us to experience downward MSR valuation adjustments due to the increased likelihood of prepayments for the loans that still exist in our MSR portfolio. However, when rates decline, originations tend to increase as refinance opportunities increase.
Salaries, commission and benefits expense increased by $135.6 million or 56.2% for the six months ended June 30, 2020 compared to that for the six months ended June 30, 2019. This increase resulted from increased variable incentive compensation paid to our origination teams and our hiring of additional employees to support the increases in our origination and servicing volumes. Revenue increased 152.7%, while salaries, commission and benefits expense increased 56.2% for the six months ended June 30, 2020 compared to that for the six months ended June 30, 2019. Occupancy costs remained relatively unchanged for the comparative period. General and administrative expense increased by $19.6 million or 68.4% for the six months ended June 30, 2020 compared to that for the six months ended June 30, 2019 due to an upward adjustment to the fair value of the contingent liabilities related to our completed acquisitions and increases in certain third-party expenses that typically increase directionally as origination and servicing volumes expand.
Revenue
Loan Origination Fees and Gain on Sale of Loans, Net
The table below provides additional details regarding our loan origination fees and gain on sale of loans, net for the periods presented.
| Six Months Ended June 30, |
||||||||||||||||
| ($ in thousands) |
2020 | 2019 | $ Change | % Change | ||||||||||||
| Gain on sale of loans |
$ | 442,106 | $ | 239,075 | $ | 203,031 | 84.9 | % | ||||||||
| Fair value of originated MSRs |
114,771 | 44,442 | 70,329 | 158.2 | % | |||||||||||
| Fair value adjustment to MLHS and IRLCs |
167,200 | 24,536 | 142,664 | 581.4 | % | |||||||||||
| Changes in fair value of forward commitments |
(23,509 | ) | (5,563 | ) | (17,946 | ) | 322.6 | % | ||||||||
| Origination fees |
43,778 | 28,668 | 15,110 | 52.7 | % | |||||||||||
| Provision for investor reserves |
(11,053 | ) | (3,655 | ) | (7,398 | ) | 202.4 | % | ||||||||
|
|
|
|
|
|
|
|
|
|||||||||
| Total loan origination fees and gain on sale of loans, net |
$ | 733,293 | $ | 327,503 | $ | 405,790 | 123.9 | % | ||||||||
|
|
|
|
|
|
|
|
|
|||||||||
82
Table of Contents
The table below provides additional detail regarding our origination volume and other key performance indicators for the periods presented.
| Six Months Ended June 30, |
||||||||||||||||
| ($ and units in thousands) |
2020 | 2019 | Change | % Change | ||||||||||||
| Loan origination volume by type: |
||||||||||||||||
| Conventional conforming |
$ | 9,937,145 | $ | 4,910,942 | $ | 5,026,203 | 102.3 | % | ||||||||
| Government |
3,538,359 | 2,386,261 | 1,152,098 | 48.3 | % | |||||||||||
| State housing |
828,566 | 795,730 | 32,836 | 4.1 | % | |||||||||||
| Non-agency |
254,805 | 449,904 | (195,099 | ) | (43.4 | )% | ||||||||||
|
|
|
|
|
|
|
|
|
|||||||||
| Total in-house originations(1) |
$ | 14,558,875 | $ | 8,542,837 | $ | 6,016,038 | 70.4 | % | ||||||||
|
|
|
|
|
|
|
|
|
|||||||||
| Brokered loans |
$ | 42,423 | $ | 69,963 | $ | (27,540 | ) | (39.4 | )% | |||||||
| Total originations |
$ | 14,601,298 | $ | 8,612,800 | $ | 5,988,498 | 69.5 | % | ||||||||
|
|
|
|
|
|
|
|
|
|||||||||
| In-house loans closed |
52 | 33 | 19 | 57.6 | % | |||||||||||
| Average loan amount |
$ | 280 | $ | 260 | $ | 20 | 7.7 | % | ||||||||
| Purchase |
45.0 | % | 78.4 | % | (33.4 | )% | (42.6 | )% | ||||||||
| Refinance |
55.0 | % | 21.6 | % | 33.4 | % | 154.6 | % | ||||||||
| Service retained(2) |
85.1 | % | 58.7 | % | 26.4 | % | 45.0 | % | ||||||||
| Service released(3) |
14.9 | % | 41.3 | % | (26.4 | )% | (63.9 | )% | ||||||||
| Gain-on-sale margin (bps)(4) |
504 | 383 | 121 | 31.6 | % | |||||||||||
| Total locked volume(5) |
$ | 20,678,153 | $ | 11,272,052 | $ | 9,406,101 | 83.4 | % | ||||||||
| Pull-through adjusted lock volume(6) |
$ | 18,031,349 | $ | 9,958,858 | $ | 8,072,491 | 81.1 | % | ||||||||
| Weighted average loan-to-value |
81.0 | % | 85.8 | % | (4.8 | )% | (5.6 | )% | ||||||||
| Weighted average credit score |
746 | 721 | 25 | 3.5 | % | |||||||||||
| Weighted average note rate |
3.5 | % | 4.7 | % | (1.2 | )% | (25.5 | )% | ||||||||
| Days application to close |
44 | 39 | 6 | 15.8 | % | |||||||||||
| Days close to purchase by investors |
16 | 17 | (1 | ) | (5.9 | )% | ||||||||||
| Purchase recapture rate |
26.3 | % | 24.5 | % | 1.8 | % | 7.3 | % | ||||||||
| Refinance recapture rate |
66.6 | % | 53.9 | % | 12.7 | % | 23.6 | % | ||||||||
| (1) | Includes retail and correspondent loans and excludes brokered loans. |
| (2) | Represents loans sold for which we continue to act as the servicer. |
| (3) | Represents loans sold for which we do not continue to act as the servicer. |
| (4) | Represents the components of loan origination fees and gain on sales of loans, net described under “—Our Components of Revenue” divided by total in-house origination to derive basis points. Our gain-on-sale margin based on pull-through adjusted locked volume was 407 basis points and 329 basis points for the six months ended June 30, 2020 and June 30, 2019, respectively. Gain-on-sale margin based on pull-through adjusted locked volume represents the components of loan origination fees and gain on sales of loans, net described under “—Our Components of Revenue” divided by pull-through adjusted lock volume. |
| (5) | Total locked volume represents the aggregate dollar value of the potential loans for which the Company has agreed to extend credit to consumers at specified rates for a specified period of time, subject to certain contingencies that are described in the interest rate lock commitments between the Company and each of those consumers. The total locked volume for a given period is representative of the interest rate lock commitments that the Company has initially entered into during that period. |
| (6) | Pull-through adjusted lock volume equal to total locked volume multiplied by pull-through rates of 87.20% and 88.35% for the six months ended June 30, 2020 and June 30, 2019, respectively. We estimate the pull-through rate based on changes in pricing and actual borrower behavior using a |
83
Table of Contents
| historical analysis of loan closing data and “fallout” data with respect to the number of commitments that have historically remained unexercised. |
Gain on sale of loans increased by $203.0 million or 84.9% for the six months ended June 30, 2020 compared to that for the six months ended June 30, 2019 due to a $6.0 billion or 73.0% increase in loan sales for the six months ended June 30, 2020 compared to that for the six months ended June 30, 2019.
The fair value of our originated MSRs increased by $70.3 million or 158.2% for the six months ended June 30, 2020 compared to that for the six months ended June 30, 2019. This increase was caused by an increase in the percentage of our loans sold for which we continued to act as the servicer (i.e., on a “service retained” basis). During the six months ended June 30, 2020, we retained 85.1% of our origination volume compared to 58.7% of our origination volume for the six months ended June 30, 2019.
Adjustments to the fair value of our MLHS and IRLCs, net of any related changes in the fair value of our forward delivery commitments, resulted in a net gain of $143.7 million for the six months ended June 30, 2020 compared to a net gain of $19.0 million for the six months ended June 30, 2019. This increased gain primarily resulted from decreased interest rates and increased origination volume. Additionally, in response to our increased origination volume, our origination fee income increased by $15.1 million or 52.7% for the six months ended June 30, 2020 compared to that for the six months ended June 30, 2019.
Our provision for investor reserves increased by $7.4 million or 202.4% for the six months ended June 30, 2020 compared to that for the six months ended June 30, 2019. This increase resulted from our increased origination volume, as well as from our decision to increase our investor loss reserve because of the potential effects of the COVID-19 pandemic. As interest rates declined and prepayment speeds increased over this period, early pay-offs increased by 65% which resulted in an increase in early pay-off fees. Early pay-off fees are equal to the amount of the gain on sale premium received from the investors who purchase our loans that we must return to those investors when loans sold to them are repaid before a specified point in time. In addition, we experienced a 9% increase in investor repurchase and indemnity claims on loans sold to investors for the six months ended June 30, 2020 compared to that for the six months ended June 30, 2019. Each of these factors, increased early pay-off fees and increased repurchase and indemnity claims on loans sold to investors, influenced our decision to increase our provision for investor reserves as indicated above.
Loan Servicing and Other Fees
The table below provides additional details regarding our loan servicing and other fees are described below for the periods presented.
| Six Months Ended June 30, |
||||||||||||||||
| ($ in thousands) |
2020 | 2019 | $ Change | % Change | ||||||||||||
| Servicing fee income |
$ | 74,178 | $ | 66,109 | $ | 8,069 | 12.2 | % | ||||||||
| Other ancillary fees |
2,636 | 2,899 | (263 | ) | (9.1 | )% | ||||||||||
| Loan modification fees |
361 | 361 | — | 0.0 | % | |||||||||||
| Interest on impound accounts |
(865 | ) | (932 | ) | 67 | (7.2 | )% | |||||||||
|
|
|
|
|
|
|
|
|
|||||||||
| Total loan servicing and other fees |
$ | 76,310 | $ | 68,437 | $ | 7,873 | 11.5 | % | ||||||||
|
|
|
|
|
|
|
|
|
|||||||||
84
Table of Contents
The table below provides additional details regarding our servicing portfolio composition and key performance indicators as of and for the periods presented.
| Six Months Ended June 30, |
||||||||||||||||
| ($ and units in thousands) |
2020 | 2019 | Change | % Change | ||||||||||||
| Beginning UPB of servicing portfolio(1) |
$ | 49,326,579 | $ | 45,496,129 | $ | 3,830,450 | 8.4 | % | ||||||||
| New UPB origination additions(2) |
14,558,875 | 8,542,837 | 6,016,038 | 70.4 | % | |||||||||||
| Less: |
||||||||||||||||
| UPB originations sold service released(3) |
2,145,044 | 3,237,884 | (1,092,840 | ) | (33.8 | )% | ||||||||||
| Loan prepayments |
8,223,361 | 2,730,731 | 5,492,630 | 201.1 | % | |||||||||||
| Loan principal reductions |
692,900 | 628,976 | 63,924 | 10.2 | % | |||||||||||
| Loan foreclosures |
29,821 | 42,175 | (12,354 | ) | (29.3 | )% | ||||||||||
|
|
|
|
|
|
|
|
|
|||||||||
| Ending UPB of servicing portfolio |
$ | 52,794,328 | $ | 47,399,200 | $ | 5,395,128 | 11.4 | % | ||||||||
|
|
|
|
|
|
|
|
|
|||||||||
| Average UPB of servicing portfolio |
$ | 51,060,454 | $ | 46,447,665 | $ | 4,612,789 | 9.9 | % | ||||||||
| Weighted average servicing fee |
0.31 | % | 0.29 | % | 0.02 | % | 6.9 | % | ||||||||
| Weighted average note rate |
4.0 | % | 4.3 | % | (0.3 | )% | (7.0 | )% | ||||||||
| Weighted average prepayment speed(4) |
22.5 | % | 16.6 | % | 5.9 | % | 35.5 | % | ||||||||
| Weighted average credit score |
723 | 719 | 4 | 0.6 | % | |||||||||||
| Weighted average loan age (in months) |
27.8 | 29.2 | (1.4 | ) | (4.8 | )% | ||||||||||
| Weighted average loan-to-value |
83.4 | % | 84.4 | % | (1.0 | )% | (1.2 | )% | ||||||||
| MSR multiple (period end)(5) |
2.2 | 2.9 | (0.7 | ) | (24.1 | )% | ||||||||||
| Loans serviced (period end) |
249 | 229 | 20 | 8.7 | % | |||||||||||
| Loans delinquent 60-plus days (period end) |
9.2 | 3.3 | 5.9 | 178.8 | % | |||||||||||
| Loan delinquency rate 60-plus days (period end) |
3.5 | % | 1.2 | % | 2.3 | % | 191.7 | % | ||||||||
| (1) | We purchased two servicing portfolios totaling $1.1 billion and $0.8 billion as of June 30, 2020 and 2019, respectively, that are currently being subserviced by a third party and are excluded from these numbers. |
| (2) | Includes all in-house loans originated in period, irrespective if it is eventually sold, service retained or service released. |
| (3) | Represents loans sold for which we do not continue to act as the servicer of the loan. |
| (4) | Represents the percentage of UPB that will pay off ahead of time in each period, calculated as an annual rate. |
| (5) | Represents a metric used to determine the relative value of our MSRs in relation to our annualized retained servicing fee. It is calculated by dividing (a) the fair market value of our MSRs as of a specified date by (b) the weighted average annualized retained servicing fee for our servicing portfolio as of such date. We exclude purchased MSRs from this calculation because our servicing portfolio consists primarily of originated MSRs and, consequently, purchased MSRs do not have a material impact on our weighted average service fee. |
Total loan servicing and other fees increased by $7.9 million or 11.5% for the six months ended June 30, 2020 compared to that for the six months ended June 30, 2019, which is consistent with our average servicing portfolio growth of 9.9% for the twelve months ended June 30, 2020. We expect, however, that our servicing fee income will decline due to certain of our clients electing to accept forbearance relief under the CARES Act. Those clients are currently not making their mortgage payments and the duration of the CARES Act forbearance period is uncertain. We have experienced a decline in other ancillary fee income of $0.3 million or 9.1% for the six months ended June 30, 2020 compared to that for the six months ended June 30, 2019, reflecting our inability to resume charging late fees until the termination of the CARES Act forbearance period.
85
Table of Contents
Valuation Adjustment of Mortgage Servicing Rights
The below table presents our MSR valuation adjustment for the periods presented.
| Six Months Ended June 30, |
||||||||||||||||
| ($ in thousands) |
2020 | 2019 | $ Change | % Change | ||||||||||||
| MSR valuation adjustment |
$ | (204,810 | ) | $ | (160,222 | ) | $ | (44,588 | ) | 27.8 | % | |||||
The fair value of our MSRs declined by $204.8 million for the six months ended June 30, 2020 compared to a decline of $160.2 million for the six months ended June 30, 2019. The fair value of our MSRs generally declines as interest rates decline and prepayments increase. According to the MBA Mortgage Finance Forecast, average 30-year mortgage rates declined by 50 basis points during the six months ended June 30, 2020. Additionally, due to the COVID-19 pandemic, our 60-plus day delinquency rate on our servicing portfolio increased to 3.5% as of June 30, 2020 from 1.2% as of June 30, 2019. Both of these factors resulted in a reduction in the fair value of our MSRs.
Interest Income
Interest income increased by $1.6 million or 6.4% for the six months ended June 30, 2020 compared to that for the six months ended June 30, 2019. Although our origination volume increased by 69.5% for the six months ended June 30, 2020 compared to that for the six months ended June 30, 2019, our interest earned on loans funded only increased by 6.4% over the comparative period. This was primarily due to a decline in our average note rate on loans originated of 3.5% for the six months ended June 30, 2020 compared to 4.7% for the six months ended June 30, 2019.
Interest Expense
Interest expense increased by $4.3 million or 18.6% for the six months ended June 30, 2020 compared to that for the six months ended June 30, 2019. Although interest rates declined, we incurred additional interest expense related to our warehouse lines of credit. Interest expense related to our warehouse lines of credit increased by $1.1 million or 8.3% for the six months ended June 30, 2020 compared to that for the six months ended June 30, 2019. This expense was incurred in connection with additional borrowings to support our increased origination volume.
Interest expense also includes costs incurred for payments of interest with respect to our MSR notes payable and our early buyout facility. As of June 30, 2020, our outstanding borrowing under the MSR notes payable and early buy out facility totaled $222.1 million compared to $153.0 million as of June 30, 2019.
Payoff interest expense increased by $2.6 million or 136.5% for the six months ended June 30, 2020 compared to that for the six months ended June 30, 2019. Most of this increase was due to increased payoff volume. When a client pays off their loan with us, the client pays interest only up until the date of payoff. As a seller-servicer, however, we are required to remit the full month of interest to the investors who purchase the loans we originate, despite the fact that the client will not pay a full month of interest for that month. Our loan prepayments increased by $5.5 billion or 201.1% for the six months ended June 30, 2020 compared to that for the six months ended June 30, 2019.
Other Income
Changes in other income for the six months ended June 30, 2020 compared to that for the six months ended June 30, 2019 were immaterial to the overall results of operations.
86
Table of Contents
Expenses
| Six Months Ended June 30, |
||||||||||||||||
| ($ in thousands) |
2020 | 2019 | $ Change | % Change | ||||||||||||
| Salaries, commission and benefits |
$ | 376,898 | $ | 241,316 | $ | 135,582 | 56.2 | % | ||||||||
| Occupancy, equipment and communication |
26,955 | 26,942 | 13 | 0.0 | % | |||||||||||
| General and administrative |
48,192 | 28,624 | 19,568 | 68.4 | % | |||||||||||
| Provision for foreclosure losses |
1,860 | 774 | 1,086 | 140.3 | % | |||||||||||
| Depreciation and amortization |
3,146 | 3,824 | (678 | ) | (17.7 | )% | ||||||||||
|
|
|
|
|
|
|
|
|
|||||||||
| Total expenses |
$ | 457,051 | $ | 301,480 | $ | 155,571 | 51.6 | % | ||||||||
|
|
|
|
|
|
|
|
|
|||||||||
Salaries, Commission and Benefits
Salaries, commission and benefits expense increased by $135.6 million or 56.2% for the six months ended June 30, 2020 compared to that for the six months ended June 30, 2019. This increase resulted from increased variable incentive compensation paid to our origination teams and our hiring of additional employees to support the increases in our origination and servicing volumes.
A breakdown of the components of salaries, commissions and benefits expense is provided below.
| Salaries, Commission and Benefits | Six Months Ended June 30, |
|||||||||||||||
| ($ in thousands) |
2020 | 2019 | $ Change | % Change | ||||||||||||
| Commission |
$ | 210,710 | $ | 116,884 | $ | 93,826 | 80.3 | % | ||||||||
| Salaries |
117,068 | 96,997 | 20,071 | 20.7 | % | |||||||||||
| Benefits |
49,120 | 27,435 | 21,685 | 79.0 | % | |||||||||||
|
|
|
|
|
|
|
|
|
|||||||||
| Total salaries, commission and benefits expense |
$ | 376,898 | $ | 241,316 | $ | 135,582 | 56.2 | % | ||||||||
|
|
|
|
|
|
|
|
|
|||||||||
Commission expense increased by $93.8 million or 80.3% for the six months ended June 30, 2020 compared to that for the six months ended June 30, 2019. Commission expense includes variable incentive compensation that is paid to producers based on loan closings and variable incentive compensation paid to sales managers based on branch expense management. The variable incentive compensation that is paid to producers based on loan closings increased for the six months end June 30, 2020 compared to that for the six months ended June 30, 2019 because of the increase in our origination during this period. The variable incentive compensation paid to sales managers based on branch expense management increased by $28.5 million or 137% because loan origination volume increased during this period, despite branch fixed costs remaining unchanged, which created an opportunity for sales managers to earn additional variable compensation based on branch expense management.
Salaries expense increased by $20.1 million or 20.7% for the six months ended June 30, 2020 compared to that for the six months ended June 30, 2019. Salaries expense increased because the Company hired additional temporary employees and paid increased variable bonus and overtime to support the increase in our origination and servicing volumes during this period.
Benefits expense increased by $21.7 million or 79.0% for the six months ended June 30, 2020 compared to that for the six months ended June 30, 2019. This increase resulted mostly from increased employment taxes related to increased personnel expenses.
87
Table of Contents
Occupancy, Equipment and Communication
Occupancy, equipment and communication expense remained unchanged for the six months ended June 30, 2020 compared to that for the six months ended June 30, 2019. A breakdown of the components of occupancy, equipment and communication expense is provided below.
| Occupancy, Equipment and Communication Expense | Six Months Ended | |||||||||||||||
| ($ in thousands) |
2020 | 2019 | $ Change | % Change | ||||||||||||
| Occupancy |
$ | 16,279 | $ | 16,707 | (428 | ) | (2.6 | )% | ||||||||
| Equipment |
3,240 | 3,350 | (110 | ) | (3.3 | )% | ||||||||||
| Communication |
7,436 | 6,885 | 551 | 8.0 | % | |||||||||||
|
|
|
|
|
|
|
|
|
|||||||||
| Total occupancy, equipment and communication expense |
$ | 26,955 | $ | 26,942 | 13 | 0.0 | % | |||||||||
|
|
|
|
|
|
|
|
|
|||||||||
Occupancy costs remained unchanged for the six months ended June 30, 2020 compared to that for the six months ended June 30, 2019. Occupancy costs generally consist of fixed costs and remain consistent except for the typical increase in building rental expense each year, which is usually aligned with inflation, and except for any increases associated with new acquisitions, expansion into new territories and entry into new material building leases. We incurred a slight decrease in occupancy and equipment costs for the six months ended June 30, 2020, compared to that for the six months ended June 30, 2019, because, as more of our employees were working remotely, we did not renew some of our leased office space. Our communication expense increased by approximately $0.6 million for the six months ended June 30, 2020 compared to that for the six months ended June 30, 2019. This increase was primarily due to most of our employees working remotely because of COVID-19-related restrictive measures.
General and Administrative
General and administrative expense increased by $19.6 million or 68.4% for the six months ended June 30, 2020 compared to that for the six months ended June 30, 2019. A breakdown of general and administrative expense is provided below.
| General and Administrative Expense | Six Months Ended June 30, |
|||||||||||||||
| ($ in thousands) |
2020 | 2019 | $ Change | % Change | ||||||||||||
| Contingent liability fair value adjustment |
20,024 | 3,054 | 16,970 | 555.7 | % | |||||||||||
| Professional fees |
12,192 | 10,441 | 1,751 | 16.8 | % | |||||||||||
| Advertising |
8,839 | 8,505 | 334 | 3.9 | % | |||||||||||
| Office supplies, travel and entertainment |
4,488 | 5,138 | (650 | ) | (12.7 | )% | ||||||||||
| Miscellaneous |
2,649 | 1,486 | 1,163 | 78.3 | % | |||||||||||
|
|
|
|
|
|
|
|
|
|||||||||
| Total general and administrative expense |
48,192 | 28,624 | 19,568 | 68.4 | % | |||||||||||
|
|
|
|
|
|
|
|
|
|||||||||
Approximately $17.0 million of this $19.6 million increase in general and administrative expense resulted from an adjustment to the fair value of the contingent liabilities related to our completed acquisitions.
Professional fees increased by 16.8% or $1.8 million for the for the six months ended June 30, 2020 compared to those for the six months ended June 30, 2019. This increase in professional fees arose primarily from an increase in fees paid to third party quality control vendors to support the growth in our origination and servicing volume during the period.
Office supplies, travel and entertainment expense decreased by $0.7 million or 12.7% for the six months ended June 30, 2020 compared to that for the six months ended June 30, 2019. This decrease was primarily due to our employees working remotely as a result of COVID-19-related restrictive measures.
88
Table of Contents
Miscellaneous expense increased by $1.2 million or 78.3% for the six months ended June 30, 2020 compared to that for the six months ended June 30, 2019. This increase was due to higher miscellaneous loan level fees arising from our increased origination and servicing volume during the period.
Provision for Foreclosure Losses
Provision for foreclosure losses expense increased by $1.1 million or 140.3% during the six months ended June 30, 2020 compared to that for the six months ended June 30, 2019. Although we have seen a decrease in overall foreclosure starts and sales due to the CARES Act’s foreclosure moratorium, we have elected to increase our foreclosure loss reserves in anticipation of an increase in foreclosures after that moratorium is lifted. We estimate that, had the CARES Act’s foreclosure moratorium not been in effect, the number of our loans in foreclosure would have been higher during the six months ended June 30, 2020. Additionally, we expect that the increase in foreclosure proceedings after the CARES Act’s foreclosure moratorium is lifted will likely create a backlog and slow the judicial foreclosure process, which, in turn, will increase the length of foreclosure periods and result in higher foreclosure losses expense. For these reasons, we increased our provision for foreclosure losses accordingly.
Depreciation and Amortization
Depreciation and amortization decreased by $0.7 million or 17.7% for the six months ended June 30, 2020 compared to that for the six months ended June 30, 2019 primarily due to fewer equipment purchases and leasehold improvements for the period.
Results of Operations for the Years Ended December 31, 2019 and 2018
| Consolidated Statement of Operations |
Year Ended December 31, |
|||||||||||||||
| ($ in thousands) |
2019 | 2018 | $ Change | % Change | ||||||||||||
| Loan origination fees and gain on sale of loans, net |
$ | 820,814 | $ | 616,608 | $ | 204,206 | 33.1 | % | ||||||||
| Loan servicing and other fees |
142,705 | 123,681 | 19,024 | 15.4 | % | |||||||||||
| Valuation adjustment of mortgage servicing rights |
(255,219 | ) | (17,050 | ) | (238,169 | ) | 1,396.9 | % | ||||||||
| Interest income |
58,787 | 43,676 | 15,111 | 34.6 | % | |||||||||||
| Interest expense |
(55,391 | ) | (44,002 | ) | (11,389 | ) | 25.9 | % | ||||||||
| Other income |
1,193 | 6 | 1,187 | NM | ||||||||||||
|
|
|
|
|
|
|
|
|
|||||||||
| Net revenue |
712,889 | 722,919 | (10,030 | ) | (1.4 | )% | ||||||||||
|
|
|
|
|
|
|
|
|
|||||||||
| Salaries, commission and benefits |
578,170 | 510,253 | 67,917 | 13.3 | % | |||||||||||
| Occupancy, equipment and communication |
53,678 | 52,483 | 1,195 | 2.3 | % | |||||||||||
| General and administrative |
63,983 | 50,976 | 13,007 | 25.5 | % | |||||||||||
| Provision for foreclosure losses |
3,895 | 4,434 | (539 | ) | (12.2 | )% | ||||||||||
| Depreciation and amortization |
7,333 | 7,180 | 153 | 2.1 | % | |||||||||||
|
|
|
|
|
|
|
|
|
|||||||||
| Total expense |
707,059 | 625,326 | 81,733 | 13.1 | % | |||||||||||
|
|
|
|
|
|
|
|
|
|||||||||
| Income (loss) before income tax (benefit) expense |
5,830 | 97,593 | (91,763 | ) | (94.0 | )% | ||||||||||
| Income tax (benefit) expense |
253 | 24,260 | (24,007 | ) | (99.0 | )% | ||||||||||
|
|
|
|
|
|
|
|
|
|||||||||
| Net income |
$ | 5,577 | $ | 73,333 | $ | (67,756 | ) | (92.4 | )% | |||||||
|
|
|
|
|
|
|
|
|
|||||||||
Net income totaled $5.6 million for the year ended December 31, 2019 compared to $73.3 million for the year ended December 31, 2018. According to the MBA Mortgage Finance Forecast, average 30-year mortgage rates declined approximately 110 basis points during the year ended December 31, 2019, which led to an increase in refinance activity. Refinance activity represented 27.8% of origination volume in the U.S. mortgage market during the year ended December 31, 2018 compared to 41.5% of origination volume during the year ended December 31, 2019, according to Inside Mortgage Finance. As consumer demand
89
Table of Contents
for refinancing increased, our profit margins increased. Our origination volume increased by $5.3 billion or 32.3% for the year ended December 31, 2019 compared to that for the year ended December 31, 2018. Our loan servicing and other fees income increased by $19.0 million or 15.4% for the year ended December 31, 2019 compared to that for the year ended December 31, 2018.
Salaries, commission and benefits expense increased by $67.9 million or 13.3% for the year ended December 31, 2019 compared to that for the year ended December 31, 2018. This increase primarily resulted from increased variable incentive compensation paid to our origination teams. Revenue, excluding the loss associated with the adjustment to the fair value of our MSRs, increased by $228.1 million or 30.8%, while salaries, commission and benefits expense increased by $67.9 million or 13.3% for the year ended December 31, 2019 compared to that for the year ended December 31, 2018. General and administrative expense increased by $13.0 million or 25.5% for the year ended December 31, 2019 compared to that for the year ended December 31, 2018, which was primarily due to an upward adjustment to the fair value of the contingent liabilities related to our completed acquisitions. During the year ended December 31, 2019, we recorded $7.9 million of expense related to earn-out valuation adjustments compared to $2.6 million of income related to earn-out valuation adjustments during the year ended December 31, 2018. Depreciation and amortization expenses are generally fixed costs but slightly increased during this period in connection with our purchase of new equipment to support staffing increases.
Revenue
Loan Origination Fees and Gain on Sale of Loans, Net
The table below provides additional detail regarding the loan origination fees and gain on sale of loans, net is described below for the periods presented.
| Year Ended December 31, |
||||||||||||||||
| ($ in thousands) |
2019 | 2018 | $ Change | % Change | ||||||||||||
| Gain on sale of loans |
$ | 601,672 | $ | 454,272 | $ | 147,400 | 32.4 | % | ||||||||
| Fair value of originated MSRs |
141,742 | 124,795 | 16,947 | 13.6 | % | |||||||||||
| Fair value adjustment to MLHS and IRLCs |
14,241 | (2,943 | ) | 17,184 | NM | |||||||||||
| Changes in fair value of forward commitments |
5,295 | (9,806 | ) | 15,101 | NM | |||||||||||
| Origination fees |
68,067 | 56,776 | 11,291 | 19.9 | % | |||||||||||
| Provision for investor reserves |
(10,203 | ) | (6,486 | ) | (3,717 | ) | 57.3 | % | ||||||||
|
|
|
|
|
|
|
|
|
|||||||||
| Total loan origination fees and gain on sale of loans, net |
$ | 820,814 | $ | 616,608 | $ | 204,206 | 33.1 | % | ||||||||
|
|
|
|
|
|
|
|
|
|||||||||
90
Table of Contents
The table below provides additional detail regarding the composition of our origination volume and other key performance indicators for the periods presented.
| Year Ended December 31, | Change | % Change | ||||||||||||||
| ($ and units in thousands) |
2019 | 2018 | ||||||||||||||
| Loan origination volume by type: |
||||||||||||||||
| Conventional conforming |
$ | 12,524,685 | $ | 9,501,056 | $ | 3,023,629 | 31.8 | % | ||||||||
| Government |
6,543,065 | 4,457,888 | 2,085,177 | 46.8 | % | |||||||||||
| State housing |
1,711,012 | 1,515,396 | 195,616 | 12.9 | % | |||||||||||
| Non-agency |
932,906 | 935,389 | (2,483 | ) | (0.3 | )% | ||||||||||
|
|
|
|
|
|
|
|
|
|||||||||
| Total in-house originations(1) |
$ | 21,711,668 | $ | 16,409,729 | $ | 5,301,939 | 32.3 | % | ||||||||
|
|
|
|
|
|
|
|
|
|||||||||
| Brokered loans |
$ | 136,106 | $ | 105,145 | $ | 30,961 | 29.4 | % | ||||||||
| Total originations |
$ | 21,847,774 | $ | 16,514,874 | $ | 5,332,900 | 32.3 | % | ||||||||
| In-house loans closed |
81 | 66 | 15 | 22.7 | % | |||||||||||
| Average loan amount |
$ | 270 | $ | 250 | $ | 20 | 8.0 | % | ||||||||
| Purchase |
64.9 | % | 84.7 | % | (19.8 | )% | (23.4 | )% | ||||||||
| Refinance |
35.1 | % | 15.3 | % | 19.8 | % | 129.4 | % | ||||||||
| Service retained(2) |
66.5 | % | 73.2 | % | (6.7 | )% | (9.2 | )% | ||||||||
| Service released(3) |
33.5 | % | 26.8 | % | 6.7 | % | 25.0 | % | ||||||||
| Gain-on-sale margin (bps)(4) |
378 | 376 | 2 | 0.5 | % | |||||||||||
| Total locked volume(5) |
$ | 25,598,331 | $ | 18,813,759 | $ | 6,784,572 | 36.1 | % | ||||||||
| Pull-through adjusted lock volume(6) |
$ | 22,884,908 | $ | 16,706,618 | $ | 6,178,290 | 37.0 | % | ||||||||
| Weighted average loan-to-value |
84.9 | % | 85.8 | % | (0.9 | )% | (1.0 | )% | ||||||||
| Weighted average credit score |
732 | 717 | 15 | 2.1 | % | |||||||||||
| Weighted average note rate |
4.2 | % | 4.9 | % | (0.7 | )% | (14.3 | )% | ||||||||
| Days application to close |
41 | 41 | 0 | — | % | |||||||||||
| Days close to purchase by investors |
17 | 20 | (3 | ) | (15.0 | )% | ||||||||||
| Purchase recapture rate |
25.6 | % | 24.1 | % | 1.5 | % | 6.2 | % | ||||||||
| Refinance recapture rate |
63.9 | % | 40.0 | % | 23.9 | % | 59.8 | % | ||||||||
| (1) | Includes retail and correspondent loans and excludes brokered loans. |
| (2) | Represents loans sold for which we continue to act as the servicer. |
| (3) | Represents loans sold for which we do not continue to act as the servicer. |
| (4) | Represents the components of loan origination fees and gain on sales of loans, net described under “—Our Components of Revenue” divided by total in-house origination to derive basis points. Our gain-on-sale margin based on pull-through adjusted lock volume was 359 basis points and 369 basis points for the years ended December 31, 2019 and December 31, 2018, respectively. Gain-on-sale margin based on pull-through adjusted lock volume represents the components of loan origination fees and gain on sales of loans, net described under “—Our Components of Revenue” divided by pull-through adjusted lock volume. |
| (5) | Total locked volume represents the aggregate dollar value of the potential loans for which the Company has agreed to extend credit to consumers at specified rates for a specified period of time, subject to certain contingencies that are described in the interest rate lock commitments between the Company and each of those consumers. The total locked volume for a given period is representative of the interest rate lock commitments that the Company has initially entered into during that period. |
| (6) | Pull-through adjusted lock volume equal to total locked volume multiplied by pull-through rates of 89.40% and 88.80% for the years ended December 31, 2019 and December 31, 2018, respectively. We estimate the pull-through rate based on changes in pricing and actual borrower behavior using a historical analysis of loan closing data and “fallout” data with respect to the number of commitments that have historically remained unexercised. |
91
Table of Contents
Loan Origination and Gain on Sale of Loans, Net
Gain on sale of loans increased by $147.4 million or 32.4% for the year ended December 31, 2019 compared to that for the year ended December 31, 2018 due to a $4.8 billion or 29.3% increase in loan sales for the year ended December 31, 2019 compared to that for the year ended December 31, 2018.
The fair value of our originated MSRs increased by $16.9 million or 13.6% for the year ended December 31, 2019 compared to that for the year ended December 31, 2018. This increase was caused by an increase in our origination volume; however, this increase in origination volume was slightly offset by an increase in the percentage of our loans sold for which we did not continue to act as the servicer (i.e., on a “service released” basis). During the year ended December 31, 2019, we released 34% of our origination volume compared to 27% of our origination volume for the year ended December 31, 2018.
Adjustments to the recorded fair value of our MLHS and IRLCs, net of any related changes in the recorded fair value of our forward delivery commitments, resulted in a gain of $19.5 million for the year ended December 31, 2019 compared to a loss of $12.7 million for the year ended December 31, 2018. This gain resulted from decreased interest rates and increased origination volume. Additionally, in response to our increased origination volume, our origination fee income increased by $11.3 million or 19.9% for the year ended December 31, 2019 compared to that for the year ended December 31, 2018.
Our provision for investor reserves increased by $3.7 million or 57.3% for the year ended December 31, 2019 compared to that for the year ended December 31, 2018. This increase resulted from our increased origination volume, as well as an increase in the borrower prepayment fees paid to investors.
Loan Servicing and Other Fees
The table below provides additional details regarding our loan servicing and other fees are described below for the periods presented.
| ($ in thousands) |
Year Ended December 31, | $ Change | % Change | |||||||||||||
| 2019 | 2018 | |||||||||||||||
| Servicing fee income |
$ | 138,201 | $ | 119,647 | $ | 18,554 | 15.5 | % | ||||||||
| Other ancillary fees |
5,999 | 4,878 | 1,121 | 23.0 | % | |||||||||||
| Loan modification fees |
635 | 739 | (104 | ) | (14.1 | )% | ||||||||||
| Interest on impound accounts |
(2,130 | ) | (1,583 | ) | (547 | ) | 34.6 | % | ||||||||
|
|
|
|
|
|
|
|
|
|||||||||
| Total servicing fees |
$ | 142,705 | $ | 123,681 | $ | 19,024 | 15.4 | % | ||||||||
|
|
|
|
|
|
|
|
|
|||||||||
92
Table of Contents
The table below provides additional details regarding our servicing portfolio composition and key performance indicators for the period presented.
| Year Ended December 31, | ||||||||||||||||
| ($ and units in thousands) |
2019 | 2018 | Change | % Change | ||||||||||||
| Beginning UPB of servicing portfolio(1) |
$ | 45,496,129 | $ | 38,553,331 | $ | 6,942,798 | 18.0 | % | ||||||||
| New UPB origination additions(2) |
21,711,668 | 16,409,729 | 5,301,939 | 32.3 | % | |||||||||||
| Less: |
||||||||||||||||
| UPB originations sold service released(3) |
$ | 7,122,270 | $ | 4,527,134 | $ | 2,595,136 | 57.3 | % | ||||||||
| Loan prepayments |
9,374,095 | 3,701,085 | 5,673,010 | 153.3 | % | |||||||||||
| Loan principal reductions |
1,300,240 | 1,163,639 | 136,601 | 11.7 | % | |||||||||||
| Loan foreclosures |
84,613 | 75,073 | 9,540 | 12.7 | % | |||||||||||
|
|
|
|
|
|
|
|
|
|||||||||
| Ending UPB of servicing portfolio |
$ | 49,326,579 | $ | 45,496,129 | $ | 3,830,450 | 8.4 | % | ||||||||
|
|
|
|
|
|
|
|
|
|||||||||
| Average UPB of servicing portfolio |
$ | 47,411,354 | $ | 42,024,730 | $ | 5,386,624 | 12.8 | % | ||||||||
| Weighted average servicing fee |
0.30 | % | 0.29 | % | 0.01 | % | 3.4 | % | ||||||||
| Weighted average note rate |
4.2 | % | 4.3 | % | (0.1 | )% | (2.3 | )% | ||||||||
| Weighted average prepayment speed(4) |
17.5 | % | 11.4 | % | 6.1 | % | 53.5 | % | ||||||||
| Weighted average credit score |
721 | 720 | 1 | 0.1 | % | |||||||||||
| Weighted average loan age (in months) |
29.6 | 26.7 | 2.9 | 10.9 | % | |||||||||||
| Weighted average loan-to-value |
84.2 | % | 84.3 | % | (0.1 | )% | (0.1 | )% | ||||||||
| MSR multiple (period end)(5) |
2.9 | 3.9 | (1.0 | ) | (25.6 | )% | ||||||||||
| Loans serviced (period end) |
237 | 221 | 16 | 7.2 | % | |||||||||||
| Loans delinquent 60-plus days (period end) |
4.4 | 3.5 | 0.9 | 25.7 | % | |||||||||||
| Loan delinquency rate 60-plus days (period end) |
1.6 | % | 1.4 | % | 0.2 | % | 14.3 | % | ||||||||
| (1) | We purchased two servicing portfolios totaling $1.3 billion and $0.8 billion at December 31, 2019 and 2018, respectively, that are currently being subserviced by a third party and are excluded from these numbers. |
| (2) | Includes all in-house loans originated in period, irrespective if it is eventually sold, service retained or service released. |
| (3) | Represents loans sold for which we do not continue to act as the servicer of the loan. |
| (4) | Represents the percentage of UPB that will pay off ahead of time in each period, calculated as an annual rate. |
| (5) | Represents a metric used to determine the relative value of our MSRs in relation to our annualized retained servicing fee. It is calculated by dividing (a) the fair market value of our MSRs as of a specified date by (b) the weighted average annualized retained servicing fee for our servicing portfolio as of such date. We exclude purchased MSRs from this calculation because our servicing portfolio consists primarily of originated MSRs and, consequently, purchased MSRs do not have a material impact on our weighted average service fee. |
Total loan servicing and other fees increased $19.0 million or 15.4% for the year ended December 31, 2019 compared to that for the year ended December 31, 2018, which is consistent with our average servicing portfolio growth of 12.8% for the year ended December 31, 2019.
Valuation Adjustment of Mortgage Servicing Rights
The below table presents our MSR valuation adjustment for the periods presented.
| ($ in thousands) |
Year Ended December 31, |
$ Change | % Change | |||||||||||||
| 2019 | 2018 | |||||||||||||||
| MSR valuation adjustment |
$ | (255,219 | ) | $ | (17,050 | ) | $ | (238,169 | ) | 1,396.9 | % | |||||
93
Table of Contents
The fair value of our MSRs declined by $255.2 million for the year ended December 31, 2019 compared to a decline of $17.1 million for the year ended December 31, 2018. The fair value of our MSRs generally declines as interest rates decline and prepayments increase. According to the MBA Mortgage Finance Forecast, average 30-year mortgage rates declined by 110 basis points during the year ended December 31, 2019. Additionally, our 60-plus day delinquency rate on our servicing portfolio increased to 1.6% as of December 31, 2019 from 1.4% as of December 31, 2018. Both of these factors resulted in a reduction in the fair value of our MSRs.
Interest Income
Interest income increased by $15.1 million or 34.6% for the year ended December 31, 2019 compared to that for the year ended December 31, 2018. This is comparable to our origination volume increase of 32.3% for the comparative period.
Interest Expense
Interest expense increased $11.4 million or 25.9% for the year ended December 31, 2019 compared to that for the year ended December 31, 2018. Interest expense related to warehouse lines of credit increased by $5.5 million or 19.8% for the year ended December 31, 2019 compared to the year ended December 31, 2018. This expense was incurred in connection with additional borrowings to support our increased origination volumes.
Payoff interest expense increased by $3.4 million or 124.1% for the year ended December 31, 2019 compared to the year ended December 31, 2018. Most of this increase was due to increased payoff volume. Our loan prepayments increased by $5.7 billion or 153.3% for the year ended December 31, 2019 compared to the year ended December 31, 2018.
Expense
| ($ in thousands) |
Year Ended December 31, |
$ Change | % Change | |||||||||||||
| 2019 | 2018 | |||||||||||||||
| Salaries, commission and benefits |
$ | 578,170 | $ | 510,253 | $ | 67,917 | 13.3 | % | ||||||||
| Occupancy, equipment and communication |
53,678 | 52,483 | 1,195 | 2.3 | % | |||||||||||
| General and administrative |
63,983 | 50,976 | 13,007 | 25.5 | % | |||||||||||
| Provision for foreclosure losses |
3,895 | 4,434 | (539 | ) | (12.2 | )% | ||||||||||
| Depreciation and amortization |
7,333 | 7,180 | 153 | 2.1 | % | |||||||||||
|
|
|
|
|
|
|
|
|
|||||||||
| Total expenses |
$ | 707,059 | $ | 625,326 | $ | 81,733 | 13.1 | % | ||||||||
|
|
|
|
|
|
|
|
|
|||||||||
Salaries, Commission and Benefits
Salaries, commission and benefits expense increased by $67.9 million or 13.3% for the year ended December 31, 2019 compared to that for the year ended December 31, 2018. A breakdown of the components of salaries, commissions and benefits expense is provided below.
| Salaries, Commission and Benefits | Year Ended December 31, |
$ Change | % Change | |||||||||||||
| ($ in thousands) |
2019 | 2018 | ||||||||||||||
| Commission |
$ | 303,736 | $ | 221,041 | $ | 82,695 | 37.4 | % | ||||||||
| Salaries |
211,868 | 222,703 | (10,835 | ) | (4.9 | )% | ||||||||||
| Benefits |
62,566 | 66,509 | (3,943 | ) | (5.9 | )% | ||||||||||
|
|
|
|
|
|
|
|
|
|||||||||
| Total salaries, commission and benefits expense |
$ | 578,170 | $ | 510,253 | $ | 67,917 | 13.3 | % | ||||||||
|
|
|
|
|
|
|
|
|
|||||||||
94
Table of Contents
Commission expense increased by $82.7 million or 37.4% for the year ended December 31, 2019 compared to that for the year ended December 31, 2018. This increase in commission expense resulted from an increase in our loan origination volume of 32.3% for the year ended December 31, 2019 compared to that for the year ended December 31, 2018.
Although our loan origination volume increased for the year ended December 31, 2019 compared to that for the year ended December 31, 2018, our salaries expense decreased by $10.8 million or 4.9% because of a reduction in staff for the year ended December 31, 2019 compared to that for the year ended December 31, 2018.
Benefits expense decreased by $3.9 million or 5.9% for the year ended December 31, 2019 compared to that for the year ended December 31, 2018. This decrease resulted from a decrease in our group insurance expense for salaried employees arising from the decreased staffing referenced above.
Occupancy, Equipment and Communication
Occupancy, equipment and communication expense increased by $1.2 million or 2.3% for the year ended December 31, 2019 compared to that for the year ended December 31, 2018. A breakdown of the components of occupancy, equipment and communication expense is provided below.
| Occupancy, Equipment and Communication Expense | Year Ended December 31, |
$ Change | % Change | |||||||||||||
| ($ in thousands) |
2019 | 2018 | ||||||||||||||
| Occupancy |
$ | 33,428 | $ | 32,127 | $ | 1,301 | 4.0 | % | ||||||||
| Equipment |
6,494 | 6,927 | (433 | ) | (6.3 | )% | ||||||||||
| Communication |
13,756 | 13,429 | 327 | 2.4 | % | |||||||||||
|
|
|
|
|
|
|
|
|
|||||||||
| Total occupancy, equipment and communication expense |
$ | 53,678 | $ | 52,483 | $ | 1,195 | 2.3 | % | ||||||||
|
|
|
|
|
|
|
|
|
|||||||||
Occupancy costs increased by $1.3 million or 4.0% for the year ended December 31, 2019 compared to that for the year ended December 31, 2018. Occupancy costs generally consist of fixed costs and remain consistent except for the typical increase in building rental expense each year, which is usually aligned with inflation, and except for any increases associated with new acquisitions, expansion into new territories and entry into new material building leases. The increase in our occupancy costs for the year ended December 31, 2019 compared to that for the year ended December 31, 2018 was related to our addition of twelve branch offices in connection with an acquisition during the period.
General and Administrative
General and administrative expense increased by $13.0 million or 25.5% for the year ended December 31, 2019 compared to that for the year ended December 31, 2018. A breakdown of general and administrative expense is provided below.
| General and Administrative Expense | Year Ended December 31, |
$ Change | % Change | |||||||||||||
| ($ in thousands) |
2019 | 2018 | ||||||||||||||
| Contingent liability fair value adjustment |
$ | 7,919 | $ | (2,643 | ) | $ | 10,562 | NM | ||||||||
| Professional fees |
23,434 | 20,015 | 3,419 | 17.1 | % | |||||||||||
| Advertising |
17,620 | 16,778 | 842 | 5.0 | % | |||||||||||
| Office supplies, travel and entertainment |
10,452 | 12,272 | (1,820 | ) | (14.8 | )% | ||||||||||
| Miscellaneous |
4,558 | 4,554 | 4 | 0.0 | % | |||||||||||
|
|
|
|
|
|
|
|
|
|||||||||
| Total general and administrative expense |
$ | 63,983 | $ | 50,976 | $ | 13,007 | 25.5 | % | ||||||||
|
|
|
|
|
|
|
|
|
|||||||||
Approximately $10.6 million of this $13.0 million increase in general and administrative expense resulted from an adjustment to the fair value of the contingent liabilities related to our completed acquisitions.
95
Table of Contents
Professional fees increased by 17.1% or $3.4 million for the for the year ended December 31, 2019 compared to that for the year ended December 31, 2018. This increase in professional fees arose primarily from a $3.0 million accrual relating to state tax matters and an increase in fees paid for services to support the growth in our origination and servicing volume during the period.
Office supplies, travel and entertainment expense decreased by $1.8 million or 14.8% for the year ended December 31, 2019 compared to that for the year ended December 31, 2018. This decrease was primarily due to the fact that we did not have an annual branch manager meeting in 2019, which reduced our meeting and travel expenses by approximately $1.5 million.
Advertising expense increased by $0.8 million or 5.0% for the year ended December 31, 2019 compared to that for the year ended December 31, 2018. This increase was due to increased loan origination volume during period.
Provision for Foreclosure Losses
Provision for foreclosure losses expense declined by $0.5 million or 12.2% for the year ended December 31, 2019 compared to that for the year ended December 31, 2018. We reserve for government loans based on historical loss experience as well as for loan-specific issues related to foreclosure. Our specific reserves decreased by $0.7 million for the year ended December 31, 2019 compared to that for the year ended December 31, 2018, which represented the majority of the decrease in expenses.
Depreciation and Amortization
Depreciation and amortization expense increased by $0.2 million for the year ended December 31, 2019 compared to that for the year ended December 31, 2018.
Summary Results by Segment for the Six Months ended June 30, 2020 and 2019 and the Years Ended December 31, 2019 and 2018
Our operations are comprised of two distinct but related reportable segments that we refer to as our origination and servicing segments. We operate our origination segment from approximately 200 office locations. Our licensed sales professionals and support staff cultivate deep relationships with our referral partners and clients and provide a customized approach to the loan transaction, whether it is a purchase or a refinance. Although our origination and servicing segments are separated for this presentation, management sees the two segments as intricately related and interdependent. We believe that our servicing segment provides a steady stream of revenue to support our origination segment and that, more importantly, our servicing segment positions us to build longstanding client relationships that drive repeat and referral business back to the origination segment to recapture our clients’ future mortgage transactions. In particular, the growth of our servicing segment is dependent on the continued growth of our origination volume because our servicing portfolio consists primarily of originated MSRs.
We measure the performance of our segments primarily based on their net income (loss) and cost to produce. See below for an overview and discussion of each of our segments’ results for the six months ended June 30, 2020 and June 30, 2019 and the years ended December 31, 2019 and December 31, 2018. These results do not include unallocated corporate costs.
96
Table of Contents
Origination
| For the Six Months Ended | For the Years Ended | |||||||||||||||
| ($ and units in thousands) |
June 30, 2020 |
June 30, 2019 |
December 31, 2019 |
December 31, 2018 |
||||||||||||
| Funded loans |
$ | 14,558,875 | $ | 8,542,837 | $ | 21,711,668 | $ | 16,409,729 | ||||||||
| Funded loans |
52 | 33 | 81 | 66 | ||||||||||||
|
|
|
|
|
|
|
|
|
|||||||||
| Loan origination fees and gain on sale |
$ | 730,459 | $ | 325,482 | $ | 817,293 | $ | 614,004 | ||||||||
| Interest income (expense) |
6,410 | 6,804 | 9,702 | 9,422 | ||||||||||||
| Other income (expense) |
25 | 25 | 38 | 33 | ||||||||||||
|
|
|
|
|
|
|
|
|
|||||||||
| Net revenue |
736,894 | 332,311 | 827,033 | 623,459 | ||||||||||||
|
|
|
|
|
|
|
|
|
|||||||||
| Salaries, commission and benefits |
350,043 | 230,685 | 548,056 | 480,280 | ||||||||||||
| Occupancy, equipment and communication |
24,155 | 24,045 | 48,115 | 46,986 | ||||||||||||
| Production technology |
9,370 | 9,198 | 18,625 | 12,271 | ||||||||||||
| General and administrative |
27,777 | 11,080 | 24,403 | 21,148 | ||||||||||||
| Depreciation and amortization |
2,601 | 3,335 | 6,417 | 6,392 | ||||||||||||
|
|
|
|
|
|
|
|
|
|||||||||
| Total expenses |
413,946 | 278,343 | 645,616 | 567,077 | ||||||||||||
|
|
|
|
|
|
|
|
|
|||||||||
| Net income allocated to origination |
$ | 322,948 | $ | 53,968 | $ | 181,417 | $ | 56,382 | ||||||||
|
|
|
|
|
|
|
|
|
|||||||||
Six months ended June 30, 2020 and 2019
The origination segment’s net income increased by $269.0 million or 498.4% for the six months ended June 30, 2020 compared to that for the six months ended June 30, 2019. This change was primarily driven by increased revenue earned from loan origination fees and gain on sale of loans, net of $405.0 million or 124.4% for the six months ended June 30, 2020 compared to that for the six months ended June 30, 2019. According to the MBA Mortgage Finance Forecast, average 30-year mortgage rates declined approximately 80 basis points from June 30, 2019 to June 30, 2020, which led to an increase in refinance activity. Refinance activity represented 59% of the origination volume in the U.S. mortgage market during the six months ended June 30, 2020 compared to 29% of the origination volume in the U.S. mortgage market during the six months ended June 30, 2019, according to Inside Mortgage Finance. As consumer demand for refinancing increased, our profit margins increased. Our total origination volume increased by 69.5% for the six months ended June 30, 2020 compared to that for the six months ended June 30, 2019.
Salaries, commission and benefits expense increased by $119.4 million or 51.7% for the six months ended June 30, 2020 compared to that for the six months ended June 30, 2019 due to increased variable incentive compensation paid to our origination teams and our hiring of additional employees to support the increases in our origination and servicing volumes. For the six months ended June 30, 2020, revenue increased by 121.7%, while salaries, commission and benefits expense increased by 51.7% compared to that for the six months ended June 30, 2019. Other attributable expenses, other than salaries, commission and benefits expense, increased by $16.2 million or 34.1% for the six months ended June 30, 2020 compared to that for the six months ended June 30, 2019. The majority of this increase related to a $17.0 million increase in the adjustment to the fair value of the contingent liabilities related to our completed acquisitions.
Years ended December 31, 2019 and 2018
The origination segment’s net income increased by $125.0 million or 221.8% for the year ended December 31, 2019 compared to that for the year ended December 31, 2018. This change was primarily driven by increased revenue earned from gain on sale of loans of $203.3 million or 33.1% for the year ended December 31, 2019 compared to that for the year ended December 31, 2018. According to the MBA
97
Table of Contents
Mortgage Finance Forecast, average 30-year mortgage rates declined approximately 110 basis points during the year ended December 31, 2019, which led to an increase in refinance activity. Refinance activity represented 27.8% of the origination volume in the U.S. mortgage market during the year ended December 31, 2018 compared to 41.5% of the origination volume during the year ended December 31, 2019, according to Inside Mortgage Finance. As consumer demand for refinancing increased, our profit margins increased. Our origination volume increased 32.3% for the year ended December 31, 2019 compared to that for the year ended December 31, 2018.
Salaries, commission and benefits expense increased by $67.8 million or 14.1% for the year ended December 31, 2019 compared to that for the year ended December 31, 2018 due to increased variable incentive compensation paid to our origination teams and our hiring of additional employees to support the increases in our origination and servicing volumes. For the year ended December 31, 2019, revenue increased by 32.7%, while salaries, commission and benefits expense increased by 14.1%, compared to that for the year ended December 31, 2018. Other attributable expenses, other than salaries, commission and benefits expense, increased by $10.8 million or 12.4% for the year ended December 31, 2019 compared to that for the year ended December 31, 2018. The majority of this increase related to a $10.6 million increase in the adjustment to the fair value of the contingent liabilities related to our completed acquisitions.
Servicing
| For the Six Months Ended | For the Years Ended | |||||||||||||||
| ($ and units in thousands) |
June 30, 2020 |
June 30, 2019 |
December 31, 2019 |
December 31, 2018 |
||||||||||||
| UPB of servicing portfolio (period end) |
$ | 52,794,328 | $ | 47,399,200 | $ | 49,326,579 | $ | 45,496,129 | ||||||||
| Loans serviced (period end) |
249 | 229 | 237 | 221 | ||||||||||||
|
|
|
|
|
|
|
|
|
|||||||||
| Loan servicing and other fees |
$ | 76,310 | $ | 68,437 | $ | 142,705 | $ | 123,681 | ||||||||
| Loan origination fees and gain on sale, net |
2,834 | 2,021 | 3,521 | 2,604 | ||||||||||||
|
|
|
|
|
|
|
|
|
|||||||||
| Total revenue |
79,144 | 70,458 | 146,226 | 126,285 | ||||||||||||
| Valuation adjustment to MSRs |
(204,810 | ) | (160,222 | ) | (255,219 | ) | (17,050 | ) | ||||||||
| Interest expense |
(2,611 | ) | (7 | ) | 2,674 | (2,728 | ) | |||||||||
|
|
|
|
|
|
|
|
|
|||||||||
| Net revenue |
(128,277 | ) | (89,771 | ) | (106,319 | ) | 106,507 | |||||||||
|
|
|
|
|
|
|
|
|
|||||||||
| Salaries, commission and benefits |
9,217 | 7,443 | 15,538 | 13,716 | ||||||||||||
| Occupancy, equipment and communication |
1,215 | 873 | 2,078 | 1,893 | ||||||||||||
| General and administrative |
3,520 | 2,492 | 5,145 | 4,498 | ||||||||||||
| Technology costs |
3,453 | 2,586 | 5,162 | 4,068 | ||||||||||||
| Provision for foreclosure losses |
1,860 | 774 | 3,895 | 4,434 | ||||||||||||
| Depreciation and amortization |
214 | 154 | 326 | 112 | ||||||||||||
|
|
|
|
|
|
|
|
|
|||||||||
| Total expenses |
19,479 | 14,322 | 32,144 | 28,721 | ||||||||||||
|
|
|
|
|
|
|
|
|
|||||||||
| Net income (loss) allocated to servicing |
$ | (147,756 | ) | $ | (104,093 | ) | $ | (138,463 | ) | $ | 77,786 | |||||
|
|
|
|
|
|
|
|
|
|||||||||
Six months ended June 30, 2020 and 2019
Our loan servicing segment’s net loss increased by $43.7 million or 41.9% for the six months ended June 30, 2020 compared to that for the six months ended June 30, 2019. This change was primarily driven by $204.8 million in adjustments to the fair value of our MSRs during the six months ended June 30, 2020 compared to $160.2 million in adjustments to the fair value of our MSRs during the six months ended June 30, 2019. The fair value of our MSRs generally declines as interest rates decline and as prepayments increase. According to the MBA Mortgage Finance Forecast, average 30-year mortgage rates declined by 50 basis points during the six months ended June 30, 2020. Additionally, due to the COVID-19 pandemic,
98
Table of Contents
our 60-plus day delinquency rate on our servicing portfolio increased to 3.5% as of June 30, 2020 from 1.2% as of June 30, 2019. Both of these factors resulted in a reduction in the fair value of our MSRs. Our income from loan servicing and other fees increased by 11.5% for the six months ended June 30, 2020 compared to the six months ended June 30, 2019, which was consistent with our average servicing portfolio growth of 9.9% for the six months ended June 30, 2020 compared to the six months ended June 30, 2019.
Years ended December 31, 2019 and 2018
Our servicing segment incurred a net loss of $138.5 million for the year ended December 31, 2019 compared to net income of $77.8 million for the year ended December 31, 2018. This change was primarily driven by $255.2 million in adjustments to the fair value of our MSRs during the year ended December 31, 2019 compared to $17.1 million in adjustments to the fair value of our MSRs during the year ended December 31, 2018. The fair value of our MSRs generally declines as interest rates decline and as prepayments increase. According to the MBA Mortgage Finance Forecast, average 30-year mortgage rates declined by 110 basis points during the year ended December 31, 2019. Additionally, our 60-plus day delinquency rate on our servicing portfolio increased to 1.6% as of December 31, 2019 from 1.4% as of December 31, 2018. Both of these factors resulted in a reduction in the fair value of our MSRs . Our income from loan servicing and other fees increased by $19.0 million or 15.4% for the year ended December 31, 2019 compared to that for the year ended December 31, 2018, which was consistent with our average servicing portfolio growth during this period.
Liquidity, Capital Resources and Cash Flows
Historically, our primary sources of liquidity have included:
| • | cash flows from our operations, including: |
| • | sale of whole loans into the secondary market; |
| • | loan origination fees; |
| • | servicing fee income; and |
| • | interest income on MLHS; |
| • | borrowings on warehouse lines of credit to originate mortgage loans; and |
| • | borrowings on our MSR notes payable. |
Historically, our primary uses of funds have included:
| • | cash flows from our operations, including but not limited to: |
| • | origination of MLHS; |
| • | payment of interest expense; and |
| • | payment of expenses; |
| • | repayments on warehouse lines of credit; |
| • | distributions to shareholders; and |
| • | acquisitions of other mortgage businesses. |
We are also subject to contingencies which may have a significant effect on the use of our cash.
In order to originate and aggregate loans for sale into the secondary market, we use our own working capital and borrow or obtain money on a short-term basis, primarily through committed and uncommitted loan funding facilities that we have established with large global banks.
Our loan funding facilities are primarily in the form of master repurchase agreements, which we refer to as “warehouse lines of credit.” Loans financed under these facilities are generally financed at
99
Table of Contents
approximately 97% to 98% of the principal balance of the loan (although certain types of loans are financed at lower percentages of the principal balance of the loan), which requires us to fund the balance from cash generated from our operations. Once closed, the underlying residential mortgage loan that is held for sale is pledged as collateral for the borrowing or advance that was made under these loan funding facilities. In most cases, the loans will remain in one of the loan funding facilities for only a short time, generally less than one month, until the loans are pooled and sold. During the time the loans are held for sale, we earn interest income from the borrower on the underlying mortgage loan. This income is partially offset by the interest and fees we must pay under the loan funding facilities.
When we sell a pool of loans in the secondary market, the proceeds received from the sale of the loans are used to pay back the amounts we owe on the loan funding facilities. We rely on the cash generated from the sale of loans to fund future loans and repay borrowings under our loan funding facilities. Delays or failures to sell loans in the secondary market could have an adverse effect on our liquidity position.
As discussed in Note 9, Warehouse Lines of Credit to the condensed consolidated financial statements included elsewhere in this prospectus, as of June 30, 2020, we had seven different loan funding facilities in different amounts and with various maturities. As of the date of this prospectus, the aggregate available amount under our loan facilities was approximately $2.9 billion, with combined outstanding balances as of August 31, 2020 of approximately $1.9 billion.
As discussed in Note 10, Notes Payable to the condensed consolidated financial statements included elsewhere in this prospectus, as of June 30, 2020, we had three different MSR notes payable in different amounts with different maturities. As of August 31, 2020, the aggregate available amount under our MSR notes payable was $415.0 million, with combined outstanding balances of $186.0 million and unutilized capacity of $229.0 million. The borrowing capacity under our MSR notes payable is restricted by the valuation of our servicing portfolio. We aim to operate with advance rates on our MSR notes payable of approximately 35% over the long-term.
The amount of financing advanced on each individual loan under our loan funding facilities is determined by agreed upon advance rates but may be less than the stated rate due to fluctuations in the market value of the mortgage loans securing the financings. If the lenders providing the funds under our loan funding facilities determine that the value of the loans serving as collateral for our borrowings under those facilities has decreased, they can initiate a margin call to require us to provide additional collateral or reduce the amount outstanding with respect to those loans. Our inability or unwillingness to satisfy such a request could result in the termination of the related facilities and a potential default under our other loan funding facilities. In addition, a large unanticipated margin call could have a material adverse effect on our liquidity.
The amount owed and outstanding under our loan funding facilities fluctuates significantly based on our origination volume, the amount of time it takes us to sell the loans we originate and the amount of loans we are self-funding with cash. We may from time to time post surplus cash as additional collateral to buy-down the effective interest rates of certain loan funding facilities or to self-fund a portion of our loan originations. As of June 30, 2020, we had posted $132.0 million in cash as additional collateral. We have the ability to draw back this additional collateral at any time, unless a margin call has been made or a default has occurred under the relevant facilities.
We also have an early buyout facility that allows us to purchase certain delinquent GNMA loans that we service and finance them on the facility until the loan is cured or subsequently sold. The capacity of this uncommitted facility is $75.0 million and, at June 30, 2020, the outstanding balance on the facility was $34.1 million.
Our loan funding facilities and MSR notes payable generally require us to comply with certain operating and financial covenants and the availability of funds under these facilities are subject to, among other conditions, our continued compliance with these covenants. These financial covenants include, but are not limited to, maintaining a certain (i) minimum tangible net worth, (ii) minimum liquidity and (iii) a maximum ratio of total liabilities or total debt to tangible net worth and satisfying certain pre-tax net income
100
Table of Contents
requirements. A breach of these covenants could result in an event of default under our funding facilities, which would allow the related lenders to pursue certain remedies. In addition, each of these facilities includes cross default or cross acceleration provisions that could result in all of our funding facilities terminating if an event of default or acceleration of maturity occurs under any one of them. We believe we were in compliance with all of these covenants as of June 30, 2020, December 31, 2019 and December 31, 2018.
Our debt obligations are summarized below by facility as of June 30, 2020:
| Facility ($ in thousands) |
Outstanding Indebtedness |
Total Facility Size(1) |
Maturity Date(1) | |||||||||
| Warehouse lines of credit |
$ | 450,965 | $ | 800,000 | October 22, 2020 | |||||||
| 118,652 | 250,000 | August 31, 2021 | ||||||||||
| 429,619 | 700,000 | February 19, 2021 | ||||||||||
| 141,452 | 200,000 | June 2, 2021 | ||||||||||
| 140,434 | 299,000 | November 10, 2020 | ||||||||||
| 282,677 | 500,000 | (2) | July 15, 2021 | |||||||||
| 93,833 | 200,000 | April 29, 2021 | ||||||||||
| Early buyout facility |
34,080 | 75,000 | February 28, 2024 | (3) | ||||||||
| MSR notes payable |
63,000 | 150,000 | (4) | September 30, 2022 | ||||||||
| 85,000 | 200,000 | (5) | June 4, 2022 | |||||||||
| $ | 40,000 | $ | 65,000 | July 15, 2021 | ||||||||
| (1) | Total facility size and maturity date include contractual changes through the date of this prospectus. |
| (2) | Amounts drawn on the MSR notes payable with this lender reduce the facility size available under the warehouse line of credit with this lender by an equal and offsetting amount. |
| (3) | Each buyout transaction carries a maximum term of four years from the date of repurchase. |
| (4) | Facility provides for committed amount of $100.0 million, which can be increased up to $150.0 million. |
| (5) | Facility provides for committed amount of $135.0 million, which can be increased up to $200.0 million. |
The investors to whom we sell mortgage loans we originate in the secondary market require us to abide by certain operating and financial covenants. These covenants include maintaining (i) a certain minimum net worth, (ii) a certain minimum liquidity, (iii) a certain minimum of total liquid assets, (iv) a certain maximum ratio of adjusted net worth to total assets and (v) fidelity bond and mortgage servicing errors and omissions coverage. A breach of these covenants could result in an event of default and could disallow us to continue selling mortgage loans to one or all of these investors in the secondary market which, in turn, could have a significant impact on our liquidity and results of operations. We believe we were in compliance with all of these covenants as of June 30, 2020, December 31, 2019 and December 31, 2018.
When we sell loans in the secondary market, we have the option to sell them service released or service retained. The decision whether to sell a loan that we originated service released or service retained is based on factors such as execution and price, liquidity needs and the desire to retain the related client relationship. When we sell a loan service retained, we continue to act as the servicer for the life of the loan. We rely on income from loan servicing and other fees over the life of the loan to generate cash. Certain investors have different rules for the servicer to follow should a loan go into default. As the servicer, we may
101
Table of Contents
be legally obligated to make cash payments to the investor who purchased the loan, should the borrower discontinue making payments on the loan. This could have a negative impact to our cash and liquidity, however, we may be able to use other borrower prepayments to cover delinquencies. Should delinquencies significantly increase, or prepayments significantly decrease, we could be forced to use our own cash or borrow on other types of financing in order to make the required monthly payments to the investors who have purchased loans from us. We may also be contractually required to repurchase or indemnify loans with origination defects. See “—Contractual Obligations” for further details regarding repurchases and indemnifications.
Cash Flows
Our cash flows for the six months ended June 30, 2020 and June 30, 2019 and the years ended December 31, 2019 and December 31, 2018 are summarized below.
| Six Months Ended June 30, |
Years Ended December 31, |
|||||||||||||||
| ($ in thousands) |
2020 | 2019 | 2019 | 2018 | ||||||||||||
| Net cash used in operating activities |
$ | (283,778 | ) | $ | (301,051 | ) | $ | (424,707 | ) | $ | (31,765 | ) | ||||
| Net cash used in investing activities |
(15,649 | ) | (2,338 | ) | (13,488 | ) | (25,638 | ) | ||||||||
| Net cash used in financing activities |
341,154 | 317,702 | 482,175 | 47,236 | ||||||||||||
|
|
|
|
|
|
|
|
|
|||||||||
| Net increase (decrease) in cash, cash equivalents and restricted cash |
$ | 41,727 | $ | 14,313 | $ | 43,980 | $ | (10,167 | ) | |||||||
|
|
|
|
|
|
|
|
|
|||||||||
Operating activities
Our cash flows from operating activities are primarily influenced by changes in the levels of inventory of loans held for sale, as shown below.
| Six Months Ended June 30, |
Years Ended December 31, |
|||||||||||||||
| ($ in thousands) |
2020 | 2019 | 2019 | 2018 | ||||||||||||
| Loans held for sale |
$ | (433,767 | ) | $ | (358,340 | ) | $ | (533,610 | ) | $ | (12,583 | ) | ||||
| Other operating sources |
149,989 | 57,289 | 108,903 | (19,182 | ) | |||||||||||
|
|
|
|
|
|
|
|
|
|||||||||
| Net cash used in operating activities |
$ | (283,778 | ) | $ | (301,051 | ) | $ | (424,707 | ) | $ | (31,765 | ) | ||||
|
|
|
|
|
|
|
|
|
|||||||||
Cash used in operating activities decreased for the six months ended June 30, 2020 compared to that for the six months ended June 30, 2019. The increase in cash used for loans held for sale was partially offset by cash provided by other operating sources, which was primarily driven by increases in net income from operations for the six months ended June 30, 2020 compared to a net loss from operations for the six months ended June 30, 2019.
Cash used in operating activities increased for the year ended December 31, 2019 compared to that for the year ended December 31, 2018. The increase in cash used for loans held for sale was partially offset by cash provided by other operating sources, which was primarily due to an increase in the projected duration of the cash flows to be earned with respect to our MSRs.
Investing activities
Our investing activities primarily consist of purchases of property and equipment and acquisitions. Cash used in investing activities for the six months ended June 30, 2020 increased compared to that for the six months ended June 30, 2019, which was primarily due to certain payments made to the Company’s parent entity. Cash used in investing activities for the year ended December 31, 2019 decreased compared to that for the year ended December 31, 2018, which was primarily due to decreased acquisition expense.
102
Table of Contents
Financing activities
Our cash flows from financing activities are primarily influenced by changes in the levels of warehouse lines of credit used to fund loan originations.
| Six Months Ended June 30, |
Years Ended December 31, |
|||||||||||||||
| 2020 | 2019 | 2019 | 2018 | |||||||||||||
| ($ in thousands) |
||||||||||||||||
| Warehouse lines of credit |
$ | 386,104 | $ | 338,052 | $ | 463,453 | $ | 3,740 | ||||||||
| Other financing sources |
(44,950 | ) | (20,350 | ) | 18,722 | 43,496 | ||||||||||
|
|
|
|
|
|
|
|
|
|||||||||
| Net cash used in financing activities |
$ | 341,154 | $ | 317,702 | $ | 482,175 | $ | 47,236 | ||||||||
|
|
|
|
|
|
|
|
|
|||||||||
Cash used in other financing sources for the six months ended June 30, 2020 increased compared to that for the six months ended June 30, 2019. This increase in cash flows used in other financing sources was primarily driven by the increase in net repayments on our MSR notes payable from $7.0 million during the six months ended June 30, 2019 to $30.0 million during the six months ended June 30, 2020. Cash provided by other financing sources for the year ended December 31, 2019 decreased from the year ended December 31, 2018. This decrease in cash flows provided by other financing sources was primarily driven by the increase in repayments on our MSR notes payable from $5.0 million during the year ended December 31, 2018 to $29.3 million during the year ended December 31, 2019.
Balance Sheet Analysis
The following is a summary of key balance sheet items as of the dates presented.
| June 30, 2020 |
December 31, 2019 |
December 31, 2018 |
||||||||||
| ($ in thousands) |
||||||||||||
| Assets | ||||||||||||
| Cash and cash equivalents |
$ | 148,462 | $ | 106,735 | $ | 62,755 | ||||||
| Mortgage loans held for sale |
1,982,521 | 1,504,842 | 966,171 | |||||||||
| Mortgage servicing rights, net |
336,687 | 418,402 | 511,852 | |||||||||
| GNMA loans subject to repurchase right |
948,922 | 404,344 | 321,049 | |||||||||
| Other |
286,413 | 173,090 | 176,424 | |||||||||
|
|
|
|
|
|
|
|||||||
| Total assets |
$ | 3,703,005 | $ | 2,607,413 | $ | 2,038,251 | ||||||
|
|
|
|
|
|
|
|||||||
| Liabilities and Stockholder’s Equity | ||||||||||||
| Warehouse lines of credit |
$ | 1,689,291 | $ | 1,303,187 | $ | 839,734 | ||||||
| Notes payable |
188,000 | 218,000 | 160,000 | |||||||||
| GNMA loans subject to repurchase right |
952,776 | 412,490 | 333,018 | |||||||||
| Deferred income taxes |
79,711 | 86,278 | 112,254 | |||||||||
| Other |
286,415 | 181,427 | 152,304 | |||||||||
|
|
|
|
|
|
|
|||||||
| Total liabilities |
3,196,193 | 2,201,382 | 1,597,310 | |||||||||
| Stockholder’s equity |
506,812 | 406,031 | 440,941 | |||||||||
|
|
|
|
|
|
|
|||||||
| Total liabilities and stockholder’s equity |
$ | 3,703,005 | $ | 2,607,413 | $ | 2,038,251 | ||||||
|
|
|
|
|
|
|
|||||||
June 30, 2020 and December 31, 2019
Total assets increased by $1.1 billion from $2.6 billion as of December 31, 2019 to $3.7 billion as of June 30, 2020. This increase was primarily due to the increase in MLHS of $0.5 billion and the increase in GNMA loans for which we have repurchase rights of $0.5 billion. The increase in MLHS was the result of an
103
Table of Contents
increase in our origination volume during the second half of the month of June 2020 compared to that during the second half of the month of June 2019. The increase in our inventory of loans for which we have repurchase rights resulted from increased delinquency on loans in forbearance under the CARES Act. As of June 30, 2020, approximately $0.6 billion of our inventory of loans for which we have repurchase rights was related to loans in forbearance under the CARES Act.
Total liabilities increased by $1.0 billion from $2.2 billion as of December 31, 2019 to $3.2 billion as of June 30, 2020. This increase was primarily due to a $0.4 billion increase in the balances under our warehouse lines of credit and a $0.5 billion increase in GNMA loans for which we have repurchase rights. The increase in the balances under our warehouse lines of credit resulted from the increase in our origination volume during the second half of the month of June 2020 compared to that during the second half of the month of June 2019.
December 31, 2019 and December 31, 2018
Total assets increased $0.6 billion from $2.0 billion as of December 31, 2018 to $2.6 billion as of December 31, 2019. This increase was primarily due to the increase in MLHS of $0.5 billion. The increase in MLHS resulted from the increase in our origination volume during the month ended December 31, 2019 of $1.7 billion compared to the origination volume for the month ended December 31, 2018 of $1.1 billion.
Total liabilities increased by $0.6 billion from $1.6 billion as of December 31, 2018 to $2.2 billion as of December 31, 2019. This increase was primarily due to a $0.5 billion increase in the balances under our warehouse lines of credit. The increase in the balances under our warehouse lines of credit resulted from the increase in our origination volume during the month ended December 31, 2019 of $1.7 billion compared to origination volume for the month ended December 31, 2018 of $1.1 billion.
Contractual Obligations
Our contractual obligations primarily consist of non-cancellable leases of real property for our branch offices across the country and our MSR notes payable. Payment obligations under these agreements are summarized below:
| Payments Due by Period (As of December 31, 2019) |
||||||||||||||||
| ($ in thousands) |
Less than 1 year | 2-3 years | 4-5 years | More than 5 years | ||||||||||||
| Operating lease commitments |
$ | 26,620 | $ | 39,823 | $ | 22,985 | $ | 34,467 | ||||||||
| MSR notes payable |
3,900 | 74,100 | — | — | ||||||||||||
|
|
|
|
|
|
|
|
|
|||||||||
| Total |
$ | 30,520 | $ | 113,923 | $ | 22,985 | $ | 34,467 | ||||||||
|
|
|
|
|
|
|
|
|
|||||||||
Repurchase and indemnification obligations
In the ordinary course of business, we are exposed to liability with respect to certain representations and warranties that we make to the investors who purchase the loans that we originate. Under certain circumstances, we may be required to repurchase mortgage loans, or indemnify the purchaser of such loans for losses incurred, if there has been a breach of these representations and warranties, or in the case of early payment defaults. In addition, in the event of an early payment default, we are contractually obligated to refund certain premiums paid to us by the investors who purchased the related loan. See Note 15, Commitments and Contingencies to the consolidated financial statements included elsewhere in this prospectus.
Interest rate lock commitments, loan sale and forward commitments
We enter into IRLCs with clients who have applied for residential mortgage loans and who meet certain credit and underwriting criteria. These commitments expose us to market risk if interest rates
104
Table of Contents
change during the period of time in which the loan is not economically hedged or committed to be sold to an investor. We are also exposed to credit loss if a loan for which we entered into an IRLC is originated and is not sold to an investor and the related client does not perform. The collateral upon extension of credit typically consists of a first deed of trust in the mortgagor’s residential property. Commitments to originate loans do not necessarily reflect future cash requirements as some commitments are expected to expire without being drawn upon. Total commitments to originate loans, adjusted for pull-through, were approximately $4.3 billion, $1.8 billion, $1.2 billion and $0.6 billion, as of June 30, 2020, June 30, 2019, December 31, 2019 and December 31, 2018, respectively.
Quantitative and Qualitative Disclosure about Market Risk
Interest Rate and Prepayment Risk
As a mortgage lender, we are subject to risks associated with fluctuations in interest rates that occur due to various economic factors, such as government monetary and housing policy, real estate values, global events such as the recent COVID-19 pandemic and other market dynamics. Changes to interest rates can adversely affect our origination and servicing segments. In a rising interest rate environment, the fair value of our MSRs typically increases as the projected duration of the cash flows earned from the associated income from loan servicing and other fees extends. However, at the same time, our origination volumes may decline in response to a rising interest rate environment, resulting in a decrease to the revenue we earn from loan origination fees and gain on sale of loans, net, due to decreased origination volume and market price compression. Conversely, in a declining interest rate environment, the fair value of our MSRs typically decreases due to the likelihood that the loan will be prepaid earlier than previously expected, resulting in a shorter projected duration for those cash flows. However, at the same time, our origination volume typically increases in response to a declining interest rate environment and margins on the revenue we earn from gain on sale of loans widen, resulting in additional profits from our origination segment. We believe that maintaining a balance between the origination and servicing segments allows us to partially mitigate exposure to both increases and decreases in interest rates.
We also have exposure to interest rate risk related to the IRLCs we enter into with our clients and the loans that we temporarily hold for sale to secondary market participants. We actively engage in risk management policies to mitigate these risks. We operate under stringent hedging policies designed to mitigate the effects of any fluctuations in interest rates on our financial position related to IRLCs and MLHS. We hedge our IRLCs and MLHS with forward to be announced trades (“TBA trades”).
Credit Risk
We define credit risk as the risk of loss or default by a borrower. Generally, the investors who purchase the loans that we originate assume this risk. However, we do make certain standard representations and warranties related to our underwriting of the borrower’s credit, the underlying collateral and other loan documentation based on our investors’ eligibility criteria, and we are subject to repurchase and indemnification requirements with respect to eligibility violations and early payment defaults.
We estimate liabilities for probable losses related to these repurchase and indemnification obligations. We record a liability based on a loan-level analysis that considers the current collateral value, estimated sale proceeds and selling costs. In addition, we record liabilities related to probable future obligations based on recent and historical repurchase experience, and our success rate in appealing repurchase requests.
105
Table of Contents
Counterparty and Concentration Risk
We are reliant on our warehouse lines of credit and other financing facilities to finance our operations. If these financing arrangements are not renewed, it could have a significant impact on our ability to fund loans for our clients. We seek to manage this exposure by maintaining multiple warehouse lines of credit with reputable financial institutions and by maintaining excess capacity on all of our facilities. Similarly, we mitigate concentration risk with respect to the trading partners with whom we execute TBA trades by maintaining multiple trade lines with various counterparties.
Fair Value Risk
We record the value of our MSRs, IRLCs, MLHS, the contingent liabilities related to our completed acquisitions and our inventory of loans for which we have repurchase rights at fair value. We remeasure the fair value of these assets and liabilities on a monthly or quarterly basis by evaluating certain observable information, which may include current market pricing, recent trade activity and industry data.
| • | MSRs — To determine the fair value of our MSRs when they are created, we use a valuation model that calculates the present value of the future cash flows related to them. Our MSR valuation model incorporates assumptions that market participants would use in estimating future net servicing income, including estimates of contractual service fees, ancillary income and late fees, the cost of servicing, the discount rate, float value, the inflation rate, estimated prepayment speeds and default rates. A third party conducts a monthly valuation of our MSRs, and we record any changes to the fair value of our MSRs that result from changes in valuation model inputs or assumptions and collections of servicing cash flows in accordance with such third-party analysis and GAAP. Changes in economic and other relevant conditions could cause the assumptions used in valuing our MSRs, such as those with respect to prepayment speeds, to be incorrect, and such changes could result in fluctuations in the recorded value of our MSRs. |
| • | IRLCs — We determine the fair value of our IRLCs based upon the estimated fair value of the underlying mortgage loan, including the expected net future cash flows related to servicing that mortgage loan, net of estimated incentive compensation, and adjusted for: (i) estimated costs to complete and originate the loan and (ii) an adjustment to reflect the estimated percentage of IRLCs that will result in a closed mortgage loan under the original terms of the agreement (the “pull-through rate”). We estimate the pull-through rate based on changes in pricing and actual borrower behavior using a historical analysis of loan closing data and “fallout” data with respect to the number of commitments that have historically remained unexercised. |
| • | MLHS — We determine the fair value of our MLHS based on either: (i) the fair value of securities backed by similar mortgage loans, adjusted for certain other factors, including credit risk and the value attributable to the related servicing rights, (ii) our investors’ current commitments to purchase loans from us or (iii) recent observable market trades for similar loans, adjusted for credit risk and other individual loan characteristics. |
| • | Forward delivery commitments — We determine the fair value of our forward delivery commitments is based upon the current agency mortgage-backed security market TBA pricing specific to the related loan program, delivery coupon and delivery date of the trade. We also enter into best efforts sales commitments for certain loans at the time the borrower commitment is made. These best efforts sales commitments are valued by comparing the committed price to the counterparty against the current market price of the IRLC or MLHS. |
| • | Contingent liability related to acquisitions — Upon completion of an acquisition, we recognize the estimated fair value of any related earn-out payments. We estimate the fair value of contingent liabilities related to completed acquisitions using a discounted cash flow analysis. Our valuation of these liabilities fluctuates in response to changes to the inputs for that analysis, such as market conditions. |
106
Table of Contents
| • | GNMA loans subject to repurchase right — Under ASC 860, until the related delinquency conditions are satisfied, our options to repurchase certain delinquent GNMA loans are treated as conditional options, for which we do not record a related asset. After the related delinquency criteria are met, an option is then considered to be unconditional and we record a related asset at a fair value equal to the remaining UPB on the related loan. |
107
Table of Contents
Critical Accounting Policies
The preparation of our financial statements in conformity with GAAP requires management to make certain estimates and assumptions that affect the reported amounts of assets and liabilities and disclosure of contingent assets and liabilities at the date of the financial statements and the reported amounts of revenues and expenses during the reporting period. Certain of these estimates significantly influence the portrayal of our financial condition and results, and they require us to make difficult, subjective or complex judgments. Although we believe that the judgments, estimates and assumptions used in the preparation of our consolidated financial statements were appropriate given the circumstances at the time they were made, actual results could materially differ from those estimates. Our critical accounting policies primarily relate to our fair value estimates. See Note 2, Fair Value Measurements to the consolidated financial statements included elsewhere in this prospectus. Below is a summary of our assets recorded at fair value compared to our total assets and stockholder’s equity as of June 30, 2020 and December 31, 2019 and 2018.
| June 30, 2020 | December 31, 2019 | December 31, 2018 | ||||||||||||||||||||||||||||||||||
| Percentage of | Percentage of | Percentage of | ||||||||||||||||||||||||||||||||||
| Level/Description ($ in thousands) |
Carrying Value of Assets |
Total Assets |
Stockholder’s Equity |
Carrying Value of Assets |
Total Assets |
Stockholder’s Equity |
Carrying Value of Assets |
Total Assets |
Stockholder’s Equity |
|||||||||||||||||||||||||||
| Level One: Prices determined using quote prices in active markets for identical assets or liabilities |
$ | 61 | 0 | % | 0 | % | $ | 93 | 0 | % | 0 | % | $ | 107 | 0 | % | 0 | % | ||||||||||||||||||
| Level Two: Prices determined using other significant observable inputs that other market participants would use in pricing an asset or liability and are developed based on market data obtained from sources independent of us. |
1,982,521 | 54 | % | 391 | % | 1,504,842 | 58 | % | 371 | % | 966,171 | 47 | % | 219 | % | |||||||||||||||||||||
| Level Three: Prices determined using significant unobservable inputs that reflect our judgements about the factors that market participants use in pricing an asset or liability and are based on the best information available in the circumstances. |
478,316 | 13 | % | 94 | % | 438,324 | 17 | % | 108 | % | 524,393 | 26 | % | 119 | % | |||||||||||||||||||||
| Total assets measured at or based on fair value |
2,460,898 | 66 | % | 486 | % | 1,943,259 | 75 | % | 479 | % | 1,490,671 | 73 | % | 338 | % | |||||||||||||||||||||
| Total assets |
3,703,005 | 2,607,413 | 2,038,251 | |||||||||||||||||||||||||||||||||
| Total stockholder’s equity |
$ | 506,812 | $ | 406,031 | $ | 440,941 | ||||||||||||||||||||||||||||||
As shown above, our consolidated balance sheet is substantially comprised of assets and liabilities that are measured at or based on their fair values. As of June 30, 2020, 66% of our total assets were carried at fair value and 13% of these assets were “Level Three” assets for which fair value is not readily observable and reflects the application of our subjective judgment. As of December 31, 2019, 75% of our total assets were carried at fair value compared to 73% as of December 31, 2018. In addition, 17% of our total assets as of December 31, 2019 and 26% of our total assets as of December 31, 2018 were “Level Three” assets. Changes in the inputs used to measure the fair value of these assets can have significant effects on their reported balances.
108
Table of Contents
As a result of the difficulty in observing certain significant inputs affecting our fair value assets and liabilities, we are required to make subjective judgments regarding the fair values of these items. Different persons in possession of the same facts may reasonably arrive at different conclusions as to the inputs used in valuing these assets and liabilities and their fair values. Such differences may result in significantly different fair value measurements. Likewise, due to the general illiquidity of some of these assets, subsequent transactions with respect to them may be at values significantly different from those we record.
Due to the difficulty and complexity in measuring certain of our fair value assets and liabilities, we engage third parties to assist management in determining their values. We have also established controls in which management reviews and discusses these valuations with our accounting department and any third parties that we have engaged for this purpose to ensure accuracy over financial reporting. We re-measure the fair value of these assets and liabilities on a monthly or quarterly basis by evaluating certain observable information, which may include current market pricing, recent trade activity, and industry data.
Mortgage Loans Held for Sale
MLHS are classified within “Level Two” of the valuation hierarchy because we determine their fair value based on secondary market pricing for loans with similar characteristics. We determine the fair value of our MLHS based on either: (i) the fair value of securities backed by similar mortgage loans, adjusted for certain other factors, including credit risk and the value attributable to the related servicing rights, (ii) our investors’ current commitments to purchase loans or (iii) recent observable market trades for similar loans, adjusted for credit risk and other individual loan characteristics.
Mortgage Servicing Rights
MSRs are classified within Level Three of the valuation hierarchy because we determine their fair value based on unobservable inputs and because there is no active market for MSRs. To determine the fair value of our MSRs when they are created, we use a valuation model that calculates the present value of the future cash flows related to them. Our MSR valuation model incorporates assumptions that market participants would use in estimating future net servicing income, including estimates of contractual service fees, ancillary income and late fees, the cost of servicing, the discount rate, float value, the inflation rate, estimated prepayment speeds and default rates. A third party conducts a monthly valuation of our MSRs, and we record any changes to the fair value of our MSRs that result from changes in valuation model inputs or assumptions and collections of servicing cash flows in accordance with such third-party analysis and GAAP. Changes in economic and other relevant conditions could cause the assumptions used in valuing our MSRs, such as those with respect to prepayment speeds, to be incorrect and such changes could result in fluctuations in the recorded value of our MSRs.
Derivative Instruments
IRLCs are classified within Level Three of the valuation hierarchy because we determine their value based upon unobservable inputs and because there is no active market for IRLCs. We determine the fair value of our IRLCs based upon the estimated fair value of the underlying mortgage loan, including the expected net future cash flows related to servicing that mortgage loan, net of estimated incentive compensation, and adjusted for: (i) estimated costs to complete and originate the loan and (ii) an adjustment to reflect the estimated percentage of IRLCs that will result in a closed mortgage loan under the original terms of the agreement (the “pull-through rate”). We estimate the pull-through rate based on changes in pricing and actual borrower behavior using a historical analysis of loan closing data and “fallout” data with respect to the number of commitments that have historically remained unexercised.
Forward delivery commitments
Forward delivery commitments are classified within Level Two of the valuation hierarchy. We determine the fair value of our forward delivery commitments based upon the current agency mortgage-
109
Table of Contents
backed security market TBA pricing specific to the related loan program, delivery coupon and delivery date of the trade. We also enter into best efforts sales commitments for certain loans at the time the borrower commitment is made. These best efforts sales commitments are valued by comparing the committed price to the counterparty against the current market price of the IRLC or MLHS.
Accounting Developments
Effective January 1, 2019, the Company adopted ASU 2014-09 Revenue from Contracts with Customers (Topic 606) using the modified retrospective approach. Adopting this standard did not have a material impact to our consolidated financial statements and related disclosures, and therefore there was no material cumulative effect of initial application reflected in the opening balance of retained earnings.
Refer to Note 1 – Business, Basis of Presentation, and Accounting Policies to the consolidated financial statements included elsewhere in this prospectus for a discussion of ASC 606 and other recent accounting developments and their expected effects on Guild.
110
Table of Contents
Company Overview
We are a growth-oriented mortgage company that employs a relationship-based loan sourcing strategy to execute on our mission of delivering the promise of home ownership in neighborhoods and communities across the United States. Our business model is centered on providing a personalized mortgage-borrowing experience that is delivered by our knowledgeable loan officers and supported by our diverse product offerings. Throughout these individualized interactions, we work to earn our clients’ trust and confidence as a financial partner that can help them find their way through life’s changes and build for the future.
We believe our business would be difficult to replicate. Guild was established in 1960, and we are among the longest-operating seller-servicers in the United States. Over the course of our operating history, we have navigated numerous economic cycles and market dislocations. We have also expanded our retail origination footprint to 31 states within the United States, and we have developed end-to-end technology systems, a reputable brand, industry expertise and many durable relationships with our clients and members of our referral network.
We have adapted to changes in market conditions by remaining dedicated to what matters most to our business: building relationships with our clients and referral partners in an effort to create “clients for life.” We have made it a priority to extend the lifecycle of our client relationships with a persistent focus on the client experience to drive our long-term performance. As a result of our client-focused strategy, during the twelve months ended June 30, 2020, we had an overall recapture rate of 61%. Recapture rate is calculated as the total UPB of our clients that originated a new mortgage with us in a given period, divided by the total UPB of our clients that paid off their existing mortgage and originated a new mortgage in the same period. This calculation excludes clients to whom we did not actively market due to contractual prohibitions or other business reasons.
Our business model benefits from the complementary relationship between our origination and servicing segments which, together, have propelled our performance through interest rate and market cycles.
Our Business Model
| • | Our origination strategy focuses on increasing purchase-mortgage business and providing a superior personalized mortgage-borrowing experience that encourages our clients to return to us. This strategy allows us to generate consistent origination volume through differing market environments, contributes to our servicing segment and facilitates business from repeat clients. |
| • | Our in-house servicing platform creates opportunities to extend our relationship with clients and generate refinance and purchase volume that replenishes run-off from our servicing portfolio. In coordination with our portfolio recapture team, our loan officers handle recapture activity for their existing client base directly, rather than outsourcing that function through a call center. This approach creates a continuous client relationship that we believe encourages repeat business. In addition, our scalable servicing platform provides a recurring stream of revenue that is complementary to our origination business. |
111
Table of Contents
In 2007, seeing an opportunity to expand the Company’s sales and production strategy and grow its market share, a management-led partnership that included a majority investment from McCarthy Capital acquired the Company from its founder. Our senior leadership team continues to own a meaningful percentage of our business. As of June 30, 2020, our senior leadership team would have owned approximately 25% of the shares of our outstanding common stock on a pro forma basis after giving effect to the completion of the reorganization transactions and, upon completion of this offering, our senior leadership team will own approximately 21% of the shares of our outstanding common stock. As a result, we believe that the economic interests of senior leadership are substantially aligned with those of our stockholders.
Following the acquisition of the Company from its founder in 2007, we embarked on a growth strategy focused on prudently expanding our geographic footprint beyond the West Coast. Through steady organic growth and a series of targeted acquisitions, we grew our annual origination volume from $1.4 billion for the year ended December 31, 2007 to $27.8 billion for the twelve months ended June 30, 2020, and grew our servicing portfolio from $2.5 billion of UPB as of December 31, 2007 to $52.8 billion of UPB as of June 30, 2020. Unless otherwise indicated, the UPB of our servicing portfolio excludes any subserviced loans. Furthermore, we grew our share of the U.S. residential mortgage origination market from 7 basis points for the year ended December 31, 2007 to 94 basis points for the twelve months ended June 30, 2020, based on our origination data and market data from Inside Mortgage Finance. We expect to continue to expand our business in the geographic areas in which we already serve our clients, as well as in new markets throughout the United States.
Guild’s Annual Origination Volume and Market Share
Source: Inside Mortgage Finance Publications, Inc. Copyright © 2020. Used with permission.
| (1) | CAGR is equal to the compound annual growth rate of Guild’s annual origination volume for the year ended December 31, 2007 through the twelve months ended June 30, 2020. |
| (2) | Last twelve months ended June 30, 2020. |
Our productivity today, and our ability to scale in the future, is made possible by our purpose-built technology platform that provides an end-to-end solution for prospecting, application gathering, underwriting, compliance, quality control, servicing and client retention. Most of our core systems have been developed in-house, using decades of expertise and feedback directly from our loan officers, and we
112
Table of Contents
continuously monitor and upgrade our platform to increase the effectiveness of our tools and interfaces. Altogether, our technology platform is designed to improve productivity, efficiency and profitability and to create an individualized experience that earns repeat and referral business.
Our homegrown platform and integrated technology stack includes several key components:
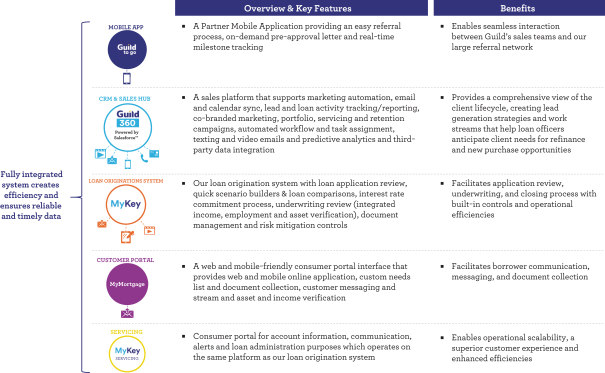
Our experienced loan officers use this end-to-end technology platform and our custom-built client relationship management system, Guild 360, to find new clients, close new loans and enhance and expand existing client relationships. Guild 360 provides a comprehensive view of the client lifecycle, identifying lead generation opportunities in an effort to anticipate client needs for refinancings and new purchases. In addition to improving the productivity of our own employees, our technology has empowered the five businesses we acquired at least two years ago to increase origination volume by an average of 29% in the second year post-acquisition.
We recognize that the mortgage borrowing process is not one-size-fits-all. We understand that preferences with respect to how and when mortgage borrowers would like to interact with their lender are varied: sometimes, clients want to self-serve on the internet, while at other times, they prefer to speak in person or talk over the phone. For example, according to a 2019 survey of recent and prospective homebuyers conducted by PricewaterhouseCoopers, although digital interactions are more popular earlier on in the lending process, borrowers prefer in-person or over-the-phone interaction during later stages of the borrowing process. Our business model provides clients with both a comprehensive digital interface and an experienced team that delivers high-tech, high-touch client service, allowing clients to engage with us in whatever format and frequency provides them the most comfort and convenience. We believe our business model and tailored client experience is validated by our likelihood to recommend score of 94%.(1)
| (1) | Likelihood to recommend determined by client responses to the following question: “Thinking of your recent experience financing your home with Guild Mortgage, and using the 1 to 10 scale where 1 now means ‘Not at all likely’ and 10 means ‘Very Likely,’ how likely are you to: Recommend Guild Mortgage to someone else looking for home financing?” Our score of 94 is based on the response of 58,737 participating clients between January 1, 2018 and June 30, 2020, converting the 10-point scale to a 100-point scale by multiplying the average of such participating clients by 10. We originated 198,058 loans between January 1, 2018 and June 30, 2020. |
113
Table of Contents
Our business has generated a profit each year since 2008, and our net income has grown substantially over this time period. For the six months ended June 30, 2020, our total net revenue was $604.3 million, net income was $110.8 million, annualized return on equity was 48.5% and Adjusted Net Income was $238.2 million. For the same period, Adjusted EBITDA was $325.8 million and annualized Adjusted Return on Equity was 104.4%. For the fiscal year ended December 31, 2019, our total net revenue was $712.9 million, net income was $5.6 million, return on equity was 1.3%, Adjusted Net Income was $139.1 million, Adjusted EBITDA was $201.5 million and Adjusted Return on Equity was 32.8%. For the twelve months ended June 30, 2019, our net loss was $33.2 million and our return on equity was (8.1)%. For the same period, our Adjusted Net Income was $79.9 million and our Adjusted Return on Equity was 19.5%. For the twelve months ended June 30, 2020, our net income was $163.4 million and our return on equity was 37.1%. For the same period, our Adjusted Net Income was $324.6 million and our Adjusted Return on Equity was 73.8%. For information on how we use these non-GAAP measures and a reconciliation of them to their most comparable GAAP measures, see “Summary Historical Consolidated Financial and Other Data” and “Management’s Discussion and Analysis of Financial Condition and Results of Operations—Non-GAAP Financial Measures.”
Guild’s Historical Net Income & Adjusted Net Income
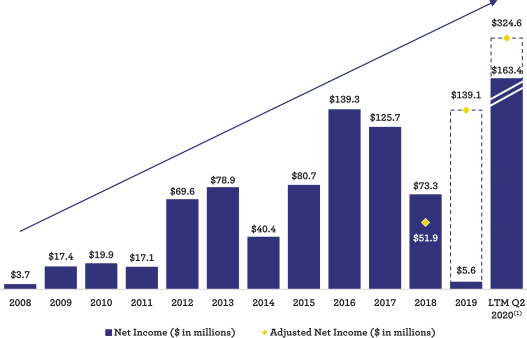
| (1) | Last twelve months ended June 30, 2020. |
114
Table of Contents
Guild’s Historical Return on Equity and Adjusted Return on Equity
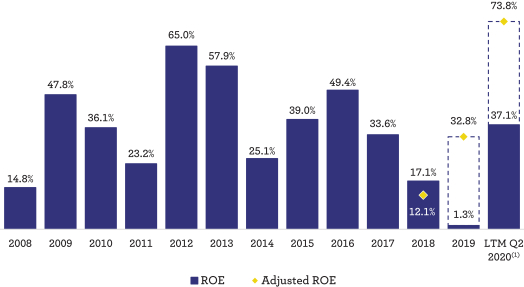
| (1) | Last twelve months ended June 30, 2020. |
Our Business Segments and Credit Function
Origination Segment
Retail Channel
We have historically focused on growing the retail channel of our origination segment because we believe it has generally provided the highest margins of our business lines and, accordingly, an opportunity to drive strong returns for our stockholders. Since 2007, we have expanded our retail footprint significantly, growing retail originations from $916.2 million for the year ended December 31, 2007 to $26.9 billion for the twelve months ended June 30, 2020 and loan officer headcount from 266 as of December 31, 2007 to 983 as of June 30, 2020. As of June 30, 2020, our retail channel operated in 31 states with 2,974 full-time employees, including 983 loan officers.
115
Table of Contents
MSA Growth and Number of Loan Officers
(as of period end)
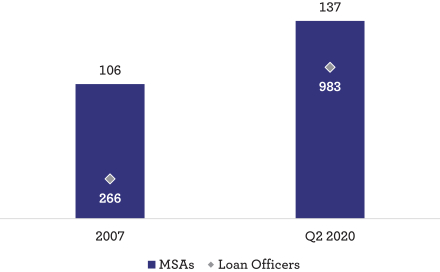
Source: CoreLogic and Company information.
Our success in the retail market is tied to the expertise of our loan officers and the strength of our referral partner network. Our referral partner network has provided us with leads that generated 49,817, 51,705 and 55,985 loans in 2017, 2018 and 2019, respectively, representing 77%, 79% and 70%, respectively, of our retail volume by number of loans. Further, 42% of our refinance activity for the six months ended June 30, 2020 was generated from refinancing loans that were not originally in our portfolio. We have built our referral network through a track record of providing our clients with a personalized mortgage-borrowing experience that is delivered by a knowledgeable loan officer and supported by our diverse product offerings, as well as educating our clients and responding to their needs throughout the origination process. Guild and its loan officers build relationships and trust with our referral network partners through consistent and reliable execution. Our referral network relationships have been cultivated over years and are bolstered by our strong presence in the communities we serve. Further, our referral network relationships enhance our ability to generate repeat business and recapture volume.
116
Table of Contents
Guild’s Referral Network
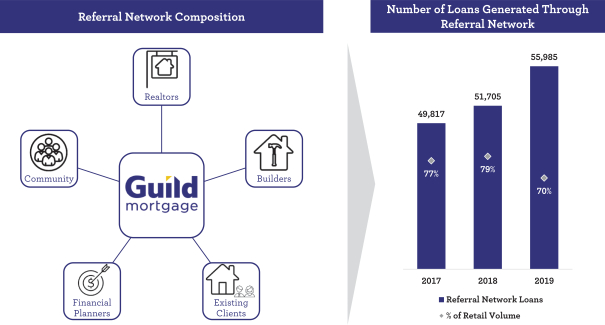
Over the ten years beginning January 1, 2010 and ending December 31, 2019, we produced more consistent retail channel profitability than our peers, on average, according to data from the Mortgage Bankers Association and STRATMOR. Over the same period, our retail channel was profitable each year while generating average annual profitability of 114 basis points, compared to our peer group, as defined by the PGR/MBA large independent mortgage lenders peer set, which generated average annual profitability of 42 basis points (each calculated based on retail channel net income in basis points of annual origination volume).
Retail Channel Profitability from 2010 to 2019(1)
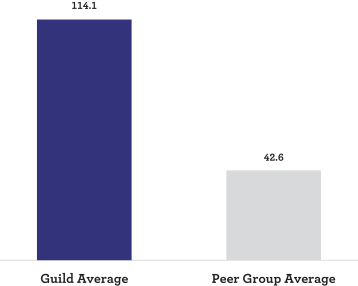
Source: Company information and Mortgage Bankers Association and STRATMOR Peer Group Roundtables Program (Spring 2020), large independent mortgage lenders peer set.
| (1) | Retail channel net income in basis points of origination volume. |
117
Table of Contents
Our regional managers have autonomy to manage their regions based on their unique dynamics. Guild provides centralized support for certain operational and compliance functions, as well as servicing, but we believe our teams that are on the ground in the markets we serve are best equipped to run their businesses on a day-to-day basis. For example, regional managers are able to adjust local pricing to ensure competitiveness in their geographic areas. This combination of centralized support and a local, flexible execution strategy has helped Guild compete effectively within our local regions, yielding more in-depth coverage and penetration.
We believe our focus on the retail channel provides us with multiple benefits, including access to more consistent purchase volume as well as attractive gain-on-sale margins relative to other channels through which other lenders may choose to operate. Because we generate strong purchase volume, we are less susceptible to interest rate movements, and are able to generate more consistent gain-on-sale margins. We have chosen to operate our business with a capital light strategy, which is enabled by our focus on the retail channel.
Correspondent Channel
In addition to the retail channel of our origination segment, we maintain an active correspondent channel that sources loans primarily from small community banks and credit unions. Our correspondent channel consists of approximately 158 correspondent partners and accounted for approximately 4% of total origination volume production in each of the last three years ended December 31, 2019. We are able to offer a diverse product set through the correspondent channel, and similar to the retail channel, rely on our differentiated client service to generate origination volume. We began correspondent originations in 2011.
We also utilize our correspondent channel to support our growth efforts. As we work to expand into new geographies, the correspondent channel serves as an entry point to begin building our brand, reputation and customer base. We have successfully utilized this strategy in the past.
Servicing Segment
We are a licensed mortgage servicer in 48 states and Washington D.C. We have purposefully developed our in-house servicing platform and have invested significant resources expanding and upgrading its technology and infrastructure over time. Through these expansions and upgrades, our servicing practices and our embedded compliance controls have improved over time.
Servicing Portfolio Growth
(UPB as of period end)(1)
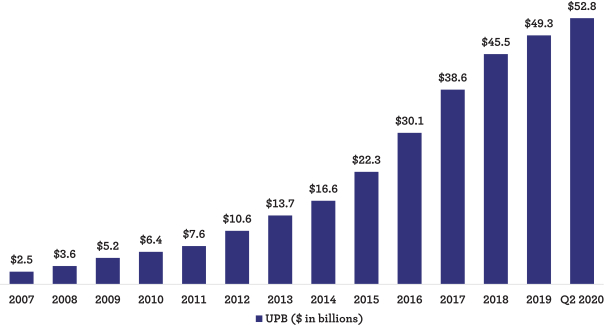
118
Table of Contents
| (1) | Excludes subservicing portfolio of $1.1 billion as of June 30, 2020. |
Our servicing segment is based out of our servicing center in San Diego, California and, as of June 30, 2020, consisted of approximately 216 employees. Loan servicing acts as the primary point of contact for borrowers post-closing. The segment aims to provide timely and accurate responses to borrower inquiries, consistent with Guild’s service-oriented culture that supports lasting client relationships.
In addition, we leverage our technology platform and data repository to continuously screen our servicing portfolio in an effort to anticipate borrower actions and capitalize on recapture opportunities. When a refinance opportunity is identified, the portfolio recapture team sends that opportunity to the loan officer who originated the existing loan and maintains the client relationship. For select refinance opportunities, our consumer direct team will originate the opportunity directly. Focusing on this function and effective use of our data warehouse, we have improved our servicing segment’s purchase recapture rate from 17% in 2017 to 26% in 2019 and refinance recapture rate from 48% in 2017 to 64% in 2019.
Servicing Segment Recapture Rates
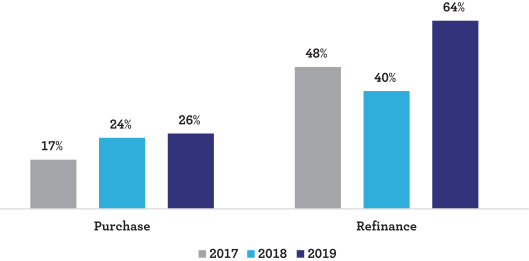
Our in-house servicing platform is also highly scalable. Our homegrown technology platform fully integrates our servicing segment with our origination segment and underwriting group. To maintain quality and consistency, many of the servicing platform’s functions are fully automated, such as on-boarding, escrow analysis and billing. In addition, we believe that the existing platform has sufficient excess capacity to support future growth. Through automation, scale and prudent management, we are able to service more loans per employee, and in 2019, we serviced 30 more loans per full-time employee than our peers participating in the Mortgage Bankers Association’s 2020 Servicing Operations Study (2019 data), mid-size independent mortgage servicers and banks peer set, on average.
119
Table of Contents
2019 Loans Serviced per Full-Time Employee
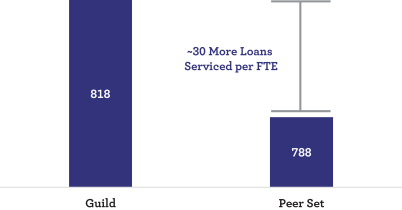
Source: Mortgage Bankers Association 2020 Servicing Operations Study (2019 data), mid-size independent mortgage servicers and banks peer set.
Further, our servicing segment’s size enables us to generate attractive unit economics by spreading overhead and other fixed costs across our portfolio. For example, our cost to service per loan was approximately 42% lower than that of our peers participating in the Mortgage Bankers Association’s 2020 Servicing Operations Study (2019 data), mid-size independent mortgage servicers and banks peer set, on average, and we believe future growth will incrementally benefit unit economics for our servicing segment.
Credit Function
Our loan products are underwritten using a disciplined approach that focuses on credit risk and responsible lending. The loan products we offer include loans eligible for sale or securitization to secondary market participants such as the GSEs, Ginnie Mae, state housing agencies and other private or institutional investors. The underwriting guidelines for these products are established by the entities that will purchase, insure or guaranty the loans (i.e., Fannie Mae, Freddie Mac, the United States Department of Housing and Urban Development (“HUD”), the VA, the USDA, private mortgage insurers and institutional and private investors).
Our credit function is designed to ensure the salability of the loans that we originate to secondary market investors, as well as to address other risks arising due to loan performance, natural disasters, fraud, prepay speeds and contractual obligations. Our underwriters have significant industry experience and are trained to make prudent underwriting decisions. Further, our technology platform is regularly updated to incorporate new investor guidelines as well as state and federal regulations. These controls are designed to ensure integrity over data and qualification requirements, facilitate the manufacturing of quality loan originations and minimize underwriting defects. In addition, Guild’s quality control program monitors for adherence to investor requirements and our internal policies and procedures through data gathered during pre- and post-closing credit, collateral and compliance reviews.
Market Opportunity
We believe our proven growth strategy, deep referral network and personalized client service position us to capitalize on opportunities resulting from the following market conditions.
Large Addressable Market
Mortgage loans are the largest class of consumer debt in the United States. According to the New York Federal Reserve, there was approximately $10.2 trillion of residential mortgage debt outstanding as of June 30, 2020.
120
Table of Contents
From 2007 through the year ended December 31, 2019, annual first-lien residential mortgage originations in the United States have averaged approximately $1.8 trillion and, over that period, conventional conforming or government mortgages accounted for approximately 82% of first-lien residential mortgage originations in the United States, according to Inside Mortgage Finance. Guild’s product offerings include both conventional conforming and government-eligible loans, and such loans have constituted over 90% of our cumulative origination volume from 2007 through June 30, 2020.
U.S. Annual Origination Volume
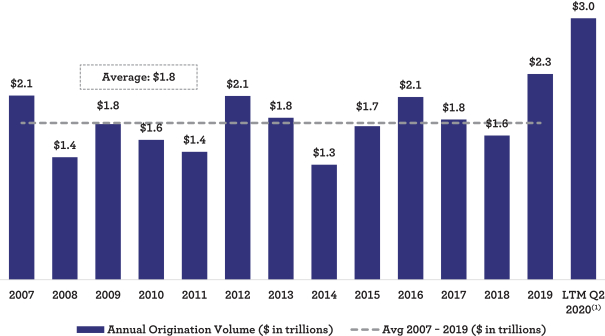
| (1) | Last twelve months ended June 30, 2020. |
Source: Inside Mortgage Finance Publications, Inc. Copyright © 2020. Used with permission.
Demographic Trends and Borrower Preferences Support our Focus on Mortgage Purchase Volume and First-Time Homebuyers
From 2007 through the year ended December 31, 2019, annual purchase-mortgage volume in the United States averaged $0.8 trillion and on average accounted for approximately 47% of annual first-lien residential mortgage volume, according to Inside Mortgage Finance.
121
Table of Contents
U.S. Annual Purchase Loan Volume
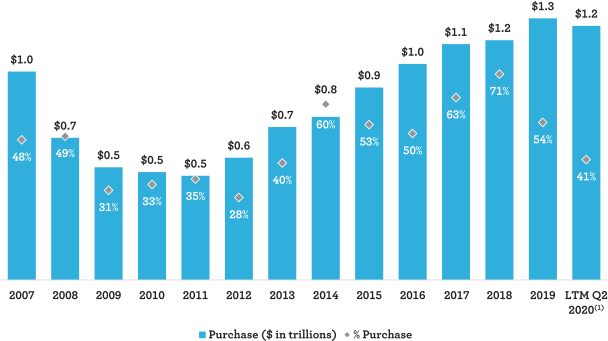
| (1) | Last twelve months ended June 30, 2020. |
Source: Inside Mortgage Finance Publications, Inc. Copyright © 2020. Used with permission.
From 2007 through the year ended December 31, 2018, first-time homebuyers accounted for approximately 46% of annual mortgage purchase volume, according to a March 2020 study published by the CFPB.
Over the next decade, according to Inside Mortgage Finance, approximately 45 million people will turn 34, the median age of a first-time homebuyer, potentially generating increased demand for mortgage purchase loans. Additionally, according to the United States Census Bureau, the seasonally adjusted homeownership rate in the United States has increased from 63.1% as of June 30, 2016 to 68.2% as of June 30, 2020. Our focus on purchase-mortgage business and personalized client service could position us to capitalize on this market opportunity because younger generations of first-time and repeat homebuyers often choose to communicate with their lenders in-person.
According to a 2019 Ellie Mae study, 79% of Millennial and 78% of Generation X consumers reported meeting with their lender in person often or sometimes.
122
Table of Contents
Frequency of In-Person Communication With Lender

Source: Ellie Mae.
The Mortgage Industry is Highly Fragmented
According to Inside Mortgage Finance, since 2010, non-bank lenders have increased their share of annual first-lien residential mortgage originations from approximately 16% to more than 50%, and the aggregate share of loans originated by the top 10 originators fell from 73% to 42%, as the largest national banks reduced their presence in the mortgage sector. Further, the top five companies in the retail mortgage market comprised only 17% of total originations in 2019, according to Inside Mortgage Finance. This market fragmentation creates significant opportunity for us to continue to grow.
We believe that our employees’ local presence in the communities that we serve and our long-standing referral networks position us to succeed in a large, fragmented market. We believe that many borrowers, and first-time homebuyers in particular, rely on recommendations from real estate professionals, homebuilders, current and past homeowners, financial planners and other members within their communities to identify their mortgage lender. Our local presence positions us to capture origination volume generated by such referral networks and to provide expertise and advice to borrowers that is specific to the communities in which they are looking to purchase homes.
123
Table of Contents
2019 Retail Market Share
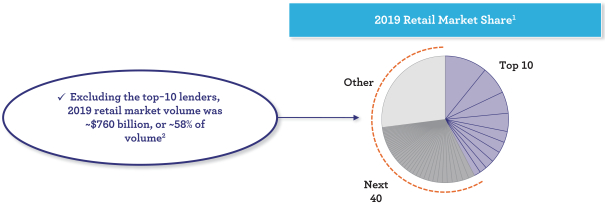
| (1) | Inside Mortgage Finance Publications, Inc. Copyright © 2020. Used with permission. |
| (2) | Consumer Financial Protection Bureau HMDA data as of December 31, 2019. |
Considerable Barriers to Entry
The residential mortgage industry is characterized by high barriers to entry. Mortgage lenders must obtain approval from Freddie Mac, Fannie Mae and Ginnie Mae and maintain various state licenses in order to originate, sell and service conventional conforming and federal and GSE-backed loans. In addition, sophisticated technology, origination and servicing processes and regulatory expertise are required to build and manage a successful mortgage business.
Over the course of our long operating history, we have developed strong relationships with Freddie Mac, Fannie Mae and Ginnie Mae, as well as state regulatory authorities. We have also invested heavily in our technology and in developing our infrastructure and internal processes. Furthermore, our management team has an average of 24 years of experience managing through various market and regulatory environments. We believe these long-standing relationships, and the time and resources we have dedicated to developing our brand and infrastructure, provide a competitive advantage and position our business for continued success.
Our Strengths
Differentiated Access to Purchase Loans Enables Durable Origination Volume and Attractive Margins
Our strategy has generated significant origination volume, including a high percentage of purchase money volume. Over the five years ended December 31, 2019, we have originated more than $84.1 billion of total volume, including $61.4 billion of purchase volume. Our purchase volume represents 73% of our total origination volume over that period, compared to 58% of total origination volume in the United States, according to Inside Mortgage Finance. Further, Guild achieved a higher purchase mix than the industry average each year since 2007. We believe our focus on purchase loans makes our business more stable by making it less sensitive to interest rate changes and less dependent on refinance activity, which enhances our ability to generate more consistent returns through market cycles.
124
Table of Contents
Purchase Origination Volume As a Percentage of Total Originations
Source: Inside Mortgage Finance Publications, Inc. Copyright © 2020. Used with permission.
| (1) | Average based on periods shown in the chart above. |
| (2) | Last twelve months ended June 30, 2020. |
We source a majority of our loans through an established network of referral partners with whom we have developed longstanding relationships over years of positive interactions. This network provides us with direct and frequent leads for loans to homebuyers who are seeking a personalized experience and access to our diverse product offerings, including affordable lending solutions designed to serve the first-time homebuyer market. Our loan officers educate our clients on the unique aspects of the products that we offer and help them to identify the product that will best suit their needs. This tailored and interactive approach to the lending process helped us achieve Money Magazine’s Best Mortgage Company for First Time Home Buyers award in 2020. Further, we believe our focus on service over price, and the value we provide to our clients, has enabled us to generate attractive gain-on-sale margins.
125
Table of Contents
Guild’s Historical Gain-on-Sale Margins(1)
| (1) | Represents the components of loan origination fees and gain on sale of loans, net described under “Management’s Discussion and Analysis of Financial Condition and Results of Operations — Our Components of Revenue” divided by total in-house origination to derive basis points. |
Proven Track Record of Navigating through Market Cycles and Executing on Growth Strategies
We have demonstrated our ability to adapt and successfully operate through various market conditions and interest rate environments. Since 1960, we have operated through eight recessions and a wide range of housing market conditions, consistently evolving our risk management framework and operating culture in order to continue serving our clients. We have been profitable each year since 2008, and we believe our track record is largely due to our expertise in the mortgage market, nimble operating style and balanced business model.
Following the acquisition of the Company from its founder in 2007, we shifted our focus to actively growing our origination franchise and scaling our servicing portfolio. In the 12 years since then, we have grown annual origination volume by 19 times and our servicing portfolio dollar volume by 21 times, using a combination of organic and inorganic growth strategies. Through productivity gains from our evolving technology platform, recruiting new loan officers and executing on our targeted acquisition strategy, we have grown in our existing markets and also expanded into new geographies. The success of our acquisition strategy has also supported our profitability.
Our Strategy is Tailored to Address Homebuyer Needs and Promote Deep Referral Network Relationships
We believe that borrowers often prefer to work with people and companies that are present in their neighborhoods and are able to deliver customized solutions to fit their specific needs. Understanding these unique needs is the reason we feel it is vital to be in the communities we serve, living and working with our clients and members of our referral networks.
We provide an individualized lending approach, a broad product set and the operational and regulatory expertise required to meet our clients’ needs. Through our decentralized fulfillment model, we perform underwriting and closing services on a regional basis, which allows us to recognize and adapt to the intricacies of each region and build relationships between our fulfillment team and our local loan officers. Our origination processes are designed to deliver reliable service and on-time closings.
126
Table of Contents
We believe that our referral networks and local community presence position us to succeed in a highly fragmented market. Our local presence positions us to capture loan volume generated by these referral networks and provide tailored advice that acknowledges the fact that purchasing a home is an emotional life decision and borrowers have varied preferences with respect to the mortgage lending process. We provide our clients with the opportunity to engage with us in whatever manner they may prefer—whether that may be in person, online or over the phone. Our technology platform furthers our ability to deliver reliable service and on-time closings by creating milestones and swim lanes to provide clear accountability with respect to meeting closing deadlines.
Internally-Developed Technology Platform Underpins Loan Officer Productivity and Fosters Repeat Business
We leverage our robust technology platform and coaching program to increase our loan officers’ productivity and overall recapture rates.
Our technology platform provides loan officers with end-to-end support from client acquisition to loan closing and client retention. Our loan officers benefit from our custom-built technology platform and our data repository, which has been developed over the course of our long operating history. We continue to build our data repository through our ongoing origination activity, and we have added data from more than 525,000 transactions since January 1, 2010. By utilizing this data to further develop our platform and to curate suggested customer touchpoints, we foster a balanced combination of personalized and digital strategies for lead nurturing, as well as client education and communication, that we believe gives our loan officers a competitive edge. As a result of our continued focus on loan officer productivity, we have been successful in increasing our average monthly lead generation per loan officer as illustrated below.
Average Monthly Leads per Loan Officer
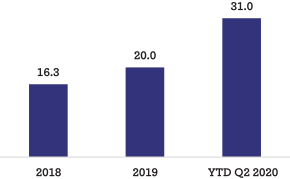
In addition, our technology platform adds substantial value to loan officers that cannot be replicated or transferred to our peers. This helps us to generate strong loan officer loyalty and benefit from high retention rates among our top performing loan officers. The loan officers responsible for 71% of our production volume over the last five years are still with the Company today.
This technology-focused approach to managing client relationships, coupled with our loan officers’ strong referral networks and other relationships within their communities, has contributed to the increase in our overall recapture rate from 37% for the year ended December 31, 2017 to 61% for the twelve months ended June 30, 2020. In addition, for the year ended December 31, 2019, Guild’s portfolio recapture volume—calculated as the dollar volume of originations for existing retail clients who refinanced or received a new purchase mortgage during that period—totaled $4.9 billion, which resulted in a 26% purchase recapture rate, a 64% refinance recapture rate and a 56% overall recapture rate—outperforming the average overall recapture rate of 25% for large independent mortgage lenders participating in the Mortgage Bankers Association and STRATMOR Peer Group Roundtables Program (Spring 2020). We believe our ability to achieve purchase and refinance recapture rates in excess of market averages is a testament to our innovative platform and business model.
127
Table of Contents
Source: Company information and Mortgage Bankers Association and STRATMOR Peer Group Roundtables Program (Spring 2020), large independent mortgage lenders peer set.
We also empower our loan officers through the Company’s coaching program, Elevate, which is designed to support loan officers at each stage of their careers and provides a roadmap to develop highly productive partnerships with referral networks. The program is taught by our highest producing loan officers and allows participants, grouped into levels from one to four based on level of experience, to learn effective solutions from their peers that are in the market originating mortgages on a day-to-day basis. The program also furthers our goal of creating a collaborative culture by engaging our national sales team to share best practices with their peers around the country. Participating loan officers have consistently achieved increased average productivity following participation in the program.
Loan Officer Productivity Following Coaching Program(1)
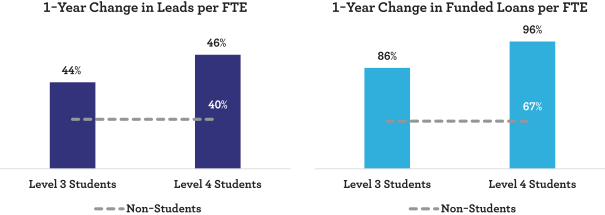
| (1) | Graphic shows average change in leads and funded loans per student and non-student beginning in February 2019 at the start of the training program. “FTE” stands for full-time employee. |
128
Table of Contents
Strong Culture Set by Experienced Management Team
At the heart of our Company is our culture, grounded in strong values, innovation, creativity and collaboration. We believe our culture sets us apart and is the backbone of our success. It has enabled us to continuously innovate and evolve to navigate the dynamic mortgage market.
Guild is an inclusive organization and encourages open and honest dialogue across employees, clients and partners. We have a diverse leadership team that fills key roles in each of our business lines. Our leadership team has an average of 24 years of industry experience, has worked at Guild for an average of 21 years and includes top performers from the businesses that Guild has acquired. We have high employee retention, as well as a successful recruiting program, because we empower our employees, maintain a culture that supports collaboration and development and provide our employees with the tools and resources they need to be successful.
We also believe strongly in supporting the communities in which we operate. To that end, Guild and its employees give back to the neighborhoods and communities we serve through sustained investment of time and resources, including through our Guild Giving Foundation.
Further, our management team is well respected across the mortgage industry and has developed strong relationships with our financing counterparties, our referral networks and the investors to which we sell the majority of the loans that we originate—Fannie Mae, Freddie Mac and Ginnie Mae. Because of these relationships, we often have unique opportunities to work on, and shape, pilot programs for new products. This allows us to stay at the leading edge of product development, provide our clients with a broad solution set and further develop our relationships with stakeholders critical to the success of our business.
Our Growth Strategies
We have increased our origination volume from $1.4 billion for the year ended December 31, 2007 to $27.8 billion for the twelve months ended June 30, 2020. Our strategy has proven to be scalable as we have further penetrated many of our existing markets and expanded our presence across the United States. We believe that we are well positioned to continue capturing additional origination business through our well-recognized brand, internally-developed technology platform and differentiated position in the purchase market.
Increase Our Market Share in Existing MSAs and Continue Building Our Team of Loan Officers
We are a top-10 lender in 26 of the 50 largest MSAs in which we operate according to CoreLogic, and our share of total origination volume has grown by 14 times over the last 12 years through June 30, 2020, based on our origination data and data from Inside Mortgage Finance. Our hands-on approach in local communities has allowed us to continually capture increased business as we strengthen and broaden our relationships in the MSAs in which we operate. Our ability to improve the productivity of our existing loan officers through more effective use of our technology platform and our talent development programs further supports our growth efforts. For illustrative purposes, if we were able to capture an additional 1% of market share in the states where we currently operate an in-state retail location, we could add $15.8 billion to our annual origination volume, according to origination volume data for the year ended December 31, 2019 from the Mortgage Bankers Association.
We believe we can continue to generate growth by adding loan officers to our team with recruiting efforts that leverage our reputation for providing the tools, data and support that allow loan officers to develop their business. We focus on recruiting the right loan officers to the Guild team, namely those who we believe will not only add incremental origination volume but will also fit well with our culture and further our mission to be a trusted partner for our clients. By maintaining our strong culture and continually developing our loan officers using our proprietary coaching program and technology platform, we have been able to efficiently scale our business.
Similar to our other key business functions, our recruiting efforts are integrated into our technology platform. Through Scout, our recruiting program that is housed in Guild 360, we have created a database of
129
Table of Contents
potential new loan officers using data from the Nationwide Multistate Licensing System and Registry and CoreLogic to identify those loan officers that operate in areas where we may seek to expand and that have established access to purchase loans. The loan officers we target in our recruiting efforts typically generate annual origination volume of approximately $20 million, with more than 70% of their annual origination volume consisting of purchase mortgages, and more than 90% of their annual origination volume consisting of conforming loan products. Through our centralized recruiting function, our team of seven internal recruiters leverages our technology platform, and works with our eleven divisional/regional managers and 308 branch managers, to seek to continue building our loan officer team and growing our origination volume and market share.(1)
Expand the Geographic Footprint of our Business
Our retail operations cover 31 states, with our largest presence on the West Coast. By continuing to execute our growth strategy, we believe we can grow our geographic footprint to include all 50 states over the long term. According to the Mortgage Bankers Association, the states where we did not operate an in-state retail location as of June 30, 2020 accounted for approximately 29% of total origination volume in 2019. We believe this could create an opportunity for us to grow our origination volume through continued market expansion.
Our Origination Footprint and MSA Market Share(1)
Source: CoreLogic.
| (1) | Indicates MSA market share only for states where the Company operates in-state retail locations. |
Over the last 12 years through December 31, 2019, we acquired six businesses with 391 loan officers. To identify targets that fit best with Guild, we look for independent lenders who share our values and our commitment to innovation, creativity and collaboration. We prefer to partner with lenders that have a strong foothold in their market and a clearly defined approach to sustaining that success. We have also thoughtfully structured our past acquisitions to include an earn-out component designed to minimize up-front premium paid and ensure an attractive return on investment. Following an acquisition, we fully integrate each business operationally, on-boarding the acquired business to our platform, while allowing its management team to continue executing the strategy that has been successful for them in the past. After a target business has been integrated into the Guild platform, we strive to support growth organically in the same way we do in our existing MSAs. We also strive to generate synergies and support profitability by improving execution and increasing gain-on-sale margins for the businesses that we acquire. For the four businesses that we acquired at least three years ago, originations increased by an average of 37% in the
| (1) | Employee counts as of September 30, 2020. |
130
Table of Contents
third year following those acquisitions. We believe this demonstrates the soundness of our approach to acquisitions and our ability to successfully integrate acquired businesses into the Guild organization.
Average Increase in Volume per Acquisition
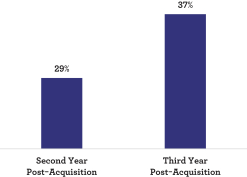
Given the fragmented nature of the mortgage market, we believe we can continue to generate meaningful growth through acquisitions. There were more than 900 independent mortgage lenders in the United States as of December 31, 2019, according to a June 2020 report published by the CFPB. We believe this provides a large pool of potential targets for new acquisitions. Over the twelve months ended June 30, 2020, our share of mortgage originations accounted for 94 basis points of total residential mortgage originations in the United States, with our market share in the states where we have our strongest presence reaching more than 5%.
Acquisition History
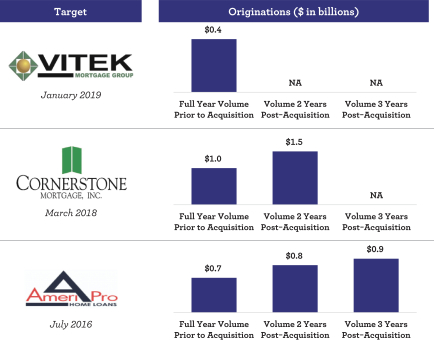
131
Table of Contents
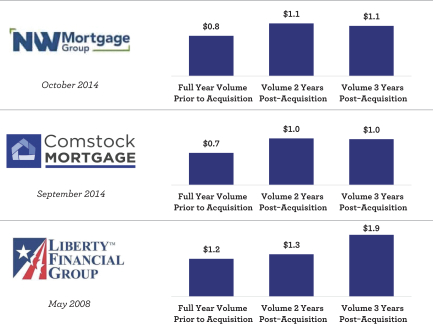
Enhance Productivity and Ancillary Fee Opportunities through Continued Investment in our Technology Platform
The mortgage industry is continually evolving, and our technology platform has been built to adapt with the market and our strategies. Our technology platform is the backbone of our regulatory efforts and the processes we use to effectively and efficiently onboard, underwrite, close and service mortgages. These functions are essential to providing outstanding client service and running our business efficiently. We continue to invest in our technology platform, and we believe our investment will continue to enhance our productivity and allow us to differentiate ourselves in the market place as it has to date, with the average number of loans closed per producer per month increasing from two during the year ended December 31, 2007 to ten in July of 2020. Additionally, as of August 31, 2020, we had 156 loan officers that were expected to originate more than $50 million of loans in 2020. 41% of those loan officers originated less than $30 million during their first full calendar year with Guild. We believe that growth, as well as our ability to retain our loan officers over the long-term, is a result of our technology platform and our unique support tools designed to improve loan officer productivity. As of June 30, 2020, we employed 67 programmers and 92 other technology professionals who maintain and develop our systems.
132
Table of Contents
Monthly Loan Closings by Job Function(1)
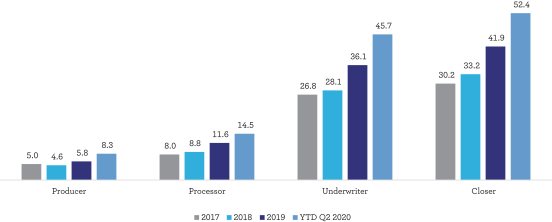
| (1) | Based on first-lien, retail funded units and average headcount over the period. |
Additionally, using our data repository and adaptable technology platform, we have an opportunity to identify and offer our client base relevant ancillary products, such as title, property and casualty, life and umbrella insurance and other products and services complementary to the mortgages that we originate. Ancillary product offerings like these could increase the value of the services that we provide to our clients, further solidifying our position as a trusted partner in their financial decisions, and also create an opportunity to earn ancillary fee income through sourcing high-quality, timely and actionable referrals to insurance companies and other potential partners.
Competition
The mortgage lending market is highly competitive. We compete with large financial institutions and with other independent residential mortgage loan producers and servicers, such as Quicken Loans, loanDepot, Fairway Independent Mortgage Corporation, Caliber Home Loans, Guaranteed Rate, Movement Mortgage and CrossCountry Mortgage. Competition in our industry can occur on the basis of the variety of product offerings made available, speed and convenience of execution in loan origination, interest rates and fees, client experience, technical knowledge, marketing and referral relationships. We aim to differentiate our products and services on the basis of our loan officers’ ability, leveraging our technology platform to match customers with the loan programs that best suit their needs and providing a customer-focused and seamless borrowing experience, starting from origination and continuing through servicing.
Intellectual Property
We rely on a combination of trade secret laws and contractual agreements to establish, maintain and protect our intellectual property rights and technology. We enter into confidentiality and invention assignment agreements with our employees and enter into confidentiality agreements with third parties, including suppliers and other partners.
Seasonality and Cyclicality
Consumer demand for home loans can fluctuate seasonally, generally causing an increase in our mortgage origination activity and revenues during the second and third quarters and reduced activity and revenues in the first and fourth quarters as homebuyers tend to purchase their homes during the spring and summer in order to move to a new home before the start of the school year. Demand also fluctuates in response to shifts in numerous other variables, including, but not limited to, national and regional economic conditions, interest rates and property valuations.
133
Table of Contents
Employees
As of June 30, 2020, Guild Mortgage Co. had approximately 3,775 full-time equivalent employees. None of our employees is represented by any collective bargaining unit or is a party to a collective bargaining agreement.
Facilities
Our principal executive office is located in San Diego, California. In addition to our San Diego office, we operate from approximately 200 branch offices and 124 satellite offices located in 31 states. We lease our principal executive office and each of our branch and satellite offices. The square footage of our principal executive office is 141,696 square feet and the average square footage of our branch and satellite offices is approximately 3,800 square feet and approximately 1,750 square feet, respectively.
Regulation
The mortgage industry is subject to a highly complex legal and regulatory framework. Our business is subject to extensive regulation and oversight by federal, state and local governmental authorities, including the CFPB and various state licensing, supervisory and administrative agencies. From time to time, we also receive requests from such governmental authorities for records, documents and information relating to the policies, procedures and practices of our loan servicing, origination and collection activities. In addition, we are also subject to periodic reviews and audits from the GSEs, Ginnie Mae, the CFPB, HUD, the USDA, the VA, state regulatory agencies and others. The legal and regulatory environment in which we operate is also constantly evolving as statutes, regulations and practices, and interpretations thereof, that are in place may be amended or otherwise change, and new statutes, regulations and practices may be enacted, adopted or implemented.
These and other laws and regulations directly affect our business and require constant compliance monitoring and internal and external audits and examinations by federal and state regulators. We work diligently to assess and understand the implications of the complex regulatory environment in which we operate and strive to meet the requirements of this constantly changing environment. We dedicate substantial resources to regulatory compliance while at the same time striving to meet the needs and expectations of our customers, clients and other stakeholders. Notwithstanding these efforts, there can be no assurance that we will be able to remain in compliance with these requirements. See “Risks Related to Regulatory Environment” under the section titled “Risk Factors.”
Federal Regulation
We are subject to a number of federal consumer protection laws, including:
| • | the Real Estate Settlement Procedures Act (the “RESPA”), and Regulation X thereunder, which, among other things, (i) require certain disclosures to borrowers regarding the costs of mortgage loans, the administration of tax and insurance escrows, the transferring of servicing of mortgage loans, the response to consumer complaints, and payments between lenders and vendors of certain settlement services; and (ii) prohibit giving or accepting anything of value for the referral of real estate settlement services; |
| • | the Truth in Lending Act (the “TILA”), and Regulation Z thereunder, which, among other things, (i) require certain disclosures to borrowers about their mortgage loans, right to rescind some transactions, notices of sale, transfers of ownership of mortgage loans, new servicing rules involving payment processing, and adjustable rate mortgage change notices and periodic statements; (ii) require a reasonable and good faith determination by the lender that the borrower has the ability to repay the loan; (iii) require home ownership counseling for certain mortgage applicants and (iv) impose restrictions on loan originator compensation; |
| • | the ECOA, and Regulation B thereunder, which prohibit discrimination on the basis of age, race, color, sex, religion, marital status, national origin, receipt of public assistance or the exercise of |
134
Table of Contents
| any right under the Consumer Credit Protection Act in the extension of credit and require certain disclosures to credit applicants; |
| • | the Fair Housing Act, which prohibits discrimination in housing on the basis of race, color, sex, national origin, religion, familial status or disability; |
| • | Regulation N (the Mortgage Acts and Practices Advertising Rule), which prohibits deceptive claims in mortgage advertising and other commercial communications; |
| • | certain provisions of the Dodd-Frank Act, including the Consumer Financial Protection Act, which, among other things, prohibit unfair, deceptive or abusive acts or practices; |
| • | the Federal Trade Commission Act, the FTC Credit Practices Rules and the FTC Telemarketing Sales Rule, which forbids unfair or deceptive acts or practices and certain related practices; |
| • | the TCPA, Telemarketing Sales Rules and related laws that regulate communications via telephone, text, automatic telephone dialing systems, and artificial and prerecorded voices; |
| • | the Controlling the Assault of Non-Solicited Pornography and Marketing Act, which establishes requirements for those who send unsolicited commercial email; |
| • | the Fair Credit Reporting Act, as amended by the Fair and Accurate Credit Transactions Act, and Regulation V, which, among other things, regulate the use and reporting of information related to the credit history of borrowers; |
| • | the Home Mortgage Disclosure Act, and Regulation C thereunder, which require financial institutions to report certain loan origination data; |
| • | the Gramm-Leach-Bliley Act, and Regulation P thereunder, which require the maintenance of privacy with respect to certain consumer data and periodic communications with consumers on privacy matters; |
| • | the Homeowners Protection Act, which requires the cancellation of private mortgage insurance once certain equity levels are reached, sets disclosure and notification requirements, and requires the return of unearned premiums; |
| • | the SAFE Act, which requires all states to enact laws requiring each person who originates residential mortgage loans to be individually licensed or registered as a mortgage loan originator; |
| • | federal anti-money laundering laws, including the Bank Secrecy Act and the Uniting and Strengthening America by Providing Appropriate Tools Required to Intercept and Obstruct Terrorism Act, and the implementing regulations and sanctions programs of the United States Department of the Treasury; |
| • | the Electronic Fund Transfer Act of 1978, and Regulation E, thereunder, which provide certain protections for consumers engaging in electronic fund transfers; |
| • | federal financial protection statutes applicable to certain eligible service members, including the Military Lending Act and Servicemembers Civil Relief Act; and |
| • | the Bankruptcy Code and bankruptcy injunctions and stays, which can restrict collection of debts. |
We are also subject to a variety of regulatory and contractual obligations imposed by Fannie Mae, Freddie Mac, Ginnie Mae, the VA, the FHA and others.
In addition, the CFPB was established on July 21, 2010 under Title X of the Dodd-Frank Act to ensure that consumers receive clear and accurate disclosures regarding financial products and to protect consumers from deceptive or abusive acts or practices, among other things. The CFPB influences the regulation of residential mortgage loan originations and servicing in several ways. The CFPB has rulemaking authority with respect to many of the federal consumer protection laws applicable to mortgage
135
Table of Contents
originators and servicers, such as us, including the TILA, RESPA and the ECOA. The CFPB has been active and continues to amend rules and regulations within its purview. For example, the CFPB has issued rules and regulations that have expanded the scope of data required to be collected and reported for loan applicants and imposed requirements relating to repayment ability and qualified mortgage standards. These rules impose significant compliance burdens, for example, by requiring us to collect and submit data to regulators and to retain evidence of compliance, and any failures to comply, including any inadvertent errors, could result in the CFPB or other regulators imposing fines on, or taking other enforcement actions relating to, us.
The CFPB’s jurisdiction includes those persons originating, brokering or servicing residential mortgage loans and those persons performing loan modification or foreclosure relief services in connection with such loans. The CFPB has broad supervisory and enforcement powers with regard to non-depository institutions, such as us, that engage in the origination and servicing of home loans. The CFPB has conducted routine examinations of our business and we expect it to conduct future examinations. The CFPB can also bring enforcement actions, impose monetary penalties, require remediation of practices, pursue administrative proceedings or litigation and obtain cease and desist orders for violations of applicable federal consumer financial laws. The CFPB has been active in investigations and enforcement actions and has issued civil money penalties to parties when the CFPB has determined that such parties have violated the laws and regulations it enforces.
State Regulation
The SAFE Act requires all states to have laws that require mortgage loan originators employed by non-depository institutions, such as us, to be individually licensed to offer mortgage loan products. As a result, we are subject to various state licensing requirements. These state licensing requirements generally require individual loan originators to register in a nationwide mortgage licensing system, submit information for a character and fitness review, submit to a criminal background check, complete a minimum number of hours of pre-licensing education, complete an annual minimum number of hours of continuing education and successfully complete an examination. Upon issuance of a license, we become subject to regulatory oversight, supervision and enforcement activity to determine compliance with applicable law. To conduct our residential mortgage operations in the United States, we are licensed in 48 states and the District of Columbia.
In addition to the above, state laws and regulations, among other things:
| • | require the filing of reports with regulators and compliance with state regulatory capital requirements; |
| • | impose maximum terms, amounts and interest rates, and limit other charges; |
| • | impose consumer privacy rights and other obligations that may require us to notify customers, employees, state attorneys general, regulators and others in the event of a security breach; |
| • | regulate servicing activities, including disclosures, payment processing, loss mitigation and foreclosure, servicing fees and escrow account administration; |
| • | prohibit various forms of “predatory” lending and place obligations on lenders to substantiate that a client will derive a tangible benefit from the proposed home financing transaction and/or have the ability to repay the loan; |
| • | regulate whether and under what circumstances we may offer insurance and other ancillary products in connection with a lending transaction and |
| • | provide for additional consumer protections. |
State laws and regulations, and interpretations thereof, vary from state to state, and these laws, regulations and interpretations may change and/or may be vague or interpreted only rarely.
136
Table of Contents
Additionally, our business is subject to numerous state laws that are continuously changing, including laws related to mobile- and internet-based businesses, data privacy (including the California Consumer Privacy Act and similar or other data privacy laws enacted by other states) and advertising laws. One of our subsidiaries, Mission Village Insurance Agency, is also subject to certain laws and regulations governing insurance activities.
State attorneys general, state licensing regulators and state and local consumer protection offices also have the authority to investigate consumer complaints, commence investigations and other formal and informal proceedings, and take enforcement actions and impose remedies on or regarding our operations and activities.
See also “Risks Related to Regulatory Environment” under the section titled “Risk Factors.”
Legal and Regulatory Proceedings
We are, and from time to time may become, involved in legal and regulatory proceedings or subject to claims arising in the ordinary course of our business. We operate within highly regulated industries on a
federal, state and local level and are routinely subject to various examinations and legal and regulatory proceedings in the normal and ordinary course of business. With the exception of the below-described matter, we are not presently a party to any legal or regulatory proceedings that in the opinion of our management, if determined adversely to us, would individually or taken together have a material adverse effect on our business, results of operations and financial condition.
United States of America, ex rel. Kevin G. Dougherty, et al. v. Guild Mortgage Company
On May 18, 2016, the U.S. Department of Justice (“DOJ”), on behalf of HUD (together, for purposes of the description of this matter, the “government”), filed a Complaint-in-Intervention (“Intervention Complaint”) in a pending qui tam action against Guild Mortgage Co. under the False Claims Act (“FCA”), 31 U.S.C. §§ 3729-3733. The Intervention Complaint, filed in the U.S. District Court for the District of Columbia, alleges FCA violations in connection with the underwriting and origination of certain residential mortgage loans that Guild Mortgage Co. endorsed for FHA insurance. The Intervention Complaint alleges violations of Sections 3729 (a)(l)(A) and (B) of the FCA, breach of common law fiduciary duty, and breach of contract. The government’s claims arise from Guild Mortgage Co.’s origination of residential mortgage loans, which Guild Mortgage Co. subsequently endorsed for FHA insurance between January 1, 2006 and December 31, 2011.
On August 10, 2016, Guild Mortgage Co. filed motions to dismiss the government’s Intervention Complaint and the Relator’s Third Amended Complaint. In March 2018, the Court stayed the case pending the Ninth Circuit’s determination of the appeal in Rose v. Stephens Institute (No. 17-15111). On August 24, 2018, the ruling in the Rose case was issued and the Court lifted its self-imposed stay. On March 4, 2019, the government filed an amended complaint, which Guild Mortgage Co. responded to on March 22, 2019, reasserting that the claims were without merit. Guild Mortgage Co.’s motion to dismiss was denied by the court in September 2019.
As previously disclosed, Guild had negotiated the terms of a settlement agreement that was pending approval with the responsible officials in the United States government, and as of September 30, 2020, the Company recorded a liability of approximately $23.0 million to reflect a reserve established for a potential settlement after taking into account approximately $2.0 million in insurance coverage expected to be available to the Company in connection with such a settlement. On October 20, 2020, the Company finalized its settlement agreement with the U.S. Department of Justice, the U.S. Department of Housing and Urban Development and Mr. Dougherty with respect to this matter (other than with respect to one claim of Mr. Dougherty’s, which is not included in the settlement agreement and for which the Company’s exposure is not material). Under the terms of the settlement agreement, the Company has agreed to make a cash payment in the amount of $24.9 million to the government, from which $4.98 million will be
137
Table of Contents
distributed by the government to Mr. Dougherty. The Company entered into the settlement agreement as resolution to avoid the delay and expense associated with litigation. Guild did not admit liability in connection with the settlement agreement and maintains its position that the claims asserted were without merit. The Company remains confident in the compliance processes it has in place for FHA-related mortgage lending and other mortgage lending activities.
138
Table of Contents
Executive Officers and Board of Directors upon Completion of this Offering
The following tables set forth information as of the date of this prospectus regarding individuals who are expected to serve as our executive officers and as members of our Board of Directors following the completion of this offering. Upon completion of this offering, we expect that our Board of Directors will consist of 6 members.
Executive Officers
| Name |
Age | Position | ||||
| Mary Ann McGarry |
62 | Chief Executive Officer | ||||
| Terry Schmidt |
59 | President | ||||
| Amber Elwell |
38 | Senior Vice President, Chief Financial Officer | ||||
| David Neylan |
45 | Executive Vice President, Chief Operating Officer | ||||
| Barry Horn |
77 | Executive Vice President, National Production Manager | ||||
| Lisa Klika |
42 | Senior Vice President, Chief Compliance Officer and Secretary | ||||
Board of Directors
| Name |
Age | Position |
Committee Memberships | |||||
| Patrick Duffy |
49 | Chairman of the Board of Directors | Compensation | |||||
| Junior Bryant |
49 | Director | Audit, Compensation, Nominating and Governance | |||||
| Martha Marcon |
71 | Director | Audit, Nominating and Governance | |||||
| Mary Ann McGarry |
62 | Director | — | |||||
| Terry Schmidt |
59 | Director | — | |||||
| Mike Meyer |
62 | Director | Audit, Compensation, Nominating and Governance | |||||
Mary Ann McGarry, 62, is the Chief Executive Officer and a Director of the Issuer. Mary Ann has held these positions since August 2020. Mary Ann has served as Guild Mortgage Co.’s Chief Executive Officer since December 2007. From 1988 and until the completion of this offering and the reorganization transactions, Mary Ann also served as a member of Guild Mortgage Co.’s board of directors. Prior to becoming its Chief Executive Officer, Mary Ann served in a number of leadership positions at Guild Mortgage Co., including as its President, Chief Financial Officer and Chief Operating Officer. Mary Ann joined Guild Mortgage Co. in 1984 as an internal audit supervisor. Prior to joining Guild Mortgage Co., Mary Ann worked as an accountant at Peat, Marwick, Mitchell & Co. Mary Ann currently serves as a member of the board of directors of the Mortgage Bankers Association, an association representing the real estate finance industry, and the Guild Giving Foundation, a non-profit organization, and a member of Fannie Mae’s advisory council. Mary Ann earned a bachelor of business administration degree in accounting with a minor in computer science from the University of San Diego.
Terry L. Schmidt, 59, is the President and a Director of the Issuer. Terry has held these positions since August 2020. As President, Terry oversees the Company’s finance, human resources, capital markets and compliance departments. Terry has served as Guild Mortgage Co.’s President since January 2020. From 2006 and until the completion of this offering and the reorganization transactions, Terry also served as a member of Guild Mortgage Co.’s board of directors. Prior to serving as Guild Mortgage Co.’s President, Terry served in a number of leadership positions at Guild Mortgage Co., including as Controller from 1991 to 1997 and as its Chief Financial Officer from 1997 to 2020. Terry joined Guild Mortgage Co. in 1985, as a member of its internal audit department. Terry is currently a member of the California Mortgage Bankers
139
Table of Contents
Association, an association representing the California residential and commercial real estate finance industry, a member of the board of directors of the Guild Giving Foundation, a non-profit organization, and a member of the Mortgage Bankers Association, an association representing the real estate finance industry. Terry earned a bachelor of business administration degree in accounting from the University of San Diego and is a certified mortgage banker.
Desiree “Amber” Elwell, 38, is the Senior Vice President, Chief Financial Officer of the Issuer. Amber has held this position since August 2020. As Chief Financial Officer, she is responsible for the accounting, finance, treasury, payroll and facilities functions. Amber has served as Guild Mortgage Co.’s Senior Vice President, Chief Financial Officer since January 2020. Prior to serving as Guild Mortgage Co.’s Chief Financial Officer, Amber served in various finance positions at Guild Mortgage Co., including as Guild Mortgage Co.’s Senior Vice President, Finance from 2015 to 2020 and its Vice President, Finance from 2010 to 2015, one of its Financial Analysts from 2005 to 2007 and one of its Staff Accountants from 2004 to 2005. Amber earned a bachelor of business administration degree in finance from Texas Christian University and a master of business administration degree from the University of California, Irvine. She is a certified public accountant and a certified mortgage banker.
David M. Neylan, 45, is the Executive Vice President, Chief Operating Officer of the Issuer. David has held this position since August 2020. As Chief Operating Officer, he is responsible for production operations, loan administration, and the correspondent and consumer-direct lending divisions of the Company. He also oversees the Company’s customer retention efforts. David has served as Guild Mortgage Co.’s Executive Vice President, Chief Operating Officer since January 2020. Prior to serving as Guild Mortgage Co.’s Chief Operating Officer, David held a number of leadership positions at Guild Mortgage Co., including as its Senior Vice President, Business Development from August 2014 to December 2019. Prior to joining Guild Mortgage Co. in 2007, David managed the local branch, regional and national origination divisions at CMG Mortgage Inc, a provider of mortgage banking, where he began his career in the mortgage banking industry in 1997. David is currently a member of the board of directors of the California Mortgage Bankers Association, an association representing the California residential and commercial real estate finance industry, and a member of the Mortgage Bankers Association, an association representing the real estate finance industry. David earned a bachelor of science degree from the Marshall School of Business, University of Southern California.
Lisa I. Klika, 42, is the Senior Vice President, Chief Compliance Officer and Secretary of the Issuer. Lisa has held this position since August 2020. As Chief Compliance Officer, she oversees all regulatory compliance, quality control, and audit functions. Lisa has served as Guild Mortgage Co.’s Senior Vice President, Chief Compliance Officer since 2016. Lisa joined Guild Mortgage Co. in 2003 as a compliance analyst and served in a number of quality assurance roles before being promoted to Vice President in 2007 and then to Senior Vice President in 2013. Lisa is currently a member of the board of directors of the Mortgage Compliance Professionals Association of America, an organization for mortgage compliance professionals, a member of the Mortgage Bankers Association, an association representing the real estate finance industry, and an affiliate member and industry advisory council member of the American Association of Residential Mortgage Regulators, a residential mortgage industry association. Lisa earned a bachelor of science degree in exercise and sport science from Oregon State University and a master’s degree in executive leadership from the University of San Diego School of Business.
Barrett (“Barry”) H. Horn, 77, is the Executive Vice President, National Production of the Issuer. He has held this position since August 2020. In this role, Barry oversees retail production and focuses on strategic planning and retail sales operations. Barry joined Guild Mortgage Co. as a Senior Vice President in 2008, when Guild Mortgage Co. acquired Liberty Financial Group, a full-service mortgage banking company based in Washington for which Barry was the founder and served as Chairman and Chief Executive Officer. Since 2014, Barry has served as Guild Mortgage Co.’s Executive Vice President, National Production. Prior to joining Guild Mortgage Co., Barry also served as the Executive Vice President of Worldwide Sales at Attachmate Corporation, a software company, as the Chief Executive Officer of Saltmine LLC, a web development and consulting company, and in several executive sales positions over
140
Table of Contents
the course of his 16 years at IBM Corporation, a technology company. Barry currently serves as the chairman of the board of trustees of Northwest University, a private liberal arts university, Liberty Road Foundation, a nonprofit organization, and Vossler Media Group, a creative agency and production company. Barry earned a bachelor of arts degree in business administration degree from Taylor University.
Patrick J. Duffy, 49, has served as a Director and as the Chairman of the Board of Directors of the Issuer since August 2020. From 2018 and until the completion of this offering and the reorganization transactions, Patrick served as a member of the board of directors of Guild Mortgage Co. Patrick is the President and Managing Partner of McCarthy Capital, which he joined in 2007. Patrick serves as a director on the boards of various McCarthy Capital entities and portfolio companies including Altair Global Services, LLC, a global relocation services company, Life Care Companies, LLC, a manager and developer of senior living communities, ReAlign Insurance Holdings, LLC and certain of its subsidiaries, and Sigilo, LLC (dba Spreetail), an e-commerce company. Patrick also currently serves on the board of directors of the Children’s Scholarship Fund of Omaha. Patrick earned a bachelor of science degree from the Marshall School of Business, University of Southern California, and a juris doctor degree from Creighton University School of Law. We believe Patrick is qualified to serve as a member of our Board of Directors because of his extensive experience in business, finance and investing in and advising companies.
Martha E. Marcon, 71, has served as a Director of the Issuer since October 2020. Before her retirement in 2006, Martha was a partner at KPMG LLP, where she served as the firm’s National Resource Partner for the Insurance Industry and as its Western Region Insurance Industry Leader. Since 2008, Martha has served as a director of Mercury General Corporation, a public company engaged primarily in underwriting automobile insurance. She also currently serves as a director of Foresters Financial, an international insurance and financial services firm, and as a member of the board of the Nonprofits Insurance Alliance. Martha earned a bachelor of science degree, summa cum laude, in economics and business administration from Lehigh University. We believe Martha is qualified to serve as a member of our Board of Directors because of her accounting and financial reporting expertise.
Edward (“Junior”) Bryant, Jr., 49, has served as a Director of the Issuer since October 2020. Since 2018, Junior has served as an Executive Director of Business Development at HGGC, a private equity firm based in Palo Alto, California. Prior to that, from 2011 to 2017, Junior served as the Vice President and National Marketing and Sales Director for Pacific Global Investment Management Company, an investment management firm. Before that, Junior co-founded Smith & Bryant, Inc., a real estate investment company, and served as its Vice President from 1998 to 2010. A veteran of the National Football League, Junior retired from the San Francisco 49ers in 2003 after a 10-year career as a defensive lineman. Junior earned a bachelor degree in business administration from the University of Notre Dame. We believe Junior is qualified to serve as a member of our Board of Directors because of his extensive experience in the real estate industry and in investing in and advising companies.
Michael (“Mike”) C. Meyer, 62, has served as a Director of the Issuer since August 2020 and as a member of the board of directors of Guild Mortgage Co. since 2013. From 2015 until the completion of this offering and the reorganization transactions, Mike served as the Chairman of the board of directors of Guild Mortgage Co. Since 2013, Mike has served as an operating partner and as Portfolio Director for McCarthy Capital. From 1995 to 2014, Mike served in a variety of finance and operational management executive positions at Tenaska, Inc., an energy company. From 1987 to 1995, Mike served at the U.S. Treasury Department in the Office of the Comptroller of the Currency as a National Bank Examiner. Mike earned both a bachelor of science in business administration degree and a master of business administration degree from Creighton University. Mike currently serves on the board of directors of Bridges Holding Company, an investment advisory firm. Mike previously served on the board of directors of Bridges Investment Fund, a general equity fund. We believe Mike is qualified to serve as a member of our Board of Directors because of his extensive experience in finance, banking, and operational management.
141
Table of Contents
Controlled Company
We have applied to list the shares of our Class A common stock offered in this offering on the NYSE. As MCMI will continue to control more than 50% of the combined voting power of our outstanding common stock upon the completion of this offering, we will be considered a “controlled company” for the purposes of the NYSE’s rules and corporate governance standards. As a “controlled company,” we will be permitted, and we intend, to elect not to comply with certain corporate governance requirements, including (i) those that would otherwise require our Board of Directors to have a majority of independent directors, (ii) those that would require that we establish a compensation committee composed entirely of independent directors and (iii) those that would require we have a nominating and corporate governance committee composed entirely of independent directors.
Election of Directors
At the completion of this offering, we expect that our Board of Directors will initially be divided into three classes, each of which is expected to be composed initially of two or three directors. The directors designated as Class I directors will have terms expiring at the first annual meeting of stockholders following the completion of this offering, which we expect to hold in 2021. The directors designated as Class II directors will have terms expiring at the following year’s annual meeting of stockholders, which we expect to hold in 2022, and the directors designated as Class III directors will have terms expiring at the following year’s annual meeting of stockholders, which we expect to hold in 2023. Commencing with the first annual meeting of stockholders following the completion of this offering, directors for each class will be elected at the annual meeting of stockholders held in the year in which the term for that class expires and thereafter will serve for a term of three years. At any meeting of stockholders for the election of directors at which a quorum is present, the election will be determined by a plurality of the votes cast by the stockholders entitled to vote in the election.
| • | Our Class I directors will initially be Mike Meyer and Mary Ann McGarry. |
| • | Our Class II directors will initially be Patrick Duffy and Terry Schmidt. |
| • | Our Class III directors will initially be Junior Bryant and Martha Marcon. |
We expect our bylaws will provide that the authorized number of directors may only be changed by a resolution adopted by a majority of our Board of Directors.
Director Independence
We intend to avail ourselves of the “controlled company” exception under the rules of the NYSE, which exempts us from certain requirements, including the requirements that we have a majority of independent directors on our Board of Directors and that we have compensation and nominating and corporate governance committees composed entirely of independent directors. We will, however, remain subject to the requirement that we have an audit committee composed entirely of independent members by the end of the transition period for companies listing in connection with an initial public offering.
If at any time we cease to be a “controlled company” under the rules of the NYSE, the Board of Directors will take all action necessary to comply with the applicable rules of the NYSE, including appointing a majority of independent directors to the Board of Directors and establishing certain committees composed entirely of independent directors, subject to permitted phase-in periods.
Based upon information requested from and provided by each director concerning his or her background, employment and affiliations, including family relationships, our Board of Directors has determined that Martha Marcon and Junior Bryant are “independent” as defined under the rules of the NYSE. Our Board of Directors also determined that Martha Marcon and Junior Bryant, who serve on our Audit Committee, satisfy the independence standards for that committee established by the SEC and the rules of the NYSE. In making such determinations, our Board of Directors considered the relationships that each such non-employee director has with our Company and all other facts and circumstances our Board of
142
Table of Contents
Directors deemed relevant in determining independence, including the beneficial ownership of our capital stock by each non-employee director and any institutional stockholder with which he or she is affiliated.
Board Committees
Our Board of Directors has established standing committees in connection with the discharge of its responsibilities. These committees include the Audit Committee, the Compensation Committee and the Nominating and Corporate Governance Committee. Our Board of Directors may also establish such other committees as it deems appropriate, in accordance with applicable law and our corporate governance documents. Following this offering, a copy of each committee’s charter will be posted on the investor relations section of our website, www.guildmortgage.com. Information contained on or accessible through our website is not incorporated by reference into this prospectus, and you should not consider such information to be part of this prospectus or in deciding whether to purchase shares of our Class A common stock.
Audit Committee
The Audit Committee’s primary responsibilities will include:
| • | overseeing management’s establishment and maintenance of adequate systems of internal accounting and financial controls; |
| • | reviewing the effectiveness of our legal and regulatory compliance programs; |
| • | overseeing our financial reporting process, including the filing of financial reports; and |
| • | selecting independent auditors, evaluating their independence and performance and approving audit fees and services performed by them. |
The members of our Audit Committee are Martha Marcon, Junior Bryant and Mike Meyer. Our Board of Directors has determined that Martha Marcon is an “audit committee financial expert” as defined by applicable SEC rules.
Compensation Committee
The Compensation Committee’s responsibilities include:
| • | ensuring that our executive compensation programs are appropriately competitive, supporting organizational objectives and stockholder interests and emphasizing pay-for-performance linkage; |
| • | evaluating and approving compensation and setting performance criteria for compensation programs for our chief executive officer and other executive officers; and |
| • | overseeing the implementation and administration of our compensation plans. |
The members of our Compensation Committee are Mike Meyer, Junior Bryant and Patrick Duffy. None of our executive officers serves as a member of our Board of Directors or Compensation Committee, or other committee serving an equivalent function, of any entity that has one or more executive officers who serve as members of our Board of Directors or a committee of our Board of Directors.
Nominating and Corporate Governance Committee
The Nominating and Corporate Governance Committee’s responsibilities include:
| • | recommending nominees for our Board of Directors and its committees; |
| • | recommending the size and composition of our Board of Directors and its committees; |
| • | reviewing our corporate governance guidelines and proposed amendments to our certificate of incorporation and bylaws; and |
| • | reviewing and making recommendations to address stockholder proposals. |
143
Table of Contents
The members of our Nominating and Corporate Governance Committee are Junior Bryant, Martha Marcon and Mike Meyer.
Code of Business Conduct and Ethics
Prior to the completion of this offering, our Board of Directors intends to adopt a code of business conduct and ethics, or “Code of Ethics,” which will apply to all of our directors, officers and employees, including our principal executive officer, principal financial officer, principal accounting officer and persons performing similar functions. The Code of Ethics will be available on our website at www.guildmortgage.com. If we amend or grant any waiver from a provision of our Code of Ethics that applies to any of our executive officers, we will publicly disclose such amendment or waiver on our website and as required by applicable law.
144
Table of Contents
This section provides a discussion of the compensation paid or awarded to our principal executive officer and our two other most highly compensated executive officers as of December 31, 2019. We refer to these individuals as our named executive officers. For fiscal year 2019 our named executive officers were:
| Name |
Title | |
| Mary Ann McGarry |
Chief Executive Officer | |
| Terry L. Schmidt |
President | |
| Barrett (“Barry”) H. Horn |
Executive Vice President, National Product Manager |
This discussion contains forward-looking statements that are based on our current plans, considerations, expectations and determinations regarding future compensation programs. Actual compensation programs that we adopt may differ materially from currently planned programs as summarized in this discussion. As an “emerging growth company,” as defined in the JOBS Act, we are not required to include a Compensation Discussion and Analysis section and have elected to comply with the reduced disclosure requirements applicable to emerging growth companies.
Overview
Our current executive compensation program is intended to align executive compensation with our business objectives and to enable us to attract, retain and reward executive officers who contribute to our long-term success. The compensation paid or awarded to our executive officers is generally based on an assessment of each individual’s performance compared against the business objectives established for the fiscal year as well as our historical compensation practices. For fiscal year 2019, the material elements of our compensation program were base salary and short-term cash incentive compensation.
We expect that our executive compensation program will evolve to reflect our status as a new publicly traded company, while still supporting our overall business and compensation objectives. Therefore, the compensation reported in the Summary Compensation Table below for fiscal year 2019 is not necessarily indicative of how we will compensate our named executive officers in the future. We expect that we will continue to review, evaluate and modify our compensation framework and that the compensation program following this offering may vary significantly from our historical practices. In connection with this offering, we have retained Meridian Compensation Partners, an independent a compensation consultant to perform a market-based review of our executive compensation program and to advise regarding the design of our post-offering executive compensation program.
Compensation of Named Executive Officers
Base Salary
Base salaries are intended to provide a level of compensation sufficient to attract and retain an effective management team, when considered in combination with the other components of our executive compensation program. The relative levels of base salary for our named executive officers are designed to reflect each named executive officer’s scope of responsibility and accountability with the Company. Please see the “Salary” column of the Summary Compensation Table below for the base salary amounts received by each named executive officer in fiscal year 2019.
Short-Term Cash Incentive Compensation
Historically, we have generally provided our senior leadership team with short-term incentive compensation based on achievement of pre-established performance goals.
During fiscal year 2019, Ms. McGarry and Ms. Schmidt participated in an annual cash incentive program. Under the terms of the program, an incentive pool is funded based on the level of achievement of
145
Table of Contents
return on average equity, which is defined as the Company’s pre-tax profit and loss (with an adjustment to add back any book entry to recapture or impairment of servicing rights), divided by the average of the book value of the Company for the fiscal year as reflected on the Company’s balance sheet as of the last day of each calendar quarter during fiscal year 2019. The funding level is determined in accordance with the matrix set forth below. The funded incentive pool is then allocated among the participants in accordance with the percentage allocation set forth in each participant’s executive compensation agreement.
| Tier |
ROAE |
Incentive Pool | ||
| 0 |
Less than 15.00% | $750,000 | ||
| 1 |
15.00%—19.99% | $875,000 | ||
| 2 |
20.00%—24.99% | $1,750,000 | ||
| 3 |
25.00%—29.99% | $2,625,000 | ||
| 4 |
30.00% | $3,500,000 | ||
| 5 |
Greater than 30.00% | $3,500,000 plus an additional amount to be mutually determined by the Chief Executive Officer and Chairman of the Board of Directors |
For fiscal year 2019, the actual level of return on average equity was 38% and the incentive pool was funded at $3,500,000. Ms. McGarry’s allocation of the pool was 44.5% and Ms. Schmidt’s allocation of the pool was 36.7%.
During fiscal year 2019, Mr. Horn was eligible to receive two forms of short-term cash incentive compensation, a volume override bonus and a quarterly bonus. The volume override bonus is paid on a monthly basis, subject to Mr. Horn’s continued employment through the entire applicable month, and is calculated as 0.6 basis points of the adjusted gross loan amount involved in each in-house loan closing, which is defined as company closed and funded residential mortgage loans in the applicable month that are not unfunded, plus certain loans closed under the Company’s direct lending channel. The quarterly bonus is calculated as 0.95% of the total adjusted regional contribution, which is defined as the total region income, marketing income and operation center contributions, minus region expense, acquisition payouts and corporate costs, and is paid in quarterly draws, subject to Mr. Horn’s continued employment through the entire applicable quarter, equal to 75% of the cumulative year-to-date calculated bonus amount, for each of the first three calendar quarters, plus a final payment for the fourth quarter equal to 100% of the calculated bonus amount not previously paid in the fiscal year. For fiscal year 2019, Mr. Horn received an aggregate volume override bonus of $1,226,081, based on the aggregate adjusted gross loan amount involved in in-house closings of $20,434,692,887, and cumulative quarterly bonuses of $1,132,806, based on the total adjusted regional contribution of $119,242,802.
Profits Interests
Our named executive officers did not receive any equity-based awards in fiscal year 2019. Certain of our named executive officers had received awards of profits interests in prior years, and all such awards were fully vested as of December 31, 2019. As of December 31, 2019, Ms. McGarry and Ms. Schmidt held fully vested Class B Units of Guild Management LLC, which was an equity holder of Guild Investors, LLC, our former parent entity (the “Profits Interests”). The Profits Interests are subject to specified hurdle amounts that function like option exercise prices because the Profits Interests do not participate in distributions by Guild Management LLC until distributions to other equity holders of Guild Management LLC have exceeded the relevant hurdle amounts. See “Outstanding Equity Awards at Fiscal Year-End” below for further information regarding the outstanding Profits Interests held by Ms. McGarry and Ms. Schmidt as of December 31, 2019.
In connection with the reorganization transactions, Guild Management LLC will be dissolved and its members, including holders of the Profits Interests, will receive a pro rata liquidating distribution of shares of the Issuer’s common stock (with holders of Profits Interests receiving shares of the Issuer’s Class A
146
Table of Contents
common stock). The shares of the Issuer’s Class A common stock to be distributed to Ms. McGarry and Ms. Schmidt in respect of their Profits Interests are included in the total number of shares of the Issuer’s Class A common stock to be held by Ms. McGarry and Ms. Schmidt after this offering that is shown in the section of this prospectus entitled “Principal and Selling Stockholders.”
Retirement and Deferred Compensation Plans
The Company maintains a 401(k) plan, which is a U.S. tax-qualified retirement plan offered to all eligible employees, including our named executive officers, that permits eligible employees to elect to defer a portion of their compensation on a pre-tax basis. In 2019, participants in the 401(k) plan, including our named executive officers, were eligible for company matching contributions equal to 40% of the participant’s contributions up to a maximum of 6% of eligible compensation under the plan. We do not maintain any defined benefit pension plans.
The Company maintains the Compensation Deferral Plan for Executives (the “Deferred Compensation Plan”), a nonqualified deferred compensation plan that was frozen effective as of December 31, 2007. Ms. McGarry and Ms. Schmidt participate in the Deferred Compensation Plan and in 2007 their accounts under the Deferred Compensation Plan became notionally invested in phantom units, a reference security that notionally tracked the value of Class A units in Guild Management LLC, an equityholder of Guild Investors, LLC, our former parent entity. Each time a cash dividend was paid with respect to Class A units during 2019, a corresponding dividend was notionally credited with respect to the phantom units held in Ms. McGarry’s and Ms. Schmidt’s accounts. Ms. McGarry and Ms. Schmidt are able to direct the notional investment of the dividend amounts into various investment alternatives offered under the Deferred Compensation Plan, which alternatives generally track the investment alternatives available under the 401(k) plan. In connection with the offering, it is expected that the phantom units held by Ms. McGarry and Ms. Schmidt will be converted into notional cash balances based on the then-current fair market value of the phantom units, and that Ms. McGarry and Ms. Schmidt will be permitted to notionally invest the converted cash balances in the investment alternatives made available under the Deferred Compensation Plan.
IPO Equity Award Grants
In connection with this offering, we intend to grant restricted stock unit awards under our 2020 Omnibus Incentive Plan (a description of which is included below) to non-employee directors (as described below under “Non-Employee Director Compensation”) and certain employees, including our named executive officers. The approximate aggregate grant date value of such awards is expected to be $21.6 million. The number of restricted stock units that will be issued will be equal to the grant date value of each award divided by our public offering price. In particular, it is anticipated that Ms. McGarry, Ms. Schmidt and Mr. Horn will each receive an award of restricted stock units with a grant date value of $1.9 million, $1.75 million, and $1.125 million, respectively, which corresponds to 105,555, 97,222, and 62,500 shares of our Class A common stock, respectively, based on the midpoint of estimated price range set forth on the front cover of this prospectus. The restricted stock units granted to the named executive officers will vest in installments, with 25% vesting on each of the second and third anniversaries of the grant date and 50% vesting on the fourth anniversary of the grant date, in each case, generally subject to continued employment through the applicable vesting date.
147
Table of Contents
Summary Compensation Table
The following table shows the compensation earned by our named executive officers for the fiscal year ending December 31, 2019.
| Name and Principal Position |
Year | Salary ($) |
Non-Equity Incentive Plan Compensation ($) |
All Other Compensation ($)(1) |
Total ($) |
|||||||||||||||
| Mary Ann McGarry Chief Executive Officer |
2019 | 600,000 | 1,558,002 | 488,021 | 2,646,023 | |||||||||||||||
| Terry Schmidt President |
2019 | 425,000 | 1,284,767 | 488,073 | 2,197,840 | |||||||||||||||
| Barry Horn Executive Vice President, National Production Manager |
2019 | 375,000 | 2,358,888 | 13,918 | 2,747,806 | |||||||||||||||
| (1) | The amounts reported in this column represent: (i) for Ms. McGarry, $472,507 of dividend equivalents credited in 2019 with respect to phantom units notionally held under the Deferred Compensation Plan (Ms. McGarry’s account under the Deferred Compensation Plan is fully vested and has been notionally invested in phantom units since 2007), $6,840 of company matching contributions under the 401(k) plan, and $8,674 relating to attendance at a President’s Club sales trip, (ii) for Ms. Schmidt, $472,507 of dividend equivalents credited in 2019 with respect to phantom units notionally held under the Deferred Compensation Plan (Ms. Schmidt’s account under the Deferred Compensation Plan is fully vested and has been notionally invested in phantom units since 2007), $6,840 of company matching contributions under the 401(k) plan, and $8,726 relating to attendance at a President’s Club sales trip, and (iii) for Mr. Horn, $6,840 of company matching contributions under the 401(k) plan, and $7,078 relating to attendance at a President’s Club sales trip. |
Narrative Disclosure to Summary Compensation Table
Executive Compensation Agreements with Ms. McGarry and Ms. Schmidt
Ms. McGarry is party to an executive compensation agreement with the Company effective as of January 1, 2019, which provides for an initial one-year term ending on January 1, 2020, subject to automatic renewal for successive one-year terms, unless the Company and Ms. McGarry mutually agree to terminate the agreement or Ms. McGarry’s employment is terminated by the Company or Ms. McGarry. Pursuant to the executive compensation agreement, Ms. McGarry is eligible to receive an annual base salary equal to $600,000 and an annual bonus in accordance with the annual bonus program for partners described above under “Compensation of Named Executive Officers–Short-Term Cash Incentive Compensation.” Under the terms of the executive compensation agreement, upon Ms. McGarry’s termination of employment, Ms. McGarry is entitled to receive a prorated bonus for the calendar year of termination based on actual performance and, if the termination of employment is initiated by the Company, subject to Ms. McGarry’s execution of a waiver and release in a form acceptable to the Company, a cash payment of $600,000, in 24 monthly installments of $25,000 beginning 30 days after the last day of Ms. McGarry’s employment with the Company. The executive compensation agreement also includes a one-year post-termination employee no hire and employee nonsolicitation covenant.
Ms. Schmidt is also party to an executive compensation agreement with the Company effective as of January 1, 2019, which provides for an initial one-year term ending on January 1, 2020, subject to automatic renewal for successive one-year terms, unless the Company and Ms. Schmidt mutually agree to terminate the agreement or Ms. Schmidt’s employment is terminated by the Company or Ms. Schmidt. Pursuant to the executive compensation agreement, Ms. Schmidt is eligible to receive an annual base
148
Table of Contents
salary equal to $425,000 and an annual bonus in accordance with the annual bonus program for partners described above under “Compensation of Named Executive Officers–Short-Term Cash Incentive Compensation.” Under the terms of the executive compensation agreement, upon Ms. Schmidt’s termination of employment, Ms. Schmidt is entitled to receive a prorated bonus for the calendar year of termination based on actual performance and, if the termination of employment is initiated by the Company, subject to Ms. Schmidt’s execution of a waiver and release in a form acceptable to the Company, a cash payment of $425,000, in 24 monthly installments of $17,708.33 beginning 30 days after the last day of Ms. Schmidt’s employment with the Company. The executive compensation agreement also includes a one-year post-termination employee no hire and employee nonsolicitation covenant.
Employment Agreement with Mr. Horn
Mr. Horn is party to an employment agreement with the Company dated as of January 1, 2016. Pursuant to the employment agreement, Mr. Horn is eligible to receive a base salary of $31,250 per month and the volume override and quarterly bonuses described above under “Compensation of Named Executive Officers–Short-Term Cash Incentive Compensation.” The employment agreement does not provide for any payments upon termination of Mr. Horn’s employment with the Company.
Outstanding Equity Awards at Fiscal Year-End
The following table sets forth information regarding outstanding equity compensation awards held as of December 31, 2019 by our named executive officers. Such awards were in the form of Profits Interests, which do not relate to the common stock of the Issuer.(1)
| Name |
Number of securities underlying unexercised options exercisable (#) |
Option exercise price ($)(2) |
Option expiration date |
|||||||||
| Mary Ann McGarry Profits Interests |
3,666 | (3 | ) | N/A | ||||||||
| Profits Interests |
7,500 | (4 | ) | N/A | ||||||||
| Profits Interests |
6,166 | (5 | ) | N/A | ||||||||
| Profits Interests |
2,500 | (6 | ) | N/A | ||||||||
| Terry Schmidt Profits Interests |
2,999 | (3 | ) | N/A | ||||||||
| Profits Interests |
6,832 | (4 | ) | N/A | ||||||||
| Profits Interests |
5,499 | (5 | ) | N/A | ||||||||
| Profits Interests |
2,500 | (6 | ) | N/A | ||||||||
| (1) | The Profits Interests will no longer be outstanding following completion of the reorganization transactions. See “Compensation of Named Executive Officer—Profits Interests” above. |
| (2) | Each Profits Interest is granted with a hurdle amount, which functions similarly to an option exercise price because the Profits Interests do not participate in distributions to equity holders of Guild Management LLC up to that amount. Instead, a holder of Profits Interests would only participate in distributions to equity holders of Guild Management LLC in excess of the applicable hurdle amount and such participation would be in proportion to the relative ownership of Guild Management LLC represented by such Profits Interests. |
| (3) | These Profits Interests had an aggregate hurdle amount of $6,300,000, which means that Ms. McGarry and Ms. Schmidt are entitled to participate in distributions in excess of $6,300,000 with respect to these Profits Interests. As of December 31, 2019, cumulative distributions by Guild Management LLC had exceeded $6,300,000. |
149
Table of Contents
| (4) | These Profits Interests had an aggregate hurdle amount of $18,949,729, which means that Ms. McGarry and Ms. Schmidt are entitled to participate in distributions in excess of $18,949,729 with respect to these Profits Interests. As of December 31, 2019, cumulative distributions by Guild Management LLC had exceeded $18,949,729. |
| (5) | These Profits Interests had an aggregate hurdle amount of $51,887,981, which means that Ms. McGarry and Ms. Schmidt are entitled to participate in distributions in excess of $51,887,981 with respect to these Profits Interests. As of December 31, 2019, cumulative distributions by Guild Management LLC had exceeded $51,887,981. |
| (6) | These Profits Interests had an aggregate hurdle amount of $118,476,109, which means that Ms. McGarry and Ms. Schmidt are entitled to participate in distributions in excess of $118,476,109 with respect to these Profits Interests. As of December 31, 2019, the total cumulative distributions made by Guild Management LLC was $61,886,066 and, therefore, cumulative distributions by Guild Management LLC had not exceeded $118,476,109. |
Non-Employee Director Compensation
In 2019, the Issuer had not yet been formed and did not have a Board of Directors. Prior to this offering, we did not maintain a formal director compensation policy.
In preparing for this offering, we worked with Meridian Compensation Partners, our independent
compensation consultant, to design a compensation program for our non-employee directors that will become effective upon the completion of this offering. Following the completion of this offering, our non-employee directors will be compensated for service on our Board of Directors pursuant to our program described below.
Annual Cash Retainer
Each non-employee member of our Board of Directors will receive a $50,000 annual cash retainer. The
chairman of the Board of Directors, chairpersons and members of each committee of the Board of Directors will also receive the additional annual cash retainers described below:
| • | Chairman. The Chairman of our Board of Directors will receive an annual cash retainer of $25,000. |
| • | Audit Committee Members. The chairperson of the Audit Committee will receive an annual cash retainer of $25,000 and all other committee members will receive an annual cash retainer of $10,000. |
| • | Compensation Committee Members. The chairperson of the Compensation Committee will receive an annual cash retainer of $15,000 and all other committee members will receive an annual cash retainer of $7,500. |
| • | Nominating and Corporate Governance Committee Chairperson. The chairperson of the Nominating and Corporate Governance Committee will receive an annual cash retainer of $10,000 and all other committee members will receive an annual cash retainer of $5,000. |
Equity Retainer
Annual RSU Retainer. On an annual basis, each non-employee director will be eligible to receive an annual grant of a number of restricted stock units with a grant date value equal to $100,000 ($150,000 in the case of the Chairman of our Board of Directors), which will be granted on the date of our annual shareholder meeting and will vest, generally subject to continued service on the Board of Directors, on the date of the following year’s annual shareholder meeting.
150
Table of Contents
Initial RSU Grant. Upon completion of this offering, each non-employee director will receive an initial grant of restricted stock units with a grant date value equal to $100,000, which will vest, generally subject to continued service on the Board of Directors, on the first anniversary of the completion of this offering.
After the completion of this offering, if a new director is appointed other than at an annual meeting of shareholders, the director will receive an initial award of restricted stock units with a grant date value equal to $100,000 prorated for the portion of the director compensation year for which such new director will be serving, which will vest, generally subject to continued service on the Board of Directors, on the date of the next annual meeting of shareholders following such director’s appointment.
2020 Omnibus Incentive Plan
In connection with this offering, our Board of Directors intends to adopt, and our current shareholders are expected to approve, our 2020 Omnibus Incentive Plan (the “2020 Plan”), prior to the effective date of this offering. The 2020 Plan is expected to have the terms substantially as set forth below.
Purpose. The purpose of our 2020 Plan is to give the Company a competitive advantage in attracting, retaining and motivating officers, employees, directors and/or consultants and to enable the Company to provide incentives for future performance of services directly linked to the profitability of the Company’s businesses and increases in Company shareholder value.
Stock Awards and Eligibility. The 2020 Plan provides for the grant of incentive stock options
(“ISOs”), nonstatutory stock options, stock appreciation rights, restricted stock awards, restricted stock unit awards and other forms of equity-based compensation. Additionally, the 2020 Plan provides for the grant of cash-denominated awards. ISOs may be granted only to employees. All other awards may be granted to current and prospective directors, officers, employees, and consultants of the Company and its affiliates.
Class A Common Stock Subject to the 2020 Plan. The maximum number of shares of our Class A common stock that may be granted pursuant to awards under our 2020 Plan is 5,500,000. The maximum number of shares of our Class A common stock that may be granted pursuant to ISOs is 5,500,000.
The shares of our Class A common stock covered by any award that is forfeited, terminates, expires,
lapses without being exercised or is settled for cash will again become available for issuance under the 2020 Plan. If the tax withholding obligations relating to any full-value award are satisfied by withholding shares relating to such full-value award, such withheld shares shall not reduce the share reserve. With respect to any stock option or stock appreciation right, if the exercise price and/or tax withholding obligations are satisfied by delivering shares to us (by actual delivery or attestation), or if the exercise price and/or tax withholding obligations are satisfied by withholding shares otherwise issuable pursuant to the stock option or stock appreciation right, the share reserve shall nonetheless be reduced by the gross number of shares subject to the stock option or stock appreciation right.
Director Compensation Limitations. No non-employee director may receive compensation in such
capacity during any calendar year that exceeds $500,000 (calculating the value of any equity compensation awards for such purpose based on the grant date fair value of such awards for financial reporting purposes). For purposes of the preceding sentence, an equity-based award shall be deemed received upon grant (and not upon vesting or settlement) and any deferred cash compensation shall be deemed received when earned (and not when paid).
Administration. Our 2020 Plan will be administered by our Board of Directors directly, or if the
Board of Directors elects, by the Compensation Committee (or such other committee of the Board of Directors as our Board of Directors may from time to time designate) (the “Committee”), provided that, subject to law, all powers of the Committee may be exercised by the full Board of Directors. Among other
151
Table of Contents
things, the Committee will have the authority to select individuals to whom awards may be granted, determine the types of awards (as well as the number of shares of common stock to be covered by such award) granted, and determine and modify the terms and conditions of any such award.
Stock Options and Stock Appreciation Rights. Stock options entitle the participant to purchase a
specified number of shares of Class A common stock at a price equal to the per share exercise price of the stock options. Stock appreciation rights entitle the participant to receive an amount in cash or shares with a value equal to the product of (i) the difference between the fair market value of one share of Class A common stock on the exercise date and the per share exercise price, multiplied by (ii) the number of shares of Class A common stock subject to the stock appreciation rights. The exercise price of a stock option or stock appreciation right award will be determined by the Committee and provided in the applicable award agreement, and will not be less than the fair market value (as defined in the 2020 Plan) of a share of Class A common stock on the grant date. In no event may any stock appreciation right or stock option granted under the 2020 Plan be amended (other than as described below under “Plan and Award Adjustments”) to decrease the exercise price, be canceled in exchange for cash or other awards if the exercise price of such stock appreciation right or stock option exceeds the fair market value of a share of Class A common stock on the date of such cancellation, be canceled in exchange for any new stock appreciation right or stock option with a lower exercise price, or otherwise be subject to any action that would be treated, under the applicable stock exchange listing standards or for accounting purposes, as a “repricing,” unless such amendment, cancellation or action is approved by the Company’s stockholders. The term of each stock appreciation right and stock option is fixed by the Committee, but cannot be more than 10 years after the grant date. The effect of a participant’s termination of service on any award held by the participant will be described in the applicable award agreement for the award.
A stock option that is intended to qualify as an ISO may not be granted to an eligible individual who at grant owns more than 10% of the total combined voting power of all classes of stock of the Company, unless at the time the exercise price of such ISO is at least 110% of the fair market value of a share and is not exercisable after the fifth anniversary of the grant date. In addition, the aggregate fair market value of the shares at grant for which ISOs become exercisable by a participant during any calendar year may not exceed $100,000.
Restricted Stock. Shares of restricted stock are actual shares of our Class A common stock issued
to a participant. The Committee may require that restricted stock vest based on either the continued service of the participant, the attainment of performance goals or a combination of both. Except as provided in the applicable award agreement, a participant holding shares of restricted stock will have all the rights of a stockholder holding shares of Class A common stock, including, if applicable, the right to vote the shares and the right to receive any dividends, except that, unless otherwise determined by the Committee, cash dividends shall be payable in cash and shall be held subject to vesting of the underlying restricted stock and stock dividends shall be payable in restricted stock and shall be held subject to the vesting of the underlying restricted stock.
Restricted Stock Units. Restricted stock units are awards denominated in shares that will be settled, subject to the applicable award’s terms and conditions, in a specified number of shares of our Class A common stock or cash equal to the fair market value of the number of shares of Class A common stock. The Committee may require that restricted stock units vest based on either the continued service of the participant, the attainment of performance goals or a combination of both. Restricted stock units will be settled upon vesting or at a later time if permitted pursuant to a deferred compensation arrangement. A participant holding restricted stock units shall have no rights as a shareholder with respect to the shares of Class A common stock unless and until the shares are actually delivered to the participant in settlement of the units. Certain restricted stock unit awards may be eligible for dividends or dividend equivalents, which, unless otherwise determined by the Committee, shall be held subject to the vesting of the underlying restricted stock units.
152
Table of Contents
Other Stock-Based Awards. Other stock-based awards are awards under the 2020 Plan not otherwise
specifically described in the 2020 Plan that are valued by reference to, or otherwise relate to, shares of our Class A common stock, and which are subject to terms and conditions consistent with the terms of the 2020 Plan that are determined by the Committee.
Cash Awards. Cash awards are awards under the 2020 Plan that are denominated and payable in cash and which are subject to such terms and conditions consistent with the terms of the 2020 Plan as are determined by the Committee.
Transferability of Awards. Unless otherwise determined by the Committee, awards generally are not transferable other than by will or by the laws of descent or distribution.
Plan and Award Adjustments. In the event of (i) a merger, consolidation, acquisition of property or shares, stock rights offering, liquidation, disposition for consideration of an equity interest in a subsidiary or affiliate, or similar event affecting the Company; or (ii) a stock dividend, stock split, reverse stock split, reorganization, share combination, or recapitalization or similar event affecting the capital structure of the Company, or a disaffiliation, separation or spinoff, or other extraordinary dividend, the Committee or our Board of Directors may (or, in certain cases, will) in its discretion, in the case of events described in clause (i) and (ii), make such substitutions or adjustments as it deems appropriate and equitable to: (A) the aggregate number and kind of shares or other securities reserved for issuance and delivery under the 2020 Plan; (B) the various maximum limitations on the grants to individuals of certain types of awards; (C) the number and kind of shares or other securities subject to outstanding awards; (D) financial goals or results relating to a performance goal; and (E) the exercise price of outstanding awards. In the case of certain corporate transactions, such an adjustment may consist of cancellation of outstanding awards in exchange for payments of cash, property or a combination of both having an aggregate value equal to the value of such awards, which in the case of an option may be the excess, if any of the deal consideration per share over the per share exercise price.
Upon a change in control of the Company, participants will be granted replacement awards by the acquiring or surviving company that are of the same type held prior to the change in control. Performance awards will be converted into replacement time-based awards for the remainder of the applicable performance period (or such shorter period determined by the Committee), with the number of underlying shares determined based on the greater of actual performance through the latest practicable date prior to the change in control and target performance. Replacement awards will generally continue to vest on the same schedule as the original awards, except that, if a participant’s employment is terminated by the Company without cause and not due to the participant’s death or disability, within the 24 months following the change in control, then the participant’s replacement awards will become vested in full. In the event an acquiring or surviving company refuses to issue replacement awards, or if the acquiring or surviving company is not a publicly held company, then all awards under the 2020 Plan will become vested in full upon the change in control, with performance awards vesting at the greater of actual performance through the latest practicable date prior to the change-in-control and target performance. The
terms “cause,” “good reason” and “change in control” are defined in the 2020 Plan.
Termination and Amendment. Our 2020 Plan will automatically terminate ten years from the date of completion of this offering, unless terminated earlier by our Board of Directors. The Committee may amend, alter, suspend or terminate our 2020 Plan at any time, provided that no amendment, alteration or discontinuation may materially impair the rights of any participant with respect to a previously granted award without the participant’s consent.
153
Table of Contents
PRINCIPAL AND SELLING STOCKHOLDERS
The following table sets forth information with respect to the beneficial ownership of our capital stock, as of (i) immediately prior to the completion of this offering and (ii) following the sale of shares of our Class A common stock in this offering, by:
| • | each person, or group of affiliated persons, known by us to beneficially own more than 5% of any class or series of our capital stock (other than directors and named executive officers); |
| • | each of our directors and prospective directors; |
| • | each of our named executive officers; |
| • | all of our executive officers and directors as a group; and |
| • | the selling stockholders. |
The numbers of shares of our Class A common stock and shares of our Class B common stock beneficially owned, percentages of beneficial ownership and percentages of combined voting power of our outstanding common stock before and after this offering that are set forth below are based on the number of shares to be issued and outstanding prior to and after this offering, in each case, after giving effect to the reorganization transactions and assuming an initial public offering price of $18.00 per share, which is the midpoint of the estimated price range set forth on the front cover of this prospectus. See “Organizational Structure.” In addition, the percentage ownership assumes no purchase of shares of our Class A common stock through the reserved share program and that the underwriters’ option to purchase additional shares is not exercised.
The number of shares beneficially owned by each stockholder is determined under rules of the SEC and includes voting or investment power with respect to securities. Under these rules, beneficial ownership includes any shares as to which the individual or entity has sole or shared voting power or investment power. In computing the number of shares beneficially owned by an individual or entity and the percentage ownership of that person, shares of common stock subject to options, warrants or other rights held by such person that are currently exercisable or will become exercisable within 60 days are considered outstanding, although these shares are not considered outstanding for purposes of computing the percentage ownership of any other person.
Unless otherwise indicated, the address of all listed stockholders is c/o Guild Holdings Company, 5887 Copley Drive, San Diego, California 92111. Each of the stockholders listed has sole voting and investment power with respect to the shares beneficially owned by the stockholder unless noted otherwise, subject to community property laws where applicable.
| Class A Common Stock Beneficially Owned (1) |
Class B Common Stock Beneficially Owned (1) |
Number of Shares Offered |
Combined Voting Power (2) |
|||||||||||||||||||||||||||||||||||||||||
| Before This Offering | After This Offering | Before This Offering | After This Offering | Before This Offering |
After This Offering |
|||||||||||||||||||||||||||||||||||||||
| Name and Address of Beneficial |
Number | Percentage | Number | Percentage | Number | Percentage | Number | Percentage | Percentage | Percentage | ||||||||||||||||||||||||||||||||||
| 5% Stockholders |
||||||||||||||||||||||||||||||||||||||||||||
| Entities Associated With McCarthy Partners, LLC(3) |
— | — | — | — | 45,233,291 | 100 | % | 38,825,242 | 100 | % | 6,408,049 | (4) | 96.8 | % | 94.8 | % | ||||||||||||||||||||||||||||
| Directors and Named Executive Officers |
||||||||||||||||||||||||||||||||||||||||||||
| Mary Ann McGarry(5) |
4,911,003 | 33.3 | % | 4,215,278 | 19.9 | % | — | — | — | — | 695,725 | 1.1 | % | 1.0 | % | |||||||||||||||||||||||||||||
| Terry Schmidt |
2,649,492 | 17.9 | % | 2,274,147 | 10.7 | % | — | — | — | — | 375,345 | 0.6 | % | 0.6 | % | |||||||||||||||||||||||||||||
| Barry Horn |
105,817 | 0.7 | % | 90,826 | 0.4 | % | — | — | — | — | 14,991 | 0.0 | % | 0.0 | % | |||||||||||||||||||||||||||||
| Patrick Duffy(6) |
— | — | — | — | 45,233,291 | 100 | % | 38,825,242 | 100 | % | 6,408,049 | (4) | 96.8 | % | 94.8 | % | ||||||||||||||||||||||||||||
| Mike Meyer |
— | — | — | — | — | — | — | — | — | — | — | |||||||||||||||||||||||||||||||||
154
Table of Contents
| Class A Common Stock Beneficially Owned (1) |
Class B Common Stock Beneficially Owned (1) |
Number of Shares Offered |
Combined Voting Power (2) |
|||||||||||||||||||||||||||||||||||||||||
| Before This Offering | After This Offering | Before This Offering | After This Offering | Before This Offering |
After This Offering |
|||||||||||||||||||||||||||||||||||||||
| Name and Address of |
Number | Percentage | Number | Percentage | Number | Percentage | Number | Percentage | Percentage | Percentage | ||||||||||||||||||||||||||||||||||
| Prospective Directors |
||||||||||||||||||||||||||||||||||||||||||||
| Martha Marcon |
— | — | — | — | — | — | — | — | — | — | — | |||||||||||||||||||||||||||||||||
| Junior Bryant |
— | — | — | — | — | — | — | — | — | — | — | |||||||||||||||||||||||||||||||||
| All Directors and Executive Officers as a Group (10 individuals)(6) |
8,053,695 | 54.5 | % | 6,912,755 | 32.6 | % | 45,233,291 | 100 | % | 38,825,242 | 100 | % | 7,548,989 | (4) | 98.6 | % | 96.5 | % | ||||||||||||||||||||||||||
| Other Selling Stockholders |
||||||||||||||||||||||||||||||||||||||||||||
| David Battany |
176,083 | 1.2 | % | 151,138 | 0.7 | % | — | — | — | — | 24,945 | 0.0 | % | 0.0 | % | |||||||||||||||||||||||||||||
| Catherine Blocker |
1,308,789 | 8.9 | % | 1,123,377 | 5.3 | % | — | — | — | — | 185,412 | 0.3 | % | 0.3 | % | |||||||||||||||||||||||||||||
| Theresa Cherry |
1,151,626 | 7.8 | % | 988,479 | 4.7 | % | — | — | — | — | 163,147 | 0.2 | % | 0.2 | % | |||||||||||||||||||||||||||||
| Gemma Currier |
105,650 | 0.7 | % | 90,683 | 0.4 | % | — | — | — | — | 14,967 | 0.0 | % | 0.0 | % | |||||||||||||||||||||||||||||
| Amber Elwell |
105,650 | 0.7 | % | 90,683 | 0.4 | % | — | — | — | — | 14,967 | 0.0 | % | 0.0 | % | |||||||||||||||||||||||||||||
| Katharina Foster |
105,650 | 0.7 | % | 90,683 | 0.4 | % | — | — | — | — | 14,967 | 0.0 | % | 0.0 | % | |||||||||||||||||||||||||||||
| Shayla Gifford |
60,566 | 0.4 | % | 51,986 | 0.2 | % | — | — | — | — | 8,580 | 0.0 | % | 0.0 | % | |||||||||||||||||||||||||||||
| Lisa Klika |
105,650 | 0.7 | % | 90,683 | 0.4 | % | — | — | — | — | 14,967 | 0.0 | % | 0.0 | % | |||||||||||||||||||||||||||||
| Erin Langevin |
105,650 | 0.7 | % | 90,683 | 0.4 | % | — | — | — | — | 14,967 | 0.0 | % | 0.0 | % | |||||||||||||||||||||||||||||
| James Madsen |
140,867 | 1.0 | % | 120,911 | 0.6 | % | — | — | — | — | 19,956 | 0.0 | % | 0.0 | % | |||||||||||||||||||||||||||||
| Robert Myers |
795,971 | 5.4 | % | 683,208 | 3.2 | % | — | — | — | — | 112,763 | 0.2 | % | 0.2 | % | |||||||||||||||||||||||||||||
| Charles Nay |
30,283 | 0.2 | % | 25,993 | 0.1 | % | — | — | — | — | 4,290 | 0.0 | % | 0.0 | % | |||||||||||||||||||||||||||||
| David Neylan |
176,083 | 1.2 | % | 151,138 | 0.7 | % | — | — | — | — | 24,945 | 0.0 | % | 0.0 | % | |||||||||||||||||||||||||||||
| John Pecoraro |
105,650 | 0.7 | % | 90,683 | 0.4 | % | — | — | — | — | 14,967 | 0.0 | % | 0.0 | % | |||||||||||||||||||||||||||||
| Michael Rish |
1,241,633 | 8.4 | % | 1,065,734 | 5.0 | % | — | — | — | — | 175,899 | 0.3 | % | 0.3 | % | |||||||||||||||||||||||||||||
| Linda Scott |
1,384,596 | 9.4 | % | 1,188,445 | 5.6 | % | — | — | — | — | 196,151 | 0.3 | % | 0.3 | % | |||||||||||||||||||||||||||||
|
|
|
|
|
|
|
|
|
|
|
|
|
|
|
|
|
|
|
|
|
|
|
|||||||||||||||||||||||
| Totals |
14,766,709 | 100.0 | % | 12,674,758 | 59.9 | % | 45,233,291 | 100.0 | % | 38,825,242 | 100.0 | % | 8,500,000 | 100.0 | % | 97.9 | % | |||||||||||||||||||||||||||
|
|
|
|
|
|
|
|
|
|
|
|
|
|
|
|
|
|
|
|
|
|
|
|||||||||||||||||||||||
| (1) | Each holder of shares of our Class B common stock is entitled to 10 votes per share and each holder of shares of our Class A common stock is entitled to one vote per share, in each case on all matters submitted to our stockholders for a vote. See “Description of Capital Stock.” |
| (2) | Percentage of voting power represents the combined voting power with respect to all shares of our Class A common stock and shares of our Class B common stock, voting together as a single class. See “Description of Capital Stock.” |
| (3) | Represents the shares of our Class B common stock held by MCMI. McCarthy Partners, LLC exercises voting and investment control over the shares of our Class B common stock held by MCMI. In his capacity as the President of McCarthy Partners, LLC, Mr. Duffy may be deemed to exercise voting and investment control over the shares of our Class B common stock held by MCMI. The business address for MCMI is 1601 Dodge Street, Suite 3800, Omaha, Nebraska 68102. |
| (4) | Includes shares of Class A common stock offered by MCMI on an as-converted basis. |
| (5) | Includes 4,911,003 shares of Class A common stock beneficially owned by Ms. McGarry through McGarry Strategic Enterprises, LLC, in which Ms. McGarry owns a 99% ownership interest. Ms. McGarry serves as the Manager of McGarry Strategic Enterprises, LLC and exercises voting and investment control over the securities held by that entity. The business address for McGarry Strategic Enterprises, LLC is 10666 Frank Daniel Way, San Diego, CA 92131. |
| (6) | Includes the shares of our Class B common stock held by MCMI and over which McCarthy Partners, LLC exercises voting and investment control. In his capacity as the President of McCarthy Partners, LLC, Mr. Duffy may be deemed to exercise voting and investment control over the shares of our Class B common stock held by MCMI. |
155
Table of Contents
The existing units of Guild Investors, LLC were issued in connection with various transactions exempt from registration pursuant to Section 4(a)(2) under the Securities Act: (1) the 2007 purchase of Guild Mortgage Co. from its founder by a management-led partnership that included a majority investment from McCarthy Capital (the “2007 Transaction”), (2) the formation of four management-owned investment vehicles as members of Guild Investors, LLC, (3) certain additional capital contributions made by one of the members of Guild Investors, LLC in 2008 and (4) the issuance of units to a former director upon his retirement. The shares of Guild Mortgage Co. held by Guild Investors, LLC were acquired by Guild Investors, LLC from the founder of Guild Mortgage Co. in the 2007 Transaction.
In connection with the reorganization transactions, the following steps have occurred or will occur:
| • | the Issuer was incorporated in Delaware as a wholly owned subsidiary of Guild Investors, LLC on August 11, 2020; |
| • | Guild Investors, LLC will contribute 100% of the shares of Guild Mortgage Co. to the Issuer, making Guild Mortgage Co. a wholly owned subsidiary of the Issuer; |
| • | the Issuer will amend and restate its certificate of incorporation to, among other things: (1) authorize the issuance of two classes of common stock: Class A common stock and Class B common stock and (2) effect a reclassification and stock split of its 100 existing shares of common stock into 14,766,709 shares of Class A common stock and 45,233,291 shares of Class B common stock; and |
| • | Guild Investors, LLC will be dissolved and its members will receive a pro rata liquidating distribution of shares of the Issuer’s common stock (with MCMI receiving shares of the Issuer’s Class B common stock and all other members receiving shares of the Issuer’s Class A common stock). |
The foregoing transactions have been or will be completed pursuant to the exemption from registration afforded by Section 4(a)(2) under the Securities Act.
156
Table of Contents
CERTAIN RELATIONSHIPS AND RELATED PARTY TRANSACTIONS
Other than compensation arrangements for our executive officers and directors that are described elsewhere in this prospectus, below we describe transactions since January 1, 2017 to which we were or will be a participant and in which:
| • | The amounts involved exceeded or will exceed $120,000; and |
| • | Any of our directors, executive officers or holders of more than 5% of our outstanding voting securities, or any member of the immediate family of, or person sharing the household with, the foregoing persons, had or will have a direct or indirect material interest. |
McCarthy Capital Mortgage Investors, LLC
Two members of our Board of Directors serve as members of the investment team at McCarthy Capital, the private equity firm that controls our majority stockholder, MCMI: Patrick Duffy, the Chairman of our Board of Directors, serves as the President and Managing Partner of McCarthy Capital and Mike Meyer serves as the Portfolio Director of McCarthy Capital.
Reorganization Transactions
In connection with the reorganization transactions, we will enter into certain agreements with certain of our investors, including MCMI and Guild Mortgage Co.’s Chief Executive Officer, Mary Ann McGarry; its President, Terry Schmidt; its Senior Vice President, Chief Financial Officer, Amber Elwell; its Executive Vice President, Chief Operating Officer, David Neylan; its Executive Vice President, National Production, Barry Horn; and its Senior Vice President, Chief Compliance Officer and Secretary, Lisa Klika, which will effect the reorganization transactions. Pursuant to the reorganization transactions, Guild Mortgage Co. will become a wholly owned subsidiary of the Issuer. See “Organizational Structure” for more information.
Registration Rights Agreement
In connection with the reorganization transactions and prior to the consummation of this offering, we intend to enter into a registration rights agreement with MCMI and certain of our other stockholders, including Guild Mortgage Co.’s Chief Executive Officer, Mary Ann McGarry; its President, Terry Schmidt; its Senior Vice President, Chief Financial Officer, Amber Elwell; its Executive Vice President, Chief Operating Officer, David Neylan; its Executive Vice President, National Production, Barry Horn; and its Senior Vice President, Chief Compliance Officer and Secretary, Lisa Klika (the “Registration Rights Agreement”), pursuant to which each of MCMI and the other stockholders party thereto will be entitled to certain rights to require the registration of the sale of certain or all of the shares of our Class A common stock (or, in the case of MCMI, the shares of our Class A common stock received upon conversion of shares of our Class B common stock) that they beneficially own. Among other things, under the terms of the Registration Rights Agreement:
| • | if we propose to file certain types of registration statements under the Securities Act with respect to an offering of equity securities, subject to certain conditions and exceptions, we will be required to use our reasonable best efforts to offer the stockholders party to the Registration Rights Agreement the opportunity to register the sale of all or part of their shares that constitute registrable securities under the Registration Rights Agreement on the terms and conditions set forth in the Registration Rights Agreement (customarily known as “piggyback rights”); and |
| • | MCMI has the right, subject to certain conditions and exceptions, to request that we file (i) registration statements with the SEC for one or more underwritten offerings of all or some of the shares of our Class A common stock received upon conversion of shares of our Class B common stock that it beneficially owns and/or (ii) as soon as we become eligible to register the sale of our securities on Form S-3 under the Securities Act, a shelf registration statement that includes all or some of the shares of our Class A common stock received upon conversion of shares of our Class B common stock that it beneficially owns, and we are required to cause any such registration statements to be filed with the SEC, and to become (and remain) effective, as promptly as reasonably practicable. |
157
Table of Contents
All expenses of registration under the Registration Rights Agreement, including the legal fees of one counsel retained by or on behalf of the stockholders party thereto, will be paid by us. The registration rights granted in the Registration Rights Agreement are subject to customary restrictions such as blackout periods, minimums and limitations on the number of shares to be included in an underwritten offering. The Registration Rights Agreement also contains customary indemnification and contribution provisions. The Registration Rights Agreement is governed by Delaware law.
Payments Made in Connection with the Retirement of Certain Former Executives
On November 15, 2014, Steven Hops, Guild Mortgage Co.’s former Senior Vice President, Business Development, retired. Other executives of the Company, consisting of Mary Ann McGarry, at that time Guild Mortgage Co.’s President and Chief Operating Officer, Terry Schmidt, at that time Guild Mortgage Co.’s Chief Financial Officer, Catherine Blocker, Guild Mortgage Co.’s Executive Vice President, Production Operations, Theresa Cherry, Guild Mortgage Co.’s Regional Senior Vice President, Mike Rish, Guild Mortgage Co.’s Senior Vice President, Secondary/Capital Markets, and Rhona Kaninau, Guild Mortgage Co.’s former Senior Vice President, Loan Administration, exercised their right to purchase Mr. Hops’ units in Guild Management, LLC, one of our former indirect parents. The purchase was funded by Guild Mortgage Co. and in return, Guild Mortgage Co. received a note receivable from Guild Management, LLC for approximately $2.5 million. The note is due in 2024, the outstanding balance on it (including interest), as of June 30, 2020, is $2.6 million, and it is included within other assets on Guild Mortgage Co.’s consolidated balance sheets. Additionally, in connection with Mr. Hops’ retirement, Guild Management, LLC, one of our former indirect parents, purchased all of the units of Guild Investors, LLC held by Mr. Hops in return for a note receivable for approximately $4.68 million (which was subsequently amended by the parties to be for approximately $4.63 million) from Guild Management, LLC to Mr. Hops. Under the terms of a settlement agreement subsequently entered into between Guild Management, LLC and Mr. Hops, all payments due in respect of the note were completed by March 1, 2019 and the note is no longer outstanding.
On January 1, 2019, Rhona Kaninau, Guild Mortgage Co.’s former Senior Vice President, Loan Administration, retired, which triggered a repurchase of her units of one of our former indirect parents, Guild Management, LLC, and a payout under the Deferred Compensation Plan. Guild Investors, LLC sold shares of Guild Mortgage Co. to Ms. Kaninau in exchange for her units of Guild Management, LLC. Ms. Kaninau, in turn, sold those shares back to Guild Mortgage Co. in exchange for a promissory note of $8.0 million that is to be paid in equal installments, with certain exceptions, over 16 quarters. During the year ended December 31, 2019 and the six-month periods ended June 30, 2019 and June 30, 2020, Guild Mortgage Co. made payments of $1.6 million, $0.5 million and $0.5 million, respectively, to Ms. Kaninau, and $7.5 million, $6.6 million and $6.1 million of principal outstanding remained as of June 30, 2019, December 31, 2019 and June 30, 2020, respectively. Ms. Kaninau also participated in the Deferred Compensation Plan. Upon her retirement, Guild Mortgage Co. distributed $2.0 million, the value of Ms. Kaninau’s deferred compensation, to her.
Sale of Units by Guild Investors, LLC to Guild Management III, LLC
On April 1, 2017, Guild Investors, LLC, our former parent company, sold units to Guild Management III, LLC for $2.3 million in consideration, of which $1.2 million was advanced by Guild Mortgage Co. in exchange for notes receivable from our parent company’s members, including Barry Horn, Guild Mortgage Co.’s Executive Vice President, National Production. These members fully paid back the notes and $0.1 million in accrued interest before December 31, 2019. At December 31, 2018 and December 31, 2017, these members owed $0.2 million and $1.1 million, respectively, on these notes which is included within other assets on Guild Mortgage Co.’s consolidated balance sheets as of those dates. The approximate dollar value of Mr. Horn’s note receivable was $0.4 million and the total amount of accrued interest paid by Mr. Horn was less than $0.02 million.
158
Table of Contents
Indemnification Agreements
We intend to enter into an indemnification agreement with each of our directors and officers. These agreements will require us to indemnify these individuals to the fullest extent permitted under the DGCL against liabilities that may arise by reason of their service to us, and to advance expenses incurred as a result of any proceeding against them as to which they could be indemnified. See “Description of Capital Stock—Limitations on Liability, Indemnification of Officers and Directors and Insurance.”
Reserved Share Program
At our request, the underwriters have reserved up to 425,000 shares of our Class A common stock, or up to 5% of the shares of Class A common stock offered by this prospectus for sale by the selling stockholders, at the initial public offering price, to directors, director nominees, officers, employees, business associates and related persons of Guild. The sales will be made at our direction by Merrill Lynch, Pierce, Fenner & Smith Incorporated and its affiliates through a reserved share program. The number of shares of Class A common stock available for sale to the general public will be reduced to the extent these individuals purchase such reserved shares. Any reserved shares that are not so purchased will be offered by the underwriters to the general public on the same basis as the other shares offered by this prospectus.
Policies and Procedures for Related Party Transactions
We will have a policy that all material transactions with a related party, as well as all material transactions in which there is an actual, or in some cases, perceived, conflict of interest, will be subject to prior review and approval by our Audit Committee and its independent members, who will determine whether such transactions or proposals are fair and reasonable to Guild and its stockholders. In general, potential related-party transactions will be identified by our management and discussed with our Audit Committee at its meetings.
Proposals, including, where applicable, financial and legal analyses, alternatives and management recommendations, will be provided to our Audit Committee with respect to each issue under consideration, and decisions will generally be made by our Audit Committee with respect to the foregoing related-party transactions after opportunity for discussion and review of materials. When applicable, our Audit Committee will request further information and, from time to time, will request guidance or confirmation from internal or external counsel or auditors.
All related party transactions described in this section occurred prior to adoption of this policy, and as such, these transactions were not subject to the approval and review procedures set forth in the policy.
159
Table of Contents
DESCRIPTION OF CERTAIN INDEBTEDNESS
The following description summarizes the material terms of certain indebtedness of Guild and our subsidiaries, as expected to be in effect upon the consummation of this offering. The summary is qualified in its entirety by reference to the full text of the agreements governing the terms of such indebtedness, which are filed as exhibits to the registration statement of which this prospectus is a part.
Amended and Restated Term Loan Agreement
Guild Mortgage Co. is party to that certain Amended and Restated Term Loan Agreement by and among Guild Mortgage Co. and Guild Investors, LLC, as borrowers, The Bank of New York Mellon, as administrative agent, and the other lenders and parties party thereto (the “Term Loan Agreement”). The Term Loan Agreement provides for a term loan facility in the aggregate principal amount of $100.0 million (which amount can be increased up to $150.0 million in certain specified circumstances), is secured by Guild Mortgage Co.’s Fannie Mae MSRs, and has a scheduled maturity date of September 30, 2022. Guild Mortgage Co. and Guild Investors, LLC may, from time to time, upon prior written notice to the Bank of New York Mellon, prepay in whole or in part the term loan (subject to certain conditions). Beginning on October 1, 2020, Guild Mortgage Co. and Guild Investors, LLC are required to make periodic amortization payments on the first business day of each January, April, July and October in respect of the principal balance of the term loan in an amount equal to five percent of the aggregate principal amount of the term loan outstanding as of September 18, 2020.
The Term Loan Agreement contains customary representations and warranties, as well as affirmative and negative covenants, including financial covenants requiring Guild Mortgage Co. and Guild Investors, LLC to maintain (i) a leverage ratio, defined as the ratio of the total liabilities of Guild Mortgage Co., Guild Investors, LLC and their subsidiaries to the total net worth of Guild Mortgage Co., Guild Investors, LLC and their subsidiaries, of less than or equal to 12.5 to 1.0, (ii) an aggregate tangible net worth of at least $175.0 million (subject to certain exceptions), (iii) an aggregate liquidity of not less than the greater of (A) $45.0 million and (B) an amount equal to three percent of the average daily amount of the total marginable assets of Guild Mortgage Co. and Guild Investors, LLC over the immediately preceding three-month period (subject to certain conditions) and (iv) a minimum net income, on a combined basis, for each quarterly period ending on each March 31, June 30, September 30 and December 31, of at least $1.00 (subject to certain exceptions).
Fifth Amended and Restated Loan and Security Agreement
Guild Mortgage Co. is party to that certain Fifth Amended and Restated Loan and Security Agreement by and among Guild Mortgage Co., as borrower, Texas Capital Bank, National Association (“TCB”), as administrative agent, and the other lenders and parties party thereto (the “Fifth Amended and Restated Loan Agreement”). The Fifth Amended and Restated Loan Agreement provides for a revolving facility in the aggregate amount of up to $135.0 million (which amount can be increased up to $200.0 million in certain specified circumstances), is secured by Guild Mortgage Co.’s Ginnie Mae MSRs, and has a maturity date of June 6, 2022. Guild Mortgage Co. may, upon prior written notice to TCB, terminate or permanently reduce the revolving credit commitments. In addition, Guild Mortgage Co. has the right, at any time and from time to time, to prepay the principal amount of any revolving loans in full or in part.
The Fifth Amended and Restated Loan Agreement contains customary representations and warranties, as well as affirmative and negative covenants, including financial covenants requiring Guild Mortgage Co. to (i) maintain a tangible net worth of not less than the amount required to satisfy, among other things, the minimum net worth requirement(s) for all types of programs in which Guild Mortgage Co. is approved to participate by Ginnie Mae and/or for Guild Mortgage Co. to maintain Ginnie Mae issuer status in Ginnie Mae programs, (ii) maintain liquid assets of not less than the minimum liquid assets requirements for all program types in which Guild Mortgage Co. is approved to participate by Ginnie Mae and/or for Guild Mortgage Co. to maintain Ginnie Mae issuer status in Ginnie Mae programs and (iii) not permit, as of any date, the servicing portfolio delinquency rate to be greater than (A) until April 1, 2021, ten percent (or, with the exemption of certain loans from the calculation of such rate, six percent) and (B) on and after April 1, 2021, six percent.
160
Table of Contents
Amended and Restated Loan and Security Agreement
Guild Mortgage Co. is party to that certain Amended and Restated Loan and Security Agreement by and among Guild Mortgage Co., as borrower, and TIAA, FSB, as lender (the “Amended and Restated Loan Agreement”). The Amended and Restated Loan Agreement provides for a revolving facility in the aggregate amount of up to $65.0 million, is secured by Guild Mortgage Co.’s Freddie Mac MSRs, and provides for a scheduled maturity date of July 14, 2021. The Amended and Restated Loan Agreement contains customary representations and warranties, as well as affirmative and negative covenants, including financial covenants requiring Guild Mortgage Co. to (i) ensure that Guild Investors, LLC maintains a tangible net worth of not less than $200.0 million, (ii) ensure that Guild Investors, LLC maintains a ratio of indebtedness to tangible net worth of no greater than 15.0 to 1.0, (iii) ensure that Guild Investors, LLC has cash and cash equivalents (subject to certain exceptions) in an amount of at least $40.0 million (of which at least $15.0 million must be cash) and (iv) not permit Guild Investors, LLC’s net income to be (A) less than $1.00 (subject to certain exceptions) for any two consecutive fiscal quarters or (B) a loss of more than $10.0 million (subject to certain exceptions) for any fiscal quarter.
Warehouse Lines of Credit
Guild Mortgage Co. has seven warehouse lines of credit pursuant to master repurchase agreements providing an aggregate borrowing capacity as of the date of this prospectus of approximately $2.9 billion. The warehouse lines mature between October 2020 and February 2024. At December 31, 2019, the weighted average interest rate for the outstanding warehouse lines of credit was 4.04%. All warehouse lines of credit are collateralized by underlying mortgages and related documents. The lenders for Guild Mortgage Co.’s warehouse lines of credit include The Bank of New York Mellon, Bank of America, N.A., JPMorgan Chase Bank, N.A., Texas Capital Bank, National Association, TIAA, FSB, U.S. Bank National Association and Western Alliance Bank. Existing balances on the warehouse lines are repaid through the sale proceeds from the collateralized loans held by Guild Mortgage Co. The agreements governing the warehouse lines include certain customary representations and warranties, as well as affirmative and negative covenants, including with respect to maintenance of a maximum adjusted leverage ratio, minimum net worth, minimum tangible net worth, minimum current ratio, minimum liquidity and positive quarterly income and limitations on additional indebtedness, dividends, the sale of assets, and any declines in the fair value of Guild Mortgage Co.’s mortgage loan servicing portfolio.
161
Table of Contents
The following description summarizes certain important terms of our capital stock, as they are expected to be in effect upon the consummation of this offering. We expect to adopt an amended and restated certificate of incorporation and amended and restated bylaws in connection with this offering, and this description summarizes the provisions that are expected to be included in such documents. This description is not complete and is qualified by reference to the full text of our certificate of incorporation and bylaws, the forms of which are filed as exhibits to the registration statement of which this prospectus is a part. You should read our certificate of incorporation and bylaws, as well as the applicable provisions of the DGCL.
General
Following the reorganization transactions and the closing of this offering, our authorized capital stock will consist of 250,000,000 shares of Class A common stock, par value $0.01 per share, 100,000,000 shares of Class B common stock, par value $0.01 per share, and 50,000,000 shares of preferred stock, par value $0.01 per share.
After the consummation of the reorganization transactions and this offering, we expect to have 21,174,758 shares of our Class A common stock issued and outstanding (or 22,135,966 shares if the underwriters exercise in full their option to purchase an additional 1,275,000 shares of Class A common stock from the selling stockholders), 38,825,242 shares of our Class B common stock issued and outstanding (or 37,864,034 shares if the underwriters exercise in full their option to purchase additional shares of Class A common stock from the selling stockholders) and no shares of our preferred stock issued and outstanding.
Common Stock
Voting
The holders of shares of our Class A common stock and shares of our Class B common stock will vote together as a single class on all matters submitted to stockholders for their vote or approval, except (i) as required by applicable law or (ii) any amendment (including by merger, consolidation, reorganization or similar event) to our certificate of incorporation that would affect the rights of holders of shares of our Class A common stock in a manner that is disproportionately adverse compared to the rights of holders of shares of our Class B common stock, or vice versa, in which case the holders of shares of our Class A common stock or the holders of shares of our Class B common stock, as applicable, will vote together as a class. Holders of shares of our Class A common stock are entitled to one vote on all matters submitted to stockholders for their vote or approval and holders of shares of our Class B common stock are entitled to 10 votes on all matters submitted to stockholders for their vote or approval.
Upon the completion of this offering, MCMI will own 100% of the issued and outstanding shares of our Class B common stock and will control approximately 94.8% of the combined voting power of our outstanding common stock. Accordingly, MCMI will control our business policies and affairs and can control any action requiring the general approval of our stockholders, including the election of our Board of Directors, the adoption of amendments to our certificate of incorporation and bylaws and the approval of any merger or sale of substantially all of our assets. This concentration of ownership and voting power may also delay, defer or prevent a change of control of the Company or impede a merger, takeover or other business combination that may otherwise be attractive to us or our other stockholders.
Dividends
The holders of shares of our Class A common stock and the holders of shares of our Class B common stock are entitled to receive dividends when, as and if declared by our Board of Directors out of legally available funds. Under our certificate of incorporation, dividends may not be declared or paid in respect of shares of our Class B common stock unless they are declared or paid in the same amount and same type of cash or property (or combination thereof) in respect of shares of our Class A common stock, and vice versa.
162
Table of Contents
With respect to stock dividends, holders of shares of our Class B common stock must receive shares of our Class B common stock while holders of shares of our Class A common stock must receive shares of our Class A common stock.
Liquidation or Dissolution
Upon our liquidation or dissolution, the holders of shares of our Class A common stock and the holders of shares of our Class B common stock will be entitled to share ratably in those of our assets that are legally available for distribution to stockholders after payment of liabilities and subject to the prior rights of any holders of preferred stock then outstanding.
Conversion, Transferability and Exchange
Our certificate of incorporation will provide that each share of our Class B common stock is convertible at any time, at the option of the holder, into one share of our Class A common stock. Our certificate of incorporation will further provide that each share of our Class B common stock will automatically convert into one share of our Class A common stock immediately prior to any transfer of such share except for certain transfers described in our certificate of incorporation, including transfers to and among the McCarthy Investors. In addition, each share of our Class B common stock will automatically convert into one share of our Class A common stock if the McCarthy Investors own shares of our Class B common stock representing less than 10% of the aggregate number of shares of our issued and outstanding common stock. Except as set forth above, shares of our Class B common stock will not be automatically converted into shares of our Class A common stock at a certain specified time or otherwise.
Among other exceptions described in our certificate of incorporation, the McCarthy Investors will be permitted to pledge shares of our Class B common stock that they hold from time to time without causing an automatic conversion to shares of our Class A common stock, as applicable, provided that any pledged shares are not transferred to or registered in the name of the pledgee.
Shares of our Class A common stock are not subject to any conversion right.
Other Provisions
Holders of our common stock will have no preemptive or subscription rights, and there are no redemption or sinking fund provisions applicable to the common stock. After this offering, all outstanding shares of our common stock will be fully paid and non-assessable. The rights, preferences and privileges of the holders of our common stock are subject to, and may be adversely affected by, the rights of the holders of shares of any series of preferred stock that we may designate and issue in the future.
Preferred Stock
Under the terms of our certificate of incorporation, our Board of Directors will be authorized, subject to limitations prescribed by the DGCL and by our certificate of incorporation, to issue up to 50,000,000 shares of preferred stock in one or more series without further action by the holders of our common stock. Our Board of Directors will have the discretion, subject to limitations prescribed by the DGCL and by our certificate of incorporation, to determine the rights, preferences, privileges and restrictions, including voting rights, dividend rights, conversion rights, redemption privileges and liquidation preferences, of each series of our preferred stock.
Anti-Takeover Effects of Various Provisions of Delaware Law, Our Certificate of Incorporation and Our Bylaws
Provisions of the DGCL and our certificate of incorporation and bylaws could make it more difficult to acquire or obtain control of Guild by means of a tender offer, a proxy contest or otherwise, or to remove incumbent officers and directors. These provisions, which are summarized below, may discourage certain
163
Table of Contents
types of coercive takeover practices and takeover bids that our Board of Directors may consider inadequate and to encourage persons seeking to acquire control of the Company to first negotiate with our Board of Directors. Guild believes that the benefits of increased protection of its ability to negotiate with the proponent of an unfriendly or unsolicited proposal to acquire or restructure it outweigh the disadvantages of discouraging takeover or acquisition proposals because, among other things, negotiation of these proposals could result in an improvement of their terms.
Delaware Anti-Takeover Statute
As a Delaware corporation, Guild will be subject to Section 203 of the DGCL regarding corporate takeovers. In general, Section 203 of the DGCL prohibits a publicly held Delaware corporation from engaging in a “business combination” with an “interested stockholder” for a period of three years following the time the person became an interested stockholder, unless:
| • | prior to the date of the transaction, the board of directors of such corporation approved either the business combination or the transaction that resulted in the stockholder becoming an interested stockholder; |
| • | upon completion of the transaction that resulted in the stockholder becoming an interested stockholder, the interested stockholder owned at least 85% of the voting stock of the corporation outstanding at the time such transaction commenced, excluding, for purposes of determining the number of shares outstanding, (i) shares owned by persons who are directors and also officers of the corporation and (ii) shares owned by employee stock plans in which employee participants do not have the right to determine confidentially whether shares held subject to the plan will be tendered in a tender or exchange offer; or |
| • | on or subsequent to such time the business combination is approved by the board of directors of such corporation and authorized at a meeting of stockholders by the affirmative vote of at least two-thirds of the outstanding voting stock of such corporation not owned by the interested stockholder. |
In this context, a “business combination” includes a merger, asset or stock sale, or other transaction resulting in a financial benefit to the interested stockholder. An “interested stockholder” is a person who, together with affiliates and associates, owns or, within three years prior to the determination of interested stockholder status owned, 15% or more of a corporation’s outstanding voting stock. The existence of this provision would be expected to have an anti-takeover effect with respect to transactions not approved in advance by our Board of Directors, including discouraging attempts that might result in a premium over the market price for the shares of our Class A common stock held by our stockholders.
A Delaware corporation may “opt out” of Section 203 with an express provision in its original certificate of incorporation or an express provision in its certificate of incorporation or bylaws resulting from amendments approved by holders of at least a majority of the corporation’s outstanding voting shares. We will not elect to “opt out” of Section 203. However, following this offering and subject to certain restrictions, we could subsequently elect to “opt out” of Section 203 by such an amendment to our certificate of incorporation or bylaws.
Classified Board
Our certificate of incorporation and bylaws will provide that our Board of Directors will be divided into three classes, each of which is expected to be composed initially of two or three directors. The directors designated as Class I directors will have terms expiring at the first annual meeting of stockholders following the completion of this offering, which we expect to hold in 2021. The directors designated as Class II directors will have terms expiring at the following year’s annual meeting of stockholders, which we expect to hold in 2022, and the directors designated as Class III directors will have terms expiring at the following year’s annual meeting of stockholders, which we expect to hold in 2023. Commencing with the
164
Table of Contents
first annual meeting of stockholders following the completion of this offering, directors for each class will be elected at the annual meeting of stockholders held in the year in which the term for that class expires and thereafter will serve for a term of three years. At any meeting of stockholders for the election of directors at which a quorum is present, the election will be determined by a plurality of the votes cast by the stockholders entitled to vote in the election. Under the classified board provisions, it may take two elections of directors for any individual or group to gain control of our Board of Directors. Accordingly, these provisions could discourage a third party from initiating a proxy contest, making a tender offer or otherwise attempting to gain control of Guild.
Removal of Directors
Our certificate of incorporation will provide that until the McCarthy Investors beneficially own less than a majority of the combined voting power of our outstanding common stock, any director may be removed with or without cause by the affirmative vote of holders of at least a majority of the voting power of the then-outstanding shares of voting stock. After the McCarthy Investors cease to beneficially own a majority of the combined voting power of our outstanding common stock, our certificate of incorporation will provide that our stockholders may remove our directors only for cause by an affirmative vote of holders of at least a majority of the voting power of the then-outstanding shares of voting stock.
Amendments to Certificate of Incorporation and Bylaws
Our certificate of incorporation will provide that it may be amended or altered in any manner provided by the DGCL. Our bylaws may be adopted, amended, altered or repealed by stockholders upon the approval of at least a majority of the voting power of all of the then-outstanding shares of stock entitled to vote at an election of directors. Additionally, our certificate of incorporation and bylaws will provide that our bylaws may be adopted, amended, altered or repealed by the Board of Directors.
Size of Board and Vacancies
Our certificate of incorporation and our bylaws will provide that the number of directors on our Board of Directors will be fixed exclusively by our Board of Directors and any vacancies on our Board of Directors resulting from any increase in the authorized number of directors or the death, resignation, retirement, disqualification, removal from office or other cause will be filled by a majority of the Board of Directors then in office, whether or not less than a quorum. Our certificate of incorporation and our bylaws will provide that any director appointed to fill a vacancy on our Board of Directors will hold office for a term expiring at the annual meeting of stockholders at which the term of office of the class to which he or she been appointed expires and until such director’s successor shall have been duly elected and qualified.
Special Stockholder Meetings
Our bylaws will provide that only the Chairman of the Board of Directors, the Chief Executive Officer or an officer at the request of a majority of the members of the Board of Directors pursuant to a resolution approved by the Board of the Directors may call special meetings of Guild stockholders, and stockholders may not call special stockholder meetings.
Stockholder Action by Written Consent
Our certificate of incorporation will provide that until the McCarthy Investors beneficially own less than a majority of the combined voting power of our outstanding common stock, stockholder action can be taken by written consent in lieu of a meeting. After the McCarthy Investors cease to beneficially own a majority of the combined voting power of our outstanding common stock, our certificate of incorporation will expressly prohibit the right of our stockholders to act by written consent. From and after that point in time, stockholder action must take place at the annual or a special meeting of Guild stockholders.
165
Table of Contents
Requirements for Advance Notification of Stockholder Nominations and Proposals
Our bylaws will establish advance notice procedures with respect to stockholder proposals and nomination of candidates for election as directors, as well as minimum qualification requirements for stockholders making the proposals or nominations. Additionally, our bylaws will require that candidates nominated by stockholders for election as a director disclose their qualifications and make certain representations, including that (i) they are not a party to any undisclosed voting commitment, any voting commitment that could interfere with their ability to fulfill their fiduciary duties as a director of Guild, should they be elected, or any undisclosed agreement pursuant to which they would receive compensation, reimbursement or indemnification in connection with their service as a director of Guild, (ii) they will be in compliance, should they be elected, with Guild’s corporate governance guidelines and Guild’s conflict of interest, confidentiality and stock ownership and trading policies and (iii) they will abide by the procedures for the election of directors in our bylaws.
No Cumulative Voting
The DGCL provides that stockholders will not have the right to cumulate votes in the election of directors unless the company’s certificate of incorporation provides otherwise. Our certificate of incorporation will not provide for cumulative voting.
Undesignated Preferred Stock
The authority that our Board of Directors will possess to issue preferred stock could potentially be used to discourage attempts by third parties to obtain control of Guild through a merger, tender offer, proxy contest or otherwise by making such attempts more difficult or more costly. Our Board of Directors may issue preferred stock with voting rights or conversion rights that, if exercised, could adversely affect the voting power of the holders of common stock.
Corporate Opportunities
Our certificate of incorporation provides that, to the fullest extent permitted by law, we have, on behalf of ourselves, our stockholders and any of our and their respective affiliates, renounced any interest or expectancy in, or in being notified of or offered an opportunity to participate in, any business opportunity that may be presented to our directors that are not our employees or to any of their affiliates, partners or other representatives, and that no such person has any duty to communicate or offer such business opportunity to us or any of our affiliates or stockholders or shall be liable to us or any of our affiliates or stockholders for breach of any duty, as a director or otherwise, by reason of the fact that such person pursues or acquires such business opportunity, directs such business opportunity to another person or fails to present such business opportunity, or information regarding such business opportunity, to us or any of our affiliates or stockholders, unless, in the case of any such person who is a director of our Company, such business opportunity is expressly offered to such director solely in his or her capacity as a director of our Company.
Limitations on Liability, Indemnification of Officers and Directors and Insurance
Elimination of Liability of Directors
The DGCL authorizes corporations to limit or eliminate the personal liability of directors to corporations and their stockholders for monetary damages for breaches of directors’ fiduciary duties as directors, and our certificate of incorporation will include such an exculpation provision. Our certificate of incorporation will provide that, to the fullest extent permitted by the DGCL, no director will be personally liable to us or to our stockholders for monetary damages for breach of fiduciary duty as a director. While our certificate of incorporation will provide directors with protection from awards for monetary damages for breaches of their duty of care, it will not eliminate this duty. Accordingly, our certificate of incorporation will have no effect on the availability of equitable remedies such as an injunction or rescission based on a
166
Table of Contents
director’s breach of his or her duty of care. The provisions of our certificate of incorporation described above apply to an officer of Guild only if he or she is a director of Guild and is acting in his or her capacity as director, and do not apply to officers of Guild who are not directors.
Indemnification of Directors, Officers and Employees
Our bylaws will require us to indemnify any person who was or is a party or is threatened to be made a party to or is otherwise involved in any threatened, pending or completed action, suit or proceeding by reason of the fact that he or she is or was a director or officer of Guild, or is or was serving at the request of Guild as a director, officer, trustee, employee or agent of another corporation or of a partnership, joint venture, trust or other enterprise, including service with respect to employee benefit plans maintained or sponsored by Guild, against all expense, liability and loss (including attorneys’ fees, judgments, fines, ERISA excise taxes or penalties and amounts paid or to be paid in settlement) incurred or suffered by such person in connection with such proceeding if the person acted in good faith and in a manner reasonably believed to be in or not opposed to the best interests of Guild and, with respect to any criminal action or proceeding, had no reasonable cause to believe his or her conduct was unlawful.
We will be authorized under our bylaws to purchase and maintain insurance to protect Guild and any current or former director, officer, employee or agent of Guild or another corporation, partnership, joint venture, trust or other enterprise against any expense, liability or loss, whether or not Guild would have the power to indemnify such person against such expense, liability or loss under the DGCL.
We intend to enter into an indemnification agreement with each of our directors and officers. The indemnification agreements will provide that we will indemnify each indemnitee to the fullest extent permitted by the DGCL from and against all loss and liability suffered and expenses, judgments, fines and amounts paid in settlement incurred in connection with defending, investigating or settling any threatened, pending or completed action, suit or proceeding related to the indemnitee’s service with the Company. Additionally, we will agree to advance to the indemnitee expenses incurred in connection therewith.
The limitation of liability and indemnification provisions in these indemnification agreements and our certificate of incorporation and bylaws may discourage stockholders from bringing a lawsuit against our directors for breach of fiduciary duty. These provisions also may reduce the likelihood of derivative litigation against our directors and officers, even though such an action, if successful, might otherwise benefit us and our stockholders. In addition, your investment in our Class A common stock may be adversely affected to the extent we pay the costs of settlement and damage awards under these indemnification provisions.
Exclusive Forum
Our certificate of incorporation will provide that, unless the Board of Directors otherwise determines, the state courts located within the State of Delaware or, if no state court located in the State of Delaware has jurisdiction, the federal court for the District of Delaware will be the sole and exclusive forum for any derivative action or proceeding brought on behalf of Guild, any action asserting a claim of breach of a fiduciary duty owed by any director or officer of Guild to Guild or our stockholders, any action asserting a claim against Guild or any director or officer of Guild arising pursuant to any provision of the DGCL or our certificate of incorporation or bylaws, or any action asserting a claim against Guild or any director or officer of Guild governed by the internal affairs doctrine. Under our certificate of incorporation, to the fullest extent permitted by law, this exclusive forum provision will apply to all actions asserting covered Delaware state law claims, including any other claims, such as federal securities law claims, that a stockholder chooses to bring in the same action, although stockholders will not be deemed to have waived our compliance with the federal securities laws and the rules and regulations thereunder. This exclusive forum provision does not apply to actions that do not assert any covered Delaware state law claims, such as, for
167
Table of Contents
example, any action asserting solely federal securities law claims, and the enforceability of similar choice of forum provisions in other companies’ organizational documents has been challenged in legal proceedings and it is possible that, in connection with claims arising under federal securities laws or otherwise, a court could find this exclusive forum provision to be inapplicable or unenforceable.
Authorized but Unissued Shares
Our authorized but unissued shares of common stock and preferred stock will be available for future issuance without your approval. We may use additional shares for a variety of purposes, including future public offerings to raise additional capital, to fund acquisitions and as employee compensation. The existence of authorized but unissued shares of common stock and preferred stock could render more difficult or discourage an attempt to obtain control of Guild by means of a proxy contest, tender offer, merger or otherwise.
Registration Rights
In connection with the reorganization transactions and prior to the consummation of this offering, we intend to enter into the Registration Rights Agreement, pursuant to which each of MCMI and the other stockholders party thereto will be entitled to require the registration of the sale of certain or all shares of our Class A common stock (or, in the case of MCMI, shares of our Class A common stock received upon conversion of shares of our Class B common stock) that they beneficially own. See “Certain Relationships and Related Party Transactions—Registration Rights Agreement” for more information.
Transfer Agent and Registrar
The transfer agent and registrar for our Class A common stock will be Computershare Trust Company, N.A.
Listing
We have applied to list our Class A common stock on the NYSE under the symbol “GHLD.”
168
Table of Contents
SHARES ELIGIBLE FOR FUTURE SALE
Prior to this offering, there was no public market for our Class A common stock. Future sales of substantial amounts of our common stock in the public market, or the perception that such sales may occur, could adversely affect the market price of the Class A common stock. Although we have applied to list our Class A common stock on the NYSE, we cannot assure you that there will be an active public market for the Class A common stock.
After the reorganization transactions and upon the closing of this offering, we will have outstanding an aggregate of 21,174,758 shares of our Class A common stock. Of these 21,174,758 shares, 8,500,000 shares of our Class A common stock sold in this offering will be freely tradable without restriction or further registration under the Securities Act, except for any shares purchased by our “affiliates,” as that term is defined in Rule 144 under the Securities Act and any shares purchased in this offering by participants in our reserved share program who are subject to lock-up restrictions, whose sales would be subject to the restrictions described below. After the reorganization transactions and upon the closing of this offering, we will also have outstanding an aggregate of 38,825,242 shares of our Class B common stock, which are subject to conversion into shares of our Class A common stock as described in the section of this prospectus entitled “Description of Capital Stock.”
The remaining shares of our Class A common stock outstanding upon completion of this offering will be “restricted securities,” as that term is defined in Rule 144 under the Securities Act. These restricted securities are eligible for public sale only if they are registered under the Securities Act or if they qualify for an exemption from registration under Rules 144 or 701 under the Securities Act, which are summarized below.
Lock-Up Agreements
We, the selling stockholders and each of our directors and executive officers have agreed that, without the prior written consent of Wells Fargo Securities, LLC, BofA Securities, Inc. and J.P. Morgan Securities LLC, as the representatives for the several underwriters, we and they will not, subject to limited exceptions, during the 180-day restricted period:
(i) issue (in the case of us), offer, pledge, sell, contract to sell, sell any option or contract to purchase, purchase any option or contract to sell, grant any option, right or warrant to purchase, lend or otherwise transfer or dispose of any shares of the common stock or any securities convertible into or exercisable or exchangeable for common stock (including, without limitation, common stock, preferred stock or such other securities that may be deemed to be beneficially owned in accordance with the rules and regulations of the SEC or that may be issued upon exercise of a stock option or warrant), whether now owned or hereafter acquired;
(ii) enter into any swap or other agreement, arrangement, or transaction that transfers to another, in whole or in part, directly or indirectly, any of the economic consequences of ownership of any common stock or any securities convertible into or exercisable or exchangeable for common stock; or
(iii) in the case of us, file any registration statement under the Securities Act with the SEC with respect to the offering of any common stock or other capital stock or any securities convertible into or exercisable or exchangeable for any common stock or other capital stock (other than any registration statement filed pursuant to Rule 462(b) under the Securities Act to register securities to be sold to the underwriters pursuant to the underwriting agreement), nor publicly disclose the intention to make any filing;
whether any transaction described in clause (i) or (ii) above is to be settled by delivery of common stock, other capital stock or other securities convertible into or exercisable or exchangeable for common stock or other capital stock, in cash or otherwise, or publicly announce any intention to do any of the foregoing. Shares of our Class A common stock purchased by any of our directors or executive officers in this offering would also be subject to the foregoing restrictions on transfer, as well as restrictions on disposition imposed by applicable law.
169
Table of Contents
These agreements are subject to certain exceptions, as described in the section of this prospectus entitled “Underwriting.”
Upon the expiration of the lock-up period described above, substantially all of the shares subject to such lock-up restrictions will become eligible for sale, subject to the limitations discussed above.
Rule 144
Affiliate Resales of Restricted Securities
In general, beginning 90 days after the effective date of the registration statement for this offering, a person who is an affiliate of ours, or who was an affiliate at any time during the 90 days before a sale, who has beneficially owned shares of our Class A common stock for at least six months would be entitled to sell in “broker’s transactions” or certain “riskless principal transactions” or to market makers, a number of shares within any three-month period that does not exceed the greater of:
| • | 1% of the total number of then-outstanding shares of the class of security sold, which will equal, immediately after this offering, approximately 211,748 shares of our Class A common stock; or |
| • | the average weekly trading volume in the class of security sold on the NYSE during the four calendar weeks preceding the filing of a notice on Form 144 with respect to such sale. |
Affiliate resales under Rule 144 are also subject to the availability of current public information about us.
Non-Affiliate Resales of Restricted Securities
In general, beginning 90 days after the effective date of the registration statement for this offering, a person who is not an affiliate of ours at the time of sale, and has not been an affiliate at any time during the three months preceding a sale, and who has beneficially owned shares of our Class A common stock for at least six months but less than a year, is entitled to sell such shares subject only to the availability of current public information about us. If such person has held our shares for at least one year, such person can resell under Rule 144(b)(1) without regard to any Rule 144 restrictions, including the 90-day public company requirement and the current public information requirement.
Non-affiliate resales are not subject to the manner of sale, volume-limitation or notice-filing provisions of Rule 144.
Rule 701
In general, under Rule 701, any of our employees, directors, officers, consultants or advisors who purchased shares from us in connection with a compensatory stock or option plan or other written agreement before the effective date of a registration statement under the Securities Act are entitled to sell such shares 90 days after such effective date in reliance on Rule 144. An affiliate of ours can resell shares in reliance on Rule 144 without having to comply with the holding-period requirement, and a non-affiliate of ours can resell shares in reliance on Rule 144 without having to comply with the current public information and holding-period requirements.
The SEC has indicated that Rule 701 will apply to typical stock options granted before we become subject to the reporting requirements of the Exchange Act, along with the shares acquired upon exercise of such options, including exercises after we become subject to the reporting requirements of the Exchange Act.
Equity Plans
We intend to file one or more registration statements on Form S-8 under the Securities Act to register all shares of our Class A common stock issued or issuable under the 2020 Plan. We expect to file that
170
Table of Contents
registration statement or registration statements after the date of this prospectus, permitting the resale of such shares by non-affiliates in the public market without restriction under the Securities Act and the sale by affiliates in the public market, subject to compliance with the resale provisions of Rule 144, in each case subject to the lock-up agreements described above.
Registration Rights
Upon the closing of this offering, MCMI and the holders of 12,674,758 outstanding shares of our Class A common stock will be entitled to various rights with respect to the registration of their shares of our Class A common stock (or, in the case of MCMI, shares of our Class A common stock received upon conversion of shares of our Class B common stock) under the Securities Act, to the extent such shares constitute registrable securities under the Registration Rights Agreement. Registration of these shares under the Securities Act would result in these shares becoming fully tradable without restriction under the Securities Act immediately upon the effectiveness of the registration statement for this offering, except for shares held by affiliates. See “Certain Relationships and Related Party Transactions—Registration Rights Agreement” for additional information. Shares covered by a registration statement will be eligible for sale in the public market upon the expiration or release from the terms of the lock-up agreements described above.
171
Table of Contents
MATERIAL U.S. FEDERAL INCOME TAX CONSIDERATIONS
FOR NON-U.S. HOLDERS OF CLASS A COMMON STOCK
The following is a general discussion of material U.S. federal income tax considerations with respect to the ownership and disposition of shares of our Class A common stock applicable to non-U.S. holders (as defined below) who acquire such shares in this offering and hold such shares as a capital asset within the meaning of Section 1221 of the Internal Revenue Code of 1986, as amended (the “Code”) (generally, property held for investment). For purposes of this discussion, a “non-U.S. holder” means a beneficial owner of our Class A common stock (other than an entity or arrangement that is treated as a partnership for U.S. federal income tax purposes) that is not, for U.S. federal income tax purposes, any of the following:
| • | an individual citizen or resident of the United States; |
| • | a corporation (or any other entity treated as a corporation for U.S. federal income tax purposes) created or organized in the United States or under the laws of the United States, any state thereof or the District of Columbia; |
| • | an estate, the income of which is includible in gross income for U.S. federal income tax purposes regardless of its source; or |
| • | a trust if (i) a court within the United States is able to exercise primary supervision over the administration of the trust and one or more U.S. persons have the authority to control all substantial decisions of the trust or (ii) such trust has a valid election in effect under applicable U.S. Treasury regulations to be treated as a U.S. person for U.S. federal income tax purposes. |
This discussion is based on current provisions of the Code, the U.S. Treasury regulations promulgated thereunder, judicial opinions, published positions of the IRS and other applicable authorities, each as in effect as of the date hereof. All of these authorities are subject to change and differing interpretations, possibly with retroactive effect, and any such change or differing interpretation could result in U.S. federal income tax consequences different from those discussed below. This discussion does not apply to holders that are not non-U.S. holders as defined above. This discussion does not address all aspects of U.S. federal income taxation that may be relevant to a particular non-U.S. holder in light of such non-U.S. holder’s individual circumstances or that may be applicable to non-U.S. holders subject to special treatment under the U.S. federal income tax laws (such as, for example, insurance companies, tax-exempt organizations, banks or other financial institutions, brokers or dealers in securities, traders that elect mark-to-market treatment, “controlled foreign corporations,” “passive foreign investment companies,” partnerships (or other entities or arrangements treated as partnerships) for U.S. federal income tax purposes or other “flow-through” entities or investors therein, certain former citizens or former long-term residents of the United States, non-U.S. holders that hold our Class A common stock as part of a straddle, hedge, constructive sale or conversion transaction or other integrated transaction, and certain U.S. expatriates). This discussion also does not address any considerations under U.S. federal tax laws other than those pertaining to the income tax, nor does it address any considerations under any state, local or non-U.S. tax laws. In addition, this discussion does not address any aspects of the unearned income Medicare contribution tax or any considerations with respect to any withholding required pursuant to the Foreign Account Tax Compliance Act of 2010 (including the U.S. Treasury regulations promulgated thereunder, any intergovernmental agreements entered in connection therewith and any laws, regulations or practices adopted in connection with any such agreement). Prospective investors should consult with their own tax advisors as to the particular tax consequences to them of the ownership and disposition of shares of our Class A common stock, including with respect to the applicability and effect of any U.S. federal, state, local or non-U.S. income or other tax laws or any tax treaty, and any changes (or proposed changes) in tax laws or interpretations thereof.
If a partnership (or other entity or arrangement treated as a partnership for U.S. federal income tax purposes) holds our Class A common stock, the tax treatment of a person treated as a partner in such partnership will generally depend on the status of the partner and the activities of the partnership. Persons who are, for U.S. federal income tax purposes, treated as partners in a partnership holding our Class A
172
Table of Contents
common stock should consult their tax advisors as to the particular U.S. federal income tax consequences applicable to them.
THIS DISCUSSION IS FOR GENERAL INFORMATION PURPOSES ONLY AND IS NOT INTENDED TO CONSTITUTE A COMPLETE DESCRIPTION OF ALL TAX CONSEQUENCES RELATING TO THE ACQUISITION, OWNERSHIP AND DISPOSITION OF OUR CLASS A COMMON STOCK. PROSPECTIVE HOLDERS OF OUR CLASS A COMMON STOCK SHOULD CONSULT WITH THEIR OWN TAX ADVISORS REGARDING THE PARTICULAR TAX CONSEQUENCES TO THEM OF THE ACQUISITION, OWNERSHIP AND DISPOSITION OF OUR CLASS A COMMON STOCK, INCLUDING WITH RESPECT TO THE APPLICABILITY AND EFFECT OF ANY U.S. FEDERAL, STATE, LOCAL OR NON-U.S. INCOME AND OTHER TAX LAWS.
Dividends
In general, subject to the discussion below regarding “effectively connected” dividends, any distribution we make to a non-U.S. holder with respect to shares of our Class A common stock that constitutes a dividend for U.S. federal income tax purposes will be subject to U.S. withholding tax at a rate of 30% of the gross amount, unless the non-U.S. holder is eligible for an exemption from, or a reduced rate of, such withholding tax under an applicable income tax treaty and the non-U.S. holder provides proper certification of its eligibility for such exemption or reduced rate. A distribution with respect to shares of our Class A common stock will constitute a dividend for U.S. federal income tax purposes to the extent of our current or accumulated earnings and profits as determined for U.S. federal income tax purposes. Any distribution not constituting a dividend will be treated first as reducing the adjusted tax basis in the non-U.S. holder’s shares of our Class A common stock and then, to the extent it exceeds the adjusted tax basis in the non-U.S. holder’s shares of our Class A common stock, as gain from the sale or exchange of such stock. Any such gain will be subject to the treatment described below under “—Gain on Sale or Other Disposition of Class A Common Stock.”
Dividends we pay to a non-U.S. holder with respect to shares of our Class A common stock that are effectively connected with the conduct by such non-U.S. holder of a trade or business within the United States (and, if required by an applicable income tax treaty, are attributable to a permanent establishment or a fixed base of such non-U.S. holder in the United States) generally will not be subject to U.S. withholding tax, as described above, if the non-U.S. holder complies with applicable certification and disclosure requirements. Instead, such dividends generally will be subject to U.S. federal income tax on a net income basis, at regular U.S. federal income tax rates, generally in the same manner as if the non-U.S. holder were a United States person as defined under the Code. Any such “effectively connected” dividends received by a foreign corporation for U.S. federal income tax purposes may be subject to an additional “branch profits tax” at a rate of 30% (or such lower rate as may be specified by an applicable income tax treaty).
Gain on Sale or Other Disposition of Class A Common Stock
Subject to the discussion below under the heading “—Backup Withholding, Information Reporting and Other Reporting Requirements,” in general, a non-U.S. holder will not be subject to U.S. federal income tax on any gain realized upon the sale or other disposition of the non-U.S. holder’s shares of our Class A common stock unless:
| • | the gain is effectively connected with a trade or business conducted by the non-U.S. holder within the United States (or, if required by an applicable income tax treaty, is attributable to a permanent establishment or a fixed base of such non-U.S. holder in the United States); |
| • | the non-U.S. holder is an individual and is present in the United States for 183 days or more in the taxable year of disposition and certain other conditions are met; or |
| • | we are or have been a U.S. real property holding corporation (which we refer to as a “USRPHC”) for U.S. federal income tax purposes at any time during the shorter of the five-year period ending on the date of such disposition or such non-U.S. holder’s holding period of such shares of our Class A common stock. |
173
Table of Contents
Gain described in the first bullet point above generally will be subject to U.S. federal income tax on a net income basis, at regular U.S. federal income tax rates, generally in the same manner as if the non-U.S. holder were a United States person as defined under the Code. If the non-U.S. holder is a foreign corporation for U.S. federal income tax purposes, the branch profits tax described above also may apply to such effectively connected gain.
An individual non-U.S. holder described in the second bullet point above generally will be subject to a flat 30% tax (unless the non-U.S. holder is eligible for a lower rate under an applicable income tax treaty) on the gain from such sale or other disposition, which may be offset by United States source capital losses, if any, of the non-U.S. holder.
We believe we are not, and do not anticipate becoming, a USRPHC for U.S. federal income tax purposes. However, no assurance can be given that we are not or will not become a USRPHC. If we were or were to become a USRPHC, however, any gain recognized on a sale or other disposition of our Class A common stock by a non-U.S. holder that did not own (directly, indirectly or constructively) more than 5% of our Class A common stock during the applicable period would not be subject to U.S. federal income tax, provided that our Class A common stock is “regularly traded on an established securities market” (within the meaning of Section 897(c)(3) of the Code).
Non-U.S. holders should consult their tax advisors regarding potentially applicable income tax treaties that may provide for different rules than those described above.
Backup Withholding, Information Reporting and Other Reporting Requirements
We must report annually to the IRS and to each non-U.S. holder the amount of distributions paid to such non-U.S. holder and the tax withheld with respect to such distributions. These reporting requirements apply regardless of whether withholding was reduced or eliminated by an applicable income tax treaty. Copies of any such information returns may also be made available to the tax authorities in the country in which the non-U.S. holder resides or is established under the provisions of an applicable income tax treaty or agreement.
A non-U.S. holder will generally be subject to backup withholding (currently at a rate of 24%) on dividends paid with respect to such non-U.S. holder’s shares of our Class A common stock unless such holder certifies under penalties of perjury that, among other things, it is a non-U.S. holder (and the payor does not have actual knowledge or reason to know that such holder is a United States person as defined under the Code).
Information reporting and backup withholding generally are not required with respect to any proceeds from the sale or other disposition of our Class A common stock by a non-U.S. holder outside of the United States through a foreign office of a foreign broker that does not have certain specified connections to the United States. However, if a non-U.S. holder sells or otherwise disposes of its shares of our Class A common stock through a U.S. broker or the U.S. offices of a foreign broker, the broker will generally be required to report the amount of proceeds paid to the non-U.S. holder to the IRS, and may also be required to backup withhold on such proceeds unless such non-U.S. holder certifies under penalties of perjury that, among other things, it is a non-U.S. holder (and the payor does not have actual knowledge or reason to know that such holder is a United States person as defined under the Code). Information reporting will also apply if a non-U.S. holder sells its shares of our Class A common stock through a foreign broker with certain specified connections to the United States, unless such broker has documentary evidence in its records that such non-U.S. holder is a non-United States person and certain other conditions are met, or such non-U.S. holder otherwise establishes an exemption (and the payor does not have actual knowledge or reason to know that such holder is a United States person as defined under the Code).
Backup withholding is not an additional tax. Any amounts withheld under the backup withholding rules from a payment to a non-U.S. holder can be credited against the non-U.S. holder’s U.S. federal income tax liability, if any, or refunded, provided that the required information is furnished to the IRS in a timely manner. Non-U.S. holders should consult their tax advisors regarding the application of the information reporting and backup withholding rules to them.
174
Table of Contents
The selling stockholders are offering the shares of our Class A common stock described in this prospectus through a number of underwriters. We and the selling stockholders intend to enter into an underwriting agreement with the underwriters with respect to the shares of our Class A common stock offered hereby, for which Wells Fargo Securities, LLC , BofA Securities, Inc. and J.P. Morgan Securities LLC are acting as the representatives. Subject to the terms and conditions of the underwriting agreement, the selling stockholders have agreed to sell to the underwriters, and each underwriter has severally and not jointly agreed to purchase, at the public offering price less the underwriting discounts and commissions set forth on the front cover of this prospectus, the number of shares of our Class A common stock listed next to its name in the following table:
| Underwriter |
Number of Shares |
|||
| Wells Fargo Securities, LLC |
||||
| BofA Securities, Inc. |
||||
| J.P. Morgan Securities LLC |
||||
| JMP Securities LLC |
||||
| Compass Point Research & Trading, LLC |
||||
| C.L. King & Associates, Inc. |
||||
|
|
|
|||
| Total |
8,500,000 | |||
|
|
|
|||
The underwriting agreement provides that the obligations of the underwriters to purchase the shares of our Class A common stock included in this offering are subject to approval of legal matters by counsel and to other conditions. The underwriters are committed to purchase all of the shares of our Class A common stock offered by the selling stockholders if they purchase any shares (other than those covered by the option to purchase additional shares described below). The underwriting agreement also provides that, if an underwriter defaults, the purchase commitments of non-defaulting underwriters may be increased or the offering may be terminated.
The underwriters propose to offer the shares of our Class A common stock directly to the public at the public offering price set forth on the front cover of this prospectus and to certain dealers at that price less a concession not in excess of $ per share. After the public offering of the shares, the offering price and other selling terms may be changed by the underwriters. Sales of shares made outside of the United States may be made by affiliates of the underwriters.
The selling stockholders have granted a 30-day over-allotment option to the underwriters to purchase up to a total of 1,275,000 additional shares of our Class A common stock at the public offering price per share less the underwriting discounts and commissions per share, as set forth on the front cover of this prospectus. If the underwriters exercise this over-allotment option in whole or in part, then the underwriters will be severally committed, subject to the conditions described in the underwriting agreement, to purchase the additional shares of our Class A common stock in proportion to their respective commitments set forth in the prior table.
175
Table of Contents
The underwriting fee is equal to the public offering price per share of our Class A common stock less the amount paid by the underwriters to the selling stockholders per share of our Class A common stock. The underwriting fee is $ per share. The following table shows the per share and total underwriting discounts and commissions to be paid to the underwriters assuming both no exercise and full exercise of the underwriters’ over-allotment option to purchase additional shares.
| Total | ||||||||||||
| Per Share | No Exercise | Full Exercise | ||||||||||
| Public offering price |
$ | $ | $ | |||||||||
| Underwriting discounts and commissions to be paid by the selling stockholders |
$ | $ | $ | |||||||||
| Proceeds, before expenses, to the selling stockholders |
$ | $ | $ | |||||||||
We estimate that the total expenses of this offering payable by us, including registration, filing and listing fees, printing fees and legal and accounting expenses will be approximately $6,116,121. We have agreed to reimburse the underwriters for up to $40,000 of expenses related to the review of this offering by the Financial Industry Regulatory Authority, Inc.
A prospectus in electronic format may be made available on the websites maintained by one or more underwriters participating in the offering. The underwriters may agree to allocate a number of shares to underwriters for sale to their online brokerage account holders. Internet distributions will be allocated by the representatives to underwriters that may make internet distributions on the same basis as other allocations.
We, the selling stockholders and each of our directors and executive officers have agreed, subject to certain exceptions, that, without the prior written consent of Wells Fargo Securities, LLC, BofA Securities, Inc. and J.P. Morgan Securities LLC, we and they will not, during the period beginning on and including the date of this prospectus through and including the date that is the 180th day after the date of the underwriting agreement, directly or indirectly:
| (i) | issue (in the case of us), offer, pledge, sell, contract to sell, sell any option or contract to purchase, purchase any option or contract to sell, grant any option, right or warrant to purchase, lend or otherwise transfer or dispose of any shares of the common stock or any securities convertible into or exercisable or exchangeable for common stock (including, without limitation, common stock, preferred stock or such other securities that may be deemed to be beneficially owned in accordance with the rules and regulations of the SEC or that may be issued upon exercise of a stock option or warrant), whether now owned or hereafter acquired; |
| (ii) | enter into any swap or other agreement, arrangement, hedge or transaction that transfers to another, in whole or in part, directly or indirectly, any of the economic consequences of ownership of any common stock or any securities convertible into or exercisable or exchangeable for common stock; or |
| (iii) | in the case of us, file any registration statement under the Securities Act with the SEC with respect to the offering of any common stock or other capital stock or any securities convertible into or exercisable or exchangeable for any common stock or other capital stock (other than any registration statement filed pursuant to Rule 462(b) under the Securities Act to register securities to be sold to the underwriters pursuant to the underwriting agreement), nor publicly disclose the intention to make any filing; |
whether any transaction described in clause (i) or (ii) above is to be settled by delivery of common stock, other capital stock or other securities convertible into or exercisable or exchangeable for common stock or other capital stock, in cash or otherwise, or publicly announce any intention to do any of the foregoing. Shares of our Class A common stock purchased by any of our directors or executive officers in this offering
176
Table of Contents
would also be subject to the foregoing restrictions on transfer, as well as restrictions on disposition imposed by applicable law.
The restrictions described in the paragraph on the preceding page relating to the Company do not apply, subject in certain cases to various conditions (including the transfer of the lock-up restrictions), to:
| • | the issuance by the Company of shares of common stock or other capital stock pursuant to the conversion or exchange of convertible or exchangeable securities or the exercise of warrants or options (including net exercise) or the settlement of restricted stock units (including net settlement); |
| • | the issuance by the Company of stock options, stock awards, restricted stock units, performance stock units or other equity or equity-based awards or shares of common stock or other capital stock (whether upon the exercise of stock options, settlement of awards or otherwise) to employees, officers, directors, advisors or consultants of the Company pursuant to the terms of an equity incentive plan described herein existing on the date of the underwriting agreement; |
| • | the establishment or amendment of a trading plan pursuant to Rule 10b5-1 under the Exchange Act for the transfer of shares of common stock, subject to various conditions; |
| • | the filing by the Company of any registration statement on Form S-8 with the SEC relating to the offering of securities granted or to be granted pursuant to the terms of an equity incentive plan described herein; or |
| • | the offer, the issuance or the agreement to issue by the Company of common stock, other capital stock or securities convertible into common stock or other capital stock in connection with an acquisition merger, joint venture, strategic alliance, commercial or other collaborative relationship or the acquisition or license by the Company or any of its subsidiaries of the securities, business, property or other assets of another person or entity, or pursuant to any equity incentive or employee benefit plan as assumed by the Company in connection with any such acquisition or transaction, and file any registration statement in connection with the foregoing, provided that the aggregate number of shares of common stock or other capital stock or securities convertible into common stock or other capital stock (on an as converted, as exercised or as exchanged basis) issued shall not exceed 10% of the total number of shares of common stock issued and outstanding on the closing date of this offering. |
The restrictions described in the paragraph on the preceding page relating to the officers, directors, and our stockholders do not apply, subject in certain cases to various conditions (including the transfer of the lock-up restrictions), to:
| • | transfers as a bona fide gift or gifts (including, but not limited to, to a charity or educational institution); |
| • | transfers by will or by intestate succession; |
| • | transfers pursuant to a so-called “living trust” or other revocable trust established to provide for the disposition of property on the lock-up party’s death, in each case, to any member of the lock-up party’s immediate family; |
| • | transfers to a trust the beneficiaries of which are exclusively the lock-up party and/or members of the lock-up party’s immediate family; |
| • | transfers for bona fide estate planning purposes; |
| • | transfers, if the lock-up party is a partnership, limited liability company, corporation or other entity, to a partner, member, stockholder or other holder of equity interests, as the case may be, of such partnership, limited liability company, corporation or other entity; |
| • | transfers, if the lock-up party is a partnership, limited liability company, corporation or other business entity lock-up party, to another partnership, limited liability company, corporation or other |
177
Table of Contents
| business entity that, directly or indirectly, controls, is controlled by or is under common control with the lock-up party, or if a trust, to a trustee or beneficiary of the trust; |
| • | transfers to the underwriters pursuant to the terms of the underwriting agreement; |
| • | transfers to any investment fund or other entity controlled or managed by the lock-up party; |
| • | transfers to the Company, pursuant to (A) the exercise on a net-issuance basis by the undersigned of any stock option granted pursuant to the Company’s employee benefit plans disclosed herein or (B) share withholding to cover applicable taxes in connection with the vesting or settlement of an award granted pursuant to the Company’s employee benefit plans disclosed in herein; |
| • | transfers to the Company, in connection with any reclassification or conversion of the common stock, provided, that any such shares of common stock received upon such conversion or reclassification shall be subject to the terms of the lock-up agreement; |
| • | transfers of shares of common stock pursuant to a bona fide third-party tender offer, merger, consolidation or other similar transaction made to all holders of our common stock, involving a change of control of us, provided that in the event that such tender offer, merger, consolidation or other such transaction is not completed, the lock-up party’s shares of common stock shall remain subject to the provisions of the lock-up agreement; |
| • | transfers pursuant to an order of a regulatory agency or a court, including a qualified domestic order, or in connection with a divorce settlement; |
| • | transfers to a nominee or custodian of a person or entity to whom a transfer would be permitted under the lock-up agreement; |
| • | transfers related to any transaction in connection with a reclassification of capital stock of the Company or reorganization of the organizational structure of the Company that is disclosed in herein; or |
| • | the establishment of a trading plan pursuant to Rule 10b5-1 under the Exchange Act for the transfer of shares of common stock; provided that such plan does not provide for the transfer of shares of common stock during the lock-up period. |
We, the selling stockholders and the underwriters have agreed to indemnify each other against certain liabilities, including liabilities under the Securities Act.
Determination of Offering Price
Prior to this offering, there has been no public market for shares of our Class A common stock. The initial public offering price per share of our Class A common stock will be determined by negotiations among us, the selling stockholders and the representatives of the underwriters. In determining the initial public offering price, we, the selling stockholders and the representatives of the underwriters expect to consider a number of factors including:
| • | the information presented in this prospectus and otherwise available to the underwriters; |
| • | the history of and prospects for the industry in which we will compete; |
| • | prevailing market conditions; |
| • | our historical performance; |
| • | estimates of our business potential and earnings prospects; |
| • | the ability of our management; |
| • | the recent market prices of, and the demand for, publicly traded common stock of generally comparable companies; and |
| • | other factors deemed relevant by the underwriters, the selling stockholders and us. |
178
Table of Contents
We offer no assurances that the initial public offering price will correspond to the price at which the shares of our Class A common stock will trade in the public market subsequent to the offering or that an active trading market for the shares of our Class A common stock will develop and continue after the offering.
Stabilization, Short Positions
In connection with this offering, the underwriters may purchase and sell shares of our Class A common stock in the open market. These transactions may include short sales, purchases to cover short positions, which may include purchases pursuant to the over-allotment option to purchase additional shares, syndicate covering transactions and stabilizing transactions. Short sales involve syndicate sales of shares in excess of the number of shares to be purchased by the underwriters in this offering, which creates a syndicate short position. “Covered” short sales are sales of shares made in an amount up to the number of shares represented by the underwriters’ over-allotment option. In determining the source of shares to close out the covered syndicate short position, the underwriters may consider, among other things, the price of shares available for purchase in the open market as compared to the price at which they may purchase shares through the over-allotment option. Transactions to close out the covered syndicate short position involve either purchases of the shares in the open market after the distribution has been completed or the exercise of the over-allotment option. The underwriters may also make “naked” short sales of shares in excess of the over-allotment option. The underwriters must close out any naked short position by purchasing shares in the open market. A naked short position is more likely to be created if the underwriters are concerned that there may be downward pressure on the price of the shares in the open market after pricing that could adversely affect investors who purchase in the offering. Stabilizing transactions consist of bids for or purchases of shares in the open market while this offering is in progress.
The underwriters also may impose a penalty bid. Penalty bids permit the underwriters to reclaim a selling concession from a syndicate member when the representatives repurchase shares originally sold by that syndicate member in order to cover syndicate short positions or make stabilizing purchases.
Any of these activities may have the effect of preventing or retarding a decline in the market price of shares of our Class A common stock. They may also cause the price of shares of our Class A common stock to be higher than the price that would otherwise exist in the open market in the absence of these transactions. The underwriters may conduct these transactions on the NYSE or in the over-the-counter market, or otherwise. If the underwriters commence any of these transactions, they may discontinue them at any time.
Reserved Share Program
At our request, the underwriters have reserved for sale up to 425,000 shares, or up to 5% of the shares of our Class A common stock being offered by this prospectus, for the sale at the initial public offering to persons who are directors, officers, employees or who are otherwise associated with Guild through a reserved share program. The number of shares of our Class A common stock available for sale to the general public will be reduced to the extent that such persons purchase such reserved shares. Any reserved shares not so purchased will be offered by the underwriters to the general public on the same basis as the other shares offered by this prospectus. Merrill Lynch, Pierce, Fenner & Smith Incorporated will administer our reserved share program.
Relationships
The underwriters are full-service financial institutions engaged in various activities, which may include securities trading, commercial and investment banking, financial advisory, investment management, principal investment, hedging, financing and brokerage activities. The underwriters and their respective affiliates may, from time to time, engage in transactions with and perform services for us in the ordinary course of their business, for which they may receive customary fees and reimbursement of
179
Table of Contents
expenses. In the ordinary course of their various business activities, the underwriters and their respective affiliates may make or hold a broad array of investments and actively trade debt and equity securities (or related derivative securities) and financial instruments (which may include bank loans and/or credit default swaps) for their own account and for the accounts of their customers and may at any time hold long and short positions in such securities and instruments. Such investments and securities activities may involve securities and/or instruments of ours or our affiliates. The underwriters and their affiliates may also make investment recommendations and/or publish or express independent research views in respect of such securities or financial instruments and may hold, or recommend to clients that they acquire, long and/or short positions in such securities and instruments.
Notice to Prospective Investors in the European Economic Area and United Kingdom
In relation to each member state of the European Economic Area and the United Kingdom, an offer of shares described in this prospectus may not be made to the public in that relevant state other than:
| • | to any legal entity which is a qualified investor within the meaning of Article 2(e) of the Prospectus Regulation (“Qualified Investor”); |
| • | to fewer than 150 natural or legal persons (other than Qualified Investors), as permitted under the Prospectus Regulation, subject to obtaining the prior consent of the relevant Dealer or Dealers nominated by us for any such offer; or |
| • | in any other circumstances unless the offer falls within Article 3(2) of the Prospectus Regulation, provided that no such offer of shares shall require us or any underwriter to publish a prospectus pursuant to Article 3 of the Prospectus Regulation. |
For purposes of this provision, the expression an “offer of securities to the public” in any relevant state means the communication in any form and by any means of sufficient information on the terms of the offer and the securities to be offered so as to enable an investor to decide to purchase or subscribe for those securities and the expression “Prospectus Regulation” means Regulation (EU) 2017/1129 (and amendments thereto) and includes any relevant implementing measure in the relevant state.
The sellers of the shares have not authorized and do not authorize the making of any offer of shares through any financial intermediary on their behalf, other than offers made by the underwriters with a view to the final placement of the shares as contemplated in this prospectus. Accordingly, no purchaser of the shares, other than the underwriters, is authorized to make any further offer of the shares on behalf of the sellers or the underwriters.
Notice to Prospective Investors in the United Kingdom
This prospectus is only being distributed to, and is only directed at, Qualified Investors in the United Kingdom that are (i) investment professionals falling within Article 19(5) of the Financial Services and Markets Act 2000 (Financial Promotion) Order 2005 (the “Order”) or (ii) high net worth entities falling within Article 49(2)(a) to (d) of the Order or (iii) other persons to whom it may lawfully be communicated (each such person referred to in (i), (ii) and (iii) being referred to as a “relevant person”). This prospectus and its contents are confidential and should not be distributed, published or reproduced (in whole or in part) or disclosed by recipients to any other persons in the United Kingdom. Any person in the United Kingdom that is not a relevant person should not act or rely on this document or any of its contents.
Notice to Prospective Investors in Canada
The securities may be sold in Canada only to purchasers purchasing, or deemed to be purchasing, as principal that are accredited investors, as defined in National Instrument 45-106 Prospectus Exemptions or subsection 73.3(1) of the Securities Act (Ontario), and are permitted clients, as defined in National Instrument 31-103 Registration Requirements, Exemptions, and Ongoing Registrant Obligations. Any resale of the securities must be made in accordance with an exemption form, or in a transaction not subject to, the prospectus requirements of applicable securities laws.
180
Table of Contents
Securities legislation in certain provinces or territories of Canada may provide a purchaser with remedies for rescission or damages if this offering memorandum (including any amendment thereto) contains a misrepresentation, provided that the remedies for rescission or damages are exercised by the purchaser within the time limit prescribed by the securities legislation of the purchaser’s province or territory. The purchaser should refer to any applicable provisions of the securities legislation of the purchaser’s province or territory of these rights or consult with a legal advisor.
Pursuant to section 3A.3 of National Instrument 33-105 Underwriting Conflicts (NI 33-105), the underwriters are not required to comply with the disclosure requirements of NI 33-105 regarding underwriter conflicts of interest in connection with this offering.
181
Table of Contents
The validity of the shares of our Class A common stock offered hereby will be passed upon for us by Wachtell, Lipton, Rosen & Katz, New York, New York. Certain legal matters in connection with this offering will be passed upon for the underwriters by Latham & Watkins LLP, Los Angeles, California.
The consolidated financial statements of Guild Mortgage Company as of December 31, 2019 and 2018, and for each of the years in the two-year period ended December 31, 2019, have been included herein in reliance upon the report of KPMG LLP, independent registered public accounting firm, appearing elsewhere herein, and upon the authority of said firm as experts in accounting and auditing.
WHERE YOU CAN FIND MORE INFORMATION
We have filed with the SEC a registration statement on Form S-1 under the Securities Act with respect to the shares of Class A common stock offered hereby. This prospectus, which constitutes a part of the registration statement, does not contain all of the information set forth in the registration statement or the exhibits and schedules filed therewith. For further information about us and the shares of our Class A common stock offered hereby, we refer you to the registration statement and the exhibits and schedules filed thereto. Statements contained in this prospectus regarding the contents of any contract or any other document that is filed as an exhibit to the registration statement are not necessarily complete, and each such statement is qualified in all respects by reference to the full text of such contract or other document filed as an exhibit to the registration statement.
The SEC maintains an internet website, which is located at www.sec.gov, that contains reports, proxy and information statements and other information regarding issuers that file electronically with the SEC. You may access the registration statement for this offering at the SEC’s internet website.
Upon closing of this offering, we will be subject to the informational and periodic reporting requirements of the Exchange Act. We will fulfill our obligations with respect to such requirements by filing periodic reports and other information with the SEC. We intend to furnish our stockholders with annual reports containing financial statements certified by an independent registered public accounting firm. We also maintain a website at www.guildmortgage.com. Information contained on or accessible through our website is not incorporated by reference into this prospectus, and you should not consider such information to be part of this prospectus or in deciding whether to purchase shares of our Class A common stock.
182
Table of Contents
Guild Mortgage Company and its Subsidiaries
| Unaudited Condensed Consolidated Financial Statements |
||||
| F-2 | ||||
| Statements of Income (Loss) for the Six-Month Periods Ended June 30, 2020 and June 30, 2019 |
F-3 | |||
| Statements of Stockholder’s Equity for the Six-Month Periods Ended June 30, 2020 and June 30, 2019 |
F-4 | |||
| Statements of Cash Flows for the Six-Month Periods Ended June 30, 2020 and June 30, 2019 |
F-5 | |||
| F-6 | ||||
F-1
Table of Contents
GUILD MORTGAGE COMPANY
CONDENSED CONSOLIDATED BALANCE SHEETS
(Dollars in thousands, except par value)
| June 30, | December 31, | |||||||
| 2020 | 2019 | |||||||
| (unaudited) | ||||||||
| ASSETS | ||||||||
| Cash and cash equivalents |
$ | 144,936 | $ | 101,735 | ||||
| Restricted cash |
3,526 | 5,000 | ||||||
| Mortgage loans held for sale |
1,982,521 | 1,504,842 | ||||||
| Ginnie Mae loans subject to repurchase right |
948,922 | 404,344 | ||||||
| Accounts and interest receivable |
25,004 | 34,611 | ||||||
| Derivative asset |
141,629 | 19,922 | ||||||
| Mortgage servicing rights, net |
336,687 | 418,402 | ||||||
| Goodwill |
62,834 | 62,834 | ||||||
| Other assets |
56,946 | 55,723 | ||||||
|
|
|
|
|
|||||
| TOTAL ASSETS |
$ | 3,703,005 | $ | 2,607,413 | ||||
|
|
|
|
|
|||||
| LIABILITIES AND STOCKHOLDER’S EQUITY | ||||||||
| Warehouse lines of credit |
$ | 1,689,291 | $ | 1,303,187 | ||||
| Notes payable |
188,000 | 218,000 | ||||||
| Ginnie Mae loans subject to repurchase right |
952,776 | 412,490 | ||||||
| Accounts payable and accrued expenses |
36,007 | 35,338 | ||||||
| Accrued compensation and benefits |
65,347 | 45,297 | ||||||
| Investor reserves |
23,886 | 16,521 | ||||||
| Income tax payable |
41,382 | — | ||||||
| Due to parent company |
427 | 12,427 | ||||||
| Contingent liabilities due to acquisitions |
22,952 | 8,073 | ||||||
| Derivative liability |
28,372 | 4,863 | ||||||
| Note due to related party |
6,164 | 6,606 | ||||||
| Deferred compensation plan |
61,878 | 52,302 | ||||||
| Deferred tax liability |
79,711 | 86,278 | ||||||
|
|
|
|
|
|||||
| Total liabilities |
3,196,193 | 2,201,382 | ||||||
|
|
|
|
|
|||||
| Commitments and contingencies (Note 12) |
||||||||
| STOCKHOLDER’S EQUITY |
||||||||
| Common stock, $100 par value; 2,000 shares authorized; 928 issued and outstanding at June 30, 2020 and December 31, 2019 |
93 | 93 | ||||||
| Additional paid-in capital |
21,992 | 21,992 | ||||||
| Retained earnings |
484,727 | 383,946 | ||||||
|
|
|
|
|
|||||
| Total stockholder’s equity |
506,812 | 406,031 | ||||||
|
|
|
|
|
|||||
| TOTAL LIABILITIES AND STOCKHOLDER’S EQUITY |
$ | 3,703,005 | $ | 2,607,413 | ||||
|
|
|
|
|
|||||
See accompanying notes to condensed consolidated financial statements
F-2
Table of Contents
GUILD MORTGAGE COMPANY
CONDENSED CONSOLIDATED STATEMENTS OF INCOME (LOSS)
(Dollars in thousands)
(unaudited)
| For the six months ended June 30, |
||||||||
| 2020 | 2019 | |||||||
| REVENUE |
||||||||
| Loan origination fees and gain on sale of loans, net |
$ | 733,293 | $ | 327,503 | ||||
| Loan servicing and other fees |
76,310 | 68,437 | ||||||
| Valuation adjustment of mortgage servicing rights |
(204,810 | ) | (160,222 | ) | ||||
| Interest income |
26,949 | 25,327 | ||||||
| Interest expense |
(27,441 | ) | (23,133 | ) | ||||
| Other income |
(4 | ) | 1,181 | |||||
|
|
|
|
|
|||||
| Net revenue |
604,297 | 239,093 | ||||||
|
|
|
|
|
|||||
| EXPENSES |
||||||||
| Salaries, commissions and benefits |
376,898 | 241,316 | ||||||
| General and administrative |
48,192 | 28,624 | ||||||
| Occupancy, equipment and communication |
26,955 | 26,942 | ||||||
| Depreciation and amortization |
3,146 | 3,824 | ||||||
| Provision for foreclosure losses |
1,860 | 774 | ||||||
|
|
|
|
|
|||||
| Total expenses |
457,051 | 301,480 | ||||||
|
|
|
|
|
|||||
| INCOME (LOSS) BEFORE INCOME TAX EXPENSE (BENEFIT) |
147,246 | (62,387 | ) | |||||
| INCOME TAX EXPENSE (BENEFIT) |
36,465 | (15,389 | ) | |||||
|
|
|
|
|
|||||
| NET INCOME (LOSS) |
$ | 110,781 | $ | (46,998 | ) | |||
|
|
|
|
|
|||||
See accompanying notes to condensed consolidated financial statements
F-3
Table of Contents
GUILD MORTGAGE COMPANY
CONDENSED CONSOLIDATED STATEMENTS OF CHANGES IN STOCKHOLDER’S EQUITY
FOR SIX MONTHS ENDED JUNE 30, 2020 AND 2019
(Dollars in thousands, except per share data)
(unaudited)
| Shares | Amount | Additional Paid-In Capital |
Retained Earnings |
Total | ||||||||||||||||
| Balance at December 31, 2018 |
942 | $ | 94 | $ | 22,317 | $ | 418,530 | $ | 440,941 | |||||||||||
| Common stock dividends ($13,465 per share) |
— | — | — | (12,500 | ) | (12,500 | ) | |||||||||||||
| Stock repurchase |
(14 | ) | (1 | ) | (325 | ) | (7,661 | ) | (7,987 | ) | ||||||||||
| Net loss |
— | — | — | (46,998 | ) | (46,998 | ) | |||||||||||||
|
|
|
|
|
|
|
|
|
|
|
|||||||||||
| Balance at June 30, 2019 |
928 | $ | 93 | $ | 21,992 | $ | 351,371 | $ | 373,456 | |||||||||||
| Balance at December 31, 2019 |
928 | $ | 93 | $ | 21,992 | $ | 383,946 | $ | 406,031 | |||||||||||
| Common stock dividends ($10,772 per share) |
— | — | — | (10,000 | ) | (10,000 | ) | |||||||||||||
| Net income |
— | — | — | 110,781 | 110,781 | |||||||||||||||
|
|
|
|
|
|
|
|
|
|
|
|||||||||||
| Balance at June 30, 2020 |
$ | 928 | $ | 93 | $ | 21,992 | $ | 484,727 | $ | 506,812 | ||||||||||
|
|
|
|
|
|
|
|
|
|
|
|||||||||||
See accompanying notes to condensed consolidated financial statements
F-4
Table of Contents
GUILD MORTGAGE COMPANY
CONDENSED CONSOLIDATED STATEMENTS OF CASH FLOWS
(Dollars in thousands)
(unaudited)
| For the six months ended June 30, |
||||||||
| 2020 | 2019 | |||||||
| CASH FLOWS FROM OPERATING ACTIVITIES |
||||||||
| Net income (loss) |
$ | 110,781 | $ | (46,998 | ) | |||
| Adjustments to reconcile net income (loss) to net cash used in operating activities: |
||||||||
| Depreciation and amortization of fixed assets |
3,145 | 3,382 | ||||||
| Valuation adjustment of mortgage servicing rights |
204,810 | 160,222 | ||||||
| Valuation adjustment of mortgage loans held for sale |
(43,912 | ) | (9,222 | ) | ||||
| Valuation adjustment of derivatives |
(98,198 | ) | (8,191 | ) | ||||
| Provision for investor losses |
11,053 | 3,655 | ||||||
| Provision for foreclosure losses |
1,860 | 774 | ||||||
| Changes in estimated fair value of contingent liabilities due to acquisitions |
20,025 | 3,054 | ||||||
| Gain on sale of mortgage loans excluding fair value of other financial instruments, net |
(458,596 | ) | (257,943 | ) | ||||
| Deferred income taxes |
(6,567 | ) | (24,038 | ) | ||||
| Other |
9,299 | 228 | ||||||
| Investor reserves |
(3,688 | ) | (3,933 | ) | ||||
| Foreclosure loss reserve |
(1,387 | ) | (2,018 | ) | ||||
| Changes in operating assets and liabilities: |
||||||||
| Origination of mortgage loans held for sale |
(14,615,843 | ) | (8,566,696 | ) | ||||
| Proceeds on sale of and payments from mortgage loans held for sale |
14,640,672 | 8,466,299 | ||||||
| Accounts and interest receivable |
9,134 | 5,522 | ||||||
| Other assets |
35,685 | 14,945 | ||||||
| Mortgage servicing rights |
(123,095 | ) | (47,905 | ) | ||||
| Accounts payable and accrued expenses |
820 | 2,152 | ||||||
| Accrued compensation and benefits |
20,050 | 9,451 | ||||||
| Contingent liability payments |
(788 | ) | — | |||||
| Deferred compensation plan liability |
664 | (4,823 | ) | |||||
| Proceeds from real estate owned conveyed to HUD |
1,095 | 3,674 | ||||||
| Purchase and advances of real estate owned |
(797 | ) | (2,642 | ) | ||||
|
|
|
|
|
|||||
| Net cash used in operating activities |
(283,778 | ) | (301,051 | ) | ||||
|
|
|
|
|
|||||
| CASH FLOWS FROM INVESTING ACTIVITIES |
||||||||
| Proceeds from the sale of property & equipment |
32 | 49 | ||||||
| Purchase of property and equipment |
(3,658 | ) | (1,482 | ) | ||||
| Payment (made) received on behalf of affiliate |
(12,023 | ) | 345 | |||||
| Acquisitions |
— | (1,250 | ) | |||||
|
|
|
|
|
|||||
| Net cash used in investing activities |
(15,649 | ) | (2,338 | ) | ||||
|
|
|
|
|
|||||
| CASH FLOWS FROM FINANCING ACTIVITIES |
||||||||
| Borrowings on warehouse lines of credit |
14,261,034 | 8,330,730 | ||||||
| Repayments on warehouse lines of credit |
(13,874,930 | ) | (7,992,678 | ) | ||||
| Borrowings on MSR notes payable |
45,000 | 10,000 | ||||||
| Repayments on MSR notes payable |
(75,000 | ) | (17,000 | ) | ||||
| Contingent liability payments |
(4,358 | ) | (347 | ) | ||||
| Net change in notes payable |
(592 | ) | 7,484 | |||||
| Repurchase of stock |
— | (7,987 | ) | |||||
| Dividends paid |
(10,000 | ) | (12,500 | ) | ||||
|
|
|
|
|
|||||
| Net cash provided by financing activities |
341,154 | 317,702 | ||||||
|
|
|
|
|
|||||
| INCREASE IN CASH, CASH EQUIVALENTS AND RESTRICTED CASH |
41,727 | 14,313 | ||||||
| CASH, CASH EQUIVALENTS AND RESTRICTED CASH, BEGINNING OF YEAR |
106,735 | 62,755 | ||||||
|
|
|
|
|
|||||
| CASH, CASH EQUIVALENTS AND RESTRICTED CASH, END OF YEAR |
$ | 148,462 | $ | 77,068 | ||||
|
|
|
|
|
|||||
| SUPPLEMENTAL INFORMATION |
||||||||
| Cash paid for interest (net of rebates of $2.3 million and $1.9 million for the six months ended June 30, 2020 and 2019) |
$ | 20,218 | $ | 18,409 | ||||
|
|
|
|
|
|||||
| Net cash paid (refunded) for taxes |
$ | 842 | $ | (6,872 | ) | |||
|
|
|
|
|
|||||
| Net assets acquired due to acquisition |
$ | — | $ | 2,984 | ||||
|
|
|
|
|
|||||
| Cash and cash equivalents |
$ | 144,936 | $ | 73,068 | ||||
| Restricted cash |
3,526 | 4,000 | ||||||
|
|
|
|
|
|||||
| Total cash, cash equivalents and restricted cash shown in the consolidated statements of cash flows |
$ | 148,462 | $ | 77,068 | ||||
|
|
|
|
|
|||||
| NON-CASH DISCLOSURES (See Note 15) |
||||||||
See accompanying notes to condensed consolidated financial statements.
F-5
Table of Contents
GUILD MORTGAGE COMPANY
NOTES TO CONDENSED CONSOLIDATED FINANCIAL STATEMENTS
(Dollars in thousands, except as otherwise indicated)
(unaudited)
1. BUSINESS, BASIS OF PRESENTATION, AND ACCOUNTING POLICIES
The accompanying condensed consolidated financial statements include all of the assets, liabilities and results of operations of Guild Mortgage Company (the “Company” or “Guild” or “our”), a California corporation, and all of its wholly owned subsidiaries. The Company has four wholly owned subsidiaries; Guild Administration Corp., Mission Village Insurance Agency, Guild Insurance, LLC and Guild Financial Express, Inc. The activities of the subsidiaries are related to the Company’s mortgage banking operations. All intercompany accounts and transactions have been eliminated in consolidation. The Company is a wholly owned subsidiary of Guild Mortgage Company, LLC (“GMC LLC”), a privately owned California limited liability company.
The accompanying condensed consolidated financial statements have been prepared in connection with the proposed initial public offering (the “Offering”) of Class A common stock of Guild Holdings Company, a Delaware corporation (“Holdings”). Prior to the completion of the Offering, GMC LLC will contribute 100% of the shares of the Company to Holdings and the Company will be converted to a California limited liability company. As a result, Holdings is expected to become the sole member of the Company prior to the completion of the Offering.
Basis of Presentation
Our condensed consolidated financial statements are unaudited and presented in U.S. dollars. They have been prepared in accordance with accounting principles generally accepted in the United States of America (“GAAP”) pursuant to the rules and regulations of the Securities and Exchange Commission (“SEC”) for interim financial information. Accordingly, they do not include all of the information and footnotes required by GAAP for complete financial statements. Our Consolidated Balance Sheet as of December 31, 2019 has been derived from our audited consolidated financial statements at that date. Our condensed consolidated interim financial statements should be read in conjunction with our consolidated financial statements and notes thereto for the year ended December 31, 2019, which include a complete set of footnote disclosures, including our significant accounting policies. In our opinion, these condensed consolidated financial statements include all normal and recurring adjustments considered necessary for a fair statement of our results of operations, financial position and cash flows for the periods presented. However, our results of operations for any interim period are not necessarily indicative of the results that may be expected for a full fiscal year or for any other future period.
Management Estimates
The preparation of financial statements in conformity with GAAP requires management to make estimates and assumptions that affect the reported amounts of assets and liabilities and disclosure of contingent assets and liabilities at the date of the financial statements and the reported amounts of revenues and expenses during the reporting period. Actual results could materially differ from those estimates.
Subsequent Events
The Company has evaluated subsequent events from the balance sheet date through August 21, 2020, the date on which the financial statements were issued. In March 2020, the World Health Organization (“WHO”) declared the outbreak of a novel coronavirus (COVID-19) as a pandemic, which continues to spread throughout the United States. Through August 21, 2020 the Company remains fully functional in both its origination and servicing operations. While the pandemic could cause for certain branches to
F-6
Table of Contents
GUILD MORTGAGE COMPANY
NOTES TO CONDENSED CONSOLIDATED FINANCIAL STATEMENTS
(Dollars in thousands, except as otherwise indicated)
temporarily close, most of the significant job functions can be performed remotely. The Company has taken steps to ensure business can continue as necessary should branches be forced to temporarily close. The Company continues to monitor guidance published by the WHO, Centers for Disease Control and Prevention, local and federal government agencies and the Mortgage Bankers Association and is in continual communication with its investors regarding the developments in the mortgage industry.
Cash, Cash Equivalents and Restricted Cash
Restricted cash as of June 30, 2020 and June 30, 2019 consisted of deposits restricted under the terms of our warehouse lines of credit.
| June 30, 2020 |
June 30, 2019 |
|||||||
| Cash and cash equivalents |
$ | 144,936 | $ | 73,068 | ||||
| Restricted cash |
3,526 | 4,000 | ||||||
|
|
|
|
|
|||||
| Total cash, cash equivalents and restricted cash shown in the Condensed Consolidated Statements of Cash Flows |
$ | 148,462 | $ | 77,068 | ||||
|
|
|
|
|
|||||
Derivative Instruments
The Company enters into interest rate lock commitments (“IRLCs”), forward commitments to sell mortgage loans and to be announced trades, which are considered derivative financial instruments. These items are accounted for as free-standing derivatives and are included in the Condensed Consolidated Balance Sheets at fair value. The Company treats all of its derivative instruments as economic hedges; therefore, none of its derivative instruments qualify for designation as accounting hedges.
The Company enters into IRLCs to originate residential mortgage loans at specified interest rates and within a specified period of time, with customers who have applied for a loan and meet certain credit and underwriting criteria. IRLCs on mortgage loans in process that have not closed, but are intended to be sold, are considered to be derivatives and changes in fair value are recorded in the Condensed Consolidated Statements of Income as part of Loan Origination Fees and Gain on Sale of Loans, net. Fair value is based upon changes in the fair value of the underlying mortgages, estimated to be realizable upon sale into the secondary market, net of estimated commission expenses. Fair value estimates also consider loan commitments not expected to be exercised by customers for unforeseen reasons, commonly referred to as “fallout”.
IRLCs and uncommitted mortgage loans held for sale expose the Company to the risk that the value of the mortgage loans held and mortgage loans underlying the commitments may decline due to increases in mortgage interest rates during the life of the commitments. To protect against this risk, the Company enters into derivative loan instruments such as forward loan sales commitments, mandatory delivery commitments, options and futures contracts. Management expects the changes in the fair value of these derivatives to have a negative correlation to the changes in fair value of the derivative loan commitments and mortgage loans held for sale, thereby reducing earnings volatility. The changes in fair value are recorded in the Condensed Consolidated Statements of Income as part of Loan Origination Fees and Gain on Sale of Loans, net. The Company considers various factors and strategies to determine the portion of the mortgage pipeline and mortgage loans held for sale it wants to economically hedge. See Notes 2 and 5 for additional information.
F-7
Table of Contents
GUILD MORTGAGE COMPANY
NOTES TO CONDENSED CONSOLIDATED FINANCIAL STATEMENTS
(Dollars in thousands, except as otherwise indicated)
Escrow and Fiduciary Fund
As a loan servicer, the Company maintains segregated bank accounts in trust for investors and escrow balances for mortgagors, which are excluded from the Company’s Condensed Consolidated Balance Sheet. These accounts totaled $1.4 billion and $1.0 billion at June 30, 2020 and December 31, 2019, respectively.
Risks and Uncertainties
In the normal course of business, companies in the mortgage banking industry encounter certain economic, liquidity, and regulatory risks.
Economic risk includes interest rate risk and credit risk.
Interest rate risk
The Company’s mortgage loans held for sale, commitments to originate loans, and mortgage servicing rights are subject to interest rate risk. For mortgage loans held for sale and commitments to originate loans, to the extent that a rising interest rate environment exists, the Company may experience a decrease in loan production and decreases in value, which may negatively impact the Company’s operations. To mitigate this risk the Company uses hedging strategies designed to ensure any fluctuations in rates would not have a material impact on the Company’s financial position. For the Company’s mortgage servicing rights, to the extent that a declining interest rate environment exists, the Company may experience decreases in the fair value of the portfolio, which may negatively impact the Company’s financial position. For the periods ended June 30, 2020 and June 30, 2019, the Company experienced material declines in the valuation of its MSR portfolio due to significant declines in interest rates. Since the Company also has a large origination platform, the Company was able to mitigate this risk by recapturing a significant portion of the runoff through refinances.
Credit risk
Credit risk is the risk of default that may result from borrowers’ inability or unwillingness to make contractually required payments during the period in which loans are being held for sale. The Company considers credit risk associated with these loans to be insignificant as it holds the loans for a short period of time, typically less than a month, and historically the Company has not experienced any material losses due to credit risk on mortgage loans held for sale.
The Company sells loans to investors without recourse. As such, the investors have assumed the risk of loss or default by the borrower. However, the Company is usually required by these investors to make certain standard representations and warranties relating to credit information, loan documentation and collateral. To the extent that the Company does not comply with such representations, or there are early payment defaults, the Company may be required to repurchase the loans or indemnify these investors for any losses from borrower defaults, defects in the collateral or errors made in the credit decision.
The Company is also subject to counterparty credit risk in the event of contractual nonperformance by its trading counterparties to its various over-the-counter derivative financial instruments. The Company manages this credit risk by selecting only counterparties that it believes to be financially strong, spreading the credit risk among many such counterparties, placing contractual limits on the amount of unsecured credit extended to any single counterparty, and entering into netting agreements with the counterparties as appropriate. The master netting agreements contain a legal right to offset amounts due to and from the same counterparty. Derivative assets in the Condensed Consolidated Balance Sheets represent derivative contracts in a gain position net of loss positions with the same counterparty and, therefore, also represent
F-8
Table of Contents
GUILD MORTGAGE COMPANY
NOTES TO CONDENSED CONSOLIDATED FINANCIAL STATEMENTS
(Dollars in thousands, except as otherwise indicated)
the Company’s maximum counterparty credit risk. The Company incurred no credit losses due to nonperformance of any of its counterparties during the periods ended June 30, 2020 and 2019.
Liquidity risk
The Company encounters liquidity risk as the business requires substantial cash to support its operating activities. As a result, the Company is dependent on its lines of credit, and other financing facilities in order to finance its continued operations. If the Company’s principal lenders decided to terminate or not to renew these credit facilities with the Company, the loss of borrowing capacity could have an adverse impact on the Company’s financial statements unless the Company found a suitable alternative source. To mitigate this risk, the Company has multiple financing facilities with different lenders and varied maturity dates. Historically, the Company has not had a line of credit involuntarily terminated by a lender.
Regulatory risk
The Company is subject to extensive and comprehensive regulation under federal, state and local laws in the United States. These laws and regulations significantly affect the way in which the Company does business and can restrict the scope of the Company’s existing business and limit the Company’s ability to expand product offerings or pursue acquisitions, or can make costs to service or originate loans higher, which could impact financial results. The Company continually monitors its regulatory environment for any changes that could have a significant impact on operations.
Accounting Standards Issued but Not Yet Adopted
As an emerging growth company (“EGC”), the Jumpstart Our Business Startups Act (“JOBS Act”) allows the company to delay adoption of new or revised accounting pronouncements applicable to public companies until such pronouncements are applicable to private companies. The company has elected to use the extended transition period under the JOBS Act until such time the company is not considered to be an EGC. The adoption dates are discussed below to reflect this election.
In February 2016, the FASB issued ASU 2016-02, Leases (Topic 842). This update amends various aspects of existing guidance for leases and requires additional disclosures about leasing arrangements. It will require companies to recognize lease assets and lease liabilities by lessees for those leases classified as operating leases under previous GAAP. Topic 842 retains a distinction between finance leases and operating leases. The classification criteria for distinguishing between finance leases and operating leases are substantially similar to the classification criteria for distinguishing between capital leases and operating leases in the previous lease guidance. In November 2019, the FASB issued ASU 2019-10 which extended the effective date of ASU 2016-02. The new guidance will be effective for the Company beginning January 1, 2021 and early adoption is permitted. The Company is currently in the process of evaluating the impact of the adoption of the new guidance on its financial statements.
In June 2016, the FASB issued ASU 2016-13, Financial Instruments—Credit Losses (Topic 326). This update requires expected credit losses for financial instruments held at the reporting date to be measured based on historical experience, current conditions and reasonable and supportable forecasts. The update eliminates the probable initial recognition threshold in current GAAP and instead reflects an entity’s current estimate of all expected credit losses. Previously, when credit losses were measured under GAAP, an entity generally only considered past events and current conditions in measuring the incurred loss. In November 2019, the FASB issued ASU 2019-10 which extended the effective date of ASU 2016-13. The new guidance will be effective for the Company beginning January 1, 2023 and early adoption is permitted.
F-9
Table of Contents
GUILD MORTGAGE COMPANY
NOTES TO CONDENSED CONSOLIDATED FINANCIAL STATEMENTS
(Dollars in thousands, except as otherwise indicated)
The Company is currently in the process of evaluating the impact of the adoption of the new guidance on its financial statements.
In August 2018, the FASB issued ASU 2018-15, Intangibles-Goodwill and Other-Internal-Use Software (Subtopic 35-40). This update provides guidance on accounting for a cloud computing arrangement that includes a license to internal-use software. This generally means that an intangible asset is recognized for the software license and, to the extent that the payments attributable to the software license are made over time, a liability also is recognized. If a cloud computing arrangement does not include a software license, the entity should account for the arrangement as a service contract which would generally mean to expense the service as incurred. The new guidance will be effective for the Company beginning January 1, 2021 and early adoption is permitted. The Company is currently in the process of evaluating the impact of the adoption of the new guidance on its financial statements.
In December 2019, the FASB issued ASU 2019-12, Income Taxes (Topic 740). This update provides amendments to simplify and reduce complexity when accounting for income taxes as well as eliminating certain exceptions. The new guidance will be effective for the Company beginning January 1, 2022 with early adoption permitted. The Company is currently in the process of evaluating the impact of the adoption of the new guidance on its financial statements.
In March 2020, the FASB issued ASU No. 2020-04, Reference Rate Reform (Topic 848): Facilitation of the Effects of Reference Rate Reform on Financial Reporting. Subject to meeting certain criteria, the new guidance provides optional expedients and exceptions to applying contract modification accounting under existing GAAP, to address the expected phase out of the London Inter-bank Offered Rate (“LIBOR”) by the end of 2021. This guidance is effective upon issuance and allows application to contract changes as early as January 1, 2020. The Company is in the process of reviewing its funding facilities and financing facilities that utilize LIBOR as the reference rate and is currently evaluating the potential impact that the adoption of this ASU will have on the condensed consolidated financial statements and related disclosures.
2. FAIR VALUE MEASUREMENTS
Fair value is defined as the exchange price that would be received for an asset or paid to transfer a liability (an exit price) in the principal or most advantageous market for the asset or liability in an orderly transaction between market participants at the measurement date. Inputs used to measure fair value are prioritized within a three-level fair value hierarchy. This hierarchy requires entities to maximize the use of observable inputs and minimize the use of unobservable inputs. The three levels of inputs used to measure fair value are as follows:
Level One – Level One inputs are unadjusted, quoted prices in active markets for identical assets or liabilities which the Company has the ability to access at the measurement date.
Level Two – Level Two inputs are observable for that asset or liability, either directly or indirectly, and include quoted prices for similar assets and liabilities in active markets, quoted prices for identical or similar assets and liabilities in markets that are not active, observable inputs for the asset or liability other than quoted prices and inputs derived principally from or corroborated by observable market data by correlation or other means. If the asset or liability has a specified contractual term, the inputs must be observable for substantially the full term of the asset or liability.
Level Three – Level Three inputs are unobservable inputs for the asset or liability that reflect the Company’s assessment of the assumptions that market participants would use in pricing the asset or liability, including assumptions about risk, and are developed based on the best information available.
F-10
Table of Contents
GUILD MORTGAGE COMPANY
NOTES TO CONDENSED CONSOLIDATED FINANCIAL STATEMENTS
(Dollars in thousands, except as otherwise indicated)
The Company’s assets and liabilities are carried at cost, and because of their short-term nature, are believed to approximate current fair value, with the exception of mortgage loans held for sale, mortgage servicing rights, derivatives, real estate owned, Government National Mortgage Association (“GNMA”) loans subject to repurchase right and contingent liabilities due to acquisitions.
The Company updates the valuation of each instrument recorded at fair value on a monthly or quarterly basis, evaluating all available observable information which may include current market prices or bids, recent trade activity, changes in the levels of market activity and benchmarking of industry data. The assessment also includes consideration of identifying the valuation approach that would be used currently by market participants. If it is determined that a change in valuation technique or its application is appropriate, or if there are other changes in availability of observable data or market activity, the current methodology will be analyzed to determine if a transfer between levels of the valuation hierarchy is appropriate. Such reclassifications are reported as transfers into or out of a level as of the beginning of the quarter that the change occurs.
Fair value is based on quoted market prices, when available. If quoted prices are not available, fair value is estimated based upon other observable inputs. Unobservable inputs are used when observable inputs are not available and are based upon judgments and assumptions, which are the Company’s assessment of the assumptions market participants would use in pricing the asset or liability. These inputs may include assumptions about risk, counterparty credit quality, the Company’s creditworthiness and liquidity and are developed based on the best information available. When a determination is made to classify an asset or liability within Level Three of the valuation hierarchy, the determination is based upon the significance of the unobservable factors to the overall fair value measurement of the asset or liability. The fair value of assets and liabilities classified within Level Three of the valuation hierarchy also typically includes observable factors and the realized or unrealized gain or loss recorded from the valuation of these instruments would also include amounts determined by observable factors.
Recurring Fair Value Measurements
The Company’s fair value measurements are evaluated within the fair value hierarchy, based on the nature of the inputs used to determine the fair value at the measurement date. At June 30, 2020 and December 31, 2019, the Company had the following assets and liabilities that are measured at fair value on a recurring basis:
Trading Securities – Trading securities are classified within Level One of the valuation hierarchy. Valuation is based upon quoted prices for identical instruments traded in active markets. Level One trading securities include securities traded on active exchange markets, such as the New York Stock Exchange. Trading securities are included within prepaid expenses and other assets on the Condensed Consolidated Balance Sheets.
Derivative Instruments – Derivative instruments are classified within Level Two and Level Three of the valuation hierarchy, and include the following:
Interest Rate Lock Commitments: IRLCs are classified within Level Three of the valuation hierarchy. IRLCs represent an agreement to extend credit to a mortgage loan applicant, or an agreement to purchase a loan from a third-party originator, whereby the interest rate on the loan is set prior to funding. The fair value of IRLCs is based upon the estimated fair value of the underlying mortgage loan, including the expected net future cash flows related to servicing the mortgage loan, net of estimated commission expenses, and adjusted for: (i) estimated costs to complete and originate the loan and (ii) an adjustment to reflect the estimated percentage of IRLCs that will result in a closed
F-11
Table of Contents
GUILD MORTGAGE COMPANY
NOTES TO CONDENSED CONSOLIDATED FINANCIAL STATEMENTS
(Dollars in thousands, except as otherwise indicated)
mortgage loan under the original terms of the agreement (pull-through rate). The pull-through rate is considered a significant unobservable input and is estimated based on changes in pricing and actual borrower behavior using a historical analysis of loan closing and fallout data. The average pull-through rate used to calculate the fair value of IRLCs as of June 30, 2020 and December 31, 2019, was 87.2% and 89.4%, respectively. On a quarterly basis, actual loan pull-through rates are compared to the modeled estimates to confirm the assumptions are reflective of current trends. Generally, a change in interest rates is accompanied by a directionally opposite change in the assumption used for the pull-through percentage, and the impact to fair value of a change in pull-through would be partially offset by the related change in price.
Forward Delivery Commitments: Forward delivery commitments are classified within Level Two of the valuation hierarchy. Forward delivery commitments fix the forward sales price that will be realized upon the sale of mortgage loans into the secondary market. The fair value of forward delivery commitments is primarily based upon the current agency mortgage-backed security market to-be-announced pricing specific to the loan program, delivery coupon and delivery date of the trade. Best efforts sales commitments are also entered into for certain loans at the time the borrower commitment is made. These best efforts sales commitments are valued using the committed price to the counterparty against the current market price of the IRLC or mortgage loan held for sale.
Option contracts are a type of forward commitment that represents the rights to buy or sell mortgage-backed securities at specified prices in the future. Their value is based upon the underlying current to-be-announced pricing of the agency mortgage-backed security market, and market-based volatility. See Note 6 for additional information on the derivative instruments.
Mortgage Loans Held for Sale – MLHS are carried at fair value. The fair value of MLHS is based on secondary market pricing for loans with similar characteristics, and as such, is classified as a Level Two measurement. For Level Two MLHS, fair value is estimated through a market approach by using either: (i) the fair value of securities backed by similar mortgage loans, adjusted for certain factors to approximate the fair value of a whole mortgage loan, including the value attributable to servicing rights and credit risk, (ii) current commitments to purchase loans or (iii) recent observable market trades for similar loans, adjusted for credit risk and other individual loan characteristics. The agency mortgage-backed security market is a highly liquid and active secondary market for conforming conventional loans whereby quoted prices exist for securities at the pass-through level and are published on a regular basis. The Company has the ability to access this market and it is the market into which conforming mortgage loans are typically sold.
Mortgage Servicing Rights – Mortgage Servicing Rights (“MSRs”) are classified within Level Three of the valuation hierarchy due to the use of significant unobservable inputs and the lack of an active market for such assets. The fair value of MSRs is estimated based upon projections of expected future cash flows considering prepayment estimates, the Company’s historical prepayment rates, portfolio characteristics, interest rates based on interest rate yield curves, implied volatility and other economic factors. The Company obtains valuations from an independent third party on a quarterly basis, and records an adjustment based on this third-party valuation.
Contingent Liabilities due to acquisitions – Contingent liabilities represent future obligations of the Company to make payments to the former owners of its acquired companies. The Company determines the fair value of its contingent liabilities using a discounted cash flow approach whereby the Company forecasts the cash outflows related to the future payments, which are based on a percentage of net income specified in the purchase agreements. The Company then discounts these expected payment amounts to calculate the present value, or fair value, as of the valuation date. The
F-12
Table of Contents
GUILD MORTGAGE COMPANY
NOTES TO CONDENSED CONSOLIDATED FINANCIAL STATEMENTS
(Dollars in thousands, except as otherwise indicated)
Company’s management evaluates the underlying projections used in determining fair value each period and makes updates to these underlying projections.
The Company uses a risk-adjusted discount rate to value the contingent liabilities which is considered a significant unobservable input, and as such, the liabilities are classified as a Level Three measurement. Management’s underlying projections adjust for market penetration and other economic expectations, and the discount rate is risk-adjusted for key factors such as uncertainty in the mortgage banking industry due to its reliance on external influences (interest rates, regulatory changes, etc.), upfront payments, and credit risk. An increase in the discount rate will result in a decrease in the fair value of the contingent liabilities. Conversely, a decrease in the discount rate will result in an increase in the fair value of the contingent liabilities. For each of the period ended June 30, 2020 and the year ended December 31, 2019, the range of the risk adjusted discount rate was 8.0% - 20.0%, with a median of 15.0%. Adjustments to the fair value of the contingent liabilities (other than payments) are recorded as a gain or loss and are included within general and administrative expenses on the Condensed Consolidated Statements of Income.
The following table summarizes the Company’s assets and liabilities measured at fair value on a recurring basis at June 30, 2020:
| Description |
Level 1 | Level 2 | Level 3 | Total | ||||||||||||
| Assets: |
||||||||||||||||
| Trading securities |
$ | 61 | $ | — | $ | — | $ | 61 | ||||||||
| Derivative |
||||||||||||||||
| Interest rate lock commitments |
— | — | 141,629 | 141,629 | ||||||||||||
| Mortgage loans held for sale |
— | 1,982,521 | — | 1,982,521 | ||||||||||||
| Mortgage servicing rights |
— | — | 336,687 | 336,687 | ||||||||||||
|
|
|
|
|
|
|
|
|
|||||||||
| Total assets at fair value |
$ | 61 | $ | 1,982,521 | $ | 478,316 | $ | 2,460,898 | ||||||||
|
|
|
|
|
|
|
|
|
|||||||||
| Liabilities: |
||||||||||||||||
| Derivative |
||||||||||||||||
| Forward delivery commitments |
— | 28,372 | — | 28,372 | ||||||||||||
| Contingent liabilities due to acquisitions |
— | — | 22,952 | 22,952 | ||||||||||||
|
|
|
|
|
|
|
|
|
|||||||||
| Total liabilities at fair value |
$ | — | $ | 28,372 | $ | 22,952 | $ | 51,324 | ||||||||
|
|
|
|
|
|
|
|
|
|||||||||
F-13
Table of Contents
GUILD MORTGAGE COMPANY
NOTES TO CONDENSED CONSOLIDATED FINANCIAL STATEMENTS
(Dollars in thousands, except as otherwise indicated)
The following table summarizes the Company’s assets and liabilities measured at fair value on a recurring basis at December 31, 2019:
| Description |
Level 1 | Level 2 | Level 3 | Total | ||||||||||||
| Assets: |
||||||||||||||||
| Trading securities |
$ | 93 | $ | — | $ | — | $ | 93 | ||||||||
| Derivative |
||||||||||||||||
| Interest rate lock commitments |
— | — | 19,922 | 19,922 | ||||||||||||
| Mortgage loans held for sale |
— | 1,504,842 | — | 1,504,842 | ||||||||||||
| Mortgage servicing rights |
— | — | 418,402 | 418,402 | ||||||||||||
|
|
|
|
|
|
|
|
|
|||||||||
| Total assets at fair value |
$ | 93 | $ | 1,504,842 | $ | 438,324 | $ | 1,943,259 | ||||||||
|
|
|
|
|
|
|
|
|
|||||||||
| Liabilities: |
||||||||||||||||
| Derivative |
||||||||||||||||
| Forward delivery commitments |
— | 4,863 | — | 4,863 | ||||||||||||
| Contingent liabilities due to acquisitions |
— | — | 8,073 | 8,073 | ||||||||||||
|
|
|
|
|
|
|
|
|
|||||||||
| Total liabilities at fair value |
$ | — | $ | 4,863 | $ | 8,073 | $ | 12,936 | ||||||||
|
|
|
|
|
|
|
|
|
|||||||||
Non-Recurring Fair Value Measurements
Certain assets and liabilities that are not typically measured at fair value on a recurring basis may be subject to fair value measurement requirements under certain circumstances. These adjustments to fair value usually result from write-downs of individual assets. At June 30, 2020 and December 31, 2019, the Company had the following financial assets measured at fair value on a nonrecurring basis:
Real Estate Owned — Other assets that are evaluated for impairment using fair value measurements on a nonrecurring basis consist of mortgage loans in foreclosure and REO. The evaluation of impairment reflects an estimate of losses that have been incurred as of the balance sheet date, which will likely not be recoverable from guarantors, insurers or investors. The impairment of mortgage loans in foreclosure, which represents the unpaid principal balance of mortgage loans for which foreclosure proceedings have been initiated, plus recoverable advances on those loans, is based on the fair value of the underlying collateral, determined on a loan level basis, less costs to sell. REO properties, which are acquired from mortgagors in default, are recorded at the lower of adjusted carrying amount at the time the property is acquired or fair value of the property, less estimated selling costs. Fair values of the collateral underlying mortgage loans in foreclosure and REOs are estimated using appraisals and broker price opinions, which are updated on a periodic basis to reflect current housing market conditions. The allowance for probable losses associated with mortgage loans in foreclosure and the adjustment to record REO at their estimated net realizable value are based upon fair value measurements from Level Three of the valuation hierarchy.
Ginnie Mae Loans subject to Repurchase Right – GNMA securitization programs allow servicers to buy back individual delinquent mortgage loans from the securitized loan pool once certain conditions are met. If a borrower makes no payment for three consecutive months, the servicer has the option to repurchase the delinquent loan for an amount equal to 100% of the loan’s remaining principal balance. Under ASC 860, this buy-back option is considered a conditional option until the delinquency criteria are met, at which time the option becomes unconditional. The Company records these assets and liabilities at their fair value, which is determined to be the remaining unpaid principal balance. The Company’s future expected realizable cash flows are the cash payments of the remaining unpaid
F-14
Table of Contents
GUILD MORTGAGE COMPANY
NOTES TO CONDENSED CONSOLIDATED FINANCIAL STATEMENTS
(Dollars in thousands, except as otherwise indicated)
principal balance whether paid by the borrower or reimbursed through a claim filed with the U.S. Department of Housing and Urban Development (“HUD”) HUD. The Company considers the fair value of these assets and liabilities to fall into the Level Two bucket in the valuation hierarchy due to the assets and liabilities having specified contractual terms and the inputs are observable for substantially the full term of the assets and liabilities life.
The following table summarizes the Company’s financial assets measured at fair value on a nonrecurring basis at June 30, 2020:
| Description |
Level 1 | Level 2 | Level 3 | Total | ||||||||||||
| Assets: |
||||||||||||||||
| Real estate owned |
— | — | 552 | 552 | ||||||||||||
| Ginnie Mae loans subject to repurchase right |
— | 948,922 | — | 948,922 | ||||||||||||
|
|
|
|
|
|
|
|
|
|||||||||
| Total assets at fair value |
$ | — | $ | 948,922 | $ | 552 | $ | 949,474 | ||||||||
|
|
|
|
|
|
|
|
|
|||||||||
| Liabilities: |
||||||||||||||||
| Ginnie Mae loans subject to repurchase right |
— | 952,776 | — | 952,776 | ||||||||||||
|
|
|
|
|
|
|
|
|
|||||||||
| Total liabilities at fair value |
$ | — | $ | 952,776 | $ | — | $ | 952,776 | ||||||||
|
|
|
|
|
|
|
|
|
|||||||||
The following table summarizes the Company’s financial assets measured at fair value on a nonrecurring basis at December 31, 2019:
| Description |
Level 1 | Level 2 | Level 3 | Total | ||||||||||||
| Assets: |
||||||||||||||||
| Real estate owned |
— | — | 852 | 852 | ||||||||||||
| Ginnie Mae loans subject to repurchase right |
— | 404,344 | — | 404,344 | ||||||||||||
|
|
|
|
|
|
|
|
|
|||||||||
| Total assets at fair value |
$ | — | $ | 404,344 | $ | 852 | $ | 405,196 | ||||||||
|
|
|
|
|
|
|
|
|
|||||||||
| Liabilities: |
||||||||||||||||
| Ginnie Mae loans subject to repurchase right |
— | 412,490 | — | 412,490 | ||||||||||||
|
|
|
|
|
|
|
|
|
|||||||||
| Total liabilities at fair value |
$ | — | $ | 412,490 | $ | — | $ | 412,490 | ||||||||
|
|
|
|
|
|
|
|
|
|||||||||
F-15
Table of Contents
GUILD MORTGAGE COMPANY
NOTES TO CONDENSED CONSOLIDATED FINANCIAL STATEMENTS
(Dollars in thousands, except as otherwise indicated)
The table below presents a reconciliation of Level 3 assets and liabilities measured at fair value on a recurring and non-recurring basis for the periods ended:
| IRLCs | Contingent Liabilities |
Real Estate Owned |
||||||||||
| Balance at December 31, 2019 |
$ | 19,922 | $ | 8,073 | $ | 852 | ||||||
| Net transfers and revaluation gains |
121,707 | — | — | |||||||||
| Payments |
— | (5,146 | ) | — | ||||||||
| Additions |
— | — | 797 | |||||||||
| Proceeds |
— | — | (1,095 | ) | ||||||||
| Valuation adjustments |
— | 20,025 | (2 | ) | ||||||||
|
|
|
|
|
|
|
|||||||
| Balance at June 30, 2020 |
$ | 141,629 | $ | 22,952 | $ | 552 | ||||||
|
|
|
|
|
|
|
|||||||
| Balance at December 31, 2018 |
$ | 12,541 | $ | 5,106 | $ | 3,314 | ||||||
| Net transfers and revaluation gains |
12,215 | — | ||||||||||
| Payments |
— | (347 | ) | — | ||||||||
| Additions |
— | 1,735 | 2,642 | |||||||||
| Proceeds |
— | — | (3,674 | ) | ||||||||
| Valuation adjustments |
— | 3,054 | (1,449 | ) | ||||||||
|
|
|
|
|
|
|
|||||||
| Balance at June 30, 2019 |
$ | 24,756 | $ | 9,548 | $ | 833 | ||||||
|
|
|
|
|
|
|
|||||||
Changes in the availability of observable inputs may result in reclassifications of certain assets or liabilities. Such reclassifications are reported as transfers in or out of Level Three as of the beginning of the period that the change occurs. There were no transfers between fair value levels during the periods ended June 30, 2020 and 2019.
Fair Value Option
The following is the estimated fair value and unpaid principal balance of MLHS that have contractual principal amounts and for which the Company has elected the fair value option. The fair value option was elected for MLHS as the Company believes fair value best reflects their expected future economic performance:
| Fair Value | Principal Amount Due Upon Maturity |
Difference (1) | ||||||||||
| Balance at June 30, 2020 |
$ | 1,982,521 | $ | 1,921,077 | $ | 61,444 | ||||||
| Balance at December 31, 2019 |
$ | 1,504,842 | $ | 1,485,460 | $ | 19,382 | ||||||
| (1) | Represents the amount of gains included in loan origination fees and gain on sale of loans, net due to changes in fair value of items accounted for using the fair value option. |
F-16
Table of Contents
GUILD MORTGAGE COMPANY
NOTES TO CONDENSED CONSOLIDATED FINANCIAL STATEMENTS
(Dollars in thousands, except as otherwise indicated)
3. ACCOUNTS AND INTEREST RECEIVABLE
Accounts and interest receivable consisted of the following at June 30, 2020 and December 31, 2019:
| June 30, 2020 |
December 31, 2019 |
|||||||
| Trust advances |
$ | 12,209 | $ | 17,622 | ||||
| Foreclosure advances, net |
6,257 | 7,348 | ||||||
| Receivables related to loan sales |
6,963 | 5,771 | ||||||
| Other |
(425 | ) | 3,870 | |||||
|
|
|
|
|
|||||
| Total accounts and interest receivable |
$ | 25,004 | $ | 34,611 | ||||
|
|
|
|
|
|||||
Management has established a foreclosure reserve for estimated uncollectable balances of the foreclosure and trust advances. Management believes that substantially all other accounts and interest receivable amounts are collectible and, accordingly, no allowance for doubtful accounts is necessary.
The activity of the foreclosure loss reserve was as follows for the six months ended June 30, 2020 and 2019:
| For the six months ended June 30, |
||||||||
| 2020 | 2019 | |||||||
| Balance — beginning of year |
$ | 7,869 | $ | 7,884 | ||||
| Utilization of foreclosure reserve |
(1,387 | ) | (2,018 | ) | ||||
| Provision charged to operations |
1,860 | 774 | ||||||
|
|
|
|
|
|||||
| Balance — end of year |
$ | 8,342 | $ | 6,640 | ||||
|
|
|
|
|
|||||
4. OTHER ASSETS
Other assets consisted of the following at June 30, 2020 and December 31, 2020:
| June 30, 2020 |
December 31, 2019 |
|||||||
| Prepaid expenses |
$ | 15,200 | $ | 11,274 | ||||
| Company owned life insurance |
24,319 | 21,908 | ||||||
| Property and equipment, net |
10,336 | 9,835 | ||||||
| Income tax receivable |
— | 1,015 | ||||||
| Due from affiliates |
2,623 | 2,600 | ||||||
| Real estate owned |
4,407 | 8,998 | ||||||
| Trading securities |
61 | 93 | ||||||
|
|
|
|
|
|||||
| Total other assets |
$ | 56,946 | $ | 55,723 | ||||
|
|
|
|
|
|||||
F-17
Table of Contents
GUILD MORTGAGE COMPANY
NOTES TO CONDENSED CONSOLIDATED FINANCIAL STATEMENTS
(Dollars in thousands, except as otherwise indicated)
Property and equipment consisted of the following at June 30, 2020 and December 31, 2020:
| June 30, 2020 |
December 31, 2019 |
|||||||
| Computer equipment |
$ | 22,763 | $ | 22,546 | ||||
| Furniture and equipment |
17,510 | 16,404 | ||||||
| Leasehold improvements |
5,837 | 5,395 | ||||||
| Internal — use software |
3,852 | 3,476 | ||||||
| Internal — use software in production |
2,167 | 1,155 | ||||||
|
|
|
|
|
|||||
| Property and equipment, gross |
52,129 | 48,976 | ||||||
| Accumulated depreciation |
(41,793 | ) | (39,141 | ) | ||||
|
|
|
|
|
|||||
| Property and equipment, net |
$ | 10,336 | $ | 9,835 | ||||
|
|
|
|
|
|||||
Depreciation and amortization expense for fixed assets was $3.1 million and $3.4 million for the six months ended June 30, 2020 and 2019, respectively.
5. DERIVATIVE FINANCIAL INSTRUMENTS
The Company uses forward commitments in hedging the interest rate risk exposure on its fixed and adjustable rate commitments. The Company’s derivative instruments are not designated as hedging instruments, and therefore, changes in fair value are recorded in current period earnings. Hedging gains and losses are included in loan origination fees and gain on sale, net in the Condensed Consolidated Statements of Income.
Net hedging gains were as follows for the six months ended June 30, 2020 and 2019:
| For the six months ended June 30, |
||||||||
| 2020 | 2019 | |||||||
| Hedging gains |
$ | 98,198 | $ | 8,191 | ||||
Notional and Fair Value
The notional and fair value of derivative financial instruments not designated as hedging instruments were as follows at June 30, 2020 and December 31, 2019:
| Notional Value |
Derivative Asset |
Derivative Liability |
||||||||||
| Balance at June 30, 2020 |
||||||||||||
| IRLCs |
$ | 5,099,963 | $ | 141,629 | $ | — | ||||||
| Forward commitments |
$ | 5,216,370 | $ | — | $ | 28,372 | ||||||
| Balance at December 31, 2019 |
||||||||||||
| IRLCs |
$ | 1,524,540 | $ | 19,922 | $ | — | ||||||
| Forward commitments |
$ | 1,961,733 | $ | — | $ | 4,863 | ||||||
The Company had an additional $763.3 million and $427.7 million of outstanding forward contracts and mandatory sell commitments, comprised of closed loans with equal and offsetting unpaid principal balance (“UPB”) amounts allocated to them, at June 30, 2020 and December 31, 2019, respectively. The
F-18
Table of Contents
GUILD MORTGAGE COMPANY
NOTES TO CONDENSED CONSOLIDATED FINANCIAL STATEMENTS
(Dollars in thousands, except as otherwise indicated)
Company also had $457.5 million and $376.5 million in closed hedge instruments not yet settled at June 30, 2020 and December 31, 2019, respectively. See Note 2 for fair value disclosure of the derivative instruments.
The following table presents the quantitative information about IRLCs and the fair value measurements as of June 30, 2020 and December 31, 2019:
| June 30, 2020 | December 31, 2019 | |||||||
| Unobservable Input |
Range (Weighted Average) | |||||||
| Loan funding probability (“pull-through”) |
0% - 100% (87.2%) | 0% - 100% (89.4%) | ||||||
Counterparty agreements for forward commitments contain master netting agreements. The master netting agreements contain a legal right to offset amounts due to and from the same counterparty. Derivative assets in the Condensed Consolidated Balance Sheets represent derivative contracts in a gain position net of loss positions with the same counterparty and, therefore, also represent the Company’s maximum counterparty credit risk. The Company incurred no credit losses due to nonperformance of any of its counterparties during the six months ended June 30, 2020 and 2019.
6. MORTGAGE SERVICING RIGHTS
MSRs are recognized as assets on the Condensed Consolidated Balance Sheet when loans are sold, and the associated servicing rights are retained. The Company maintains one class of MSR asset and has elected the fair value option. To determine the fair value of the servicing right when created, the Company uses a valuation model that calculates the present value of future cash flows. The valuation model incorporates assumptions that market participants would use in estimating future net servicing income, including estimates of contractual service fees, ancillary income and late fees, the cost of servicing, the discount rate, float value, the inflation rate, estimated prepayment speeds, and default rates.
The activity of mortgage servicing rights was as follows for the six months ended June 30, 2020 and 2019:
| For the six months ended June 30, |
||||||||
| 2020 | 2019 | |||||||
| Balance — beginning of year |
$ | 418,402 | $ | 511,852 | ||||
| MSRs originated |
123,095 | 47,905 | ||||||
| Changes in fair value |
||||||||
| Due to collection/realization of cash flows |
(53,730 | ) | (29,488 | ) | ||||
| Due to changes in valuation model inputs or assumptions |
(151,080 | ) | (130,734 | ) | ||||
|
|
|
|
|
|||||
| Balance — end of period |
$ | 336,687 | $ | 399,535 | ||||
|
|
|
|
|
|||||
The following table presents the quantitative information for the MSR fair value measurement as of June 30, 2020 and December 31, 2019:
| June 30, 2020 | December 31, 2019 | |||||||
| Unobservable Input |
Range (Weighted Average) | |||||||
| Discount rate |
9.2% - 15.5% (10.2%) | 9.2% - 15.5% (10.2%) | ||||||
| Prepayment rate |
9.4% - 35.6% (22.4%) | 8.9% - 30.0% (17.3%) | ||||||
F-19
Table of Contents
GUILD MORTGAGE COMPANY
NOTES TO CONDENSED CONSOLIDATED FINANCIAL STATEMENTS
(Dollars in thousands, except as otherwise indicated)
At June 30, 2020 and December 31, 2019, the MSRs had a weighted average life of approximately 4.2 and 4.9 years, respectively. See Note 2 for additional information regarding the valuation of MSRs.
Actual revenue generated from servicing activities included contractually specified servicing fees, as well as late fees and other ancillary servicing revenue, which were recorded within loan servicing and other fees as follows for the six months ended June 30, 2020 and 2019:
| For the six months ended June 30, |
||||||||
| 2020 | 2019 | |||||||
| Servicing fees from servicing portfolio |
$ | 74,178 | $ | 66,109 | ||||
| Late fees |
2,635 | 2,863 | ||||||
| Other ancillary servicing revenue |
(503 | ) | (535 | ) | ||||
|
|
|
|
|
|||||
| Total loan servicing and other fees |
$ | 76,310 | $ | 68,437 | ||||
|
|
|
|
|
|||||
At June 30, 2020 and December 31, 2019, the unpaid principal balance of mortgage loans serviced totaled $53.9 billion and $50.6 billion, respectively. Conforming conventional loans serviced by the Company are sold to Federal National Mortgage Association (“FNMA”) or Federal Home Loan Mortgage Corporation (“FHLMC”) programs on a nonrecourse basis, whereby foreclosure losses are generally the responsibility of FNMA and FHLMC and not the Company. Similarly, certain loans serviced by the Company are secured through GNMA programs, whereby the Company is insured against loss by FHA or partially guaranteed against loss by the Department of Veterans Affairs (“VA”).
The key assumptions used to estimate the fair value of MSRs are prepayment speeds and the discount rate. Increases in prepayment speeds generally have an adverse effect on the value of MSRs as the underlying loans prepay faster. In a declining interest rate environment, the fair value of MSRs generally decreases as prepayments increase and therefore, the estimated life of the MSRs and related cash flows decrease. Decreases in prepayment speeds generally have a positive effect on the value of MSRs as the underlying loans prepay less frequently. In a rising interest rate environment, the fair value of MSRs generally increases as prepayments decrease and therefore, the estimated life of the MSRs and related cash flows increase. Increases in the discount rate result in a lower MSR value and decreases in the discount rate result in a higher MSR value. MSR uncertainties are hypothetical and do not always have a direct correlation with each assumption. Changes in one assumption may result in changes to another assumption, which might magnify or counteract the uncertainties.
The following table illustrates the impact of adverse changes on the discount rate and prepayment speeds at two different data points at June 30, 2020 and December 31, 2019, respectively:
| Discount Rates | Prepayment Speeds | |||||||||||||||
| 10% Adverse Change |
20% Adverse Change |
10% Adverse Change |
20% Adverse Change |
|||||||||||||
| June 30, 2020 |
||||||||||||||||
| Mortgage servicing rights |
(15,431 | ) | (24,396 | ) | (32,069 | ) | (55,771 | ) | ||||||||
| December 31, 2019 |
||||||||||||||||
| Mortgage servicing rights |
(23,682 | ) | (35,701 | ) | (31,329 | ) | (49,031 | ) | ||||||||
F-20
Table of Contents
GUILD MORTGAGE COMPANY
NOTES TO CONDENSED CONSOLIDATED FINANCIAL STATEMENTS
(Dollars in thousands, except as otherwise indicated)
7. Mortgage Loans Held For Sale
The Company sells substantially all of its originated mortgage loans into the secondary market. The Company may retain the right to service some of these loans upon sale through ownership of servicing rights. A reconciliation of the changes in mortgage loans held for sale to the amounts presented in the Condensed Consolidated Statements of Cash Flows is as follows for the six months ended June 30, 2020 and 2019:
| For the six months ended June 30, |
||||||||
| 2020 | 2019 | |||||||
| Balance at the beginning of period |
$ | 1,504,842 | $ | 966,171 | ||||
| Origination of mortgage loans held for sale |
14,615,843 | 8,566,696 | ||||||
| Proceeds on sale of payments from mortgage loans held for sale |
(14,640,672 | ) | (8,466,299 | ) | ||||
| Gain on sale of mortgage loans excluding fair value of other financial instruments, net |
458,596 | 257,943 | ||||||
| Valuation adjustment of mortgage loans held for sale |
43,912 | 9,222 | ||||||
|
|
|
|
|
|||||
| Balance at the end of period |
$ | 1,982,521 | $ | 1,333,733 | ||||
|
|
|
|
|
|||||
At June 30, 2020, mortgage loans held for sale included unpaid principal balances of the underlying loans of $1.9 billion and had a fair value of $2.0 billion. At December 31, 2019, mortgage loans held for sale included unpaid principal balances of the underlying loans of $1.5 billion and had a fair value of $1.5 billion.
8. Investor Reserves
The Company’s estimate of the investor reserves consider the current macro-economic environment and recent repurchase trends; however, if the Company experiences a prolonged period of higher repurchase and indemnification activity, then the realized losses from loan repurchases and indemnifications may ultimately be in excess of the liability. The maximum exposure under the Company’s representations and warranties would be the outstanding principal balance and any premium received on all loans ever sold by the Company, less any loans that have already been paid in full by the mortgagee, that have defaulted without a breach of representations and warranties, that have been indemnified via settlement or make-whole, or that have been repurchased. Additionally, the Company may receive relief of certain representations and warranty obligations on loans sold to FNMA or FHLMC on or after January 1, 2013 if FNMA or FHLMC satisfactorily concludes a quality control loan file review or if the borrower meets certain acceptable payment history requirements within 12 or 36 months after the loan is sold to FNMA or FHLMC.
The activity of the investor reserves was as follows for the six months ended June 30, 2020 and 2019:
| For the six months ended June 30, |
||||||||
| 2020 | 2019 | |||||||
| Balance — beginning of year |
$ | 16,521 | $ | 14,312 | ||||
| Utilization of reserve for loan losses |
(3,688 | ) | (3,933 | ) | ||||
| Provision charged to operations |
11,053 | 3,655 | ||||||
|
|
|
|
|
|||||
| Balance — end of period |
$ | 23,886 | $ | 14,034 | ||||
|
|
|
|
|
|||||
F-21
Table of Contents
GUILD MORTGAGE COMPANY
NOTES TO CONDENSED CONSOLIDATED FINANCIAL STATEMENTS
(Dollars in thousands, except as otherwise indicated)
9. Warehouse Lines of Credit
Warehouse lines of credit consisted of the following at June 30, 2020 and December 31, 2019. Changes subsequent to June 30, 2020 have been described in the notes referenced with the below table.
| Maturity | June 30, 2020 |
December 31, 2019 |
||||||||||
| $600 million master repurchase facility agreement (1) |
October 2020 | $ | 450,965 | $ | 456,225 | |||||||
| $150 million master repurchase facility agreement (2) |
September 2020 | 118,652 | 80,965 | |||||||||
| $500 million master repurchase facility agreement (3) |
February 2021 | 429,619 | 282,579 | |||||||||
| $200 million master repurchase facility agreement (4) |
June 2021 | 141,452 | 136,699 | |||||||||
| $250 million master repurchase facility agreement (5) |
September 2020 | 140,434 | 148,149 | |||||||||
| $400 million master repurchase facility agreement (6) |
July 2021 | 282,677 | 190,221 | |||||||||
| $100 million master repurchase facility agreement (7) |
April 2021 | 93,833 | — | |||||||||
| $75 million master repurchase facility agreement (8) |
March 2024 | 34,080 | 9,569 | |||||||||
|
|
|
|
|
|||||||||
| 1,691,712 | 1,304,407 | |||||||||||
| Prepaid commitment fees |
(2,421 | ) | (1,220 | ) | ||||||||
|
|
|
|
|
|||||||||
| Net warehouse lines of credit |
$ | 1,689,291 | $ | 1,303,187 | ||||||||
|
|
|
|
|
|||||||||
| (1) | The variable interest rate is calculated using a base rate tied to LIBOR, the Eurodollar, or an alternative base rate, plus the applicable interest rate margin. Subsequent to June 30, 2020, the borrowing capacity on this facility has been increased to $800.0 million. |
| (2) | The variable interest rate is calculated using a base rate tied to LIBOR, plus the applicable interest rate margin. This line of credit requires a minimum deposit of $0.75 million. |
| (3) | The variable interest rate is calculated using a base rate tied to LIBOR, plus the applicable interest rate margin. This line of credit was amended subsequent to June 30, 2020, increasing the required minimum deposit from $2.5 million to $3.5 million and increasing the borrowing capacity to $700.0 million. |
| (4) | The variable interest rate is calculated using a base rate plus LIBOR, with a floor of 1.525%. This line of credit requires a minimum deposit of $1.1 million. Subsequent to June 30, 2020, this line of credit was amended with a maturity date of June 2021 and increased capacity up to $290.0 million. |
| (5) | The variable interest rate is calculated using a base rate tied to LIBOR, plus the applicable interest rate margin. This line of credit was amended subsequent to June 30, 2020, increasing the borrowing capacity to $299.0 million. |
| (6) | The variable interest rate is calculated using a base rate tied to LIBOR, plus the applicable interest rate margin. This borrowing capacity of this facility was increased in 2019 to $400 million. Subsequent to June 30, 2020, this line of credit was amended, extending the maturity date to July 2021. |
| (7) | The variable interest rate is calculated using a base rate tied to LIBOR, plus the applicable interest rate margin with a floor of 1.75%. Subsequent to June 30, 2020, this line of credit was amended increasing the borrowing capacity to $200.0 million. |
| (8) | The interest rate on this facility is 3.375%. This facility was opened in 2019 and is used for GNMA delinquent buyouts. Each buyout represents a separate transaction that can remain on the facility for up to 4 years. |
F-22
Table of Contents
GUILD MORTGAGE COMPANY
NOTES TO CONDENSED CONSOLIDATED FINANCIAL STATEMENTS
(Dollars in thousands, except as otherwise indicated)
The weighted average interest rate for warehouse lines of credit was 2.72% and 4.04% at June 30, 2020 and December 31, 2019, respectively. All warehouse lines of credit are collateralized by underlying mortgages and related documents. Existing balances on warehouse lines are repaid through the sale proceeds from the collateralized loans held for sale. The Company intends to renew existing warehouse lines prior to expiration. If those lines are not renewed or replaced, that could have a negative impact on the Company’s ability to continue funding new mortgage loans. The Company had cash balances of $132.0 million and $68.2 million in its warehouse buy down accounts as offsets to certain lines of credit at June 30, 2020 and December 31, 2019, respectively.
The agreements governing the Company’s warehouse lines of credit contain covenants that include certain financial requirements, including maintenance of maximum adjusted leverage ratio, minimum net worth, minimum tangible net worth, minimum current ratio, minimum liquidity, positive quarterly income and limitations on additional indebtedness, dividends, sale of assets, and decline in the mortgage loan servicing portfolio’s fair value. At June 30, 2020 and December 31, 2019, management believes the Company was in compliance with all debt covenants.
The Company has an optional short-term financing agreement between FNMA and the lender described as “As Soon As Pooled” (ASAP). The Company can elect to assign FNMA MBS trades to FNMA in advance of settlement and enter into a financing transaction and revenue related to the assignment is deferred until the final pool settlement date. The Company determines utilization based on warehouse availability and cash needs. There was no outstanding balance as of June 30, 2020 and December 31, 2019.
10. Notes Payable
Revolving notes:
In January 2014, the Company entered into an agreement for a revolving note from one of its warehouse banks, which it can draw upon as needed and has renewed on an annual basis. Borrowings on the revolving note are collateralized by the Company’s GNMA MSRs. Monthly interest on the outstanding balance is calculated using a base rate tied to the LIBOR rate plus the applicable margin, with a floor of 4.50%. The revolving note also has an unused facility fee on the average unused balance, which is also paid quarterly. The unused facility fee is waived if the average outstanding balance exceeds 70% of the available facility. In June 2020, the Company amended and restated the agreement and the revolving note was increased to a maximum committed amount of $135.0 million. The agreement also allows for the Company to increase the committed amount up to $200.0 million. The revolving note is currently scheduled to expire in June 2022. The Company has the option to convert the outstanding balance of the revolving note into a term note at its discretion. At June 30, 2020 and December 31, 2019, the Company had $85.0 million and $90.0 million, respectively, in outstanding borrowings on this credit facility.
In July 2017, the Company entered into an agreement for a revolving note of up to $25.0 million from one of its warehouse banks, which it can draw upon as needed and has renewed on an annual basis. In July 2018, the Company amended the agreement to increase the revolving note up to $50.0 million. In July 2020, the Company amended the agreement by extending the expiration date to July 2021 and increasing the revolving note up to $65.0 million. Borrowings on the revolving note are collateralized by the Company’s FHLMC MSRs. Monthly interest on the outstanding balance is calculated using a base rate tied to the LIBOR rate plus the applicable margin. The revolving note also has an unused facility fee on the average unused balance, which is also paid monthly. The unused facility fee is waived if the average outstanding balance exceeds 50% of the available combined warehouse and MSR facility. The lender has the option to convert the outstanding balance of the revolving note into a term note at its discretion. At June 30, 2020 and December 31, 2019, the Company had $40.0 million and $50.0 million, respectively, in outstanding borrowings on this credit facility.
F-23
Table of Contents
GUILD MORTGAGE COMPANY
NOTES TO CONDENSED CONSOLIDATED FINANCIAL STATEMENTS
(Dollars in thousands, except as otherwise indicated)
Term note:
In January 2014, the Company entered into a term note agreement with one of its warehouse banks collateralized by the Company’s FNMA MSRs. In September 2019, the term note was amended and restated, at which time there was an outstanding amount of $78.0 million. The outstanding amount of $78.0 million was rolled into a new term note with a commitment of $100.0 million. The note allows for the committed amount to be increased to a maximum of $150.0 million. The Company can draw on the committed amount through September 2020 and the note matures on September 30, 2022. Interest on the principal is paid monthly and is based upon a margin plus the highest of the (i) Prime Rate, (ii) Federal Funds Rate plus 0.5%, or (iii) the Eurodollar Base Rate plus 1.0%. Principal payments of 5% of the outstanding balance as of September 30, 2020 are due quarterly beginning October 1, 2020, with the remaining principal balance due upon maturity. The term note also has an unused facility fee equal to 0.375% of the average daily unadvanced amount, which is the difference between the committed amount and the amount outstanding. This fee is paid quarterly. At June 30, 2020 and December 31, 2019, the Company had an outstanding balance of $63.0 million and $78.0 million, respectively, on this facility.
The minimum calendar year payments and maturities of the Company’s term note was as follows at June 30, 2020:
| 2020 |
$ | 3,150 | ||
| 2021 |
12,600 | |||
| 2022 |
47,250 | |||
|
|
|
|||
| Total |
$ | 63,000 | ||
|
|
|
11. Income Taxes
The Company’s effective tax rates were 24.8% and 25.1% for the six months ended June 30, 2020 and 2019, respectively.
On March 27, 2020, Congress enacted the Coronavirus Aid, Relief, and Economic Security Act (the “CARES Act”) to provide certain relief as a result of the COVID-19 pandemic. The CARES Act, among other things, includes provisions relating to net operating loss carryback periods, alternative minimum tax credit refunds, and modifications to the net interest deduction limitations. The CARES Act did not have a material impact on the Company’s condensed consolidated financial statements for the six months ended June 30, 2020. The Company continues to monitor any effects on its financial statements that may result from the CARES Act.
12. Commitments And Contingencies
Commitments to Extend Credit
The Company enters into interest rate lock commitments with customers who have applied for residential mortgage loans and meet certain credit and underwriting criteria. These commitments expose the Company to market risk if interest rates change and the loan is not economically hedged or committed to an investor. The Company is also exposed to credit loss if the loan is originated and not sold to an investor and the customer does not perform. The collateral upon extension of credit typically consists of a first deed of trust in the mortgagor’s residential property. Commitments to originate loans do not necessarily reflect future cash requirements as some commitments are expected to expire without being drawn upon. Total commitments to originate loans at June 30, 2020 and December 31, 2019 were approximately $5.1 billion and $1.5 billion, respectively.
F-24
Table of Contents
GUILD MORTGAGE COMPANY
NOTES TO CONDENSED CONSOLIDATED FINANCIAL STATEMENTS
(Dollars in thousands, except as otherwise indicated)
The Company manages the interest rate price risk associated with its outstanding interest rate lock commitments and mortgage loans held for sale by entering into derivative loan instruments, such as forward loan sales commitments, mandatory delivery commitments, options and futures contracts. Total commitments related to these derivatives at June 30, 2020 and December 31, 2019, were approximately $5.2 billion and $2.0 billion, respectively.
Leases
The Company leases office space and equipment under noncancelable and cancelable operating agreements expiring at various dates through 2030. Rent expense amounted to $14.2 million and $14.9 million for the periods ended June 30, 2020 and 2019, respectively, and is included within occupancy, equipment and communication expense in the Condensed Consolidated Statements of Income.
Future minimum rental payments under the noncancelable operating leases were as follows at June 30, 2020:
| 2020 |
$ | 15,087 | ||
| 2021 |
24,543 | |||
| 2022 |
19,702 | |||
| 2023 |
15,126 | |||
| 2024 |
10,999 | |||
| Thereafter |
35,570 | |||
|
|
|
|||
| $ | 121,027 | |||
|
|
|
Legal
The Company is involved in various lawsuits arising in the ordinary course of business. While the ultimate results of these lawsuits cannot be predicted with certainty, management does not expect that these matters will have a material adverse effect on the condensed consolidated financial position or results of operations of the Company.
U.S. ex rel. Dougherty v. Guild Mortgage Company, No. 16-cv-02909 (S.D. Cal.)
On May 18, 2016, the U.S. Department of Justice (“DOJ”), on behalf of HUD (together, the “government”), filed a Complaint-in-Intervention (“Intervention Complaint”) in a pending qui tam action against the Company under the False Claims Act (“FCA”), 31 U.S.C. §§ 3729-3733. The Intervention Complaint, filed in the U.S. District Court for the District of Columbia, alleges FCA violations in connection with the underwriting and origination of certain residential mortgage loans that the Company endorsed for Federal Housing Administration (“FHA”) insurance. The Intervention Complaint alleges violations of Sections 3729 (a)(l)(A) and (B) of the FCA, breach of common law fiduciary duty, and breach of contract. The government’s claims arise from the Company’s origination of residential mortgage loans, which the Company subsequently endorsed for FHA insurance between January 1, 2006, and December 31, 2011. The Company believes the FCA and common law claims are without merit.
On August 10, 2016, the Company filed motions to dismiss the government’s Intervention Complaint and the Relator’s Third Amended Complaint. In March 2018, the Court stayed the case pending the Ninth Circuit’s determination of the appeal in Rose v Stephens Institute (No. 17-15111). On August 24, 2018, the ruling in the Rose case was issued and the Court lifted its self-imposed stay. On March 4, 2019, the government filed an amended complaint which Guild responded to on March 22, 2019 reasserting that the
F-25
Table of Contents
GUILD MORTGAGE COMPANY
NOTES TO CONDENSED CONSOLIDATED FINANCIAL STATEMENTS
(Dollars in thousands, except as otherwise indicated)
claims were without merit. Guild’s motion to dismiss was denied by the court in September 2019. Discovery began in December 2019 and will continue through December 2, 2020.
13. RELATED PARTY TRANSACTIONS
In November 2014, one of the Company’s executives retired. Other executives had the option and executed their right to purchase the retiring executive’s units in Guild Management, LLC, an indirect parent company of the Company. The purchase was funded by the Company and in return, the Company received a note receivable from Guild Management, LLC for approximately $2.5 million. The note is due in 2024 and is included within Other Assets on the Condensed Consolidated Balance Sheets.
In April 2017, Guild Mortgage Company, LLC, the Company’s parent company, sold units to Guild Management III, LLC for $2.3 million in consideration of which $1.2 million was advanced by the Company in exchange for notes receivable from its members. These members fully paid back the notes and accrued interest during 2019.
On January 1, 2019, one of the Company’s executives retired, which triggered a repurchase of the executive’s equity in Guild Management, LLC, and a payout of deferred compensation. The Company’s parent company, Guild Mortgage Company, LLC, sold 13.7038 shares of the Company to the executive in exchange for the executive’s equity in Guild Mortgage Company, LLC. The executive in turn sold the acquired Company’s shares back to the Company in exchange for a promissory note of $8.0 million, which is to be paid over 16 quarters. For the periods ended June 30, 2020 and 2019, the Company made payments of $0.5 million to the executive. In connection with the executive’s retirement, the Company made a one-time payment of $2.0 million to the executive in connection with her participation in the deferred compensation plans.
14. MINIMUM NET WORTH REQUIREMENTS
Certain secondary market investors and state regulators require the Company to maintain minimum net worth and capital requirements. To the extent that these requirements are not met, secondary market investors and/or the state regulators may utilize a range of remedies including sanctions, and/or suspension or termination of selling and servicing agreements, which may prohibit the Company from originating, securitizing or servicing these specific types of mortgage loans.
The Company is subject to the following minimum net worth, minimum capital ratio and minimum liquidity requirements established by the Federal Housing Finance Agency for Fannie Mae and Freddie Mac Seller/Servicers, and Ginnie Mae for single family issuers.
Minimum Net Worth
The minimum net worth requirement for Fannie Mae and Freddie Mac is defined as follows:
| • | Base of $2,500 plus 25 basis points of outstanding UPB for total loans serviced. |
| • | Adjusted/Tangible Net Worth comprises of total equity less goodwill, intangible assets, affiliate receivables and certain pledged assets. |
The minimum net worth requirement for Ginnie Mae is defined as follows:
| • | Base of $2,500 plus 35 basis points of the issuer’s total single-family effective outstanding obligations. |
F-26
Table of Contents
GUILD MORTGAGE COMPANY
NOTES TO CONDENSED CONSOLIDATED FINANCIAL STATEMENTS
(Dollars in thousands, except as otherwise indicated)
| • | Adjusted/Tangible Net Worth comprises of total equity less goodwill, intangible assets, affiliate receivables and certain pledged assets. Effective for fiscal year 2020, under the Ginnie Mae MBS Guide, the issuers will no longer be permitted to include deferred tax assets when computing minimum net worth requirements. |
Minimum Capital Ratio
| • | For Fannie Mae, Freddie Mac and Ginnie Mae the Company is also required to hold a ratio of Adjusted/Tangible Net Worth to Total Assets greater than 6%. |
Minimum Liquidity
The minimum liquidity requirement for Fannie Mae and Freddie Mac is defined as follows:
| • | 3.5 basis points of total Agency servicing. |
| • | Incremental 200 basis points of total nonperforming Agency, measured as 90 plus day delinquencies, servicing in excess of 6% of the total Agency servicing UPB. |
| • | Allowable assets for liquidity may include: cash and cash equivalents (unrestricted); available for sale or held for trading investment grade securities (e.g., Agency MBS, Obligations of GSEs, US Treasury Obligations); and unused/available portion of committed servicing advance lines. |
The minimum liquidity requirement for Ginnie Mae is defined as follows:
| • | Maintain liquid assets equal to the greater of $1,000 or 10 basis points of our outstanding single-family MBS. |
The most restrictive of the minimum net worth and capital requirements require the Company to maintain a minimum adjusted net worth balance of $73,118 as of December 31, 2019. As of December 31, 2019, the Company was in compliance with this requirement.
15. ADDITIONAL NON-CASH DISCLOSURES
For the periods ended June 30, 2020 and 2019, the Company had the following non-cash transactions that are not included in the Condensed Consolidated Statements of Cash Flows:
| For the six months ended June 30, |
||||||||
| 2020 | 2019 | |||||||
| GNMA inventory obtained due to delinquent status of GNMA serviced loans |
$ | 718,830 | $ | 170,914 | ||||
| GNMA inventory removed from delinquent status |
(131,812 | ) | (131,387 | ) | ||||
| GNMA real estate owned resolved through finalized foreclosure sale (conveyed to HUD) |
(7,221 | ) | (10,377 | ) | ||||
| Reduction in GNMA inventory due to loan removal from pool |
(39,511 | ) | (44,494 | ) | ||||
|
|
|
|
|
|||||
| Net increase (decrease) of GNMA payable due to receipt or resolution of GNMA inventory and GNMA real estate owned |
$ | 540,286 | $ | (15,344 | ) | |||
|
|
|
|
|
|||||
| GNMA real estate owned obtained through foreclosure sale of GNMA serviced loans |
$ | 2,929 | $ | 8,432 | ||||
|
|
|
|
|
|||||
F-27
Table of Contents
GUILD MORTGAGE COMPANY
NOTES TO CONDENSED CONSOLIDATED FINANCIAL STATEMENTS
(Dollars in thousands, except as otherwise indicated)
16. SEGMENTS
ASC 280, Segment Reporting, establishes the standards for reporting information about segments in financial statements. In applying the criteria set forth in that guidance, the Company has determined that it has two reportable segments — Loan Origination and Servicing.
Origination — The Company operates its loan origination business in approximately forty-eight states. Its licensed sales professionals and support staff cultivate deep relationships with referral partners and clients and provide a customized approach to the loan transaction whether it is a purchase or refinance. The originations segment is primarily responsible for loan origination, acquisition and sale activities.
Servicing — The Company services loans out of its corporate office in San Diego, California. Properties of the loans serviced by the Company are disbursed throughout the United States and as of December 31, 2019 the Company serviced at least one loan in forty-eight different states. The servicing segment provides a steady stream of cash flow to support the origination segment and more importantly it allows for the Company to build long standing client relationships that drive repeat and referral business back to the origination segment to recapture the client’s next mortgage transaction. The servicing segment is primarily responsible for the servicing activities of all loans in the Company’s servicing portfolio which includes, but is not limited to, collection and remittance of loan payments, managing borrower’s impound accounts for taxes and insurance, loan payoffs, loss mitigation and foreclosure activities.
The Company does not allocate assets to its reportable segments as they are not included in the review performed by the Chief Operating Decision Maker for purposes of assessing segment performance and allocating resources. The balance sheet is managed on a consolidated basis and is not used in the context of segment reporting. The Company also does not allocate certain corporate expenses, which are represented by All Other in the tables below.
The following table presents the financial performance and results by segment for the six months ended June 30, 2020:
| Origination | Servicing | Total Segments |
All Other | Total | ||||||||||||||||
| Revenue |
||||||||||||||||||||
| Loan origination fees and gain on sale of loans, net |
$ | 730,459 | $ | 2,834 | $ | 733,293 | $ | — | $ | 733,293 | ||||||||||
| Loan servicing and other fees |
— | 76,310 | 76,310 | — | 76,310 | |||||||||||||||
| Valuation adjustment of mortgage servicing rights |
— | (204,810 | ) | (204,810 | ) | — | (204,810 | ) | ||||||||||||
| Interest income (expense) |
6,410 | (2,611 | ) | 3,799 | (4,291 | ) | (492 | ) | ||||||||||||
| Other income (expense) |
25 | — | 25 | (29 | ) | (4 | ) | |||||||||||||
|
|
|
|
|
|
|
|
|
|
|
|||||||||||
| Net revenue |
736,894 | (128,277 | ) | 608,617 | (4,320 | ) | 604,297 | |||||||||||||
| Expenses |
||||||||||||||||||||
| Salaries, commissions and benefits |
350,043 | 9,217 | 359,260 | 17,638 | 376,898 | |||||||||||||||
| General and administrative |
37,147 | 6,973 | 44,120 | 4,072 | 48,192 | |||||||||||||||
| Occupancy, equipment and communication |
24,155 | 1,215 | 25,370 | 1,585 | 26,955 | |||||||||||||||
| Depreciation and amortization |
2,601 | 214 | 2,815 | 331 | 3,146 | |||||||||||||||
| Provision for foreclosure losses |
— | 1,860 | 1,860 | — | 1,860 | |||||||||||||||
| Income tax expense |
— | — | — | 36,465 | 36,465 | |||||||||||||||
|
|
|
|
|
|
|
|
|
|
|
|||||||||||
| Net income (loss) allocated to segments |
$ | 322,948 | $ | (147,756 | ) | $ | 175,192 | $ | (64,411 | ) | $ | 110,781 | ||||||||
|
|
|
|
|
|
|
|
|
|
|
|||||||||||
F-28
Table of Contents
GUILD MORTGAGE COMPANY
NOTES TO CONDENSED CONSOLIDATED FINANCIAL STATEMENTS
(Dollars in thousands, except as otherwise indicated)
The following table presents the financial performance and results by segment for the six months ended June 30, 2019:
| Origination | Servicing | Total Segments |
All Other | Total | ||||||||||||||||
| Revenue |
||||||||||||||||||||
| Loan origination fees and gain on sale of loans, net |
$ | 325,482 | $ | 2,021 | $ | 327,503 | $ | — | $ | 327,503 | ||||||||||
| Loan servicing and other fees |
— | 68,437 | 68,437 | — | 68,437 | |||||||||||||||
| Valuation adjustment of mortgage servicing rights |
— | (160,222 | ) | (160,222 | ) | — | (160,222 | ) | ||||||||||||
| Interest income (expense) |
6,804 | (7 | ) | 6,797 | (4,603 | ) | 2,194 | |||||||||||||
| Other income |
25 | — | 25 | 1,156 | 1,181 | |||||||||||||||
|
|
|
|
|
|
|
|
|
|
|
|||||||||||
| Net revenue |
332,311 | (89,771 | ) | 242,540 | (3,447 | ) | 239,093 | |||||||||||||
| Expenses |
||||||||||||||||||||
| Salaries, commissions and benefits |
230,685 | 7,443 | 238,128 | 3,188 | 241,316 | |||||||||||||||
| General and administrative |
20,278 | 5,078 | 25,356 | 3,268 | 28,624 | |||||||||||||||
| Occupancy, equipment and communication |
24,045 | 873 | 24,918 | 2,024 | 26,942 | |||||||||||||||
| Depreciation and amortization |
3,335 | 154 | 3,489 | 335 | 3,824 | |||||||||||||||
| Provision for foreclosure losses |
— | 774 | 774 | — | 774 | |||||||||||||||
| Income tax benefit |
— | — | — | (15,389 | ) | (15,389 | ) | |||||||||||||
|
|
|
|
|
|
|
|
|
|
|
|||||||||||
| Net income (loss) allocated to segments |
$ | 53,968 | $ | (104,093 | ) | $ | (50,125 | ) | $ | 3,127 | $ | (46,998 | ) | |||||||
|
|
|
|
|
|
|
|
|
|
|
|||||||||||
17. Events Subsequent to the Date of the Issuance of the Interim Condensed Consolidated Financial Statements
United States of America, ex rel. Kevin G. Dougherty, et al. v. Guild Mortgage Company
This matter is further discussed in note 12 to the interim condensed consolidated financial statements. On October 20, 2020, a settlement agreement with respect to this lawsuit was executed and, pursuant to the terms of the settlement agreement, the Company agreed to make a cash payment in the aggregate amount of $24.9 million to the U.S. Department of Justice and the U.S. Department of Housing and Urban Development, of which approximately $2.0 million is expected to be covered by the Company’s insurance. As of and for the three and nine month periods ended September 30, 2020, the Company has accrued $22.9 million associated with the settlement within accounts payable and accrued expenses and as a reduction to loan origination fees and gain on sale of loans, net.
F-29
Table of Contents
Report of Independent Registered Public Accounting Firm
To the Stockholder and Board of Directors
Guild Mortgage Company:
Opinion on the Consolidated Financial Statements
We have audited the accompanying consolidated balance sheets of Guild Mortgage Company and subsidiaries (the Company) as of December 31, 2019 and 2018, the related consolidated statements of income, changes in stockholder’s equity, and cash flows for each of the years in the two-year period ended December 31, 2019, and the related notes (collectively, the consolidated financial statements). In our opinion, the consolidated financial statements present fairly, in all material respects, the financial position of the Company as of December 31, 2019 and 2018, and the results of its operations and its cash flows for each of the years in the two-year period ended December 31, 2019, in conformity with U.S. generally accepted accounting principles.
Basis for Opinion
These consolidated financial statements are the responsibility of the Company’s management. Our responsibility is to express an opinion on these consolidated financial statements based on our audits. We are a public accounting firm registered with the Public Company Accounting Oversight Board (United States) (PCAOB) and are required to be independent with respect to the Company in accordance with the U.S. federal securities laws and the applicable rules and regulations of the Securities and Exchange Commission and the PCAOB.
We conducted our audits in accordance with the standards of the PCAOB. Those standards require that we plan and perform the audit to obtain reasonable assurance about whether the consolidated financial statements are free of material misstatement, whether due to error or fraud. Our audits included performing procedures to assess the risks of material misstatement of the consolidated financial statements, whether due to error or fraud, and performing procedures that respond to those risks. Such procedures included examining, on a test basis, evidence regarding the amounts and disclosures in the consolidated financial statements. Our audits also included evaluating the accounting principles used and significant estimates made by management, as well as evaluating the overall presentation of the consolidated financial statements. We believe that our audits provide a reasonable basis for our opinion.
/s/ KPMG LLP
We have served as the Company’s auditor since 2013.
Irvine, California
August 21, 2020
F-30
Table of Contents
GUILD MORTGAGE COMPANY
December 31, 2019 and 2018
(Dollars in thousands, except par value)
| 2019 | 2018 | |||||||
| Assets | ||||||||
| Cash and cash equivalents |
$ | 101,735 | $ | 58,505 | ||||
| Restricted cash |
5,000 | 4,250 | ||||||
| Mortgage loans held for sale |
1,504,842 | 966,171 | ||||||
| Ginnie Mae loans subject to repurchase right |
404,344 | 321,049 | ||||||
| Accounts and interest receivable |
34,611 | 27,940 | ||||||
| Derivative asset |
19,922 | 12,541 | ||||||
| Mortgage servicing rights, net |
418,402 | 511,852 | ||||||
| Goodwill |
62,834 | 60,699 | ||||||
| Other assets |
55,723 | 75,244 | ||||||
|
|
|
|
|
|||||
| Total assets |
$ | 2,607,413 | $ | 2,038,251 | ||||
|
|
|
|
|
|||||
| Liabilities and Stockholder’s Equity | ||||||||
| Warehouse lines of credit |
$ | 1,303,187 | $ | 839,734 | ||||
| Notes payable |
218,000 | 160,000 | ||||||
| Ginnie Mae loans subject to repurchase right |
412,490 | 333,018 | ||||||
| Accounts payable and accrued expenses |
35,338 | 27,951 | ||||||
| Accrued compensation and benefits |
45,297 | 29,951 | ||||||
| Investor reserves |
16,521 | 14,312 | ||||||
| Due to parent company |
12,427 | 13,952 | ||||||
| Contingent liabilities due to acquisitions |
8,073 | 5,106 | ||||||
| Derivative liability |
4,863 | 10,157 | ||||||
| Note due to related party |
6,606 | — | ||||||
| Deferred compensation plan |
52,302 | 50,875 | ||||||
| Deferred tax liability |
86,278 | 112,254 | ||||||
|
|
|
|
|
|||||
| Total liabilities |
2,201,382 | 1,597,310 | ||||||
|
|
|
|
|
|||||
| Commitments and contingencies (Note 15) |
||||||||
| Stockholder’s Equity |
||||||||
| Common stock, $100 par value; 2,000 shares authorized; 928 and 942 shares issued and outstanding at December 31, 2019 and 2018, respectively |
93 | 94 | ||||||
| Additional paid-in capital |
21,992 | 22,317 | ||||||
| Retained earnings |
383,946 | 418,530 | ||||||
|
|
|
|
|
|||||
| Total stockholder’s equity |
406,031 | 440,941 | ||||||
|
|
|
|
|
|||||
| Total liabilities and stockholder’s equity |
$ | 2,607,413 | $ | 2,038,251 | ||||
|
|
|
|
|
|||||
See accompanying notes to consolidated financial statements
F-31
Table of Contents
GUILD MORTGAGE COMPANY
CONSOLIDATED STATEMENTS OF INCOME
For the years ended December 31, 2019 and 2018
(Dollars in thousands)
| 2019 | 2018 | |||||||
| Revenue |
||||||||
| Loan origination fees and gain on sale of loans, net |
$ | 820,814 | $ | 616,608 | ||||
| Loan servicing and other fees |
142,705 | 123,681 | ||||||
| Valuation adjustment of mortgage servicing rights |
(255,219 | ) | (17,050 | ) | ||||
| Interest income |
58,787 | 43,676 | ||||||
| Interest expense |
(55,391 | ) | (44,002 | ) | ||||
| Other income |
1,193 | 6 | ||||||
|
|
|
|
|
|||||
| Net revenue |
712,889 | 722,919 | ||||||
|
|
|
|
|
|||||
| Expenses |
||||||||
| Salaries, commissions and benefits |
578,170 | 510,253 | ||||||
| General and administrative |
63,983 | 50,976 | ||||||
| Occupancy, equipment and communication |
53,678 | 52,483 | ||||||
| Depreciation and amortization |
7,333 | 7,180 | ||||||
| Provision for foreclosure losses |
3,895 | 4,434 | ||||||
|
|
|
|
|
|||||
| Total expenses |
707,059 | 625,326 | ||||||
|
|
|
|
|
|||||
| Income before income tax expense |
5,830 | 97,593 | ||||||
| Income tax expense |
253 | 24,260 | ||||||
|
|
|
|
|
|||||
| Net income |
$ | 5,577 | $ | 73,333 | ||||
|
|
|
|
|
|||||
See accompanying notes to consolidated financial statements
F-32
Table of Contents
GUILD MORTGAGE COMPANY
CONSOLIDATED STATEMENTS OF CHANGES IN STOCKHOLDER’S EQUITY
For the years ended December 31, 2019 and 2018
(Dollars in thousands, except per share data)
| Shares | Amount | Additional Paid-In Capital |
Retained Earnings |
Total | ||||||||||||||||
| Balance at 12/31/2017 |
942 | $ | 94 | $ | 22,317 | $ | 375,197 | $ | 397,608 | |||||||||||
| Common stock dividends ($31,847 per share) |
— | — | — | (30,000 | ) | (30,000 | ) | |||||||||||||
| Net income |
— | — | — | 73,333 | 73,333 | |||||||||||||||
|
|
|
|
|
|
|
|
|
|
|
|||||||||||
| Balance at 12/31/2018 |
942 | 94 | 22,317 | 418,530 | 440,941 | |||||||||||||||
|
|
|
|
|
|
|
|
|
|
|
|||||||||||
| Common stock dividends ($35,010 per share) |
— | — | — | (32,500 | ) | (32,500 | ) | |||||||||||||
| Stock repurchase |
(14 | ) | (1 | ) | (325 | ) | (7,661 | ) | (7,987 | ) | ||||||||||
| Net income |
— | — | — | 5,577 | 5,577 | |||||||||||||||
|
|
|
|
|
|
|
|
|
|
|
|||||||||||
| Balance at 12/31/2019 |
928 | 93 | 21,992 | 383,946 | 406,031 | |||||||||||||||
|
|
|
|
|
|
|
|
|
|
|
|||||||||||
See accompanying notes to consolidated financial statements
F-33
Table of Contents
GUILD MORTGAGE COMPANY
CONSOLIDATED STATEMENTS OF CASH FLOWS
For the years ended December 31, 2019 and 2018
(Dollars in thousands)
| 2019 | 2018 | |||||||
| Cash flows from operating activities |
||||||||
| Net income |
$ | 5,577 | $ | 73,333 | ||||
| Adjustments to reconcile net income to net cash used in operating activities: |
||||||||
| Depreciation and amortization of fixed assets |
7,333 | 7,180 | ||||||
| Valuation adjustment of mortgage servicing rights |
255,219 | 17,050 | ||||||
| Valuation adjustment of mortgage loans held for sale |
(5,061 | ) | 5,504 | |||||
| Valuation adjustment of derivatives |
(12,675 | ) | 8,233 | |||||
| Provision for investor losses |
10,203 | 6,486 | ||||||
| Provision for foreclosure losses |
3,895 | 4,434 | ||||||
| Changes in estimated fair value of contingent liabilities due to acquisitions |
7,920 | (2,642 | ) | |||||
| Gain on sale of mortgage loans excluding fair value of other financial instruments, net |
(638,902 | ) | (493,578 | ) | ||||
| Deferred income taxes |
(25,976 | ) | 24,716 | |||||
| Other |
281 | 350 | ||||||
| Investor reserves |
(7,994 | ) | (6,909 | ) | ||||
| Foreclosure loss reserve |
(3,910 | ) | (2,755 | ) | ||||
| Changes in operating assets and liabilities: |
||||||||
| Origination of mortgage loans held for sale |
(21,749,675 | ) | (16,466,876 | ) | ||||
| Proceeds on sale of and payments from mortgage loans held for sale |
21,854,967 | 16,947,871 | ||||||
| Accounts and interest receivable |
(6,656 | ) | (9,425 | ) | ||||
| Other assets |
11,791 | (8,397 | ) | |||||
| Mortgage servicing rights |
(154,201 | ) | (130,863 | ) | ||||
| Accounts payable and accrued expenses |
7,533 | 2,029 | ||||||
| Accrued compensation and benefits |
15,307 | (7,028 | ) | |||||
| Contingent liability payments |
(1,437 | ) | (3,866 | ) | ||||
| Deferred compensation plan liability |
(785 | ) | 6,028 | |||||
| Proceeds from real estate owned conveyed to HUD |
5,140 | 2,781 | ||||||
| Purchase and advances of real estate owned |
(2,601 | ) | (5,421 | ) | ||||
|
|
|
|
|
|||||
| Net cash used in operating activities |
(424,707 | ) | (31,765 | ) | ||||
|
|
|
|
|
|||||
| Cash flows from investing activities |
||||||||
| Proceeds from the sale of property & equipment |
71 | 44 | ||||||
| Purchase of property and equipment |
(3,705 | ) | (6,687 | ) | ||||
| Payment (made) received on behalf of affiliate |
(1,037 | ) | 1,185 | |||||
| Acquisitions |
(8,817 | ) | (20,180 | ) | ||||
|
|
|
|
|
|||||
| Net cash used in investing activities |
(13,488 | ) | (25,638 | ) | ||||
|
|
|
|
|
|||||
| Cash flows from financing activities |
||||||||
| Borrowings on warehouse lines of credit |
21,195,017 | 15,991,417 | ||||||
| Repayments on warehouse lines of credit |
(20,731,564 | ) | (15,987,677 | ) | ||||
| Borrowings on MSR notes payable |
87,250 | 90,000 | ||||||
| Repayments on MSR notes payable |
(29,250 | ) | (5,000 | ) | ||||
| Contingent liability payments |
(5,251 | ) | (2,267 | ) | ||||
| Net change in notes payable |
6,460 | 763 | ||||||
| Repurchase of stock |
(7,987 | ) | — | |||||
| Dividends paid |
(32,500 | ) | (40,000 | ) | ||||
|
|
|
|
|
|||||
| Net cash provided by financing activities |
482,175 | 47,236 | ||||||
|
|
|
|
|
|||||
| Increase (decrease) in cash, cash equivalents and restricted cash |
43,980 | (10,167 | ) | |||||
| Cash, cash equivalents and restricted cash, beginning of year |
62,755 | 72,922 | ||||||
|
|
|
|
|
|||||
| Cash, cash equivalents and restricted cash, end of year |
$ | 106,735 | $ | 62,755 | ||||
|
|
|
|
|
|||||
| Supplemental information |
||||||||
| Cash paid for interest (net of rebates of $8.9 million for the year ended December 31, 2019; no interest rebates for the year ended December 31, 2018.) |
$ | 40,248 | $ | 35,922 | ||||
|
|
|
|
|
|||||
| Cash paid for taxes (net of tax refunds of $7.2 and $0.1 million for the years ended December 31, 2019 and 2018, respectively) |
$ | 13,731 | $ | 531 | ||||
|
|
|
|
|
|||||
| Net assets acquired due to acquisition |
$ | 10,552 | $ | 23,139 | ||||
|
|
|
|
|
|||||
| Cash and cash equivalents |
$ | 101,735 | $ | 58,505 | ||||
| Restricted cash |
5,000 | 4,250 | ||||||
|
|
|
|
|
|||||
| Total cash, cash equivalents and restricted cash shown in the consolidated statements of cash flows |
$ | 106,735 | $ | 62,755 | ||||
|
|
|
|
|
|||||
| Non-Cash disclosures (See Note 18) |
||||||||
See accompanying notes to consolidated financial statements.
F-34
Table of Contents
GUILD MORTGAGE COMPANY
NOTES TO CONSOLIDATED FINANCIAL STATEMENTS
(Dollars in thousands, except as otherwise indicated)
1. Business, Basis of Presentation, and Accounting Policies
Organization
Guild Mortgage Company (the “Company” or “Guild”), a California corporation, is a wholly owned subsidiary of Guild Mortgage Company, LLC (“GMC LLC”), a privately owned California limited liability company.
The accompanying consolidated financial statements have been prepared in connection with the proposed initial public offering (the “Offering”) of Class A common stock of Guild Holdings Company, a Delaware corporation (“Holdings”). Prior to the completion of the Offering, GMC LLC will contribute 100% of the shares of the Company to Holdings and the Company will be converted to a California limited liability company. As a result, Holdings is expected to become the sole member of the Company prior to the completion of the Offering.
The Company originates, sells, and services residential mortgage loans. The Company operates approximately two hundred branches with licenses in forty-eight states. The Company’s residential mortgage originations are generated in forty-seven states from two channels of business; retail and correspondent. For the year ended December 31, 2019 the channel production was as follows: retail 96.5% and correspondent 3.5%. For the year ended December 31, 2018, the channel production was as follows: retail 95.9%, and correspondent 4.1%.
The Company is certified with the United States Department of Housing and Urban Development (“HUD”) and the Department of Veterans Affairs (“VA”) and operates as a Federal Housing Association (“FHA”) non-supervised lender. In addition, the Company is an approved issuer with Government National Mortgage Association (“GNMA”), as well as an approved seller and servicer with Federal National Mortgage Association (“FNMA”), the Federal Home Loan Mortgage Corporation (“FHLMC”) and the United States Department of Agriculture Rural Development (“USDA”).
Properties securing the mortgage loans in the Company’s servicing portfolio are geographically dispersed throughout the United States; however, at December 31, 2019, approximately 16.0% of such properties were located in California, 12.1% were located in Washington, and 9.7% were located in Texas. At December 31, 2018, approximately 15.8% of such properties were located in California, 12.8% were located in Washington, and 9.8% were located in Texas. Similarly, loan production in California, Washington and Oregon represented 16.9%, 16.5%, and 9.2%, respectively, of the Company’s total loan production in 2019. For the year ended December 31, 2018, Washington, California and Oregon represented 16.3%, 14.5%, and 10.2%, respectively, of the Company’s total loan production.
Principles of Consolidation
The Company has four wholly owned subsidiaries; Guild Administration Corp., Mission Village Insurance Agency, Guild Insurance, LLC and Guild Financial Express, Inc. The activities of the subsidiaries are related to the Company’s mortgage banking operations. All intercompany accounts and transactions have been eliminated in consolidation.
Management Estimates
The preparation of financial statements in conformity with accounting principles generally accepted in the United States of America (“GAAP”) requires management to make estimates and assumptions that affect the reported amounts of assets and liabilities and disclosure of contingent assets and liabilities at the date of the financial statements and the reported amounts of revenues and expenses during the reporting period. Actual results could materially differ from those estimates.
F-35
Table of Contents
GUILD MORTGAGE COMPANY
NOTES TO CONSOLIDATED FINANCIAL STATEMENTS
(Dollars in thousands, except as otherwise indicated)
Revenue Recognition
Loan origination fees and gain on sale of loans, net — loan origination fees and gain on sale of loans, net includes all components related to the origination and sale of mortgage loans, including (1) net gain on sale of loans, which represents the premium the Company receives in excess of the loan principal amount and certain fees charged by investors upon sale of loans into the secondary market, (2) loan origination fees (credits), points and certain costs, (3) provision for or benefit from investor reserves, (4) the change in fair value of interest rate locks and loans held for sale, (5) the gain or loss on forward commitments hedging loans held for sale and interest rate lock commitments (“IRLCs”), and (6) the fair value of originated mortgage servicing rights (“MSRs”). An estimate of the gain on sale of loans, net is recognized at the time an IRLC is issued, net of a pull-through factor. Subsequent changes in the fair value of IRLCs and mortgage loans held for sale are recognized in current period earnings. When the mortgage loan is sold into the secondary market, any difference between the proceeds received and the current fair value of the loan is recognized in current period earnings. Included in gain on sale of loans, net is the fair value of originated MSRs, which represents the estimated fair value of MSRs related to loans which we have sold and retained the right to service. Refer to Note 1 sections; Mortgage Loans Held for Sale, Mortgage Servicing Rights and Derivative Instruments, for more information related to fair value measurements of mortgage loans held for sale, the gain/(loss) on changes in the fair value of MSRs and the gain/(loss) on changes in the fair value of IRLCs, respectively. At December 31, 2019 and 2018, loan origination fees and gain on sale of loans were net of direct expenses of $175,338 and $136,913, respectively.
Loan servicing and other fees — Loan servicing fees represent fees earned for servicing loans for various investors. The servicing fees are based on a contractual percentage of the outstanding principal balance and recognized into revenue as the related mortgage payments are received. Loan servicing expenses are charged to operations as incurred.
Valuation adjustment of mortgage servicing rights — In accordance with Accounting Standards Codification (“ASC”) 860-50, the Company records MSRs as an asset, at fair value. The change in fair value is recorded within the Consolidated Statements of Income on a monthly basis. Refer to Note 1, Mortgage Servicing Rights, for information related to the gain/(loss) on changes in the fair value of MSRs.
Interest income — interest income includes interest earned on mortgage loans held for sale
Interest expense — interest expense includes interest paid to the Company’s loan funding facilities and MSR facilities.
Cash, Cash Equivalents and Restricted Cash
For cash flow purposes, the Company considers cash and temporary investments with original maturities of three months or less, to be cash and cash equivalents. The Company typically maintains cash in financial institutions in excess of Federal Deposit Insurance Corporation limits. The Company evaluates the creditworthiness of these financial institutions in determining the risk associated with these cash balances. The Company maintains cash balances that are restricted under the terms of its warehouse lines of credit.
F-36
Table of Contents
GUILD MORTGAGE COMPANY
NOTES TO CONSOLIDATED FINANCIAL STATEMENTS
(Dollars in thousands, except as otherwise indicated)
The following table summarizes the Company’s cash, cash equivalents and restricted cash at December 31, 2019 and 2018:
| 2019 | 2018 | |||||||
| Cash and cash equivalents |
$ | 101,735 | $ | 58,505 | ||||
| Restricted cash |
5,000 | 4,250 | ||||||
|
|
|
|
|
|||||
| Total cash, cash equivalents and restricted cash shown in the Consolidated Statements of Cash Flows |
$ | 106,735 | $ | 62,755 | ||||
|
|
|
|
|
|||||
Mortgage Loans Held for Sale
The Company measures newly originated prime residential Mortgage Loans Held for Sale (“MLHS”) at fair value in accordance with ASC 825, Financial Instruments. Included in mortgage loans held for sale are loans originated as held for sale that are expected to be sold into the secondary market and loans that have been previously sold and repurchased from investors that management intends to resell into the secondary market, which are recorded at fair value.
The Company estimates fair value by evaluating a variety of market indicators, including recent trades and outstanding commitments, calculated on an individual loan basis and aggregated (see Note 2 — Fair Value Measurements). Changes in the fair value of mortgage loans are recognized in current period income and are included in loan origination fees and gain on sale of loans, net. Fair value for mortgage loans covered by investor commitments is based on commitment prices. Fair value for uncommitted loans is based on current delivery prices. The Company is not permitted to defer the loan origination fees, net of direct loan origination costs associated with these loans.
Loans are considered sold when the Company surrenders control over the financial assets. Control is considered to have been surrendered when the transferred assets have been isolated from the Company, beyond the reach of the Company and its creditors; the purchaser obtains the right (free of conditions that constrain it from taking advantage of that right) to pledge or exchange the transferred assets; and the Company does not maintain effective control over the transferred assets through an agreement that both entitles and obligates the Company to repurchase or redeem the transferred assets before their maturity. The Company typically considers the above criteria to have been met upon acceptance and receipt of sales proceeds from the purchaser.
Ginnie Mae Loans Subject to Repurchase Right
In accordance with ASC 860-50, Transfers and Servicing — Servicing Assets and Liabilities (“ASC 860-50”), certain loans, as defined by the servicer guidelines, serviced by the Company on behalf of GNMA are recognized as an asset, and carried at the unpaid principal balance (“UPB”) of the loans. The Company has a right to repurchase any loans serviced on behalf of GNMA that are three or more consecutive payments delinquent (“GNMA Loan Inventory”). The Company recognizes a corresponding liability (“GNMA Loan Payable”) which is recorded at the unpaid principal balance, for loans in which the Company has not exercised the right to repurchase the loans. If the loan goes through foreclosure and is an FHA loan, HUD acts as the insurer for GNMA and reimburses the servicer for the UPB plus allowable interest and foreclosure fees. The Company reserves for unreimbursed interest and fees as part of the general foreclosure reserve. If the loan goes through foreclosure and is a Veterans’ Administration (“VA”) loan, the VA acts as the insurer and reimburses the Company based on the net value of the underlying property. At the amount determined by the VA, the Company accounts for any loss on VA loans in its
F-37
Table of Contents
GUILD MORTGAGE COMPANY
NOTES TO CONSOLIDATED FINANCIAL STATEMENTS
(Dollars in thousands, except as otherwise indicated)
foreclosure loss reserve to a certain threshold with any excess charged to its investor reserves. If a foreclosure sale has been held on an FHA loan, the deed is transferred to the Company and the loan becomes a GNMA real estate owned (“REO”). These are foreclosed real estate properties securing GNMA loans. Both principal and interest for government insured/guaranteed loans secured by the foreclosed real estate properties are collectible because the loans are insured by the FHA or guaranteed by the VA. The GNMA Loan Inventory and real estate owned is equal, and offsetting, to the GNMA Loan Payable.
Mortgage Servicing Rights
Mortgage servicing rights are recognized as assets on the Consolidated Balance Sheet when loans are sold, and the associated servicing rights are retained. The Company maintains one class of MSR asset and has elected the fair value option. To determine the fair value of the servicing right when created, the Company uses a valuation model that calculates the present value of future cash flows. The valuation model incorporates assumptions that market participants would use in estimating future net servicing income, including estimates of contractual service fees, ancillary income and late fees, the cost of servicing, the discount rate, float value, the inflation rate, estimated prepayment speeds, and default rates.
Derivative Instruments
The Company enters into IRLCs, forward commitments to sell mortgage loans and to be announced trades which are considered derivative financial instruments. These items are accounted for as free-standing derivatives and are included in the Consolidated Balance Sheets at fair value. The Company treats all of its derivative instruments as economic hedges; therefore, none of its derivative instruments qualify for designation as accounting hedges.
The Company enters into IRLCs to originate residential mortgage loans at specified interest rates and within a specified period of time, with customers who have applied for a loan and meet certain credit and underwriting criteria. IRLCs on mortgage loans in process that have not closed, but are intended to be sold, are considered to be derivatives and changes in fair value are recorded in the Consolidated Statements of Income as part of Loan Origination Fees and Gain on Sale of Loans, net. Fair value is based upon changes in the fair value of the underlying mortgages, estimated to be realizable upon sale into the secondary market, net of estimated commission expenses. Fair value estimates also consider loan commitments not expected to be exercised by customers for unforeseen reasons, commonly referred to as fallout.
IRLCs and uncommitted mortgage loans held for sale expose the Company to the risk that the value of the mortgage loans held and mortgage loans underlying the commitments may decline due to increases in mortgage interest rates during the life of the commitments. To protect against this risk the Company enters into derivative loan instruments such as forward loan sales commitments, mandatory delivery commitments, options and futures contracts. Management expects the changes in the fair value of these derivatives to have a negative correlation to the changes in fair value of the derivative loan commitments and loans held for sale, thereby reducing earnings volatility. The changes in fair value are recorded in the Consolidated Statements of Income as part of Loan Origination Fees and Gain on Sale of Loans, net. The Company considers various factors and strategies in determining the portion of the mortgage pipeline and loans held for sale it wants to economically hedge.
Forward commitments include To-Be-Announced (“TBA”) mortgage-backed securities that have been aggregated at the counterparty level for presentation and disclosure purposes. Counterparty agreements contain a legal right to offset amounts due to and from the same counterparty under legally enforceable master netting agreements to settle with the same counterparty, on a net basis, as well as the right to obtain cash collateral. Forward commitments also include commitments to sell loans to counterparties and to purchase loans from counterparties at determined prices. See Notes 2 and 6 for additional information.
F-38
Table of Contents
GUILD MORTGAGE COMPANY
NOTES TO CONSOLIDATED FINANCIAL STATEMENTS
(Dollars in thousands, except as otherwise indicated)
Property and Equipment
Property and equipment is recorded at cost and depreciated using the straight-line method over the estimated useful life of the asset, usually three years. Leasehold improvements are amortized using the straight-line method over the shorter of the term of the related lease or the estimated useful life.
The Company recognizes internal-use software within property and equipment which consists of both internal and external costs incurred in the development, testing and implementation directly related to the new software. The internal-use software is amortized over a three-year period and begins amortization upon the “go-live” date of the software. The Company determines the “go-live” date as the date in which the software is readily available to be used companywide.
Acquisitions
When making an acquisition, the Company recognizes separately from goodwill the assets acquired and the liabilities assumed at their acquisition date fair values under ASC 805, Business Combinations. Goodwill as of the acquisition date is measured as the excess of consideration transferred and the net of the acquisition date fair values of the assets acquired and the liabilities assumed. The Company uses its best estimates and assumptions to accurately value assets acquired and liabilities assumed at the acquisition date. The Company’s estimates are inherently uncertain and actual results may differ from expectations. The Company may record measurement period adjustments during the measurement period (one year from the acquisition date) that result from obtaining additional information about the facts and circumstances that existed as of the acquisition date. If this additional information had been known, it would have affected the accounting for the business combination as of the acquisition date.
Accounting for business combinations requires the Company’s management to make estimates and assumptions, especially at the acquisition date with respect to mortgage servicing rights and contingent considerations. Although the Company believes the assumptions and estimates it has made in the past have been reasonable and appropriate, they are based in part on historical experience and information obtained from the management of the acquired companies and are inherently uncertain.
Goodwill
The Company records goodwill in connection with an acquisition when the total purchase price of the acquisition exceeds the fair value of the assets and liabilities assumed by Guild as part of the transaction (see Note 9). Goodwill is not amortized but is evaluated for potential impairment on an annual basis, or when events or circumstances indicate a potential impairment, at the reporting unit level. A reporting unit is a business segment or one level below a business segment. The Company performs a Step 0 analysis by reviewing certain qualitative and quantitative factors to determine if any indicators of impairment arise. If there are no impairment indicators from the Step 0 analysis the Company determines that there is no impairment and no further evaluation is necessary.
If impairment indicators arise, the Company will perform the test in accordance with ASC 350-20, by first assessing qualitative factors to determine if it is more-likely-than-not that goodwill might be impaired. Then, if necessary, a two-step goodwill impairment test is performed to determine if any impairment exists and how it should be allocated.
In performing the goodwill impairment test, the Company first assesses qualitative factors to determine whether it is more likely than not that the fair value of a reporting unit is less than its carrying value. Qualitative factors include, among other things, macroeconomic conditions, industry and market considerations, financial performance of the respective reporting unit and other relevant entity- and reporting-unit specific considerations.
F-39
Table of Contents
GUILD MORTGAGE COMPANY
NOTES TO CONSOLIDATED FINANCIAL STATEMENTS
(Dollars in thousands, except as otherwise indicated)
If the Company concludes it is more likely than not that the fair value of a reporting unit is less than its carrying value, a quantitative assessment is performed. If the fair value of the reporting unit exceeds its carrying value, goodwill of the reporting unit is considered not impaired; however, if the carrying value of the reporting unit exceeds its fair value, an additional step is performed to measure potential impairment.
This step involves calculating an implied fair value of goodwill which is the excess of the fair value of the reporting unit, as determined in the first step, over the aggregate fair values of the assets, liabilities and identifiable intangibles as if the reporting unit was being acquired in a business combination. If the implied fair value of goodwill exceeds the goodwill assigned to the reporting unit, there is no impairment. If the goodwill assigned to a reporting unit exceeds the implied fair value of goodwill, an impairment charge is recorded for the excess. An impairment loss recognized cannot exceed the amount of goodwill assigned to a reporting unit. An impairment loss establishes a new basis in the goodwill, and subsequent reversals of goodwill impairment losses are not permitted under applicable accounting guidance.
No goodwill impairment was recognized during the years ended December 31, 2019 and 2018.
Contingent Liabilities due to Acquisitions
The Company may be required to pay future consideration to the former shareholders of acquired companies, depending upon the terms of the applicable purchase agreement, which is contingent upon the achievement of certain financial and operating targets. The Company determines the fair value for its contingent consideration obligations using an income approach whereby the Company forecasts the cash outflows related to the earn-outs, which are based on a percentage of net income specified in the purchase agreements. The Company then discounts these expected payment amounts to calculate the fair value as of the valuation date. The Company’s management evaluates the underlying projections used in determining fair value each period and makes updates to these underlying projections when there have been significant changes in management’s expectations of the future business performance.
The principal significant unobservable input used in the valuations of the Company’s contingent consideration obligations is a risk-adjusted discount rate. Whereas management’s underlying projections adjust for market penetration and other economic expectations, the discount rate is risk-adjusted for key factors such as uncertainty in the mortgage banking industry due to its reliance on external influences (interest rates, regulatory changes, etc.), upfront payments, and credit risk. An increase in the discount rate will result in a decrease in the fair value of contingent consideration. Conversely, a decrease in the discount rate will result in an increase in the fair value of contingent consideration.
At each reporting date, or whenever there are significant changes in underlying key assumptions, a review of these assumptions is performed and the contingent consideration liability is updated to its estimated fair value. If there are no significant changes in the assumptions, the quarterly determination of the fair value of contingent consideration reflects the implied interest for the passage of time. Changes in the estimated fair value of the contingent consideration obligations may result from changes in the terms of the contingent payments, changes in discount periods and rates and changes in probability assumptions with respect to the timing and likelihood of achieving the certain financial targets. Actual progress toward achieving the financial targets for the remaining measurement periods may be different than the Company’s expectations of future performance. The change in the estimated fair value of contingent consideration has been classified as other expenses in the Consolidated Statements of Income.
Real Estate Owned
There are two types of REO properties held by the Company. The first is considered a traditional REO where the Company owns, markets, and sells the property. At the time of foreclosure, other real estate
F-40
Table of Contents
GUILD MORTGAGE COMPANY
NOTES TO CONSOLIDATED FINANCIAL STATEMENTS
(Dollars in thousands, except as otherwise indicated)
owned is recorded at the asset’s fair value less selling costs, which becomes the property’s new basis. After foreclosure, these assets are carried at the lower of their new cost basis or fair value less selling costs. Costs incurred in maintaining foreclosed real estate and subsequent write-downs to reflect declines in the fair value of the property are expensed as incurred. At December 31, 2019 and 2018, the Company had $0.9 million and $3.3 million, respectively, of traditional REOs.
The second type is foreclosed real estate securing GNMA loans in process of conveyance to HUD but insured by FHA, where the Company is the controller of the deed for a period of time. For GNMA loans, the property becomes REO if not sold to a third party at its foreclosure sale. Both principal and debenture rate interest for government insured loans secured by the foreclosed real estate are collectible because the loans are insured by FHA. This is valued at the UPB of the loan, which is considered to be fair value, as HUD reimburses the Company for the UPB plus debenture rate interest and fees. The Company reserves for unreimbursed interest in excess of the debenture rate and fees as part of the foreclosure loss reserve. The total REO property that will be conveyed to HUD was valued at $8.1 million and $12.0 million at December 31, 2019 and 2018, respectively.
Investor Reserves
The Company has exposure to potential mortgage loan repurchases and indemnifications in its capacity as a loan originator and servicer. The estimation of the liability for probable losses related to the repurchase and indemnification obligation considers an estimate of probable future repurchase or indemnification obligations from breaches of representations and warranties. The liability related to specific non-performing loans is based on a loan-level analysis considering the current collateral value, estimated sales proceeds and selling costs. The liability related to probable future repurchase or indemnification obligations is segregated by year of origination and considers the amount of unresolved repurchase and indemnification requests, as well as an estimate of future repurchase demands. Future repurchase demands are estimated based upon recent and historical repurchase and indemnification experience, as well as the success rate in appealing repurchase requests and an estimated loss severity, based on current loss rates for similar loans. The Company also has exposure to early payment defaults (“EPD”) and/or early payoff fees (“EPO”). When the Company sells a loan to an investor and the loan either pays off or goes into default within a certain timeframe, the Company could be exposed to EPD and/or EPO fees in accordance with each investor’s contract. The Company reserves for these fees by estimating early payment defaults and fees based on prior loan activity and current loan origination volume.
Foreclosure Loss Reserve and Provision for Foreclosure Losses
The Company has exposure for losses associated with government loans in foreclosure related to nonrefundable interest and foreclosure servicing costs. The Company maintains a reserve for government loans currently in foreclosure based on historical loss experience. The Company also accrues for any additional known losses above the current loss per loan; for example, losses due to servicer delays.
Advertising
Advertising is expensed as incurred and amounted to $11.8 million and $11.3 million for the years ended December 31, 2019 and 2018, respectively, and is included within general and administrative expenses on the Consolidated Statements of Income.
Income Taxes
Income taxes are accounted for under the asset and liability method. Deferred tax assets and liabilities are recognized for the future tax consequences attributable to differences between the financial statement
F-41
Table of Contents
GUILD MORTGAGE COMPANY
NOTES TO CONSOLIDATED FINANCIAL STATEMENTS
(Dollars in thousands, except as otherwise indicated)
carrying amounts of existing assets and liabilities and their respective tax bases and operating loss and tax credit carryforwards. Deferred tax assets and liabilities are measured using enacted tax rates expected to apply to taxable income in the years in which those temporary differences are expected to be recovered or settled. The effect on deferred tax assets and liabilities of a change in tax rates is recognized in income in the period that includes the enactment date. The Company recognizes the effect of income tax positions only if those positions are more-likely than-not to be sustained. Recognized income tax positions are measured at the largest amount that is greater than 50% likely of being realized. Changes in recognition or measurement are reflected in the period in which the change in judgment occurs. The Company records interest related to unrecognized tax benefits in interest expense and records penalties as a component of income taxes.
Escrow and Fiduciary Funds
As a loan servicer, the Company maintains segregated bank accounts in trust for investors and escrow balances for mortgagors, which are excluded from the Company’s Consolidated Balance Sheet. These accounts totaled $958.3 million and $540.6 million at December 31, 2019 and 2018, respectively.
Risks and Uncertainties
In the normal course of business, companies in the mortgage banking industry encounter certain economic, liquidity, and regulatory risks.
Economic risk includes interest rate risk and credit risk.
Interest rate risk
The Company’s mortgage loans held for sale, commitments to originate loans, and mortgage servicing rights are subject to interest rate risk. For mortgage loans held for sale and commitments to originate loans, to the extent that a rising interest rate environment exists, the Company may experience a decrease in loan production and decreases in value, which may negatively impact the Company’s operations. To mitigate this risk the Company uses hedging strategies designed to ensure any fluctuations in rates would not have a material impact on the Company’s financial position. For the Company’s mortgage servicing rights, to the extent that a declining interest rate environment exists, the Company may experience decreases in the fair value of the portfolio, which may negatively impact the Company’s financial position. For the year ended December 31, 2019, the Company experienced a material decline in the valuation of its MSR portfolio due to a significant decline in interest rates. Since the Company also has a large origination platform the Company was able to mitigate this risk by recapturing a significant portion of the runoff through refinances. For the year ended December 31, 2018, the Company did not experience any material loss due to interest rate risk.
Credit risk
Credit risk is the risk of default that may result from borrowers’ inability or unwillingness to make contractually required payments during the period in which loans are being held for sale. The Company considers credit risk associated with these loans to be insignificant as it holds the loans for a short period of time, typically less than a month, and historically the Company has not experienced any material losses due to credit risk on loans held for sale.
The Company sells loans to investors without recourse. As such, the investors have assumed the risk of loss or default by the borrower. However, the Company is usually required by these investors to make certain standard representations and warranties relating to credit information, loan documentation and
F-42
Table of Contents
GUILD MORTGAGE COMPANY
NOTES TO CONSOLIDATED FINANCIAL STATEMENTS
(Dollars in thousands, except as otherwise indicated)
collateral. To the extent that the Company does not comply with such representations, or there are early payment defaults, the Company may be required to repurchase the loans or indemnify these investors for any losses from borrower defaults, defects in the collateral or errors made in the credit decision.
The Company is also subject to counterparty credit risk in the event of contractual nonperformance by its trading counterparties to its various over-the-counter derivative financial instruments. The Company manages this credit risk by selecting only counterparties that it believes to be financially strong, spreading the credit risk among many such counterparties, placing contractual limits on the amount of unsecured credit extended to any single counterparty, and entering into netting agreements with the counterparties as appropriate. The master netting agreements contain a legal right to offset amounts due to and from the same counterparty. Derivative assets in the Consolidated Balance Sheets represent derivative contracts in a gain position net of loss positions with the same counterparty and, therefore, also represent the Company’s maximum counterparty credit risk. The Company incurred no credit losses due to nonperformance of any of its counterparties during the years ended December 31, 2019 and 2018.
Liquidity risk
The Company encounters liquidity risk as the business requires substantial cash to support its operating activities. As a result, the Company is dependent on its lines of credit, and other financing facilities in order to finance its continued operations. If the Company’s principal lenders decided to terminate or not to renew these credit facilities with the Company, the loss of borrowing capacity could have an adverse impact on the Company’s financial statements unless the Company found a suitable alternative source. To mitigate this risk, the Company has multiple financing facilities with different lenders and varied maturity dates. Historically, the Company has not had a line of credit involuntarily terminated by a lender.
Regulatory risk
The Company is subject to extensive and comprehensive regulation under federal, state and local laws in the United States. These laws and regulations significantly affect the way in which the Company does business and can restrict the scope of the Company’s existing business and limit the Company’s ability to expand product offerings or pursue acquisitions, or can make costs to service or originate loans higher, which could impact financial results. The Company continually monitors its regulatory environment for any changes that could have a significant impact on operations.
Recently Adopted Accounting Pronouncements
Accounting Standards Update No. 2014-09, 2016-08, 2016-10, 2016-12, and 2016-20, collectively implemented as FASB Accounting Standards Codification Topic 606 (“ASC 606”) Revenue from Contracts with Customers, provides guidance for revenue recognition. This ASC’s core principle requires a company to recognize revenue when it transfers promised goods or services to customers in an amount that reflects consideration to which the company expects to be entitled in exchange for those goods or services. The standard also clarifies the principal versus agent considerations, providing the evaluation must focus on whether the entity has control of the goods or services before they are transferred to the customer. The new standard permits the use of either the modified retrospective or full retrospective transition method. The Company’s revenue is generated from loan servicing and loan originations. Servicing revenue is comprised of servicing fees and other ancillary fees in connection with Company’s servicing activities as well as fees earned under subservicing arrangements. Origination revenue is comprised of fee income earned at origination of a loan, interest income earned for the period the loans are held, and gain on sale on loans upon disposition of the loan. The new guidance became effective for the Company beginning January 1,
F-43
Table of Contents
GUILD MORTGAGE COMPANY
NOTES TO CONSOLIDATED FINANCIAL STATEMENTS
(Dollars in thousands, except as otherwise indicated)
2019. The Company has determined that there was no material effect on revenue recognition to the financial statements.
In January 2016, the FASB issued ASU No. 2016-01, Financial Instruments — Overall (Subtopic 825-10): Recognition and measurement of financial assets and financial liabilities. The amendments in this update require an entity to: (i) measure equity investments at fair value through net income, with certain exceptions; (ii) present in other comprehensive income the changes in instrument-specific credit risk for financial liabilities measured using the fair value option; (iii) present financial assets and financial liabilities by measurement category and form of financial asset; (iv) calculate the fair value of financial instruments for disclosure purposes based on an exit price and; (v) assess a valuation allowance on deferred tax assets related to unrealized losses of available for sale debt securities in combination with other deferred tax assets. The update provides an election to subsequently measure certain non-marketable equity investments at cost less any impairment and adjusted for certain observable price changes. The update also requires a qualitative impairment assessment of such equity investments and amends certain fair value disclosure requirements. In February 2018, the FASB issued ASU 2018-03, Technical Corrections and Improvements to Financial Instruments-Overall (Subtopic 825-10) as an update to ASU 2016-01. This update is intended to clarify certain aspects of the guidance issued in ASU 2017-01 including: (i) equity securities without a readily determinable fair value – discontinuation; (ii) equity securities without a readily determinable fair value – adjustments; (iii) forward contracts and purchased options; (iv) presentation requirements for certain fair value option liabilities; (v) fair value option liabilities denominated in a foreign currency and; (vi) transition guidance for equity securities without a readily determinable fair value. The new guidance became effective for the Company beginning on January 1, 2019. The Company has determined that upon adoption of this ASU there was no material effect on the financial statements
In August 2016, the FASB issued ASU 2016-15, Statement of Cash Flows (Topic 230) Classification of Certain Cash Receipts and Cash Payments, which made eight targeted changes to how cash receipts and cash payments are presented and classified in the statement of cash flows. The new guidance became effective for the Company beginning January 1, 2019 and was applied on a retrospective basis to the Consolidated Statements of Cash Flows.
In November 2016, the FASB issued ASU 2016-18, Statement of Cash Flow (Topic 230): Restricted Cash (a consensus of the FASB Emerging Issues Task Force). The amendments in this update require that a statement of cash flows explain the change during the period in the total of cash, cash equivalents and amounts generally described as restricted cash or restricted cash equivalents. Therefore, amounts generally described as restricted cash and restricted cash equivalents should be included with cash and cash equivalents when reconciling the beginning of period and end of period total amounts shown on the statement of cash flows. The amendments in this update do not provide a definition of restricted cash or restricted cash equivalents. The new guidance became effective for the Company on January 1, 2019 and was applied to the Consolidated Statements of Cash Flows.
In August 2018, the Financial Accounting Standards Board (“FASB”) issued Accounting Standards Update (“ASU”) 2018-13, Fair Value Measurement (“Topic 820”), which modifies, removes and adds certain disclosure requirements on fair value measurements. The new guidance will be required for the Company for the annual reporting period beginning January 1, 2020 and interim periods within that fiscal year, and early adoption is permitted. The Company adopted this guidance starting from January 1, 2019 and has applied the required disclosures within its financial statements, which did not have a material impact on the presentation of the consolidated financial statements.
F-44
Table of Contents
GUILD MORTGAGE COMPANY
NOTES TO CONSOLIDATED FINANCIAL STATEMENTS
(Dollars in thousands, except as otherwise indicated)
Accounting Standards Issued but Not Yet Adopted
As an emerging growth company (“EGC”), the Jumpstart Our Business Startups Act (“JOBS Act”) allows the company to delay adoption of new or revised accounting pronouncements applicable to public companies until such pronouncements are applicable to private companies. The company has elected to use the extended transition period under the JOBS Act until such time the company is not considered to be an EGC. The adoption dates are discussed below to reflect this election.
In February 2016, the FASB issued ASU 2016-02, Leases (Topic 842). This update amends various aspects of existing guidance for leases and requires additional disclosures about leasing arrangements. It will require companies to recognize lease assets and lease liabilities by lessees for those leases classified as operating leases under previous GAAP. Topic 842 retains a distinction between finance leases and operating leases. The classification criteria for distinguishing between finance leases and operating leases are substantially similar to the classification criteria for distinguishing between capital leases and operating leases in the previous lease guidance. In November 2019, the FASB issued ASU 2019-10 which extended the effective date of ASU 2016-02. The new guidance will be effective for the Company beginning January 1, 2021 and early adoption is permitted. The Company is currently in the process of evaluating the impact of the adoption of the new guidance on its financial statements.
In June 2016, the FASB issued ASU 2016-13, Financial Instruments — Credit Losses (Topic 326). This update requires expected credit losses for financial instruments held at the reporting date to be measured based on historical experience, current conditions and reasonable and supportable forecasts. The update eliminates the probable initial recognition threshold in current GAAP and instead reflects an entity’s current estimate of all expected credit losses. Previously, when credit losses were measured under GAAP, an entity generally only considered past events and current conditions in measuring the incurred loss. In November 2019, the FASB issued ASU 2019-10 which extended the effective date of ASU 2016-13. The new guidance will be effective for the Company beginning January 1, 2023 and early adoption is permitted. The Company is currently in the process of evaluating the impact of the adoption of the new guidance on its financial statements.
In August 2018, the FASB issued ASU 2018-15, Intangibles-Goodwill and Other-Internal-Use Software (Subtopic 35-40). This update provides guidance on accounting for a cloud computing arrangement that includes a license to internal-use software. This generally means that an intangible asset is recognized for the software license and, to the extent that the payments attributable to the software license are made over time, a liability also is recognized. If a cloud computing arrangement does not include a software license, the entity should account for the arrangement as a service contract which would generally mean to expense the service as incurred. The new guidance will be effective for the Company beginning January 1, 2021 and early adoption is permitted. The Company is currently in the process of evaluating the impact of the adoption of the new guidance on its financial statements.
In December 2019, the FASB issued ASU 2019-12, Income Taxes (Topic 740). This update provides amendments to simplify and reduce complexity when accounting for income taxes as well as eliminating certain exceptions. The new guidance will be effective for the Company beginning January 1, 2022 with early adoption permitted. The Company is currently in the process of evaluating the impact of the adoption of the new guidance on its financial statements.
In March 2020, the FASB issued ASU No. 2020-04, Reference Rate Reform (Topic 848): Facilitation of the Effects of Reference Rate Reform on Financial Reporting. Subject to meeting certain criteria, the new guidance provides optional expedients and exceptions to applying contract modification accounting under existing GAAP, to address the expected phase out of the London Inter-bank Offered Rate (“LIBOR”) by the
F-45
Table of Contents
GUILD MORTGAGE COMPANY
NOTES TO CONSOLIDATED FINANCIAL STATEMENTS
(Dollars in thousands, except as otherwise indicated)
end of 2021. This guidance is effective upon issuance and allows application to contract changes as early as January 1, 2020. The Company is in the process of reviewing its funding facilities and financing facilities that utilize LIBOR as the reference rate and is currently evaluating the potential impact that the adoption of this ASU will have on the consolidated financial statements and related disclosures.
2. Fair Value Measurements
Fair value is defined as the exchange price that would be received for an asset or paid to transfer a liability (an exit price) in the principal or most advantageous market for the asset or liability in an orderly transaction between market participants at the measurement date. Inputs used to measure fair value are prioritized within a three-level fair value hierarchy. This hierarchy requires entities to maximize the use of observable inputs and minimize the use of unobservable inputs. The three levels of inputs used to measure fair value are as follows:
| • | Level One - Level One inputs are unadjusted, quoted prices in active markets for identical assets or liabilities which the Company has the ability to access at the measurement date. |
| • | Level Two - Level Two inputs are observable for that asset or liability, either directly or indirectly, and include quoted prices for similar assets and liabilities in active markets, quoted prices for identical or similar assets and liabilities in markets that are not active, observable inputs for the asset or liability other than quoted prices and inputs derived principally from or corroborated by observable market data by correlation or other means. If the asset or liability has a specified contractual term, the inputs must be observable for substantially the full term of the asset or liability. |
| • | Level Three - Level Three inputs are unobservable inputs for the asset or liability that reflect the Company’s assessment of the assumptions that market participants would use in pricing the asset or liability, including assumptions about risk, and are developed based on the best information available. |
The Company’s assets and liabilities are carried at cost, and because of their short-term nature, are believed to approximate current fair value, with the exception of mortgage loans held for sale, mortgage servicing rights, derivatives, real estate owned, GNMA loans subject to repurchase right and contingent liabilities due to acquisitions.
The Company updates the valuation of each instrument recorded at fair value on a monthly or quarterly basis, evaluating all available observable information which may include current market prices or bids, recent trade activity, changes in the levels of market activity and benchmarking of industry data. The assessment also includes consideration of identifying the valuation approach that would be used currently by market participants. If it is determined that a change in valuation technique or its application is appropriate, or if there are other changes in availability of observable data or market activity, the current methodology will be analyzed to determine if a transfer between levels of the valuation hierarchy is appropriate. Such reclassifications are reported as transfers into or out of a level as of the beginning of the quarter that the change occurs.
Fair value is based on quoted market prices, when available. If quoted prices are not available, fair value is estimated based upon other observable inputs. Unobservable inputs are used when observable inputs are not available and are based upon judgments and assumptions, which are the Company’s assessment of the assumptions market participants would use in pricing the asset or liability. These inputs may include assumptions about risk, counterparty credit quality, the Company’s creditworthiness and liquidity and are developed based on the best information available. When a determination is made to
F-46
Table of Contents
GUILD MORTGAGE COMPANY
NOTES TO CONSOLIDATED FINANCIAL STATEMENTS
(Dollars in thousands, except as otherwise indicated)
classify an asset or liability within Level Three of the valuation hierarchy, the determination is based upon the significance of the unobservable factors to the overall fair value measurement of the asset or liability. The fair value of assets and liabilities classified within Level Three of the valuation hierarchy also typically includes observable factors and the realized or unrealized gain or loss recorded from the valuation of these instruments would also include amounts determined by observable factors.
Recurring Fair Value Measurements
The Company’s fair value measurements are evaluated within the fair value hierarchy, based on the nature of the inputs used to determine the fair value at the measurement date. At December 31, 2019 and 2018, the Company had the following assets and liabilities that are measured at fair value on a recurring basis:
Trading Securities — Trading securities are classified within Level One of the valuation hierarchy. Valuation is based upon quoted prices for identical instruments traded in active markets. Level One trading securities include securities traded on active exchange markets, such as the New York Stock Exchange. Trading securities are included within prepaid expenses and other assets on the Consolidated Balance Sheets.
Derivative Instruments — Derivative instruments are classified within Level Two and Level Three of the valuation hierarchy, and include the following:
Interest Rate Lock Commitments: IRLCs are classified within Level Three of the valuation hierarchy. IRLCs represent an agreement to extend credit to a mortgage loan applicant, or an agreement to purchase a loan from a third-party originator, whereby the interest rate on the loan is set prior to funding. The fair value of IRLCs is based upon the estimated fair value of the underlying mortgage loan, including the expected net future cash flows related to servicing the mortgage loan, net of estimated commission expenses, and adjusted for: (i) estimated costs to complete and originate the loan and (ii) an adjustment to reflect the estimated percentage of IRLCs that will result in a closed mortgage loan under the original terms of the agreement (pull-through rate). The pull-through rate is considered a significant unobservable input and is estimated based on changes in pricing and actual borrower behavior using a historical analysis of loan closing and fallout data. The average pull-through rate used to calculate the fair value of IRLCs as of December 31, 2019 and 2018, was 89.4% and 88.8%, respectively. On a quarterly basis, actual loan pull-through rates are compared to the modeled estimates to confirm the assumptions are reflective of current trends. Generally, a change in interest rates is accompanied by a directionally opposite change in the assumption used for the pull-through percentage, and the impact to fair value of a change in pull-through would be partially offset by the related change in price.
Forward Delivery Commitments: Forward delivery commitments are classified within Level Two of the valuation hierarchy. Forward delivery commitments fix the forward sales price that will be realized upon the sale of mortgage loans into the secondary market. The fair value of forward delivery commitments is primarily based upon the current agency mortgage-backed security market to-be-announced pricing specific to the loan program, delivery coupon and delivery date of the trade. Best efforts sales commitments are also entered into for certain loans at the time the borrower commitment is made. These best efforts sales commitments are valued using the committed price to the counterparty against the current market price of the IRLC or mortgage loan held for sale.
Option contracts are a type of forward commitment that represents the rights to buy or sell mortgage-backed securities at specified prices in the future. Their value is based upon the underlying current to-
F-47
Table of Contents
GUILD MORTGAGE COMPANY
NOTES TO CONSOLIDATED FINANCIAL STATEMENTS
(Dollars in thousands, except as otherwise indicated)
be-announced pricing of the agency mortgage-backed security market, and market-based volatility. See Note 6 for additional information on the derivative instruments.
Mortgage Loans Held for Sale — MLHS are carried at fair value. The fair value of MLHS is based on secondary market pricing for loans with similar characteristics, and as such, is classified as a Level Two measurement. For Level Two MLHS, fair value is estimated through a market approach by using either: (i) the fair value of securities backed by similar mortgage loans, adjusted for certain factors to approximate the fair value of a whole mortgage loan, including the value attributable to servicing rights and credit risk, (ii) current commitments to purchase loans or (iii) recent observable market trades for similar loans, adjusted for credit risk and other individual loan characteristics. The agency mortgage-backed security market is a highly liquid and active secondary market for conforming conventional loans whereby quoted prices exist for securities at the pass-through level and are published on a regular basis. The Company has the ability to access this market and it is the market into which conforming mortgage loans are typically sold.
Mortgage Servicing Rights — MSRs are classified within Level Three of the valuation hierarchy due to the use of significant unobservable inputs and the lack of an active market for such assets. The fair value of MSRs is estimated based upon projections of expected future cash flows considering prepayment estimates, the Company’s historical prepayment rates, portfolio characteristics, interest rates based on interest rate yield curves, implied volatility and other economic factors. The Company obtains valuations from an independent third party on a quarterly basis, and records an adjustment based on this third-party valuation.
Contingent Liabilities due to acquisitions — Contingent liabilities represent future obligations of the Company to make payments to the former owners of its acquired companies. The Company determines the fair value of its contingent liabilities using a discounted cash flow approach whereby the Company forecasts the cash outflows related to the future payments, which are based on a percentage of net income specified in the purchase agreements. The Company then discounts these expected payment amounts to calculate the present value, or fair value, as of the valuation date. The Company’s management evaluates the underlying projections used in determining fair value each period and makes updates to these underlying projections.
The Company uses a risk-adjusted discount rate to value the contingent liabilities which is considered a significant unobservable input, and as such, the liabilities are classified as a Level Three measurement. Management’s underlying projections adjust for market penetration and other economic expectations, and the discount rate is risk-adjusted for key factors such as uncertainty in the mortgage banking industry due to its reliance on external influences (interest rates, regulatory changes, etc.), upfront payments, and credit risk. An increase in the discount rate will result in a decrease in the fair value of the contingent liabilities. Conversely, a decrease in the discount rate will result in an increase in the fair value of the contingent liabilities. For each of the years ended December 31, 2019 and 2018, the range of the risk adjusted discount rate was 8.0% - 20.0%, with a median of 15.0%. Adjustments to the fair value of the contingent liabilities (other than payments) are recorded as a gain or loss and are included within general and administrative expenses on the Consolidated Statements of Income.
F-48
Table of Contents
GUILD MORTGAGE COMPANY
NOTES TO CONSOLIDATED FINANCIAL STATEMENTS
(Dollars in thousands, except as otherwise indicated)
The following table summarizes the Company’s assets and liabilities measured at fair value on a recurring basis at December 31, 2019:
| Description |
Level 1 | Level 2 | Level 3 | Total | ||||||||||||
| Assets: |
||||||||||||||||
| Trading securities |
$ | 93 | $ | — | $ | — | $ | 93 | ||||||||
| Derivative |
||||||||||||||||
| Interest rate lock commitments |
— | — | 19,922 | 19,922 | ||||||||||||
| Mortgage loans held for sale |
— | 1,504,842 | — | 1,504,842 | ||||||||||||
| Mortgage servicing rights |
— | — | 418,402 | 418,402 | ||||||||||||
|
|
|
|
|
|
|
|
|
|||||||||
| Total assets at fair value |
$ | 93 | $ | 1,504,842 | $ | 438,324 | $ | 1,943,259 | ||||||||
|
|
|
|
|
|
|
|
|
|||||||||
| Liabilities: |
||||||||||||||||
| Derivative |
||||||||||||||||
| Forward delivery commitments |
— | 4,863 | — | 4,863 | ||||||||||||
| Contingent liabilities due to acquisitions |
— | — | 8,073 | 8,073 | ||||||||||||
|
|
|
|
|
|
|
|
|
|||||||||
| Total liabilities at fair value |
$ | — | $ | 4,863 | $ | 8,073 | $ | 12,936 | ||||||||
|
|
|
|
|
|
|
|
|
|||||||||
The following table summarizes the Company’s assets and liabilities measured at fair value on a recurring basis at December 31, 2018:
| Description |
Level 1 | Level 2 | Level 3 | Total | ||||||||||||
| Assets: |
||||||||||||||||
| Trading securities |
$ | 107 | $ | — | $ | — | $ | 107 | ||||||||
| Derivative |
||||||||||||||||
| Interest rate lock commitments |
— | — | 12,541 | 12,541 | ||||||||||||
| Mortgage loans held for sale |
— | 966,171 | — | 966,171 | ||||||||||||
| Mortgage servicing rights |
— | — | 511,852 | 511,852 | ||||||||||||
|
|
|
|
|
|
|
|
|
|||||||||
| Total assets at fair value |
$ | 107 | $ | 966,171 | $ | 524,393 | $ | 1,490,671 | ||||||||
|
|
|
|
|
|
|
|
|
|||||||||
| Liabilities: |
||||||||||||||||
| Derivative |
||||||||||||||||
| Forward delivery commitments |
— | 10,157 | — | 10,157 | ||||||||||||
| Contingent liabilities due to acquisitions |
— | — | 5,106 | 5,106 | ||||||||||||
|
|
|
|
|
|
|
|
|
|||||||||
| Total liabilities at fair value |
$ | — | $ | 10,157 | $ | 5,106 | $ | 15,263 | ||||||||
|
|
|
|
|
|
|
|
|
|||||||||
Non-Recurring Fair Value Measurements
Certain assets and liabilities that are not typically measured at fair value on a recurring basis may be subject to fair value measurement requirements under certain circumstances. These adjustments to fair value usually result from write-downs of individual assets. At December 31, 2019 and 2018, the Company had the following financial assets measured at fair value on a nonrecurring basis:
Real Estate Owned — Other assets that are evaluated for impairment using fair value measurements on a nonrecurring basis consist of mortgage loans in foreclosure and REO. The evaluation of impairment reflects an estimate of losses that have been incurred as of the balance sheet date, which will likely not be recoverable from guarantors, insurers or investors. The impairment of mortgage loans in foreclosure, which represents the unpaid principal balance of mortgage loans for which foreclosure
F-49
Table of Contents
GUILD MORTGAGE COMPANY
NOTES TO CONSOLIDATED FINANCIAL STATEMENTS
(Dollars in thousands, except as otherwise indicated)
proceedings have been initiated, plus recoverable advances on those loans, is based on the fair value of the underlying collateral, determined on a loan level basis, less costs to sell. REO properties, which are acquired from mortgagors in default, are recorded at the lower of adjusted carrying amount at the time the property is acquired or fair value of the property, less estimated selling costs. Fair values of the collateral underlying mortgage loans in foreclosure and REOs are estimated using appraisals and broker price opinions, which are updated on a periodic basis to reflect current housing market conditions. The allowance for probable losses associated with mortgage loans in foreclosure and the adjustment to record REO at their estimated net realizable value are based upon fair value measurements from Level Three of the valuation hierarchy.
Ginnie Mae Loans subject to Repurchase Right — GNMA securitization programs allow servicers to buy back individual delinquent mortgage loans from the securitized loan pool once certain conditions are met. If a borrower makes no payment for three consecutive months, the servicer has the option to repurchase the delinquent loan for an amount equal to 100% of the loan’s remaining principal balance. Under ASC 860, this buy-back option is considered a conditional option until the delinquency criteria are met, at which time the option becomes unconditional. The Company records these assets and liabilities at their fair value, which is determined to be the remaining unpaid principal balance. The Company’s future expected realizable cash flows are the cash payments of the remaining unpaid principal balance whether paid by the borrower or reimbursed through a claim filed with HUD. The Company considers the fair value of these assets and liabilities to fall into the Level Two bucket in the valuation hierarchy due to the assets and liabilities having specified contractual terms and the inputs are observable for substantially the full term of the assets and liabilities life.
The following table summarizes the Company’s financial assets measured at fair value on a nonrecurring basis at December 31, 2019:
| Description |
Level 1 | Level 2 | Level 3 | Total | ||||||||||||
| Assets: |
||||||||||||||||
| Real estate owned |
— | — | 852 | 852 | ||||||||||||
| Ginnie Mae loans subject to repurchase right |
— | 404,344 | — | 404,344 | ||||||||||||
|
|
|
|
|
|
|
|
|
|||||||||
| Total assets at fair value |
$ | — | $ | 404,344 | $ | 852 | $ | 405,196 | ||||||||
|
|
|
|
|
|
|
|
|
|||||||||
| Liabilities: |
||||||||||||||||
| Ginnie Mae loans subject to repurchase right |
— | 412,490 | — | 412,490 | ||||||||||||
|
|
|
|
|
|
|
|
|
|||||||||
| Total liabilities at fair value |
$ | — | $ | 412,490 | $ | — | $ | 412,490 | ||||||||
|
|
|
|
|
|
|
|
|
|||||||||
The following table summarizes the Company’s financial assets measured at fair value on a nonrecurring basis at December 31, 2018:
| Description |
Level 1 | Level 2 | Level 3 | Total | ||||||||||||
| Assets: |
||||||||||||||||
| Real estate owned |
— | — | 3,314 | 3,314 | ||||||||||||
| Ginnie Mae loans subject to repurchase right |
— | 321,049 | — | 321,049 | ||||||||||||
|
|
|
|
|
|
|
|
|
|||||||||
| Total assets at fair value |
$ | — | $ | 321,049 | $ | 3,314 | $ | 324,363 | ||||||||
|
|
|
|
|
|
|
|
|
|||||||||
| Liabilities: |
||||||||||||||||
| Ginnie Mae loans subject to repurchase right |
— | 333,018 | — | 333,018 | ||||||||||||
|
|
|
|
|
|
|
|
|
|||||||||
| Total liabilities at fair value |
$ | — | $ | 333,018 | $ | — | $ | 333,018 | ||||||||
|
|
|
|
|
|
|
|
|
|||||||||
F-50
Table of Contents
GUILD MORTGAGE COMPANY
NOTES TO CONSOLIDATED FINANCIAL STATEMENTS
(Dollars in thousands, except as otherwise indicated)
The table below presents a reconciliation of Level 3 assets and liabilities measured at fair value on a recurring and non-recurring basis for the years ended:
| IRLCs | Contingent Liabilities |
Real Estate Owned |
||||||||||
| Balance at December 31, 2017 |
$ | 12,719 | $ | 10,922 | $ | 639 | ||||||
| Net transfers and revaluation gains |
(178 | ) | — | — | ||||||||
| Payments |
— | (6,133 | ) | — | ||||||||
| Additions |
— | 2,959 | 5,421 | |||||||||
| Proceeds |
— | — | (2,781 | ) | ||||||||
| Valuation adjustments |
— | (2,642 | ) | 35 | ||||||||
|
|
|
|
|
|
|
|||||||
| Balance at December 31, 2018 |
$ | 12,541 | $ | 5,106 | $ | 3,314 | ||||||
|
|
|
|
|
|
|
|||||||
| Net transfers and revaluation gains |
7,381 | — | — | |||||||||
| Payments |
— | (6,688 | ) | — | ||||||||
| Additions |
— | 1,735 | 2,601 | |||||||||
| Proceeds |
— | — | (5,140 | ) | ||||||||
| Valuation adjustments |
— | 7,920 | 77 | |||||||||
|
|
|
|
|
|
|
|||||||
| Balance at December 31, 2019 |
$ | 19,922 | $ | 8,073 | $ | 852 | ||||||
|
|
|
|
|
|
|
|||||||
Changes in the availability of observable inputs may result in reclassifications of certain assets or liabilities. Such reclassifications are reported as transfers in or out of Level Three as of the beginning of the period that the change occurs. There were no transfers between fair value levels during the years ended December 31, 2019 and 2018.
Fair Value Option
The following is the estimated fair value and unpaid principal balance of MLHS that have contractual principal amounts and for which the Company has elected the fair value option. The fair value option was elected for MLHS as the Company believes fair value best reflects their expected future economic performance:
| Fair Value | Principal Amount Due Upon Maturity |
Difference (1) | ||||||||||
| Balance at December 31, 2019 |
$ | 1,504,842 | $ | 1,485,460 | $ | 19,382 | ||||||
| Balance at December 31, 2018 |
$ | 966,171 | $ | 950,695 | $ | 15,476 | ||||||
| (1) | Represents the amount of gains included in loan origination fees and gain on sale of loans, net due to changes in fair value of items accounted for using the fair value option. |
3. Acquisitions
The Company completed one acquisition in 2019: Vitek Real Estate Industries Group, Inc. (“Vitek”) through an Asset Purchase Agreement. On December 6, 2018, the Company announced a definitive agreement pursuant to which it would acquire certain assets of Vitek. Vitek was a mortgage loan originator with an experienced team of loan officers and an established presence in Northern California. This strategic acquisition expanded Guild’s presence in this region and added experienced loan officers to Guild’s sales force. The transaction closed on April 30, 2019.
F-51
Table of Contents
GUILD MORTGAGE COMPANY
NOTES TO CONSOLIDATED FINANCIAL STATEMENTS
(Dollars in thousands, except as otherwise indicated)
The acquisition has been accounted for under the acquisition method of accounting pursuant to ASC 805, Business Combinations. Assets acquired and liabilities assumed are recorded at their fair value as of the date of acquisition based on management’s estimates using currently available information. The results of Vitek’s operations are included in Guild’s Consolidated Statements of Income from the date of acquisition. For U.S. income tax purposes the acquisition of Vitek is treated as an asset purchase.
Total cash consideration for the acquisition was approximately $10.5 million. The purchase price allocation provided in the table below reflects the final determination of the fair value of assets acquired and liabilities assumed in the acquisition of Vitek, with the excess of total consideration over total identifiable net assets recorded as goodwill. Goodwill in the amount of $0.4 million is expected to be deductible for income tax purposes. Transaction costs associated with the Vitek acquisition were approximately $0.2 million and were expensed as incurred within general and administrative expenses in the Consolidated Statements of Income.
| Total | ||||
| Goodwill |
$ | 2,135 | ||
| Mortgage servicing rights |
7,568 | |||
| Fixed assets |
862 | |||
| Other assets |
27 | |||
| Accounts payable and accrued liabilities |
(40 | ) | ||
|
|
|
|||
| Net assets acquired |
$ | 10,552 | ||
|
|
|
|||
| Total | ||||
| Cash payments |
$ | 8,817 | ||
| Contingent consideration |
1,735 | |||
|
|
|
|||
| Total purchase price |
$ | 10,552 | ||
|
|
|
|||
The following table presents the results of operations of Vitek that are included in the Company’s Consolidated Statements of Income from the acquisition date of April 30, 2019 through December 31, 2019.
| Revenues |
$ | 11,105 | ||
| Expenses |
8,039 | |||
|
|
|
|||
| Net income |
$ | 3,066 | ||
|
|
|
The Company completed one acquisition in 2018: Cornerstone Mortgage, Inc. (“CMI”) through an Asset Purchase Agreement. On December 22, 2017, the Company announced a definitive agreement pursuant to which it would acquire certain assets of CMI. CMI was a mortgage loan originator with an experienced team of loan officers and an established presence in Missouri, Kansas and Illinois. This strategic acquisition expanded Guild’s presence in these regions and added experienced loan officers to Guild’s sales force. The transaction closed on February 28, 2018.
The acquisition has been accounted for under the acquisition method of accounting pursuant to ASC 805, Business Combinations. Assets acquired and liabilities assumed are recorded at their fair value as of the date of acquisition based on management’s estimates using currently available information. The results of CMI’s operations are included in Guild’s Consolidated Statements of Income from the date of acquisition. For U.S. income tax purposes, the acquisition of CMI is treated as an asset purchase.
F-52
Table of Contents
GUILD MORTGAGE COMPANY
NOTES TO CONSOLIDATED FINANCIAL STATEMENTS
(Dollars in thousands, except as otherwise indicated)
Total cash consideration for the acquisition was approximately $23.1 million. The purchase price allocation provided in the table below reflects the final determination of the fair value of assets acquired and liabilities assumed in the acquisition of CMI, with the excess of total consideration over total identifiable net assets recorded as goodwill. Goodwill in the amount of $10.0 million is expected to be deductible for income tax purposes. Transaction costs associated with the CMI acquisition were approximately $0.4 million and were expensed as incurred within general and administrative expenses in the Consolidated Statements of Income. The Company offered certain employees retention bonuses in connection with the acquisition. The retention bonuses are payable on a yearly basis over a four-year period. For the years ended December 31, 2019 and 2018, the Company recorded $1.4 million and $0.9 million, respectively, within salaries, commissions and benefits expense in the Consolidated Statements of Income.
| Total | ||||
| Goodwill |
$ | 12,626 | ||
| Mortgage servicing rights |
9,964 | |||
| Fixed assets |
400 | |||
| Other assets |
334 | |||
| Accounts payable and accrued liabilities |
(185 | ) | ||
|
|
|
|||
| Net assets acquired |
$ | 23,139 | ||
|
|
|
|||
| Total | ||||
| Cash payments |
$ | 20,180 | ||
| Contingent consideration |
2,959 | |||
|
|
|
|||
| Total purchase price |
$ | 23,139 | ||
|
|
|
|||
The following table presents the results of operations of CMI that are included in the Company’s Consolidated Statements of Income from the acquisition date of February 28, 2018 through December 31, 2018 and for the year ended December 31, 2019.
| 2019 | 2018 | |||||||
| Revenues |
$ | 53,789 | $ | 23,647 | ||||
| Expenses |
43,398 | 24,598 | ||||||
|
|
|
|
|
|||||
| Net income (loss) |
$ | 10,391 | $ | (951 | ) | |||
|
|
|
|
|
|||||
There have been no adjustments to the purchase price allocation during the measurement period. See Note 1, Business, Basis of Presentation and Accounting Policies, for further information regarding the methods used to account for the fair value of certain assets acquired and liabilities assumed in connection with an acquisition.
F-53
Table of Contents
GUILD MORTGAGE COMPANY
NOTES TO CONSOLIDATED FINANCIAL STATEMENTS
(Dollars in thousands, except as otherwise indicated)
4. Accounts and Interest Receivable
Accounts and interest receivable consisted of the following at December 31, 2019 and 2018:
| 2019 | 2018 | |||||||
| Trust advances |
$ | 17,622 | $ | 14,700 | ||||
| Foreclosure advances, net |
7,348 | 5,128 | ||||||
| Receivables related to loan sales |
5,771 | 6,858 | ||||||
| Other |
3,870 | 1,254 | ||||||
|
|
|
|
|
|||||
| Total accounts and interest receivable |
$ | 34,611 | $ | 27,940 | ||||
|
|
|
|
|
|||||
Management has established a foreclosure reserve for estimated uncollectable balances of the foreclosure and trust advances. Management believes that substantially all other accounts and interest receivable amounts are collectible and, accordingly, no allowance for doubtful accounts is necessary.
The activity of the foreclosure loss reserve was as follows for the years ended December 31, 2019 and 2018:
| 2019 | 2018 | |||||||
| Balance — beginning of year |
$ | 7,884 | $ | 6,205 | ||||
| Utilization of foreclosure reserve |
(3,910 | ) | (2,755 | ) | ||||
| Provision charged to operations |
3,895 | 4,434 | ||||||
|
|
|
|
|
|||||
| Balance — end of year |
$ | 7,869 | $ | 7,884 | ||||
|
|
|
|
|
|||||
5. Other Assets
Other assets consisted of the following at December 31, 2019 and 2018:
| 2019 | 2018 | |||||||
| Prepaid expenses |
$ | 11,274 | $ | 13,187 | ||||
| Company owned life insurance |
21,908 | 17,315 | ||||||
| Property and equipment, net |
9,835 | 12,878 | ||||||
| Income tax receivable |
1,015 | 13,339 | ||||||
| Due from affiliates |
2,600 | 3,089 | ||||||
| Real estate owned |
8,998 | 15,359 | ||||||
| Trading securities |
93 | 77 | ||||||
|
|
|
|
|
|||||
| Total other assets |
$ | 55,723 | $ | 75,244 | ||||
|
|
|
|
|
|||||
F-54
Table of Contents
GUILD MORTGAGE COMPANY
NOTES TO CONSOLIDATED FINANCIAL STATEMENTS
(Dollars in thousands, except as otherwise indicated)
Property and equipment consisted of the following at December 31, 2019 and 2018:
| 2019 | 2018 | |||||||
| Computer equipment |
$ | 22,546 | $ | 23,440 | ||||
| Furniture and equipment |
16,404 | 14,598 | ||||||
| Leasehold improvements |
5,395 | 5,247 | ||||||
| Internal-use software |
3,476 | — | ||||||
| Internal-use software in production |
1,155 | 1,772 | ||||||
|
|
|
|
|
|||||
| Property and equipment, gross |
48,976 | 45,057 | ||||||
| Accumulated depreciation |
(39,141 | ) | (32,179 | ) | ||||
|
|
|
|
|
|||||
| Property and equipment, net |
$ | 9,835 | $ | 12,878 | ||||
|
|
|
|
|
|||||
Depreciation and amortization expense for fixed assets was $7.3 million and $7.2 million for the years ending December 31, 2019 and 2018, respectively.
6. Derivative Financial Instruments
The Company uses forward commitments in hedging the interest rate risk exposure on its fixed and adjustable rate commitments. The Company’s derivative instruments are not designated as hedging instruments, and therefore, changes in fair value are recorded in current period earnings. Hedging gains and losses are included in loan origination fees and gain on sale, net in the Consolidated Statements of Income.
Net hedging gains (losses) were as follows December 31, 2019 and 2018:
| 2019 | 2018 | |||||||
| Hedging gains (losses) |
$ | 12,675 | $ | (8,233 | ) | |||
Notional and Fair Value
The notional and fair value of derivative financial instruments not designated as hedging instruments were as follows at December 31, 2019 and 1018:
| Notional Value |
Derivative Asset |
Derivative Liability |
||||||||||
| Balance at December 31, 2019 |
||||||||||||
| IRLCs |
$ | 1,524,540 | $ | 19,922 | $ | — | ||||||
| Forward commitments |
$ | 1,961,733 | $ | — | $ | 4,863 | ||||||
| Balance at December 31, 2018 |
||||||||||||
| IRLCs |
$ | 799,203 | $ | 12,541 | $ | — | ||||||
| Forward commitments |
$ | 803,987 | $ | — | $ | 10,157 | ||||||
The Company had an additional $427.7 million and $316.5 million of outstanding forward contracts and mandatory sell commitments, comprised of closed loans with equal and offsetting UPB amounts allocated to them, at December 31, 2019 and 2018, respectively. The Company also had $376.5 million and $277.5 million in closed hedge instruments not yet settled at December 31, 2019 and 2018, respectively. See Note 2 for fair value disclosure of the derivative instruments.
F-55
Table of Contents
GUILD MORTGAGE COMPANY
NOTES TO CONSOLIDATED FINANCIAL STATEMENTS
(Dollars in thousands, except as otherwise indicated)
The following table presents the quantitative information about IRLCs and the fair value measurements as of December 31, 2019 and 1018:
| 2019 | 2018 | |||||||
| Unobservable Input |
Range (Weighted Average) | |||||||
| Loan funding probability (“pull-through”) |
0% -100% (89.4%) | 0% - 100% (88.8%) | ||||||
Counterparty agreements for forward commitments contain master netting agreements. The master netting agreements contain a legal right to offset amounts due to and from the same counterparty. Derivative assets in the Consolidated Balance Sheets represent derivative contracts in a gain position net of loss positions with the same counterparty and, therefore, also represent the Company’s maximum counterparty credit risk. The Company incurred no credit losses due to nonperformance of any of its counterparties during the years ended December 31, 2019 and 2018.
7. Mortgage Servicing Rights
The activity of mortgage servicing rights was as follows for the years ended December 31, 2019 and 2018:
| 2019 | 2018 | |||||||
| Balance — beginning of year |
$ | 511,852 | $ | 388,075 | ||||
| MSRs originated and acquired through acquisitions |
161,769 | 140,827 | ||||||
| Changes in fair value: |
||||||||
| Due to collection/realization of cash flows |
(83,821 | ) | (43,228 | ) | ||||
| Due to changes in valuation model inputs or assumptions |
(171,398 | ) | 26,178 | |||||
|
|
|
|
|
|||||
| Balance — end of year |
$ | 418,402 | $ | 511,852 | ||||
|
|
|
|
|
|||||
The following table presents the quantitative information for the MSR fair value measurement as of December 31, 2019 and 1018:
| 2019 | 2018 | |||||||
| Unobservable Input |
Range (Weighted Average) | |||||||
| Discount rate |
9.2% - 15.5% (10.2%) | 9.2% - 15.4% (10.0%) | ||||||
| Prepayment rate |
8.9% - 30.0% (17.3%) | 8.2% - 32.0% (11.0%) | ||||||
At December 31, 2019 and 2018, the MSRs had a weighted average life of approximately 4.9 and 7.0 years, respectively. See Note 2 for additional information regarding the valuation of MSRs.
Actual revenue generated from servicing activities includes contractually specified servicing fees, as well as late fees and other ancillary servicing revenue, which were recorded within loan servicing and other fees as follows for the years ended December 31, 2019 and 2018:
| 2019 | 2018 | |||||||
| Servicing fees from servicing portfolio |
$ | 138,201 | $ | 119,647 | ||||
| Late fees |
5,967 | 4,835 | ||||||
| Other ancillary servicing revenue |
(1,463 | ) | (801 | ) | ||||
|
|
|
|
|
|||||
| Total loan servicing and other fees |
$ | 142,705 | $ | 123,681 | ||||
|
|
|
|
|
|||||
F-56
Table of Contents
GUILD MORTGAGE COMPANY
NOTES TO CONSOLIDATED FINANCIAL STATEMENTS
(Dollars in thousands, except as otherwise indicated)
At December 31, 2019 and 2018, the unpaid principal balance of mortgage loans serviced totaled $50.6 billion and $46.3 billion, respectively. Conforming conventional loans serviced by the Company are sold to FNMA or FHLMC programs on a nonrecourse basis, whereby foreclosure losses are generally the responsibility of FNMA and FHLMC and not the Company. Similarly, certain loans serviced by the Company are secured through GNMA programs, whereby the Company is insured against loss by FHA or partially guaranteed against loss by VA.
The key assumptions used to estimate the fair value of MSRs are prepayment speeds and the discount rate. Increases in prepayment speeds generally have an adverse effect on the value of MSRs as the underlying loans prepay faster. In a declining interest rate environment, the fair value of MSRs generally decreases as prepayments increase and therefore, the estimated life of the MSRs and related cash flows decrease. Decreases in prepayment speeds generally have a positive effect on the value of MSRs as the underlying loans prepay less frequently. In a rising interest rate environment, the fair value of MSRs generally increases as prepayments decrease and therefore, the estimated life of the MSRs and related cash flows increase. Increases in the discount rate result in a lower MSR value and decreases in the discount rate result in a higher MSR value. MSR uncertainties are hypothetical and do not always have a direct correlation with each assumption. Changes in one assumption may result in changes to another assumption, which might magnify or counteract the uncertainties.
The following table illustrates the impact of adverse changes on the discount rate and prepayment speeds at two different data points at December 31, 2019 and 2018, respectively:
| Discount Rates | Prepayment Speeds | |||||||||||||||
| 10% Adverse Change |
20% Adverse Change |
10% Adverse Change |
20% Adverse Change |
|||||||||||||
| December 31, 2019 |
||||||||||||||||
| Mortgage servicing rights |
(23,682 | ) | (35,701 | ) | (31,329 | ) | (49,031 | ) | ||||||||
| December 31, 2018 |
||||||||||||||||
| Mortgage servicing rights |
(28,019 | ) | (45,580 | ) | (26,322 | ) | (43,156 | ) | ||||||||
8. Mortgage Loans Held for Sale
The Company sells substantially all of its originated mortgage loans into the secondary market. The Company may retain the right to service some of these loans upon sale through ownership of servicing rights. A reconciliation of the changes in mortgage loans held for sale to the amounts presented in the Consolidated Statements of Cash Flows for the years ended December 31, 2019 and 2018 is set forth below:
| 2019 | 2018 | |||||||
| Balance at the beginning of period |
$ | 966,171 | $ | 959,092 | ||||
| Origination of mortgage loans held for sale |
21,749,675 | 16,466,876 | ||||||
| Proceeds on sale of payments from mortgage loans held for sale |
(21,854,967 | ) | (16,947,871 | ) | ||||
| Gain on sale of mortgage loans excluding fair value of other financial instruments, net |
638,902 | 493,578 | ||||||
| Valuation adjustment of mortgage loans held for sale |
5,061 | (5,504 | ) | |||||
|
|
|
|
|
|||||
| Balance at the end of period |
$ | 1,504,842 | $ | 966,171 | ||||
|
|
|
|
|
|||||
At December 31, 2019, mortgage loans held for sale included unpaid principal balances of the underlying loans of $1.5 billion, and had a fair value of $1.5 billion. At December 31, 2018, mortgage loans
F-57
Table of Contents
GUILD MORTGAGE COMPANY
NOTES TO CONSOLIDATED FINANCIAL STATEMENTS
(Dollars in thousands, except as otherwise indicated)
held for sale included unpaid principal balances of the underlying loans of $1.0 billion, and had a fair value of $1.0 billion.
9. Goodwill
A summary of the activity in goodwill is presented below for the years ended December 31, 2019 and 2018:
| Balance at December 31, 2017 |
$ | 48,073 | ||
| 2018 Acquisitions (Note 3) |
12,626 | |||
|
|
|
|||
| Balance at December 31, 2018 |
60,699 | |||
| 2019 Acquisitions (Note 3) |
2,135 | |||
|
|
|
|||
| Balance at December 31, 2019 |
$ | 62,834 | ||
|
|
|
During 2019, the Company completed its annual goodwill impairment test as of December 31, 2019 using qualitative assessments of all applicable reporting units. Based on the results of the annual goodwill impairment test, the Company determined there was no impairment. For more information on the use of qualitative assessments, see Note 1 — Business, Basis of Presentation and Accounting Policies.
10. Investor Reserves
The Company’s estimate of the investor reserves consider the current macro-economic environment and recent repurchase trends; however, if the Company experiences a prolonged period of higher repurchase and indemnification activity, then the realized losses from loan repurchases and indemnifications may ultimately be in excess of the liability. The maximum exposure under the Company’s representations and warranties would be the outstanding principal balance and any premium received on all loans ever sold by the Company, less any loans that have already been paid in full by the mortgagee, that have defaulted without a breach of representations and warranties, that have been indemnified via settlement or make-whole, or that have been repurchased. Additionally, the Company may receive relief of certain representations and warranty obligations on loans sold to FNMA or FHLMC on or after January 1, 2013 if FNMA or FHLMC satisfactorily concludes a quality control loan file review or if the borrower meets certain acceptable payment history requirements within 12 or 36 months after the loan is sold to FNMA or FHLMC.
The activity of the investor reserves was as follows for the years ended December 31, 2019 and 2018:
| 2019 | 2018 | |||||||
| Balance — beginning of year |
$ | 14,312 | $ | 14,735 | ||||
| Utilization of reserve for loan losses |
(7,994 | ) | (6,909 | ) | ||||
| Provision charged to operations |
10,203 | 6,486 | ||||||
|
|
|
|
|
|||||
| Balance — end of year |
$ | 16,521 | $ | 14,312 | ||||
|
|
|
|
|
|||||
F-58
Table of Contents
GUILD MORTGAGE COMPANY
NOTES TO CONSOLIDATED FINANCIAL STATEMENTS
(Dollars in thousands, except as otherwise indicated)
11. Warehouse Lines of Credit
Warehouse lines of credit consisted of the following at December 31, 2019 and 2018. Changes subsequent to December 31, 2019 have been described in the notes referenced with the below table.
| Maturity as of December 31, 2019 |
2019 | 2018 | ||||||||||
| $600 million master repurchase facility agreement(1) |
October 2020 | $ | 456,225 | $ | 255,495 | |||||||
| $150 million master repurchase facility agreement(2) |
September 2020 | 80,965 | 81,373 | |||||||||
| $700 million master repurchase facility agreement(3) |
February 2021 | 282,579 | 139,137 | |||||||||
| $200 million master repurchase facility agreement(4) |
April 2020 | 136,699 | 165,774 | |||||||||
| $300 million master repurchase facility agreement(5) |
September 2020 | 148,149 | 114,190 | |||||||||
| $400 million master repurchase facility agreement(6) |
July 2020 | 190,221 | 85,709 | |||||||||
| $75 million master repurchase facility agreement(7) |
March 2024 | 9,569 | — | |||||||||
|
|
|
|
|
|||||||||
| 1,304,407 | 841,678 | |||||||||||
| Prepaid commitment fees |
(1,220 | ) | (1,944 | ) | ||||||||
|
|
|
|
|
|||||||||
| Net warehouse lines of credit |
$ | 1,303,187 | $ | 839,734 | ||||||||
|
|
|
|
|
|||||||||
| (1) | The variable interest rate is calculated using a base rate tied to LIBOR, the Eurodollar, or an alternative base rate, plus the applicable interest rate margin. Subsequent to December 31, 2019, the borrowing capacity on this facility has been increased to $800.0 million. |
| (2) | The variable interest rate is calculated using a base rate tied to LIBOR, plus the applicable interest rate margin. This line of credit requires a minimum deposit of $0.75 million. |
| (3) | The variable interest rate is calculated using a base rate tied to LIBOR, plus the applicable interest rate margin. This line of credit was amended subsequent to December 31, 2019, increasing the required minimum deposit from $2.5 million to $3.5 million. |
| (4) | The variable interest rate is calculated using a base rate plus LIBOR, with a floor of 1.525%. This line of credit requires a minimum deposit of $1.1 million. Subsequent to December 31, 2019, this line of credit was amended with a maturity date of June 2021 and increased capacity up to $290.0 million. |
| (5) | The variable interest rate is calculated using a base rate tied to LIBOR, plus the applicable interest rate margin. This line of credit was amended subsequent to December 31, 2019, with borrowing capacity of up to $299.0 million. |
| (6) | The variable interest rate is calculated using a base rate tied to LIBOR, plus the applicable interest rate margin. This borrowing capacity of this facility was increased in 2019 to $400 million. Subsequent to December 31, 2019, this line of credit was amended, extending the maturity date to July 2021. |
| (7) | The interest rate on this facility is 3.375%. This facility was opened in 2019 and is used for GNMA delinquent buyouts. Each buyout represents a separate transaction that can remain on the facility for up to 4 years. |
Subsequent to December 31, 2019, the Company entered into a master purchase agreement with a new lender. The facility size is $200.0 million with an interest rate that is tied to LIBOR and a floor of 1.75%. The maturity date of the facility is April 2021.
The weighted average interest rate for warehouse lines of credit was 4.04% and 4.20% at December 31, 2019 and 2018, respectively. All warehouse lines of credit are collateralized by underlying mortgages and
F-59
Table of Contents
GUILD MORTGAGE COMPANY
NOTES TO CONSOLIDATED FINANCIAL STATEMENTS
(Dollars in thousands, except as otherwise indicated)
related documents. Existing balances on warehouse lines are repaid through the sale proceeds from the collateralized loans held for sale. The Company intends to renew existing warehouse lines prior to expiration. If those lines are not renewed or replaced, that could have a negative impact on the Company’s ability to continue funding new loans. The Company had cash balances of $68.2 million and $31.9 million in its warehouse buy down accounts as offsets to certain lines of credit at December 31, 2019 and 2018, respectively.
The agreements governing the Company’s warehouse lines of credit contain covenants that include certain financial requirements, including maintenance of maximum adjusted leverage ratio, minimum net worth, minimum tangible net worth, minimum current ratio, minimum liquidity, positive quarterly income and limitations on additional indebtedness, dividends, sale of assets, and decline in the mortgage loan servicing portfolio’s fair value. At December 31, 2019 and 2018, management believes the Company was in compliance with all debt covenants.
The Company has an optional short-term financing agreement between FNMA and the lender described as “As Soon As Pooled” (ASAP). The Company can elect to assign FNMA MBS trades to FNMA in advance of settlement and enter into a financing transaction and revenue related to the assignment is deferred until the final pool settlement date. The Company determines utilization based on warehouse availability and cash needs. There was no outstanding balance as of December 31, 2019 and 2018.
| 12. | Notes Payable |
Revolving Notes:
In January 2014, the Company entered into an agreement for a revolving note from one of its warehouse banks, which it can draw upon as needed and has renewed on an annual basis. Borrowings on the revolving note are collateralized by the Company’s GNMA MSRs. Monthly interest on the outstanding balance is calculated using a base rate tied to the LIBOR rate plus the applicable margin, with a floor of 4.50%. The revolving note also has an unused facility fee on the average unused balance, which is also paid quarterly. The unused facility fee is waived if the average outstanding balance exceeds 70% of the available facility. In June 2020, the Company amended and restated the agreement and the revolving note was increased to a maximum committed amount of $135.0 million. The agreement also allows for the Company to increase the committed amount up to $200.0 million. The revolving note is currently scheduled to expire in June 2022. The Company has the option to convert the outstanding balance of the revolving note into a term note at its discretion. At December 31, 2019 and 2018, the Company had $90.0 million and $50.0 million, respectively, in outstanding borrowings on this credit facility.
In July 2017, the Company entered into an agreement for a revolving note of up to $25.0 million from one of its warehouse banks, which it can draw upon as needed and has renewed on an annual basis. In July 2018, the Company amended the agreement to increase the revolving note up to $50.0 million. In July 2020, the Company amended the agreement by extending the expiration date to July 2021 and increasing the revolving note up to $65.0 million. Borrowings on the revolving note are collateralized by the Company’s FHLMC MSRs. Monthly interest on the outstanding balance is calculated using a base rate tied to the LIBOR rate plus the applicable margin. The revolving note also has an unused facility fee on the average unused balance, which is also paid monthly. The unused facility fee is waived if the average outstanding balance exceeds 50% of the available combined warehouse and MSR facility. The lender has the option to convert the outstanding balance of the revolving note into a term note at its discretion. At December 31, 2019 and 2018, the Company had $50.0 million and $25.0 million, respectively, in outstanding borrowings on this credit facility.
F-60
Table of Contents
GUILD MORTGAGE COMPANY
NOTES TO CONSOLIDATED FINANCIAL STATEMENTS
(Dollars in thousands, except as otherwise indicated)
Term Note:
In January 2014, the Company entered into a term note agreement with one of its warehouse banks collateralized by the Company’s FNMA MSRs. In September 2019, the term note was amended and restated, at which time there was an outstanding amount of $78.0 million. The outstanding amount of $78.0 million was rolled into a new term note with a commitment of $100.0 million. The note allows for the committed amount to be increased to a maximum of $150.0 million. The Company can draw on the committed amount through September 2020 and the note matures on September 30, 2022. Interest on the principal is paid monthly and is based upon a margin plus the highest of the (i) Prime Rate, (ii) Federal Funds Rate plus 0.5%, or (iii) the Eurodollar Base Rate plus 1.0%. Principal payments of 5% of the outstanding balance as of September 30, 2020 are due quarterly beginning October 1, 2020, with the remaining principal balance due upon maturity. The term note also has an unused facility fee equal to 0.375% of the average daily unadvanced amount, which is the difference between the committed amount and the amount outstanding. This fee is paid quarterly. At December 31, 2019 and 2018, the Company had an outstanding balance of $78.0 million and $85.0 million, respectively, on this facility.
The minimum calendar year payments and maturities of the Company’s term note are as follows:
| 2020 |
$ | 3,900 | ||
| 2021 |
15,600 | |||
| 2022 |
58,500 | |||
|
|
|
|||
| Total |
$ | 78,000 | ||
|
|
|
13. Income Taxes
The components of income tax expense were as follows for the years ended December 31, 2019 and 2018:
| 2019 | 2018 | |||||||
| Current expense (benefit): |
||||||||
| Federal |
$21,252 | $ (247 | ) | |||||
| State |
4,977 | (210 | ) | |||||
|
|
|
|
|
|||||
| $ 26,229 | $ (457 | ) | ||||||
|
|
|
|
|
|||||
| Deferred (benefit) expense: |
||||||||
| Federal |
$ (19,952 | ) | $ 21,022 | |||||
| State |
(6,024 | ) | 3,695 | |||||
|
|
|
|
|
|||||
| (25,976 | ) | 24,717 | ||||||
|
|
|
|
|
|||||
| Income tax expense |
$ 253 | $ 24,260 | ||||||
|
|
|
|
|
|||||
F-61
Table of Contents
GUILD MORTGAGE COMPANY
NOTES TO CONSOLIDATED FINANCIAL STATEMENTS
(Dollars in thousands, except as otherwise indicated)
The following table presents a reconciliation of the recorded income tax expense of continuing operations to the amount of taxes computed by applying the applicable statutory federal income tax rate of 21.0 percent to income from continuing operations before income taxes, as of December 31, 2019 and 2018, respectively:
| 2019 | 2018 | |||||||||||||||
| Amount | Percent | Amount | Percent | |||||||||||||
| Amount of statutory rate |
$ 1,171 | 21.0 | % | $20,494 | 21.0 | % | ||||||||||
| State income taxes, net of federal tax benefit |
262 | 4.7 | % | 3,904 | 4.0 | % | ||||||||||
| Federal and state tax credits, net of federal tax benefit |
(387 | ) | (6.9 | )% | (236 | ) | (0.2 | )% | ||||||||
| Change in blended state tax rate, net of federal benefit |
(1,122 | ) | (20.1 | )% | (1,109 | ) | (1.1 | )% | ||||||||
| Other, net |
329 | 5.9 | % | 1,207 | 1.2 | % | ||||||||||
|
|
|
|
|
|
|
|
|
|||||||||
| $ 253 | 4.5 | % | $24,260 | 24.9 | % | |||||||||||
|
|
|
|
|
|
|
|
|
|||||||||
The tax effects of significant temporary differences which gave rise to the Company’s deferred tax assets and liabilities are as follows at December 31, 2019 and 2018:
| 2019 | 2018 | |||||||
| Deferred tax assets: |
||||||||
| Mortgage loans held for sale |
$ | 6,969 | $ | 6,078 | ||||
| Intangible assets |
1,130 | 386 | ||||||
| Accrued compensation and benefits |
2,060 | 2,490 | ||||||
| Deferred compensation |
1,464 | 1,613 | ||||||
| Other accrued liabilities |
916 | 587 | ||||||
| R&D credit carryforward |
— | 260 | ||||||
| Non operating loss carryforward |
— | 746 | ||||||
|
|
|
|
|
|||||
| Deferred tax assets |
12,539 | 12,160 | ||||||
|
|
|
|
|
|||||
| Deferred tax liabilities: |
||||||||
| Mortgage servicing rights |
$ | 94,094 | $ | 122,105 | ||||
| Trading securities |
23 | 19 | ||||||
| Derivatives |
3,518 | 525 | ||||||
| Property and equipment |
1,182 | 1,765 | ||||||
|
|
|
|
|
|||||
| Deferred tax liabilities |
98,817 | 124,414 | ||||||
|
|
|
|
|
|||||
| Net deferred tax liabilities |
$ | 86,278 | $ | 112,254 | ||||
|
|
|
|
|
|||||
In assessing the realizability of deferred tax assets, management considers whether it is more likely than not that some portion or all of the deferred tax assets will not be realized. The ultimate realization of deferred tax assets is dependent upon the generation of future taxable income during the periods in which those temporary differences become deductible. Management considers the scheduled reversal of deferred tax liabilities including the impact of available carryback and carryforward periods. Based upon the level of historical taxable income and projections for future taxable income over the periods in which the deferred tax assets are deductible, management believes it is more likely than not that the Company will realize the benefits of these deductible differences.
The Company had approximately $3.1 million and $2.0 million of federal and various state net operating loss carryforwards, respectively, at December 31, 2018. The federal and state net operating loss carryforwards are anticipated to be fully utilized upon finalization of the December 31, 2019 tax returns.
F-62
Table of Contents
GUILD MORTGAGE COMPANY
NOTES TO CONSOLIDATED FINANCIAL STATEMENTS
(Dollars in thousands, except as otherwise indicated)
The federal net operating loss carryforward has an indefinite carryforward period and the various state net operating loss carryforwards expire beginning in 2038. Additionally, the Company had approximately $0.2 million of federal and California tax credits, respectively at December 2018, which expire in 2038 for federal and have an indefinite carryforward period for California. The federal and California tax credits are anticipated to be fully utilized upon finalization of the December 31, 2019 tax returns.
The Company records interest related to unrecognized tax benefits in interest expense and records penalties as a component of income taxes. There are no unrecognized tax benefits as of December 31, 2019, and there were no changes in unrecognized tax benefits during the year. The Company is required to analyze all open years, as defined by the statutes of limitations, for all major jurisdictions, which includes federal and state jurisdictions. The Company is no longer subject to federal examinations prior to 2016 or for state examinations prior to 2015.
14. Employee Benefit Plans
Defined Contribution Plan
The Company has a 401(k) profit sharing plan covering substantially all employees. Employees may contribute amounts subject to certain Internal Revenue Service and plan limitations. The Company may make discretionary matching and nonelective contributions. For the years ended December 31, 2019 and 2018, the Company contributed $5.9 million and $5.8 million to the plan, respectively.
Deferred Compensation Plan
The Company has a deferred compensation plan for executives which was frozen effective December 31, 2007. Plan assets consist of phantom Class A member units in Guild Management, LLC. The units are allocated to specific participants and the values of the units are determined in accordance with the plan documents which is based on a multiple of Guild Mortgage Company, LLC’s equity value. Distribution of a participant’s vested balance is payable in a single lump sum upon death or disability; termination of employment; retirement after attaining age 65 (55 for participants who had an account balance in the plan as of May 1, 2001); or upon termination of the plan.
In 2017, the Company commenced a Non-Qualified Deferred Compensation Plan for certain highly compensated executives and employees that allows the participants to defer a portion of their earnings. Distribution of a participant’s vested balance is payable in a single lump sum upon death or disability; termination of employment; retirement; or upon termination of the plan.
Guild Equity Appreciation Rights Plan
In 2013, the Company established the Guild Equity Appreciation Rights (“GEARs”) Plan for certain executives that compensates participants with GEARs that, if vested, will ultimately be settled in cash on the final vesting date. The awards have a five-year vesting period in addition to annual performance vesting conditions. Compensation expense related to the GEARs awards is recognized over the five-year vesting period based on the change in the fair value of the award and the likelihood of achieving the performance vesting criteria.
In 2017, the Company established a new GEARs Plan for certain executives compensated with GEARs that will ultimately be settled in cash at maturity. Maturity is the earlier of (i) a change of control; (ii) the participant’s retirement; (iii) the participant’s death; (iv) the determination that the participant has suffered a disability; or (v) the involuntary termination of the participant’s employment with the Company and its subsidiaries without cause. The awards vest immediately, and compensation related to these GEARs
F-63
Table of Contents
GUILD MORTGAGE COMPANY
NOTES TO CONSOLIDATED FINANCIAL STATEMENTS
(Dollars in thousands, except as otherwise indicated)
awards is recognized over the participant’s service period based on the change in the fair value of the award. For the year ended December 31, 2019, the Company recognized $0.1 million as expense, and for the year ended December 31, 2018, the Company recognized $0.3 million as income for both GEARs plans, which is included within salaries, commissions and benefits in the Consolidated Statements of Income.
15. Commitments and Contingencies
Commitments to Extend Credit
The Company enters into interest rate lock commitments with customers who have applied for residential mortgage loans and meet certain credit and underwriting criteria. These commitments expose the Company to market risk if interest rates change and the loan is not economically hedged or committed to an investor. The Company is also exposed to credit loss if the loan is originated and not sold to an investor and the customer does not perform. The collateral upon extension of credit typically consists of a first deed of trust in the mortgagor’s residential property. Commitments to originate loans do not necessarily reflect future cash requirements as some commitments are expected to expire without being drawn upon. Total commitments to originate loans at December 31, 2019 and 2018 approximated $1.5 billion and $0.8 billion, respectively.
The Company manages the interest rate price risk associated with its outstanding interest rate lock commitments and loans held for sale by entering into derivative loan instruments such as forward loan sales commitments, mandatory delivery commitments, options and futures contracts. Total commitments related to these derivatives at December 31, 2019 and 2018 approximated $2.0 billion and $0.8 billion, respectively.
Leases
The Company leases office space and equipment under noncancelable and cancelable operating agreements expiring at various dates through 2030. Rent expense amounted to $29.6 million and $28.4 million for the years ended December 31, 2019 and 2018, respectively, and is included within occupancy, equipment and communication expense in the Consolidated Statements of Income.
Future minimum rental payments under the noncancelable operating leases are as follows at December 31, 2019:
| 2020 |
$ | 26,620 | ||
| 2021 |
22,282 | |||
| 2022 |
17,541 | |||
| 2023 |
13,360 | |||
| 2024 |
9,625 | |||
| Thereafter |
34,467 | |||
|
|
|
|||
| $ | 123,895 | |||
|
|
|
Legal
The Company is involved in various lawsuits arising in the ordinary course of business. While the ultimate results of these lawsuits cannot be predicted with certainty, management does not expect that these matters will have a material adverse effect on the consolidated financial position or results of operations of the Company.
F-64
Table of Contents
GUILD MORTGAGE COMPANY
NOTES TO CONSOLIDATED FINANCIAL STATEMENTS
(Dollars in thousands, except as otherwise indicated)
U.S. ex rel. Dougherty v. Guild Mortgage Company, No. 16-cv-02909 (S.D. Cal.)
On May 18, 2016, the U.S. Department of Justice (“DOJ”), on behalf of HUD (together, the “government”), filed a Complaint-in-Intervention (“Intervention Complaint”) in a pending qui tam action against the Company under the False Claims Act (“FCA”), 31 U.S.C. §§ 3729-3733. The Intervention Complaint, filed in the U.S. District Court for the District of Columbia, alleges FCA violations in connection with the underwriting and origination of certain residential mortgage loans that the Company endorsed for Federal Housing Administration (“FHA”) insurance. The Intervention Complaint alleges violations of Sections 3729 (a)(l)(A) and (B) of the FCA, breach of common law fiduciary duty, and breach of contract. The government’s claims arise from the Company’s origination of residential mortgage loans, which the Company subsequently endorsed for FHA insurance between January 1, 2006, and December 31, 2011. The Company believes the FCA and common law claims are without merit.
On August 10, 2016, the Company filed motions to dismiss the government’s Intervention Complaint and the Relator’s Third Amended Complaint. In March 2018, the Court stayed the case pending the Ninth Circuit’s determination of the appeal in Rose v Stephens Institute (No. 17-15111). On August 24, 2018, the ruling in the Rose case was issued and the Court lifted its self-imposed stay. On March 4, 2019, the government filed an amended complaint which Guild responded to on March 22, 2019 reasserting that the claims were without merit. Guild’s motion to dismiss was denied by the court in September 2019. Discovery began in December 2019 and will continue through December 2, 2020.
16. Related Party Transactions
In November 2014, one of the Company’s executives retired. Other executives of the Company had the option and executed their right to purchase the retiring executive’s units in Guild Management, LLC, an indirect parent company of the Company. The purchase was funded by the Company and, in return, the Company received a note receivable from Guild Management, LLC for approximately $2.5 million. The note is due in 2024 and is included within Other Assets on the Consolidated Balance Sheets.
In April 2017, Guild Mortgage Company, LLC, the Company’s parent company, sold units to Guild Management III, LLC for $2.3 million in consideration of which $1.2 million was advanced by the Company in exchange for notes receivable from its members. These members fully paid back the notes and accrued interest during 2019. At December 31, 2018, these members owed $0.2 on these notes which is included within Other Assets on the Consolidated Balance Sheets.
On January 1, 2019, one of the Company’s executives retired, which triggered a repurchase of the executive’s equity in Guild Management, LLC, and a payout of deferred compensation. The Company’s parent company, Guild Mortgage Company, LLC, sold 13.7038 shares of the Company to the executive in exchange for the executive’s equity in Guild Management, LLC. The executive in turn sold the Company’s shares back to the Company in exchange for a promissory note of $8.0 million, which is to be paid over 16 quarters. During 2019, the Company made payments of $1.6 million to the executive, and $6.6 million remained as of December 31, 2019. In connection with the executive’s retirement, Company made a one-time payment of $2.0 million to the executive in connection with her participation in the deferred compensation plans.
17. Minimum Net Worth Requirements
Certain secondary market investors and state regulators require the Company to maintain minimum net worth and capital requirements. To the extent that these requirements are not met, secondary market investors and/or the state regulators may utilize a range of remedies including sanctions, and/or
F-65
Table of Contents
GUILD MORTGAGE COMPANY
NOTES TO CONSOLIDATED FINANCIAL STATEMENTS
(Dollars in thousands, except as otherwise indicated)
suspension or termination of selling and servicing agreements, which may prohibit the Company from originating, securitizing or servicing these specific types of mortgage loans.
The Company is subject to the following minimum net worth, minimum capital ratio and minimum liquidity requirements established by the Federal Housing Finance Agency for Fannie Mae and Freddie Mac Seller/Servicers, and Ginnie Mae for single family issuers.
Minimum Net Worth
The minimum net worth requirement for Fannie Mae and Freddie Mac is defined as follows:
| • | Base of $2,500 plus 25 basis points of outstanding UPB for total loans serviced. |
| • | Adjusted/Tangible Net Worth comprises of total equity less goodwill, intangible assets, affiliate receivables and certain pledged assets. |
The minimum net worth requirement for Ginnie Mae is defined as follows:
| • | Base of $2,500 plus 35 basis points of the issuer’s total single-family effective outstanding obligations. |
| • | Adjusted/Tangible Net Worth comprises of total equity less goodwill, intangible assets, affiliate receivables and certain pledged assets. |
Minimum Capital Ratio
| • | For Fannie Mae, Freddie Mac and Ginnie Mae the Company is also required to hold a ratio of Adjusted/Tangible Net Worth to Total Assets greater than 6%. |
Minimum Liquidity
The minimum liquidity requirement for Fannie Mae and Freddie Mac is defined as follows:
| • | 3.5 basis points of total Agency servicing. |
| • | Incremental 200 basis points of total nonperforming Agency, measured as 90 plus day delinquencies, servicing in excess of 6% of the total Agency servicing UPB. |
| • | Allowable assets for liquidity may include: cash and cash equivalents (unrestricted); available for sale or held for trading investment grade securities (e.g., Agency MBS, Obligations of GSEs, US Treasury Obligations); and unused/available portion of committed servicing advance lines. |
The minimum liquidity requirement for Ginnie Mae is defined as follows:
| • | Maintain liquid assets equal to the greater of $1,000 or 10 basis points of our outstanding single-family MBS. |
The most restrictive of the minimum net worth and capital requirements require the Company to maintain a minimum adjusted net worth balance of $73,118 and $69,954 as of December 31, 2019 and 2018, respectively. As of December 31, 2019 and 2018, the Company was in compliance with this requirement.
F-66
Table of Contents
GUILD MORTGAGE COMPANY
NOTES TO CONSOLIDATED FINANCIAL STATEMENTS
(Dollars in thousands, except as otherwise indicated)
18. Additional Non-Cash Disclosures
For the years ended December 31, 2019 and 2018, the Company had the following non-cash transactions that are not included in the Consolidated Statements of Cash Flows.
| 2019 | 2018 | |||||||
| GNMA inventory obtained due to delinquent status of GNMA serviced loans |
$ | 290,945 | $ | 221,559 | ||||
| GNMA inventory removed from delinquent status |
(116,138 | ) | (83,896 | ) | ||||
| GNMA real estate owned resolved through finalized foreclosure sale (conveyed to HUD) |
(11,440 | ) | (12,854 | ) | ||||
| Reduction in GNMA inventory due to loan removal from pool |
(83,895 | ) | (128,494 | ) | ||||
|
|
|
|
|
|||||
| Net (decrease) increase of GNMA payable due to receipt or resolution of GNMA inventory and GNMA real estate owned |
$ | 79,472 | $ | (3,685 | ) | |||
|
|
|
|
|
|||||
| GNMA real estate owned obtained through foreclosure sale of GNMA serviced loans |
$ | 7,617 | $ | 11,030 | ||||
|
|
|
|
|
|||||
19. Segments
ASC 280, Segment Reporting, establishes the standards for reporting information about segments in financial statements. In applying the criteria set forth in that guidance, the Company has determined that it has two reportable segments — Loan Origination and Servicing.
Origination — The Company operates its loan origination business in approximately forty-eight states. Its licensed sales professionals and support staff cultivate deep relationships with referral partners and clients and provide a customized approach to the loan transaction whether it is a purchase or refinance. The origination segment is primarily responsible for loan origination, acquisition and sale activities.
Servicing — The Company services loans out of its corporate office in San Diego, California. Properties of the loans serviced by the Company are disbursed throughout the United States and as of December 31, 2019 the Company serviced at least one loan in forty-eight different states. The servicing segment provides a steady stream of cash flow to support the origination segment and more importantly it allows for the Company to build long standing client relationships that drive repeat and referral business back to the origination segment to recapture the client’s next mortgage transaction. The servicing segment is primarily responsible for the servicing activities of all loans in the Company’s servicing portfolio which includes, but is not limited to, collection and remittance of loan payments, managing borrower’s impound accounts for taxes and insurance, loan payoffs, loss mitigation and foreclosure activities.
The Company does not allocate assets to its reportable segments as they are not included in the review performed by the Chief Operating Decision Maker for purposes of assessing segment performance and allocating resources. The balance sheet is managed on a consolidated basis and is not used in the context of segment reporting. The Company also does not allocate certain corporate expenses, which are represented by All Other in the tables below.
F-67
Table of Contents
GUILD MORTGAGE COMPANY
NOTES TO CONSOLIDATED FINANCIAL STATEMENTS
(Dollars in thousands, except as otherwise indicated)
The following table presents the financial performance and results by segment for the year ended December 31, 2019:
| Origination | Servicing | Total Segments |
All Other | Total | ||||||||||||||||
| Revenue |
||||||||||||||||||||
| Loan origination fees and gain on sale of loans, net |
$ | 817,293 | $ | 3,521 | $ | 820,814 | $ | — | $ | 820,814 | ||||||||||
| Loan servicing and other fees |
— | 142,705 | 142,705 | — | 142,705 | |||||||||||||||
| Valuation adjustment of mortgage servicing rights |
— | (255,219 | ) | (255,219 | ) | — | (255,219 | ) | ||||||||||||
| Interest income (expense) |
9,702 | 2,674 | 12,376 | (8,980 | ) | 3,396 | ||||||||||||||
| Other income |
38 | — | 38 | 1,155 | 1,193 | |||||||||||||||
|
|
|
|
|
|
|
|
|
|
|
|||||||||||
| Net revenue |
827,033 | (106,319 | ) | 720,714 | (7,825 | ) | 712,889 | |||||||||||||
| Expenses |
||||||||||||||||||||
| Salaries, commissions and benefits |
548,056 | 15,538 | 563,594 | 14,576 | 578,170 | |||||||||||||||
| General and administrative |
43,028 | 10,307 | 53,335 | 10,648 | 63,983 | |||||||||||||||
| Occupancy, equipment and communication |
48,115 | 2,078 | 50,193 | 3,485 | 53,678 | |||||||||||||||
| Depreciation and amortization |
6,417 | 326 | 6,743 | 590 | 7,333 | |||||||||||||||
| Provision for foreclosure losses |
— | 3,895 | 3,895 | — | 3,895 | |||||||||||||||
| Income tax expense |
— | — | — | 253 | 253 | |||||||||||||||
|
|
|
|
|
|
|
|
|
|
|
|||||||||||
| Net income (loss) |
$ | 181,417 | $ | (138,463 | ) | $ | 42,954 | $ | (37,377 | ) | $ | 5,577 | ||||||||
|
|
|
|
|
|
|
|
|
|
|
|||||||||||
The following table presents the financial performance and results by segment for the year ended December 31, 2018:
| Origination | Servicing | Total Segments |
All Other | Total | ||||||||||||||||
| Revenue |
||||||||||||||||||||
| Loan origination fees and gain on sale of loans, net |
$ | 614,004 | $ | 2,604 | $ | 616,608 | $ | — | $ | 616,608 | ||||||||||
| Loan servicing and other fees |
— | 123,681 | 123,681 | — | 123,681 | |||||||||||||||
| Valuation adjustment of mortgage servicing rights |
— | (17,050 | ) | (17,050 | ) | — | (17,050 | ) | ||||||||||||
| Interest income (expense) |
9,422 | (2,728 | ) | 6,694 | (7,020 | ) | (326 | ) | ||||||||||||
| Other income (expense) |
33 | — | 33 | (27 | ) | 6 | ||||||||||||||
|
|
|
|
|
|
|
|
|
|
|
|||||||||||
| Net revenue |
623,459 | 106,507 | 729,966 | (7,047 | ) | 722,919 | ||||||||||||||
| Expenses |
||||||||||||||||||||
| Salaries, commissions and benefits |
480,280 | 13,716 | 493,996 | 16,257 | 510,253 | |||||||||||||||
| General and administrative |
33,419 | 8,566 | 41,985 | 8,991 | 50,976 | |||||||||||||||
| Occupancy, equipment and communication |
46,986 | 1,893 | 48,879 | 3,604 | 52,483 | |||||||||||||||
| Depreciation and amortization |
6,392 | 112 | 6,504 | 676 | 7,180 | |||||||||||||||
| Provision for foreclosure losses |
— | 4,434 | 4,434 | — | 4,434 | |||||||||||||||
| Income tax expense |
— | — | — | 24,260 | 24,260 | |||||||||||||||
|
|
|
|
|
|
|
|
|
|
|
|||||||||||
| Net income (loss) |
$ | 56,382 | $ | 77,786 | $ | 134,168 | $ | (60,835 | ) | $ | 73,333 | |||||||||
|
|
|
|
|
|
|
|
|
|
|
|||||||||||
F-68
Table of Contents
GUILD MORTGAGE COMPANY
NOTES TO CONSOLIDATED FINANCIAL STATEMENTS
(Dollars in thousands, except as otherwise indicated)
20. Subsequent Events
The Company has evaluated subsequent events from the balance sheet date through August 21, 2020, the date on which the financial statements were issued. In March 2020, the World Health Organization (“WHO”) declared the outbreak of a novel coronavirus (COVID-19) as a pandemic, which continues to spread throughout the United States. Through August 21, 2020, the Company remains fully functional in both its origination and servicing operations. While the pandemic could cause for certain branches to temporarily close, most of the significant job functions can be performed remotely. The Company has taken steps to ensure business can continue as necessary should branches be forced to temporarily close. The Company continues to monitor guidance published by the WHO, Centers for Disease Control and Prevention, local and federal government agencies and the Mortgage Bankers Association and is in continual communication with its investors regarding the developments in the mortgage industry.
21. Events (Unaudited) Subsequent to the Date of Report of the Independent Registered Public Accounting Firm
United States of America, ex rel. Kevin G. Dougherty, et al. v. Guild Mortgage Company
This matter is further discussed in note 15 to the consolidated financial statements. On October 20, 2020, a settlement agreement with respect to this lawsuit was executed and, pursuant to the terms of the settlement agreement, the Company agreed to make a cash payment in the aggregate amount of $24.9 million to the U.S. Department of Justice and the U.S. Department of Housing and Urban Development, of which approximately $2.0 million is expected to be covered by the Company’s insurance. As of and for the three and nine month periods ended September 30, 2020, the Company has accrued $22.9 million associated with the settlement within accounts payable and accrued expenses and as a reduction to loan origination fees and gain on sale of loans, net.
F-69
Table of Contents
Table of Contents
PART II
INFORMATION NOT REQUIRED IN PROSPECTUS
Item 13. Other Expenses of Issuance.
The following table sets forth the various expenses, other than the underwriting discount, payable in connection with the offering contemplated by this registration statement. All of the fees set forth below are estimates except for the SEC registration fee, the FINRA fee and the stock exchange listing fee.
| Payable by the registrant |
||||
| SEC registration fee |
$ | 20,262 | ||
| FINRA fee |
$ | 28,359 | ||
| Stock exchange listing fee |
$ | 150,000 | ||
| Blue Sky fees and expenses |
$ | 15,000 | ||
| Printing expenses |
$ | 450,000 | ||
| Legal fees and expenses |
$ | 3,300,000 | ||
| Accounting fees and expenses |
$ | 1,700,000 | ||
| Transfer agent and registrar fees |
$ | 7,500 | ||
| Miscellaneous fees and expenses |
$ | 445,000 | ||
|
|
|
|||
| Total |
$ | 6,116,121 | ||
|
|
|
|||
Item 14. Indemnification of Directors and Officers.
Limitation of Personal Liability of Directors and Indemnification
Section 102(b)(7) of the DGCL permits a corporation to provide in its certificate of incorporation that a director of the corporation shall not be personally liable to the corporation or its stockholders for monetary damages for breach of fiduciary duty as a director, except for liability (1) for any breach of the director’s duty of loyalty to the corporation or its stockholders, (2) for acts or omissions not in good faith or which involve intentional misconduct or a knowing violation of law, (3) under Section 174 of the DGCL (regarding, among other things, the payment of unlawful dividends or unlawful stock purchases or redemptions), or (4) for any transaction from which the director derived an improper personal benefit. Our certificate of incorporation will provide for such limitation of liability.
Section 145(a) of the DGCL empowers a corporation to indemnify any director, officer, employee or agent, or former director, officer, employee or agent, who was or is a party or is threatened to be made a party to any threatened, pending or completed action, suit or proceeding, whether civil, criminal, administrative or investigative (other than an action by or in the right of the corporation), by reason of such person’s service as a director, officer, employee or agent of the corporation, or such person’s service, at the corporation’s request, as a director, officer, employee or agent of another corporation or enterprise, against expenses (including attorneys’ fees), judgments, fines and amounts paid in settlement actually and reasonably incurred by such person in connection with such action, suit or proceeding; provided that such director or officer acted in good faith and in a manner reasonably believed to be in or not opposed to the best interests of the corporation; and, with respect to any criminal action or proceeding, provided that such director or officer had no reasonable cause to believe his or her conduct was unlawful.
Section 145(b) of the DGCL empowers a corporation to indemnify any person who was or is a party or is threatened to be made a party to any threatened, pending or completed action or suit by or in the right of the corporation to procure a judgment in its favor by reason of the fact that such person is or was a director, officer, employee or agent of the corporation, or is or was serving at the request of the corporation as a director, officer, employee or agent of another enterprise, against expenses (including attorneys’ fees) actually and reasonably incurred in connection with the defense or settlement of such action or suit;
II-1
Table of Contents
provided that such director or officer acted in good faith and in a manner he or she reasonably believed to be in or not opposed to the best interests of the corporation, except that no indemnification may be made in respect of any claim, issue or matter as to which such director or officer shall have been adjudged to be liable to the corporation unless and only to the extent that the Delaware Court of Chancery or the court in which such action or suit was brought shall determine upon application that, despite the adjudication of liability but in view of all the circumstances of the case, such director or officer is fairly and reasonably entitled to indemnity for such expenses that the court shall deem proper. Notwithstanding the preceding sentence, except as otherwise provided in our bylaws, we shall be required to indemnify any such person in connection with a proceeding (or part thereof) commenced by such person only if the commencement of such proceeding (or part thereof) by any such person was authorized by the Board of Directors.
Our bylaws will require us to indemnify any person who was or is a party or is threatened to be made a party to or is otherwise involved in any threatened, pending or completed action, suit or proceeding by reason of the fact that he or she is or was a director or officer of Guild, or is or was serving at the request of Guild as a director, officer, trustee, employee or agent of another corporation or of a partnership, joint venture, trust or other enterprise, including service with respect to employee benefit plans maintained or sponsored by Guild, against all expense, liability and loss (including attorneys’ fees, judgments, fines, ERISA excise taxes or penalties and amounts paid or to be paid in settlement) incurred or suffered by such person in connection with such proceeding if the person acted in good faith and in a manner reasonably believed to be in or not opposed to the best interests of Guild and, with respect to any criminal action or proceeding, had no reasonable cause to believe his or her conduct was unlawful.
We will be authorized under our bylaws to purchase and maintain insurance to protect Guild and any current or former director, officer, employee or agent of Guild or another corporation, partnership, joint venture, trust or other enterprise against any expense, liability or loss, whether or not Guild would have the power to indemnify such person against such expense, liability or loss under the DGCL. We believe that these indemnification provisions and the directors’ and officers’ insurance are useful to attract and retain qualified directors and executive officers.
We expect that the underwriting agreement will provide for indemnification of directors and officers of Guild by the underwriters against certain liabilities.
Item 15. Recent Sales of Unregistered Securities.
Set forth below is information regarding securities sold or granted by us within the past three years that were not registered under the Securities Act. Also included is the consideration, if any, received by us for such securities and information relating to the section of the Securities Act, or rule of the SEC, under which exemption from registration was claimed for such sales and grants.
In August 2020, in connection with its formation and prior to the occurrence of the other reorganization transactions, the Issuer sold 100 shares of common stock to Guild Investors, LLC for aggregate consideration of $1. The shares of common stock described above were issued in reliance on the exemption contained in Section 4(a)(2) of the Securities Act on the basis that the transaction did not involve a public offering. No underwriters were involved in the transaction.
Item 16. Exhibits and Financial Statement Schedules.
(a) Exhibits: The list of exhibits set forth under “Exhibit Index” at the end of this Registration Statement is incorporated herein by reference.
II-2
Table of Contents
Item 17. Undertakings.
Insofar as indemnification for liabilities arising under the Securities Act may be permitted to directors, officers and controlling persons of the registrant pursuant to the foregoing provisions, or otherwise, the registrant has been advised that, in the opinion of the SEC, such indemnification is against public policy as expressed in the Securities Act and is, therefore, unenforceable. In the event that a claim for indemnification against such liabilities (other than the payment by the registrant of expenses incurred or paid by a director, officer or controlling person of the registrant in the successful defense of any action, suit or proceeding) is asserted by such director, officer or controlling person in connection with the securities being registered, the registrant will, unless in the opinion of its counsel the matter has been settled by controlling precedent, submit to a court of appropriate jurisdiction the question whether such indemnification by it is against public policy as expressed in the Securities Act and will be governed by the final adjudication of such issue.
The registrant hereby further undertakes that:
(1) For purposes of determining any liability under the Securities Act, the information omitted from the form of prospectus filed as part of this registration statement in reliance upon Rule 430A and contained in a form of prospectus filed by the registrant pursuant to Rule 424(b)(1) or (4) or 497(h) under the Securities Act shall be deemed to be part of this registration statement as of the time it was declared effective; and
(2) For purposes of determining any liability under the Securities Act, each post-effective amendment that contains a form of prospectus shall be deemed to be a new registration statement relating to the securities offered therein, and the offering of such securities at that time shall be deemed to be the initial bona fide offering thereof.
II-3
Table of Contents
EXHIBIT INDEX
II-4
Table of Contents
II-5
Table of Contents
II-6
Table of Contents
II-7
Table of Contents
| * | To be filed by amendment. |
| ** | Previously filed. |
| † | Indicates management contract or compensatory plan. |
| + | Certain portions of this exhibit have been redacted pursuant to Item 601(b)(10)(iv) of Regulation S-K. The Company agrees to furnish supplementally an unredacted copy of the exhibit to the SEC upon its request. |
| # | Certain schedules and exhibits have been omitted pursuant to Item 601(a)(5) of Regulation S-K. The Company agrees to furnish supplementally a copy of any omitted schedule or exhibit to the SEC upon its request. |
II-8
Table of Contents
Pursuant to the requirements of the Securities Act of 1933, the registrant has duly caused this Registration Statement to be signed on its behalf by the undersigned, thereunto duly authorized, in the City of San Diego, State of California, on October 20, 2020.
| GUILD HOLDINGS COMPANY | ||
| By: | /s/ Mary Ann McGarry | |
| Name: | Mary Ann McGarry | |
| Title: | Chief Executive Officer | |
Pursuant to the requirements of the Securities Act of 1933, this registration statement has been signed by the following persons in the capacities indicated on October 20, 2020.
| Signature |
Title | |||
| By: | /s/ Mary Ann McGarry Mary Ann McGarry |
Chief Executive Officer and Director (Principal Executive Officer) | ||
| By: | /s/ Amber Elwell Amber Elwell |
Chief Financial Officer (Principal Financial and Accounting Officer) | ||
| By: | * Patrick Duffy |
Chairman of the Board of Directors | ||
| By: | * Mike Meyer |
Director | ||
| By: | * Terry Schmidt |
President and Director | ||
| *By: | /s/ Amber Elwell Attorney-in-Fact |
|||
II-9