Attached files
| file | filename |
|---|---|
| EX-99.3 - EXHIBIT-99.3 - CITIGROUP INC | c-20201015xex993.htm |
| EX-99.2 - EXHIBIT-99.2 - CITIGROUP INC | c-20201015xex99d2.htm |
| 8-K - FORM 8-K - CITIGROUP INC | c-20201015x8k.htm |
Exhibit 99.1
| Citi | Investor Relations Third Quarter 2020 Earnings Review October 13, 2020 |
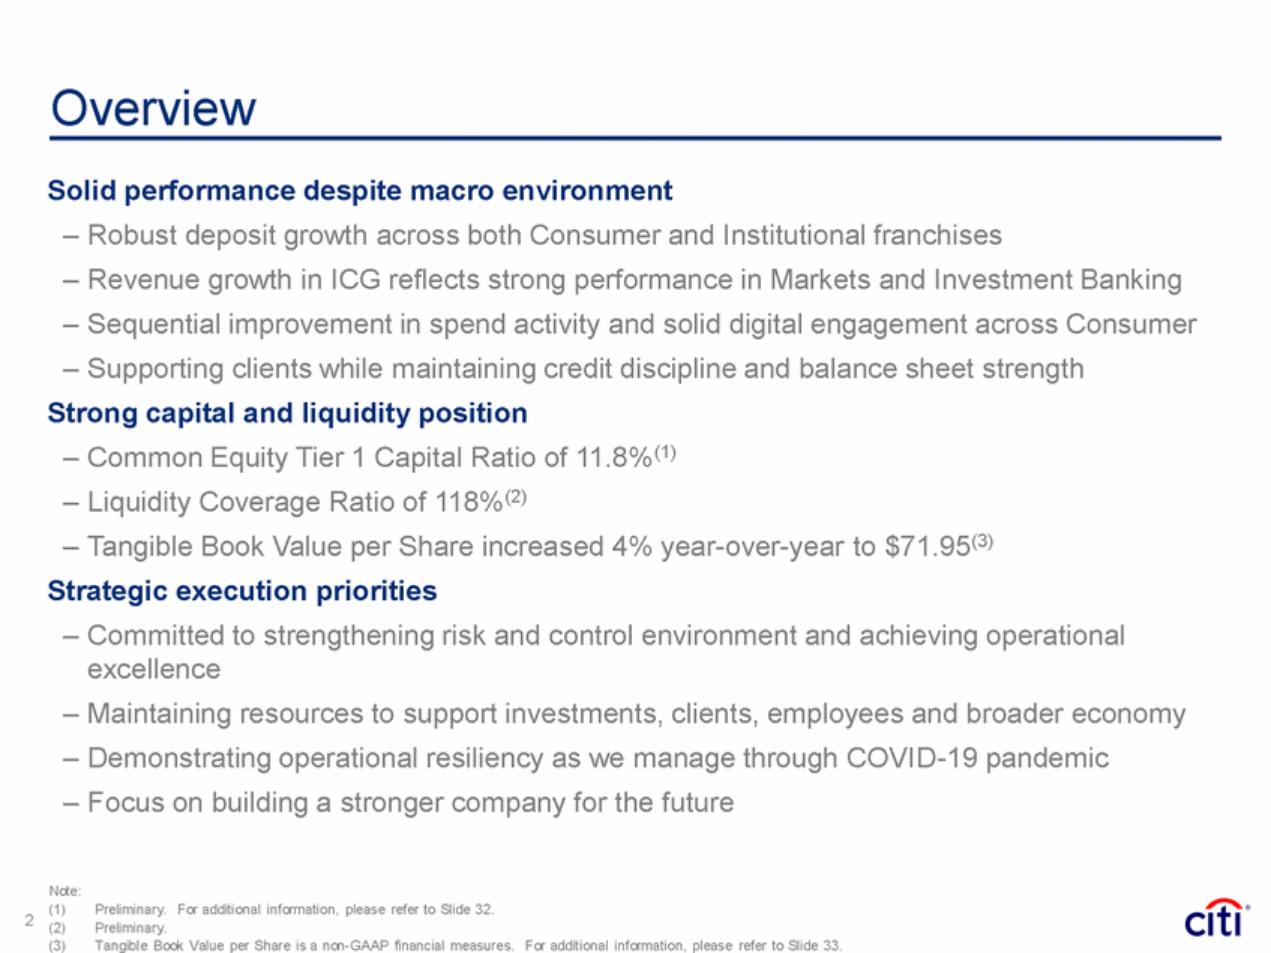
| Overview Solid performance despite macro environment – Robust deposit growth across both Consumer and Institutional franchises – Revenue growth in ICG reflects strong performance in Markets and Investment Banking – Sequential improvement in spend activity and solid digital engagement across Consumer – Supporting clients while maintaining credit discipline and balance sheet strength Strong capital and liquidity position – Common Equity Tier 1 Capital Ratio of 11.8%(1) – Liquidity Coverage Ratio of 118%(2) – Tangible Book Value per Share increased 4% year-over-year to $71.95(3) Strategic execution priorities – Committed to strengthening risk and control environment and achieving operational excellence – Maintaining resources to support investments, clients, employees and broader economy – Demonstrating operational resiliency as we manage through COVID-19 pandemic – Focus on building a stronger company for the future Note: (1) (2) (3) Preliminary. For additional information, please refer to Slide 32. Preliminary. Tangible Book Value per Share is a non-GAAP financial measures. For additional information, please refer to Slide 33. 2 |
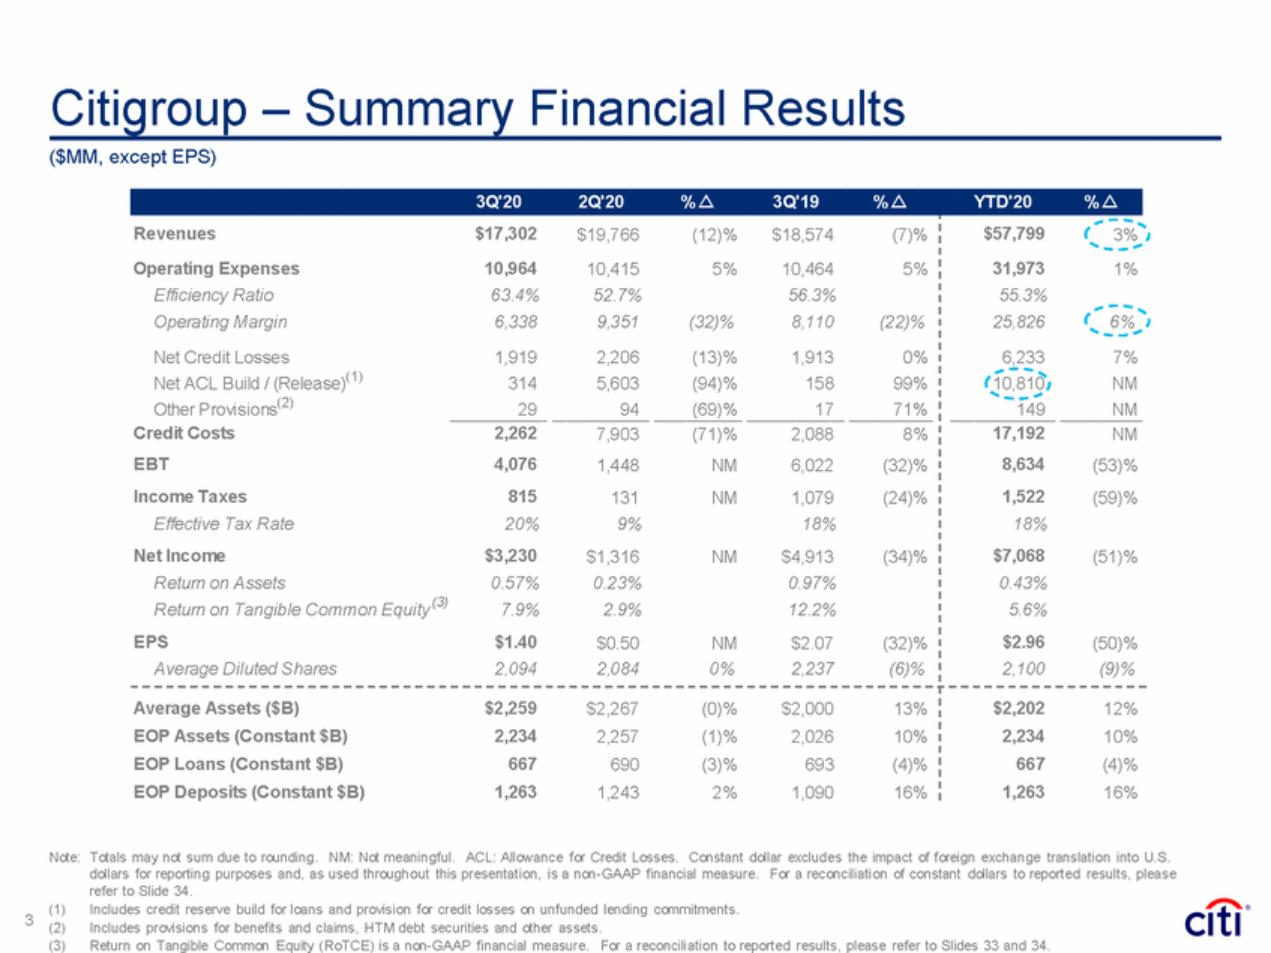
| Citigroup – Summary Financial Results ($MM, except EPS) Note: Totals may not sum due to rounding. NM: Not meaningful. ACL: Allowance for Credit Losses. Constant dollar excludes the impact of foreign exchange translation into U.S. dollars for reporting purposes and, as used throughout this presentation, is a non-GAAP financial measure. For a reconciliation of constant dollars to reported results, please refer to Slide 34. Includes credit reserve build for loans and provision for credit losses on unfunded lending commitments. Includes provisions for benefits and claims, HTM debt securities and other assets. Return on Tangible Common Equity (RoTCE) is a non-GAAP financial measure. For a reconciliation to reported results, please refer to Slides 33 and 34. (1) (2) (3) 3 3Q'20 2Q'20 % r3Q'19 % rYTD'20 % r Revenues $17,302 $19,766 (12)% $18,574 (7)% Operating Expenses 10,964 10,415 5% 10,464 5% Efficiency Ratio 63.4% 52.7% 56.3% Operating Margin 6,338 9,351 (32)% 8,110 (22)% Net Credit Losses 1,919 2,206 (13)% 1,913 0% Net ACL Build / (Release)(1) 314 5,603 (94)% 158 99% Other Provisions(2) 29 94 (69)% 17 71% Credit Costs 2,262 7,903 (71)% 2,088 8% EBT 4,076 1,448 NM 6,022 (32)% Income Taxes 815 131 NM 1,079 (24)% Effective Tax Rate 20% 9% 18% Net Income $3,230 $1,316 NM $4,913 (34)% Return on Assets 0.57% 0.23% 0.97% Return on Tangible Common Equity (3)7.9% 2.9% 12.2% EPS $1.40 $0.50 NM $2.07 (32)% Average Diluted Shares 2,094 2,084 0% 2,237 (6)% $57,799 3% 31,973 1% 55.3% 25,826 6% 6,233 7% 10,810 NM 149 NM 17,192 NM 8,634 (53)% 1,522 (59)% 18% $7,068 (51)% 0.43% 5.6% $2.96 (50)% 2,100 (9)% Average Assets ($B) $2,259 $2,267 (0)% $2,000 13% EOP Assets (Constant $B) 2,234 2,257 (1)% 2,026 10% EOP Loans (Constant $B) 667 690 (3)% 693 (4)% EOP Deposits (Constant $B) 1,263 1,243 2% 1,090 16% $2,202 12% 2,234 10% 667 (4)% 1,263 16% |
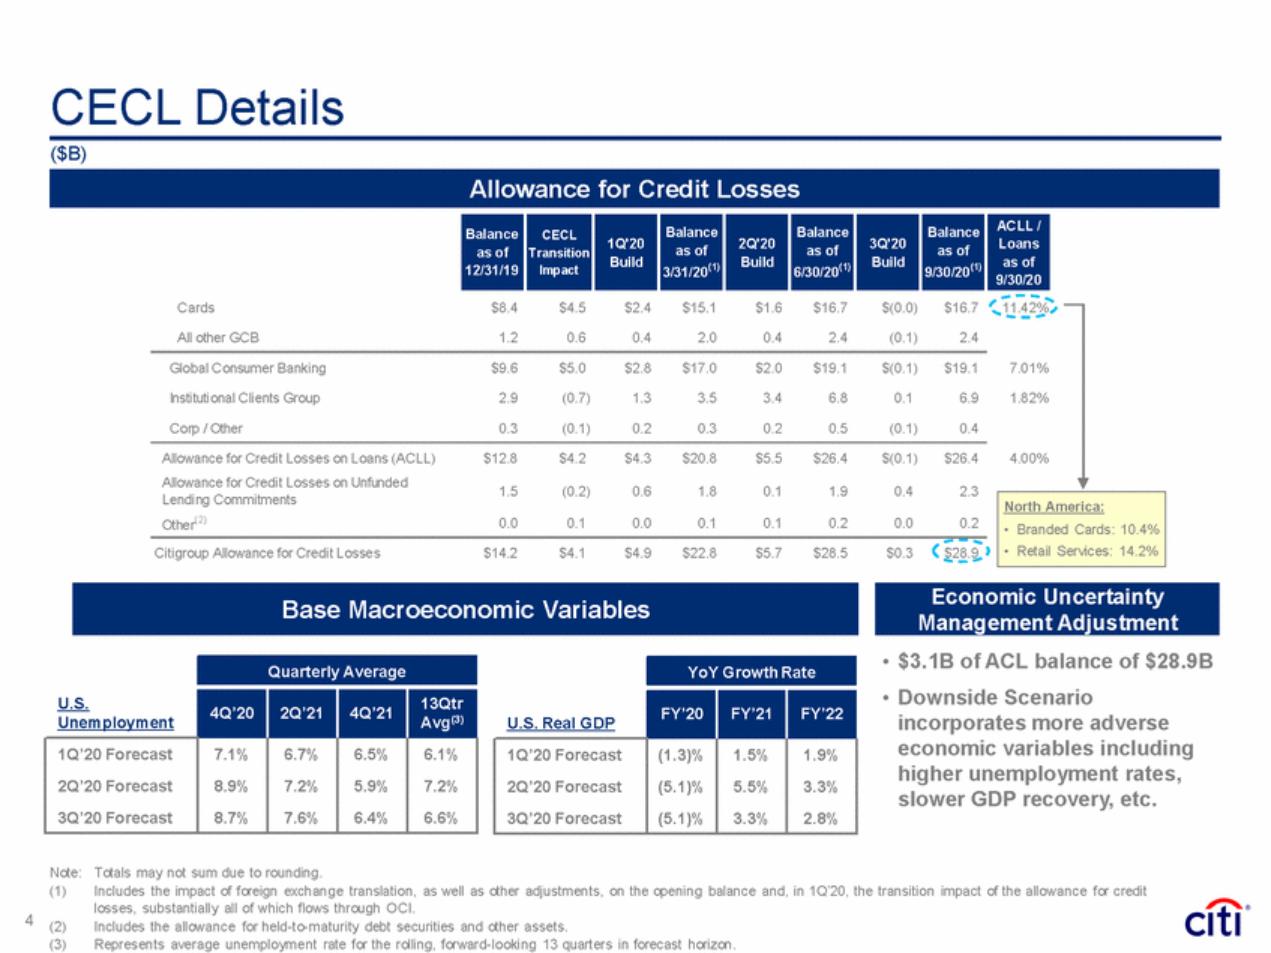
| CECL Details ($B) Loans 9/30/20 Cards $8.4 $4.5 $2.4 $15.1 $1.6 $16.7 $(0.0) $16.7 11.42% All other GCB 1.2 0.6 0.4 2.0 0.4 2.4 (0.1) 2.4 Global Consumer Banking $9.6 $5.0 $2.8 $17.0 $2.0 $19.1 $(0.1) $19.1 7.01% Institutional Clients Group 2.9 (0.7) 1.3 3.5 3.4 6.8 0.1 6.9 1.82% Corp / Other 0.3 (0.1) 0.2 0.3 0.2 0.5 (0.1) 0.4 Allowance for Credit Losses on Loans (ACLL) Allowance for Credit Losses on Unfunded Lending Commitments Other(2) $12.8 $4.2 $4.3 $20.8 $5.5 $26.4 $(0.1) $26.4 4.00% 1.5 (0.2) 0.6 1.8 0.1 1.9 0.4 2.3 0.0 0.1 0.0 0.1 0.1 0.2 0.0 0.2 Citigroup Allowance for Credit Losses $14.2 $4.1 $4.9 $22.8 $5.7 $28.5 $0.3 $28.9 Management Adjustment • $3.1B of ACL balance of $28.9B • Downside Scenario incorporates more adverse economic variables including higher unemployment rates, slower GDP recovery, etc. Note: (1) Totals may not sum due to rounding. Includes the impact of foreign exchange translation, as well as other adjustments, on the opening balance and, in 1Q’20, the transition impact of the allowance for credit losses, substantially all of which flows through OCI. Includes the allowance for held-to-maturity debt securities and other assets. Represents average unemployment rate for the rolling, forward-looking 13 quarters in forecast horizon. 4 (2) (3) YoY Growth Rate U.S. Real GDP FY’20 FY’21 FY’22 1Q’20 Forecast 2Q’20 Forecast 3Q’20 Forecast (1.3)% (5.1)% (5.1)% 1.5% 5.5% 3.3% 1.9% 3.3% 2.8% U.S. Unemployment Quarterly Average 4Q’20 2Q’21 4Q’21 13Qtr Avg(3) 1Q’20 Forecast 2Q’20 Forecast 3Q’20 Forecast 7.1% 8.9% 8.7% 6.7% 7.2% 7.6% 6.5% 5.9% 6.4% 6.1% 7.2% 6.6% Economic Uncertainty Base Macroeconomic Variables North America: • Branded Cards: 10.4% • Retail Services: 14.2% Balance as of 12/31/19 CECL Transition Impact 1Q'20 Build Balance as of 3/31/20(1) 2Q'20 Build Balance as of 6/30/20(1) 3Q'20 Build Balance as of 9/30/20(1) ACLL / as of Allowance for Credit Losses |
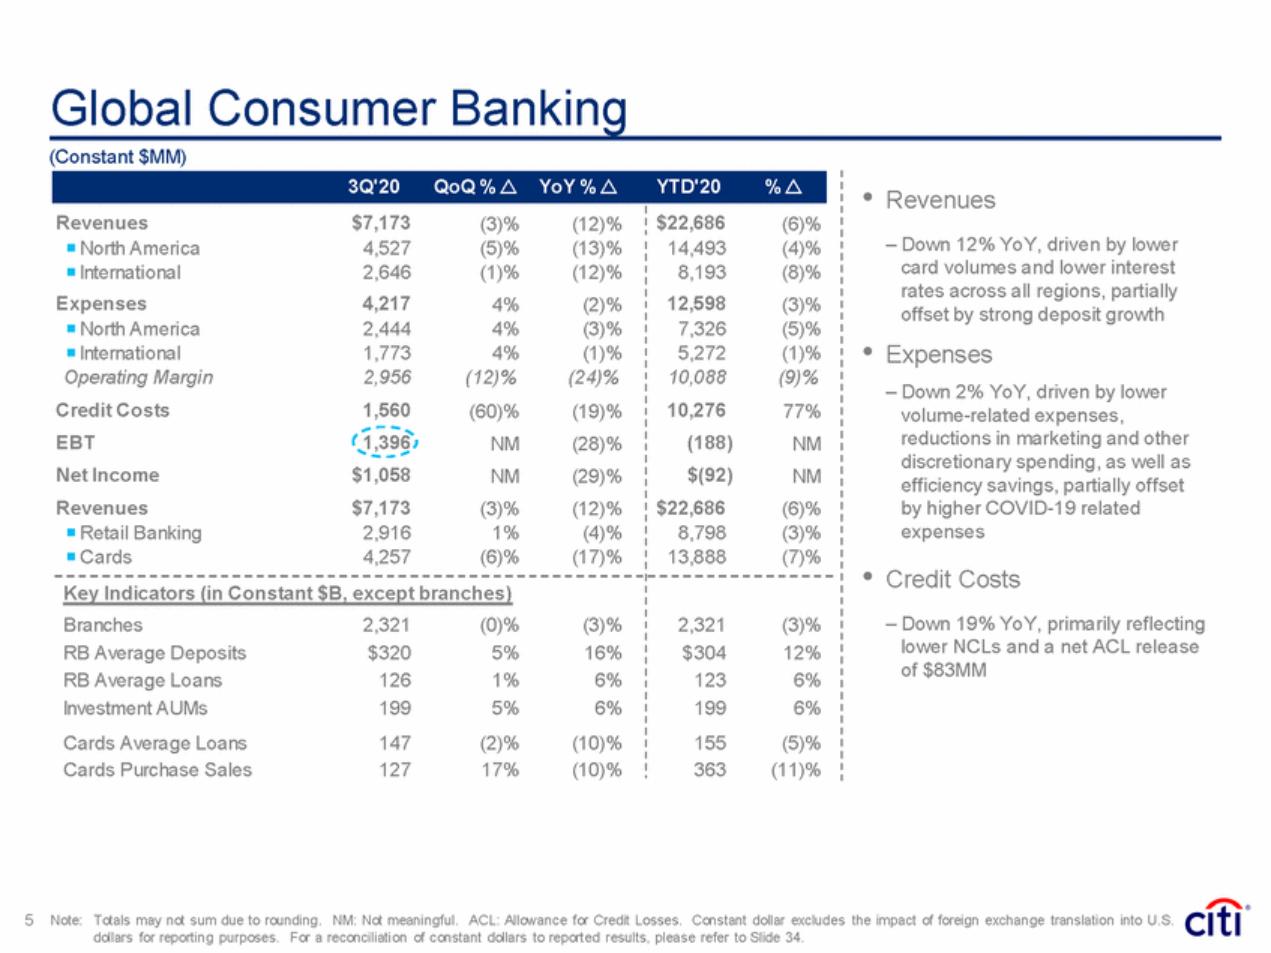
| Global Consumer Banking (Constant $MM) • Revenues – Down 12% YoY, driven by lower card volumes and lower interest rates across all regions, partially offset by strong deposit growth Expenses – Down 2% YoY, driven by lower volume-related expenses, reductions in marketing and other discretionary spending, as well as efficiency savings, partially offset by higher COVID-19 related expenses 14,493 8,193 12,598 7,326 5,272 10,088 10,276 (188) $(92) $22,686 8,798 13,888 (4)% (8)% (3)% (5)% (1)% (9)% 77% NM NM (6)% (3)% (7)% • • Credit Costs – Down 19% YoY, primarily reflecting lower NCLs and a net ACL release of $83MM 5 Note: Totals may not sum due to rounding. NM: Not meaningful. ACL: Allowance for Credit Losses. Constant dollar excludes the impact of foreign exchange translation into U.S. dollars for reporting purposes. For a reconciliation of constant dollars to reported results, please refer to Slide 34. 3Q'20QoQ % rYoY % rYTD'20% r Revenues$7,173(3)%(12)% North America4,527(5)%(13)% International2,646(1)%(12)% Expenses4,2174%(2)% North America2,4444%(3)% International1,7734%(1)% Operating Margin 2,956 (12)% (24)% Credit Costs 1,560 (60)% (19)% EBT 1,396 NM (28)% Net Income $1,058 NM (29)% Revenues$7,173(3)%(12)% Retail Banking2,9161%(4)% Cards4,257(6)%(17)% $22,686(6)% Key Indicators (in Constant $B, except branches) Branches 2,321 (0)% (3)% RB Average Deposits $320 5% 16% RB Average Loans 126 1% 6% Investment AUMs 199 5% 6% Cards Average Loans 147 (2)% (10)% Cards Purchase Sales 127 17% (10)% 2,321(3)% $30412% 1236% 1996% 155(5)% 363(11)% |
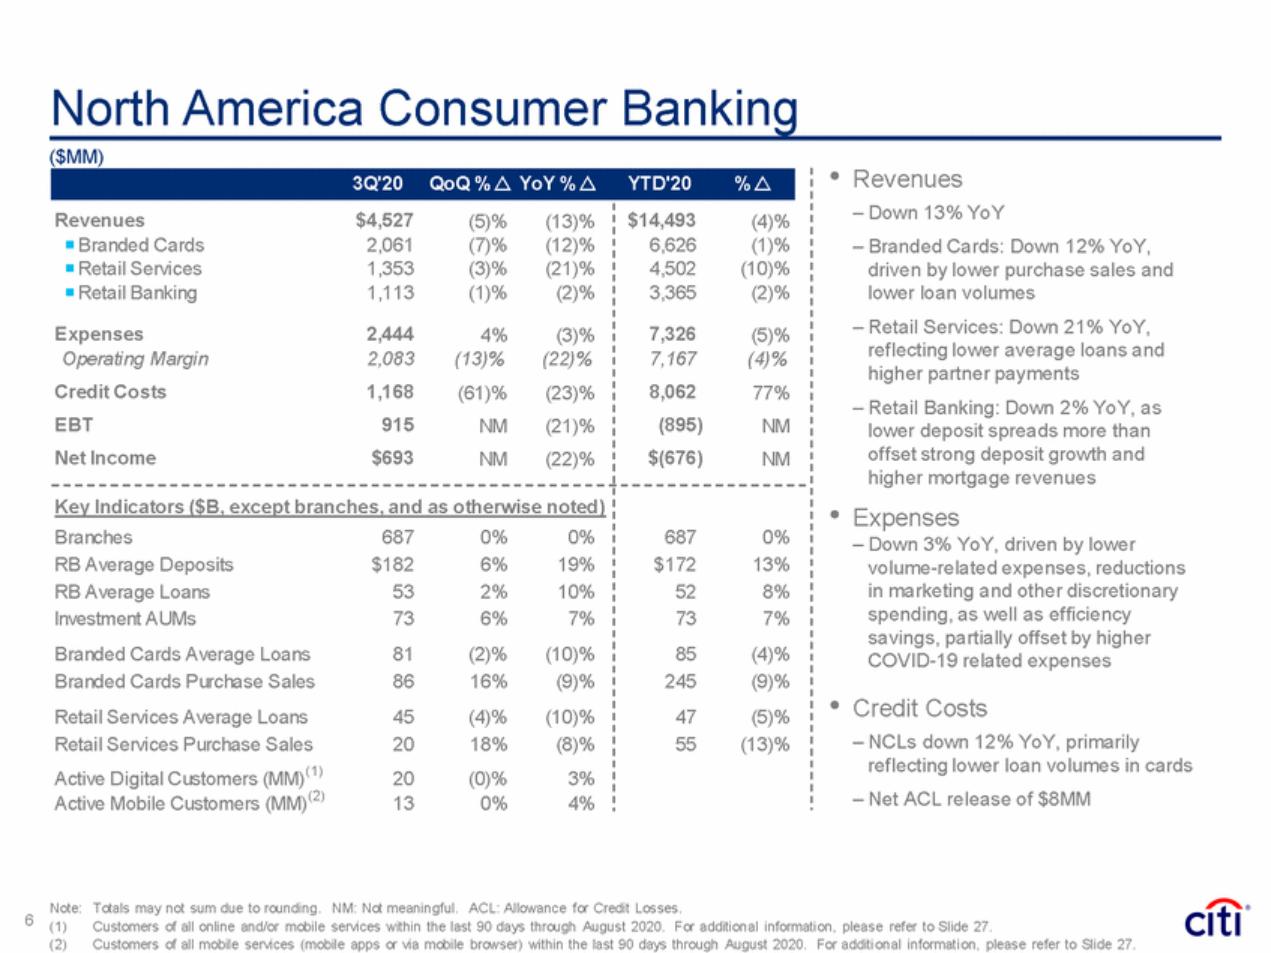
| North America Consumer Banking ($MM) • Revenues – Down 13% YoY – Branded Cards: Down 12% YoY, driven by lower purchase sales and lower loan volumes – Retail Services: Down 21% YoY, reflecting lower average loans and higher partner payments – Retail Banking: Down 2% YoY, as lower deposit spreads more than offset strong deposit growth and higher mortgage revenues Expenses – Down 3% YoY, driven by lower volume-related expenses, reductions in marketing and other discretionary spending, as well as efficiency savings, partially offset by higher COVID-19 related expenses • • Credit Costs – NCLs down 12% YoY, primarily reflecting lower loan volumes in cards – Net ACL release of $8MM Note: (1) (2) Totals may not sum due to rounding. NM: Not meaningful. ACL: Allowance for Credit Losses. 6 Customers of all online and/or mobile services within the last 90 days through August 2020. For additional information, please refer to Slide 27. Customers of all mobile services (mobile apps or via mobile browser) within the last 90 days through August 2020. For additi onal information, please refer to Slide 27. 3Q'20 QoQ % r YoY % rYTD'20 % r Revenues $4,527 (5)% (13)% Branded Cards 2,061 (7)% (12)% Retail Services 1,353 (3)% (21)% Retail Banking 1,113 (1)% (2)% Expenses 2,444 4% (3)% Operating Margin 2,083 (13)% (22)% Credit Costs 1,168 (61)% (23)% EBT 915 NM (21)% Net Income $693 NM (22)% $14,493 (4)% 6,626 (1)% 4,502 (10)% 3,365 (2)% 7,326 (5)% 7,167 (4)% 8,062 77% (895) NM $(676) NM Key Indicators ($B, except branches, and as otherwise noted) Branches 687 0% 0% RB Average Deposits $182 6% 19% RB Average Loans 53 2% 10% Investment AUMs 73 6% 7% Branded Cards Average Loans 81 (2)% (10)% Branded Cards Purchase Sales 86 16% (9)% Retail Services Average Loans 45 (4)% (10)% Retail Services Purchase Sales 20 18% (8)% Active Digital Customers (MM)(1) 20 (0)% 3% Active Mobile Customers (MM)(2) 13 0% 4% 687 0% $172 13% 52 8% 73 7% 85 (4)% 245 (9)% 47 (5)% 55 (13)% |
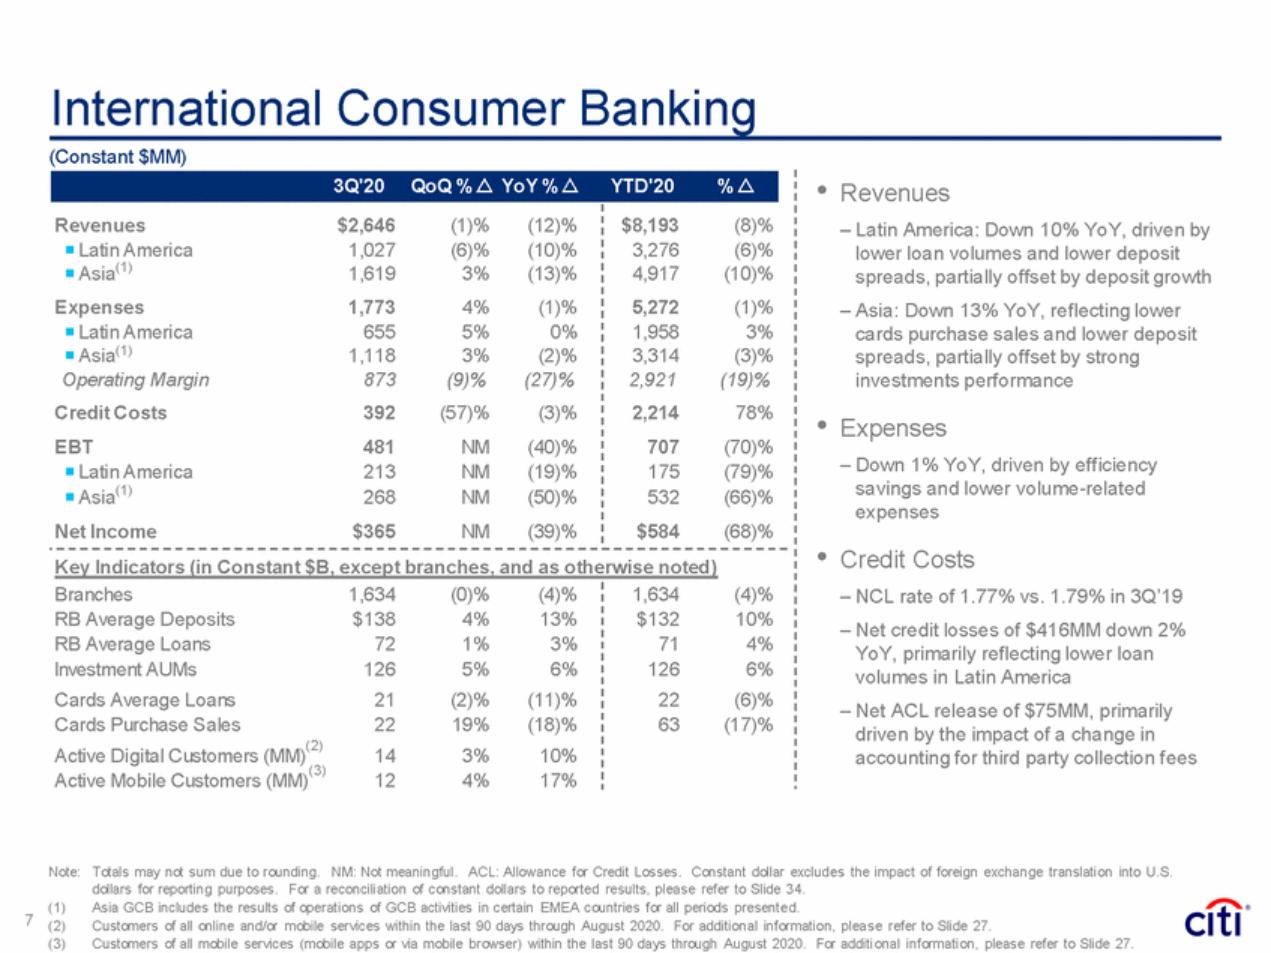
| International Consumer Banking (Constant $MM) • Revenues – Latin America: Down 10% YoY, driven by lower loan volumes and lower deposit spreads, partially offset by deposit growth – Asia: Down 13% YoY, reflecting lower cards purchase sales and lower deposit spreads, partially offset by strong investments performance • Expenses – Down 1% YoY, driven by efficiency savings and lower volume-related expenses • Credit Costs – NCL rate of 1.77% vs. 1.79% in 3Q’19 – Net credit losses of $416MM down 2% YoY, primarily reflecting lower loan volumes in Latin America – Net ACL release of $75MM, primarily driven by the impact of a change in accounting for third party collection fees Key Indicators (in Constant $B, except branches, and as otherwise noted) Branches RB Average Deposits RB Average Loans Investment AUMs Cards Average Loans Cards Purchase Sales 1,634 $138 72 126 21 22 14 12 (0)% 4% 1% 5% (2)% 19% 3% 4% (4)% 13% 3% 6% (11)% (18)% 10% 17% 1,634 $132 71 126 22 63 (4)% 10% 4% 6% (6)% (17)% (2) Active Digital Customers (MM) (3) Active Mobile Customers (MM) Note: Totals may not sum due to rounding. NM: Not meaningful. ACL: Allowance for Credit Losses. Constant dollar excludes the impact of foreign exchange translation into U.S. dollars for reporting purposes. For a reconciliation of constant dollars to reported results, please refer to Slide 34. Asia GCB includes the results of operations of GCB activities in certain EMEA countries for all periods presented. Customers of all online and/or mobile services within the last 90 days through August 2020. For additional information, please refer to Slide 27. Customers of all mobile services (mobile apps or via mobile browser) within the last 90 days through August 2020. For additi onal information, please refer to Slide 27. (1) (2) (3) 7 3Q'20 QoQ % r YoY % rYTD'20 % r Revenues $2,646 (1)% (12)% Latin America 1,027 (6)% (10)% Asia(1) 1,619 3% (13)% Expenses 1,773 4% (1)% Latin America 655 5% 0% Asia(1) 1,118 3% (2)% Operating Margin 873 (9)% (27)% Credit Costs 392 (57)% (3)% EBT 481 NM (40)% Latin America 213 NM (19)% Asia(1) 268 NM (50)% Net Income $365 NM (39)% $8,193 (8)% 3,276 (6)% 4,917 (10)% 5,272 (1)% 1,958 3% 3,314 (3)% 2,921 (19)% 2,214 78% 707 (70)% 175 (79)% 532 (66)% $584 (68)% |
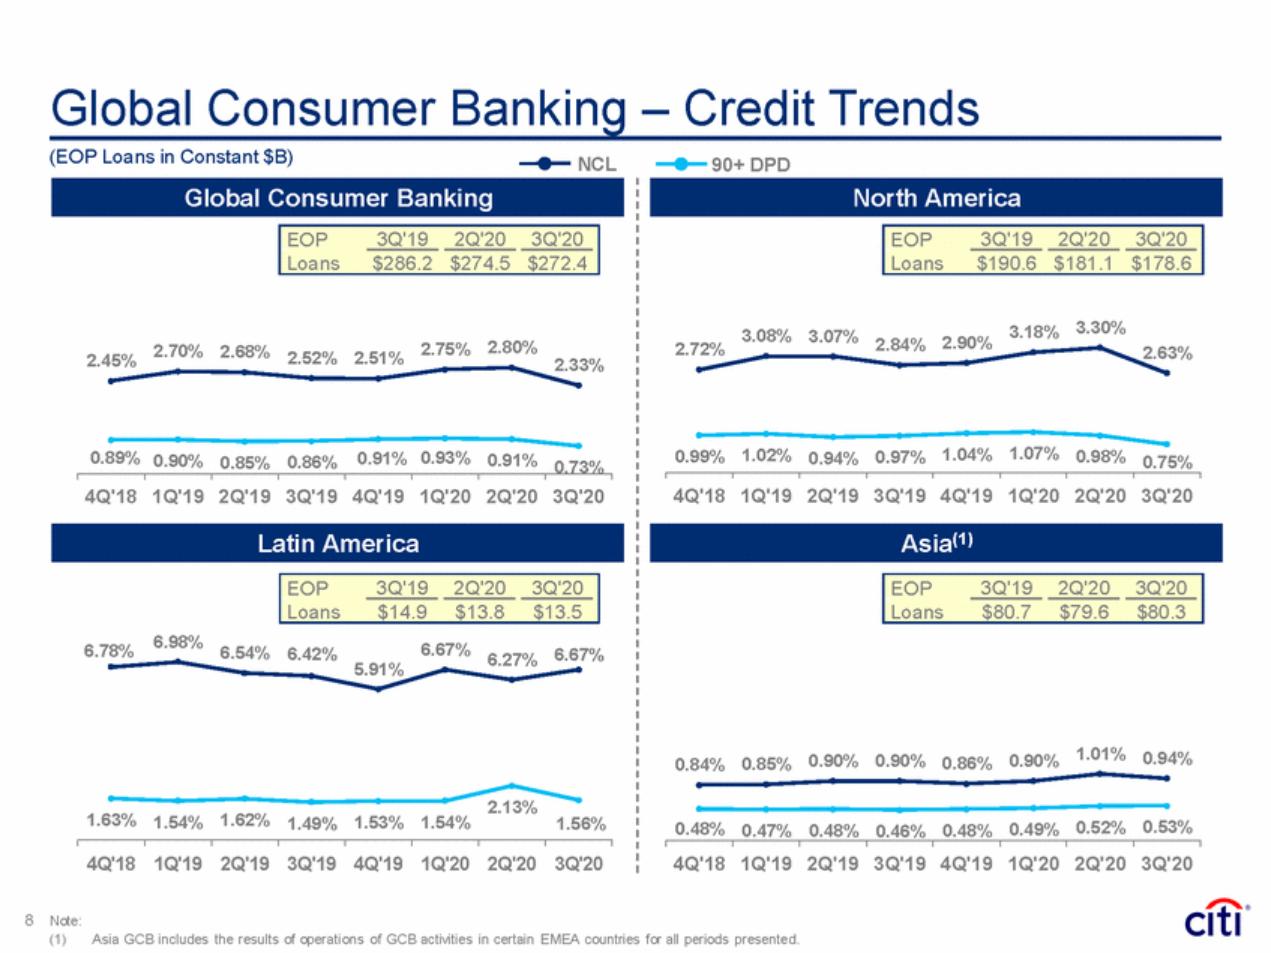
| Global Consumer Banking – Credit Trends (EOP Loans in Constant $B) NCL 90+ DPD 3.30% 3.18% 3.08% 3.07% 2.90% 2.84% 2.80% 2.75% 2.72% 2.70% 2.68% 2.63% 2.52% 2.51% 2.45% 2.33% 1.07% 1.02% 1.04% 0.99% 0.97% 0.98% 0.89% 0.91% 0.93% 0.94% 0.90% 0.91% 0.85% 0.86% 0.75% 0.73% 4Q'18 1Q'19 2Q'19 3Q'19 4Q'19 1Q'20 2Q'20 3Q'20 4Q'18 1Q'19 2Q'19 3Q'19 4Q'19 1Q'20 2Q'20 3Q'20 6.98% 6.67% 6.78% 6.54% 6.42% 6.67% 6.27% 5.91% 1.01% 0.94% 0.90% 0.90% 0.90% 0.85% 0.86% 0.84% 2.13% 1.63% 1.62% 1.54% 1.53% 1.54% 1.49% 1.56% 0.52% 0.53% 0.48% 0.49% 0.47% 0.48% 0.46% 0.48% 4Q'18 1Q'19 2Q'19 3Q'19 4Q'19 1Q'20 2Q'20 3Q'20 4Q'18 1Q'19 2Q'19 3Q'19 4Q'19 1Q'20 2Q'20 3Q'20 8 Note: (1) Asia GCB includes the results of operations of GCB activities in certain EMEA countries for all periods presented. EOP Loans 3Q'19 2Q'20 3Q'20 $80.7 $79.6 $80.3 EOP Loans 3Q'19 2Q'20 3Q'20 $14.9 $13.8 $13.5 Asia(1) Latin America EOP Loans 3Q'19 2Q'20 3Q'20 $190.6 $181.1 $178.6 EOP Loans 3Q'19 2Q'20 3Q'20 $286.2 $274.5 $272.4 Global Consumer Banking North America |
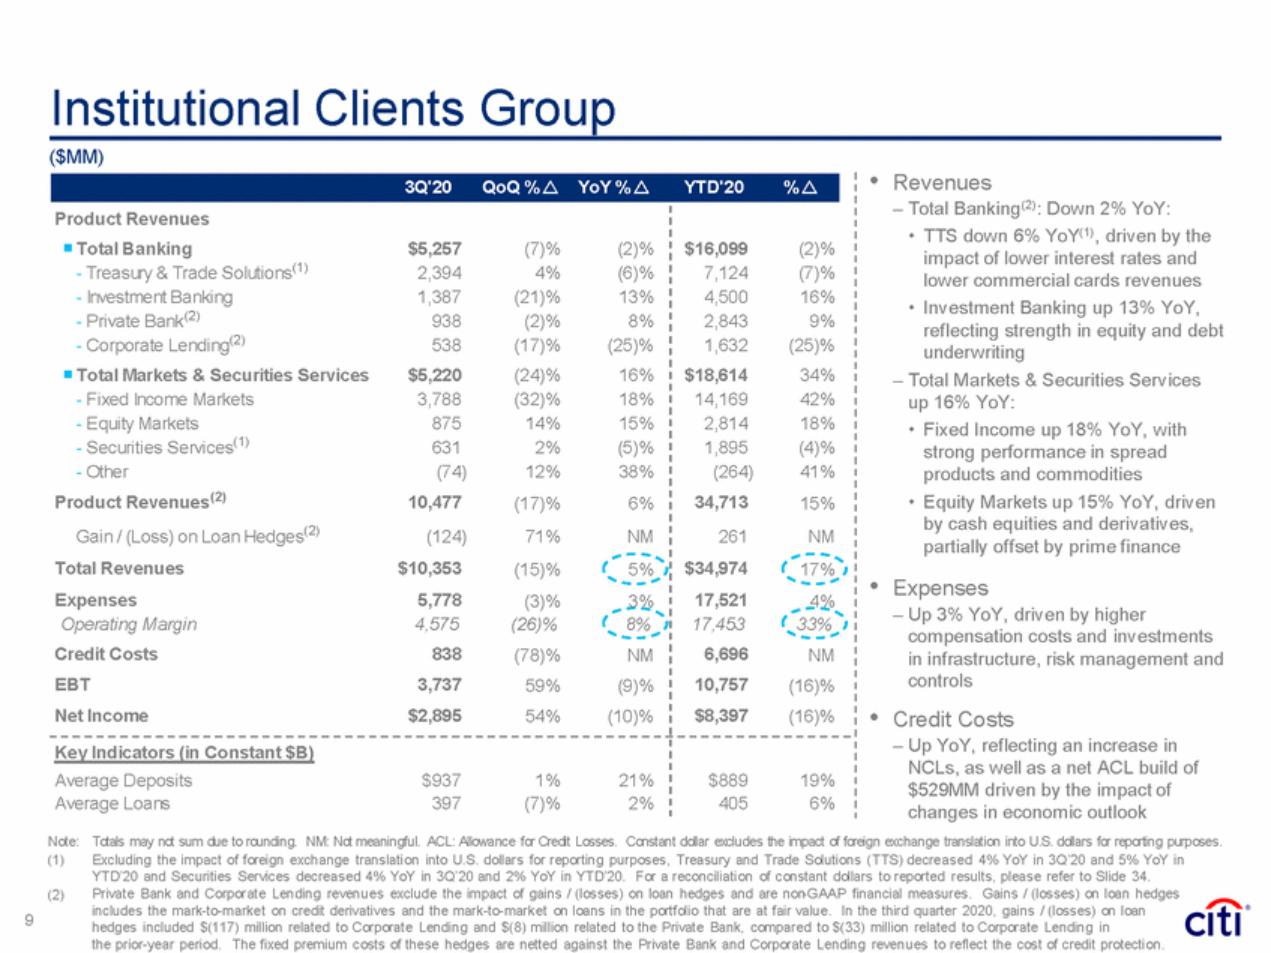
| Institutional Clients Group ($MM) • Revenues – Total Banking(2): Down 2% YoY: • TTS down 6% YoY(1), driven by the impact of lower interest rates and lower commercial cards revenues • Investment Banking up 13% YoY, reflecting strength in equity and debt underwriting – Total Markets & Securities Services up 16% YoY: • Fixed Income up 18% YoY, with strong performance in spread products and commodities • Equity Markets up 15% YoY, driven by cash equities and derivatives, partially offset by prime finance - Treasury & Trade Solutions 2,394 4% (6)% - Corporate Lending 538 (17)% (25)% - Securities Services 631 2% (5)% • Expenses – Up 3% YoY, driven by higher compensation costs and investments in infrastructure, risk management and controls Credit Costs – Up YoY, reflecting an increase in NCLs, as well as a net ACL build of $529MM driven by the impact of changes in economic outlook • Note: (1) Totals may not sum due to rounding. NM: Not meaningful. ACL: Allowance for Credit Losses. Constant dollar excludes the impact of foreign exchange translation into U.S. dollars for reporting purposes. Excluding the impact of foreign exchange translation into U.S. dollars for reporting purposes, Treasury and Trade Solutions (TTS) decreased 4% YoY in 3Q’20 and 5% YoY in YTD’20 and Securities Services decreased 4% YoY in 3Q’20 and 2% YoY in YTD’20. For a reconciliation of constant dollars to reported results, please refer to Slide 34. Private Bank and Corporate Lending revenues exclude the impact of gains / (losses) on loan hedges and are non-GAAP financial measures. Gains / (losses) on loan hedges includes the mark-to-market on credit derivatives and the mark-to-market on loans in the portfolio that are at fair value. In the third quarter 2020, gains / (losses) on loan hedges included $(117) million related to Corporate Lending and $(8) million related to the Private Bank, compared to $(33) million related to Corporate Lending in the prior-year period. The fixed premium costs of these hedges are netted against the Private Bank and Corporate Lending revenues to reflect the cost of credit protection. (2) 9 3Q'20QoQ % rYoY % rYTD'20% r Product Revenues Total Banking $5,257 (7)% (2)% (1) - Investment Banking1,387(21)%13% - Private Bank(2)938(2)%8% (2) Total Markets & Securities Services $5,220 (24)% 16% - Fixed Income Markets3,788(32)%18% - Equity Markets87514%15% (1) - Other(74) 12%38% Product Revenues(2)10,477(17)% 6% Gain / (Loss) on Loan Hedges(2) (124)71%NM Total Revenues$10,353(15)% 5% Expenses 5,778 (3)% 3% Operating Margin 4,575 (26)% 8% Credit Costs 838 (78)% NM EBT 3,737 59% (9)% Net Income $2,895 54% (10)% $16,099(2)% 7,124(7)% 4,50016% 2,8439% 1,632(25)% $18,61434% 14,16942% 2,81418% 1,895(4)% (264)41% 34,71315% 261NM $34,97417% 17,5214% 17,45333% 6,696NM 10,757(16)% $8,397(16)% Key Indicators (in Constant $B) Average Deposits$9371%21% Average Loans 397(7)% 2% $88919% 4056% |
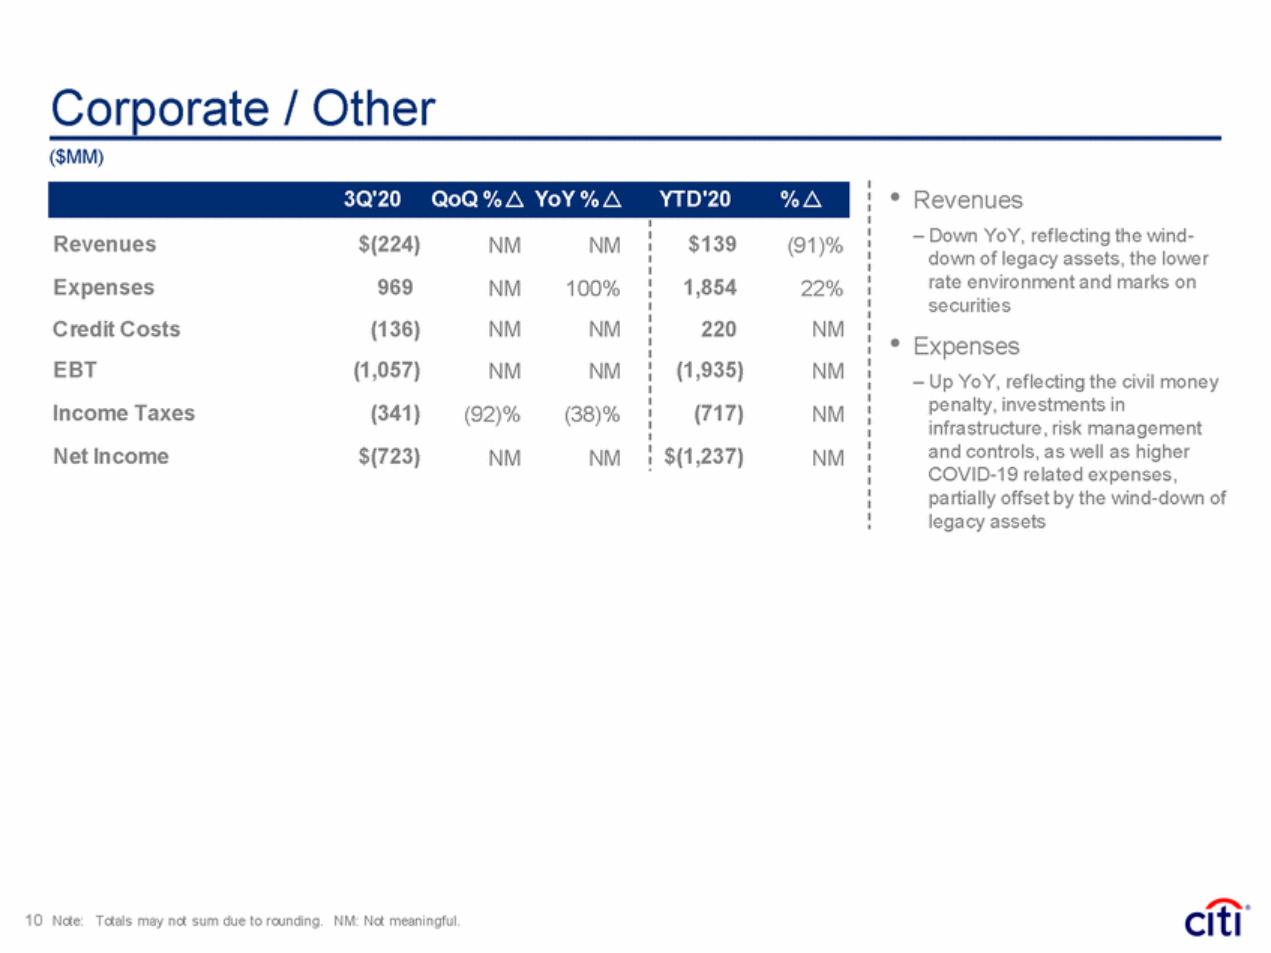
| Corporate / Other ($MM) • Revenues – Down YoY, reflecting the wind-down of legacy assets, the lower rate environment and marks on securities Expenses – Up YoY, reflecting the civil money penalty, investments in infrastructure, risk management and controls, as well as higher COVID-19 related expenses, partially offset by the wind-down of legacy assets • 10 Note: Totals may not sum due to rounding. NM: Not meaningful. 3Q'20 QoQ % r YoY % rYTD'20 % r Revenues $(224) NM NM Expenses 969 NM 100% Credit Costs (136) NM NM EBT (1,057) NM NM Income Taxes (341) (92)% (38)% Net Income $(723) NM NM $139 (91)% 1,854 22% 220 NM (1,935) NM (717) NM $(1,237) NM |
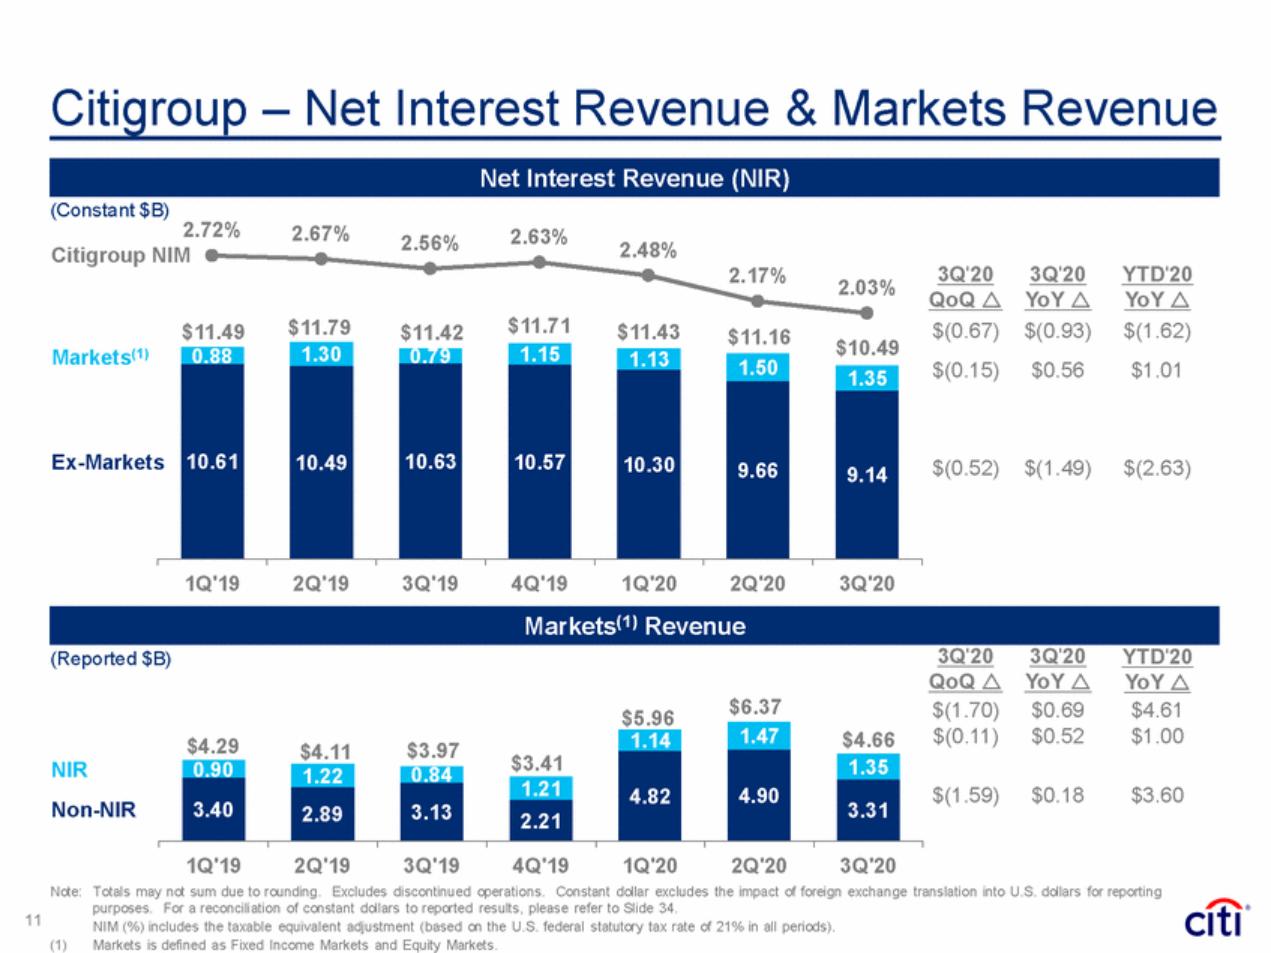
| Citigroup – Net Interest Revenue & Markets Revenue (Constant $B) 2.72% 2.67% 2.63% 2.56% 2.48% Citigroup NIM 3Q'20 QoQ r 3Q'20 YoY r YTD'20 YoY r 2.17% 2.03% $11.71 $11.79 $11.49 $(0.67) $(0.15) $(0.93) $0.56 $(1.62) $1.01 $11.42 $11.43 $11.16 $10.49 Markets(1) Ex-Markets $(0.52) $(1.49) $(2.63) 1Q'19 2Q'19 3Q'19 4Q'19 1Q'20 2Q'20 3Q'20 3Q'20 QoQ r 3Q'20 YoY r YTD'20 YoY r (Reported $B) $6.37 $(1.70) $(0.11) $0.69 $0.52 $4.61 $1.00 $5.96 $3.41 NIR Non-NIR 0.90 $(1.59) $0.18 $3.60 1Q'19 2Q'19 3Q'19 4Q'19 1Q'20 2Q'20 3Q'20 Note: Totals may not sum due to rounding. Excludes discontinued operations. Constant dollar excludes the impact of foreign exchange translation into U.S. dollars for reporting purposes. For a reconciliation of constant dollars to reported results, please refer to Slide 34. NIM (%) includes the taxable equivalent adjustment (based on the U.S. federal statutory tax rate of 21% in all periods). Markets is defined as Fixed Income Markets and Equity Markets. 11 (1) 1.47 $4.66 $4.29$4.11$3.97 1.14 4.90 1.35 4.82 1.22 0.84 3.40 3.31 1.21 3.13 2.89 2.21 Markets(1) Revenue 1.30 1.15 0.88 1.13 1.50 10.61 10.49 10.63 10.57 10.30 1.35 9.66 9.14 Net Interest Revenue (NIR) |
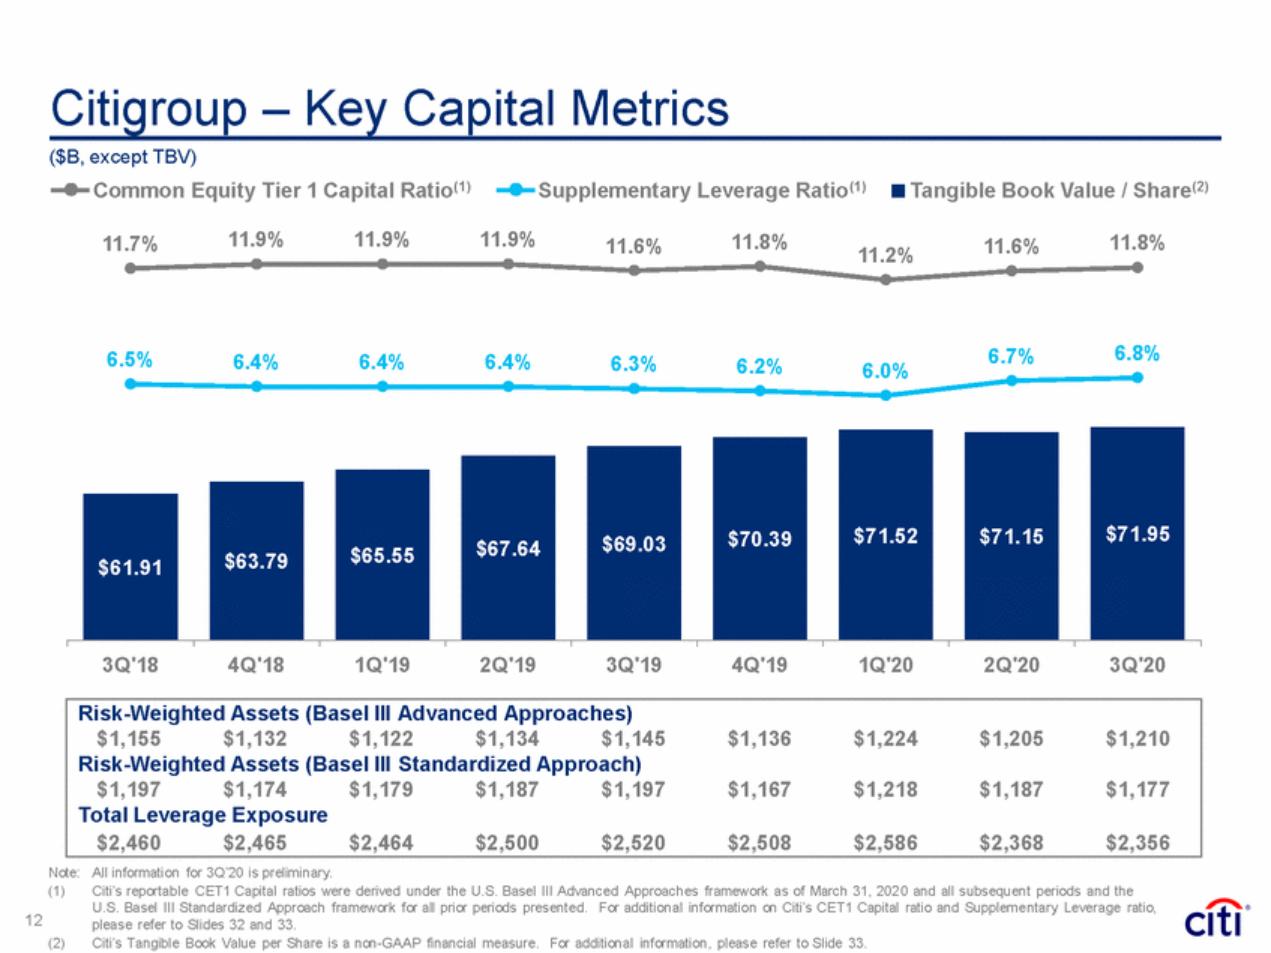
| Citigroup – Key Capital Metrics ($B, except TBV) Common Equity Tier 1 Capital Ratio(1) Supplementary Leverage Ratio(1) Tangible Book Value / Share(2) 11.9% 11.9% 11.9% 11.8% 11.8% 11.7% 11.6% 11.6% 11.2% 6.8% 6.7% 6.5% 6.4% 6.4% 6.4% 6.3% 6.2% 6.0% 3Q'18 4Q'18 1Q'19 2Q'19 3Q'19 4Q'19 1Q'20 2Q'20 3Q'20 Note: (1) All information for 3Q’20 is preliminary. Citi’s reportable CET1 Capital ratios were derived under the U.S. Basel III Advanced Approaches framework as of March 31, 2020 and all subsequent periods and the U.S. Basel III Standardized Approach framework for all prior periods presented. For additional information on Citi’s CET1 Capital ratio and Supplementary Leverage ratio, please refer to Slides 32 and 33. Citi’s Tangible Book Value per Share is a non-GAAP financial measure. For additional information, please refer to Slide 33. 12 (2) Risk-Weighted Assets (Basel III Advanced Approaches) $1,155$1,132$1,122$1,134$1,145$1,136$1,224$1,205$1,210 Risk-Weighted Assets (Basel III Standardized Approach) $1,197$1,174$1,179$1,187$1,197$1,167$1,218$1,187$1,177 Total Leverage Exposure $2,460$2,465$2,464$2,500$2,520$2,508$2,586$2,368$2,356 $71.52 $71.15 $71.95 $70.39 $69.03 $67.64 $65.55 $63.79 $61.91 |
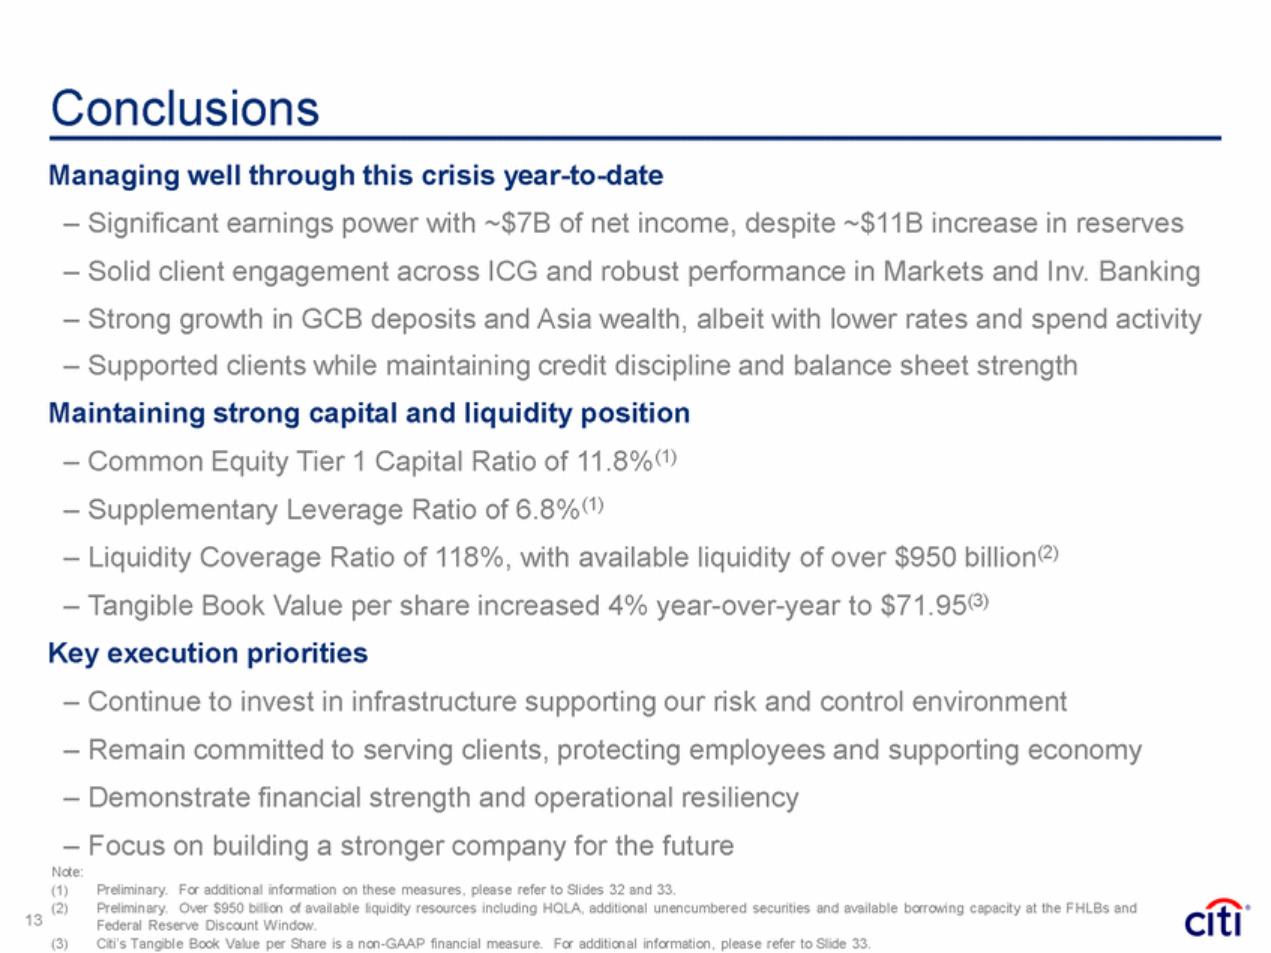
| Conclusions Managing well through this crisis year-to-date – Significant earnings power with ~$7B of net income, despite ~$11B increase in reserves – Solid client engagement across ICG and robust performance in Markets and Inv. Banking – Strong growth in GCB deposits and Asia wealth, albeit with lower rates and spend activity – Supported clients while maintaining credit discipline and balance sheet strength Maintaining strong capital and liquidity position – Common Equity Tier 1 Capital Ratio of 11.8%(1) – Supplementary Leverage Ratio of 6.8%(1) – Liquidity Coverage Ratio of 118%, with available liquidity of over $950 billion(2) – Tangible Book Value per share increased 4% year-over-year to $71.95(3) Key execution priorities – Continue to invest in infrastructure supporting our risk and control environment – Remain committed to serving clients, protecting employees and supporting economy – Demonstrate financial strength and operational resiliency – Focus on building a stronger company for the future Note: (1) (2) Preliminary. For additional information on these measures, please refer to Slides 32 and 33. Preliminary. Over $950 billion of available liquidity resources including HQLA, additional unencumbered securities and available borrowing capacity at the F HLBs and Federal Reserve Discount W indow. Citi’s Tangible Book Value per Share is a non-GAAP financial measure. For additional information, please refer to Slide 33. 13 (3) |
| Certain statements in this document are “forward-looking statements” within the meaning of the rules and regulations of the U.S. Securities and Exchange Commission (SEC). These statements are based on management’s current expectations and are subject to uncertainty and changes in circumstances. These statements are not guarantees of future results or occurrences. Actual results and capital and other financial condition may differ materially from those included in these statements due to a variety of factors. These factors include, among others, macroeconomic and other challenges and uncertainties related to the COVID-19 pandemic, such as the duration and severity of the impact on public health, the U.S. and global economies, financial markets and consumer and corporate customers and clients, including economic activity and employment, as well as the various actions taken in response by governments, central banks and others, including Citi, and the precautionary statements included in this document. These factors also consist of those contained in Citigroup’s filings with the SEC, including without limitation the “Risk Factors” section of Citigroup’s Second Quarter 2020 Form 10-Q and Citigroup’s 2019 Form 10-K. Any forward-looking statements made by or on behalf of Citigroup speak only as to the date they are made, and Citi does not undertake to update forward-looking statements to reflect the impact of circumstances or events that arise after the date the forward-looking statements were made. 14 |
| [LOGO] |
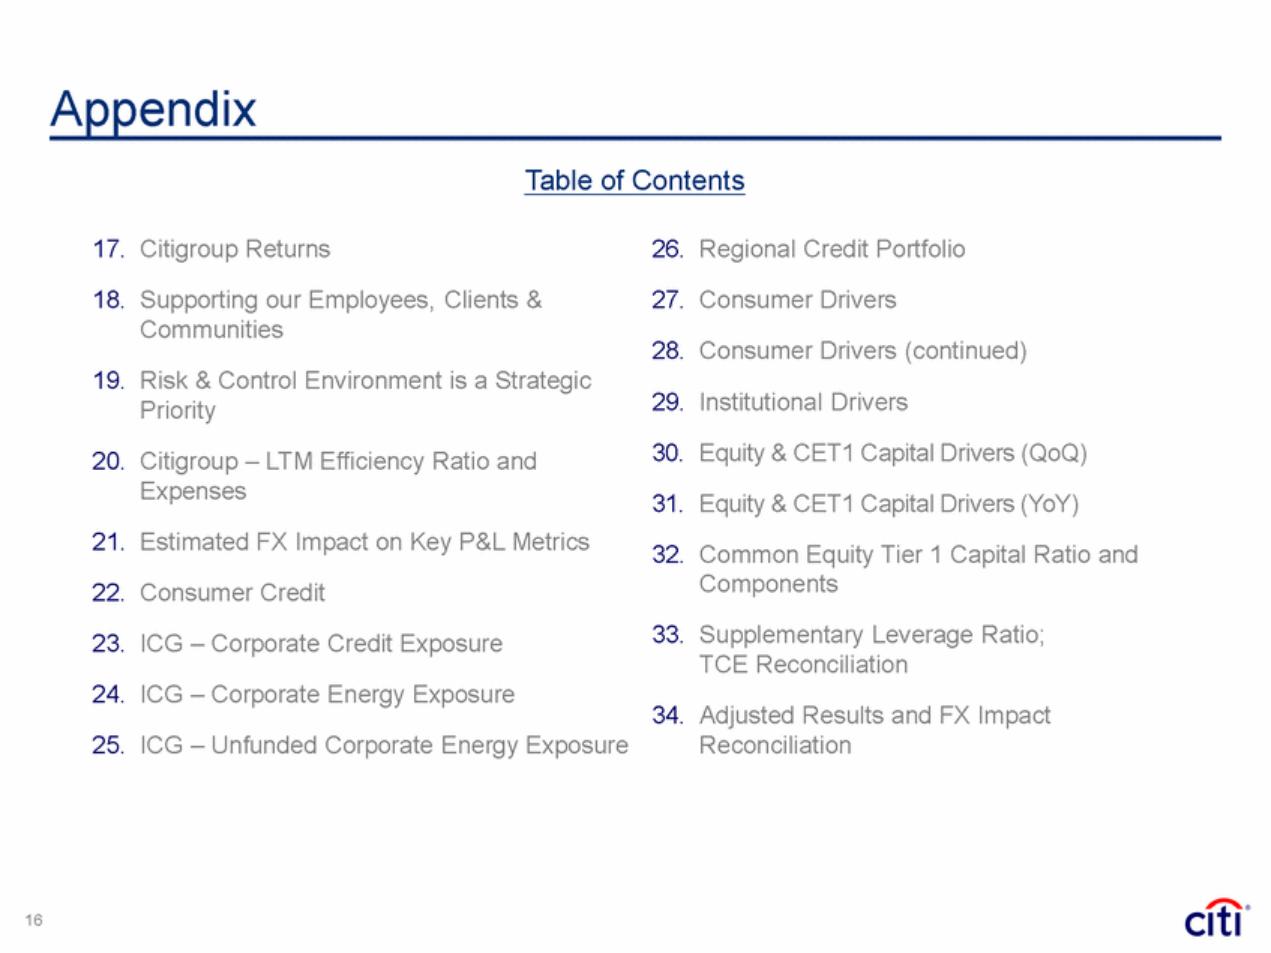
| Appendix Table of Contents 17. 18. Citigroup Returns Supporting our Employees, Clients & Communities 26. 27. Regional Credit Portfolio Consumer Drivers 28. Consumer Drivers (continued) 19. Risk & Control Environment is a Strategic Priority 29. Institutional Drivers 30. Equity & CET1 Capital Drivers (QoQ) 20. Citigroup – LTM Efficiency Ratio and Expenses 31. Equity & CET1 Capital Drivers (YoY) 21. Estimated FX Impact on Key P&L Metrics 32. Common Equity Tier 1 Capital Ratio and Components 22. Consumer Credit 33. Supplementary Leverage Ratio; TCE Reconciliation 23. ICG – Corporate Credit Exposure 24. ICG – Corporate Energy Exposure 34. Adjusted Results and FX Impact Reconciliation 25. ICG – Unfunded Corporate Energy Exposure 16 |
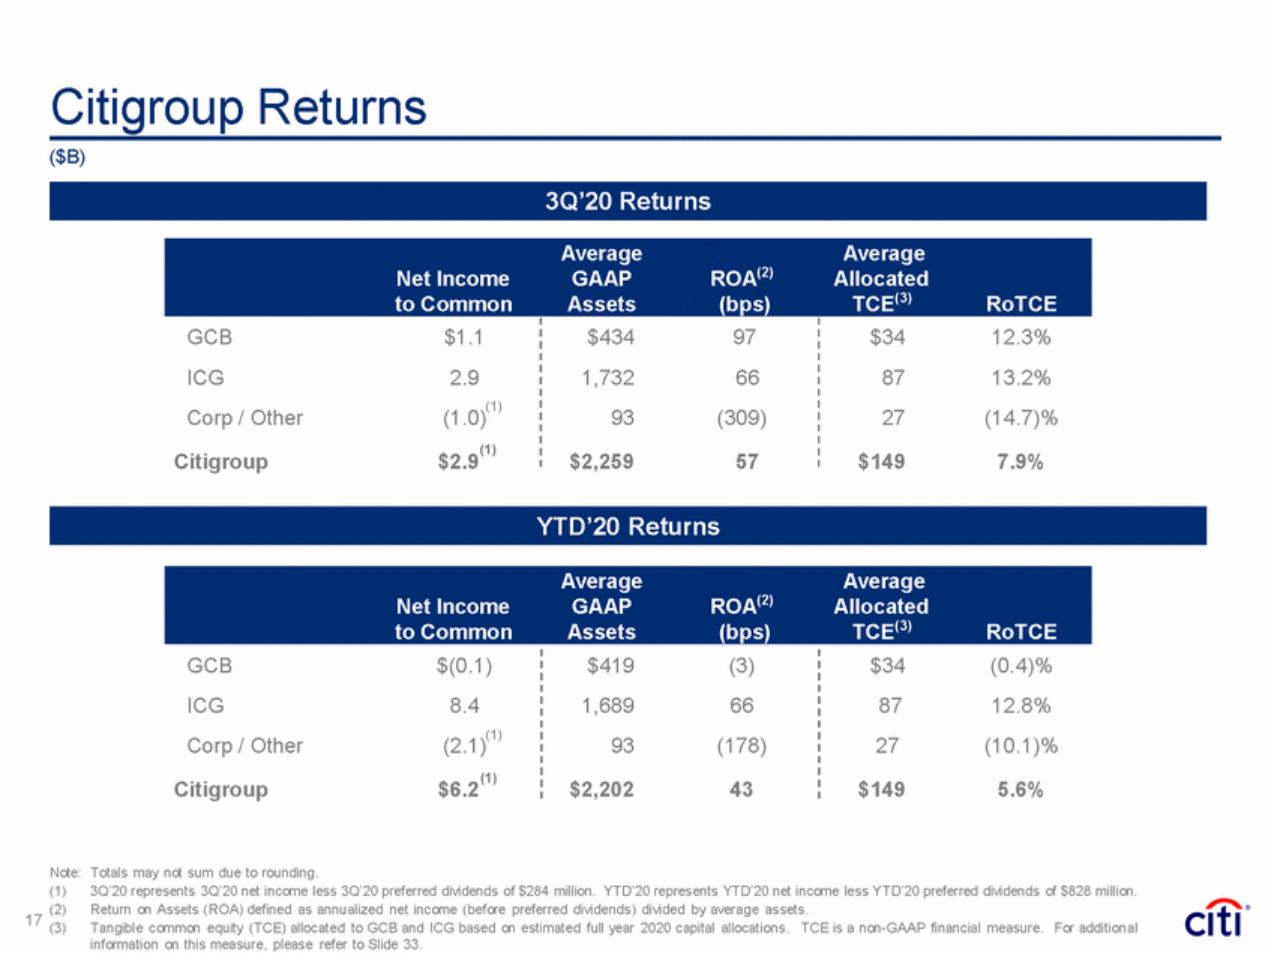
| Citigroup Returns ($B) GCB ICG Corp / Other $(0.1) 8.4 $419 1,689 93 (3) 66 (178) $34 87 27 (0.4)% 12.8% (10.1)% (1) (2.1) (1) Citigroup $6.2 $2,202 43 $149 5.6% Note: Totals may not sum due to rounding. (1) 3Q’20 represents 3Q’20 net income less 3Q’20 preferred dividends of $284 million. YTD’20 represents YTD’20 net income less YTD’20 preferred dividends of $828 million. Return on Assets (ROA) defined as annualized net income (before preferred dividends) divided by average assets. Tangible common equity (TCE) allocated to GCB and ICG based on estimated full year 2020 capital allocations. TCE is a non-GAAP financial measure. For additional information on this measure, please refer to Slide 33. (2) 17 (3) AverageAverage Net IncomeGAAPROA(2)Allocated to CommonAssets(bps)TCE(3)RoTCE YTD’20 Returns AverageAverage Net IncomeGAAPROA(2)Allocated to CommonAssets(bps)TCE(3)RoTCE GCB$1.1 ICG2.9 (1) Corp / Other(1.0) (1) Citigroup$2.9 $43497 1,73266 93(309) $2,25957 $3412.3% 8713.2% 27(14.7)% $1497.9% 3Q’20 Returns |
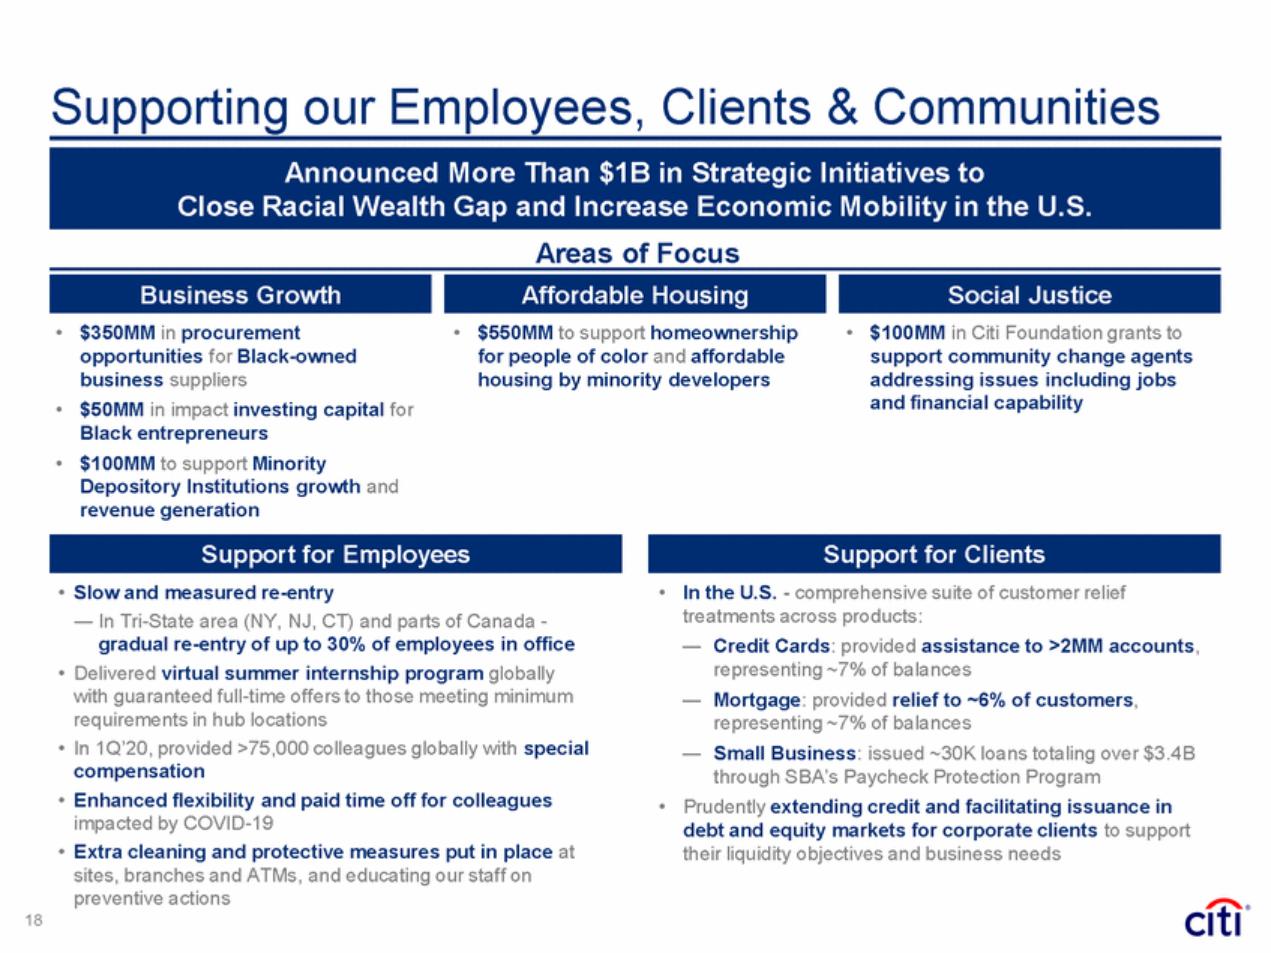
| Supporting our Employees, Clients & Communities Areas of Focus • $350MM in procurement opportunities for Black-owned business suppliers $50MM in impact investing capital for Black entrepreneurs $100MM to support Minority Depository Institutions growth and revenue generation • $550MM to support homeownership for people of color and affordable housing by minority developers • $100MM in Citi Foundation grants to support community change agents addressing issues including jobs and financial capability • • • Slow and measured re-entry ― In Tri-State area (NY, NJ, CT) and parts of Canada - gradual re-entry of up to 30% of employees in office Delivered virtual summer internship program globally with guaranteed full-time offers to those meeting minimum requirements in hub locations In 1Q’20, provided >75,000 colleagues globally with special compensation Enhanced flexibility and paid time off for colleagues impacted by COVID-19 Extra cleaning and protective measures put in place at sites, branches and ATMs, and educating our staff on preventive actions • In the U.S. - comprehensive suite of customer relief treatments across products: ― Credit Cards: provided assistance to >2MM accounts, representing ~7% of balances Mortgage: provided relief to ~6% of customers, representing ~7% of balances Small Business: issued ~30K loans totaling over $3.4B through SBA’s Paycheck Protection Program • ― • ― • • Prudently extending credit and facilitating issuance in debt and equity markets for corporate clients to support their liquidity objectives and business needs • 18 Support for Clients Support for Employees Social Justice Affordable Housing Business Growth Announced More Than $1B in Strategic Initiatives to Close Racial Wealth Gap and Increase Economic Mobility in the U.S. |
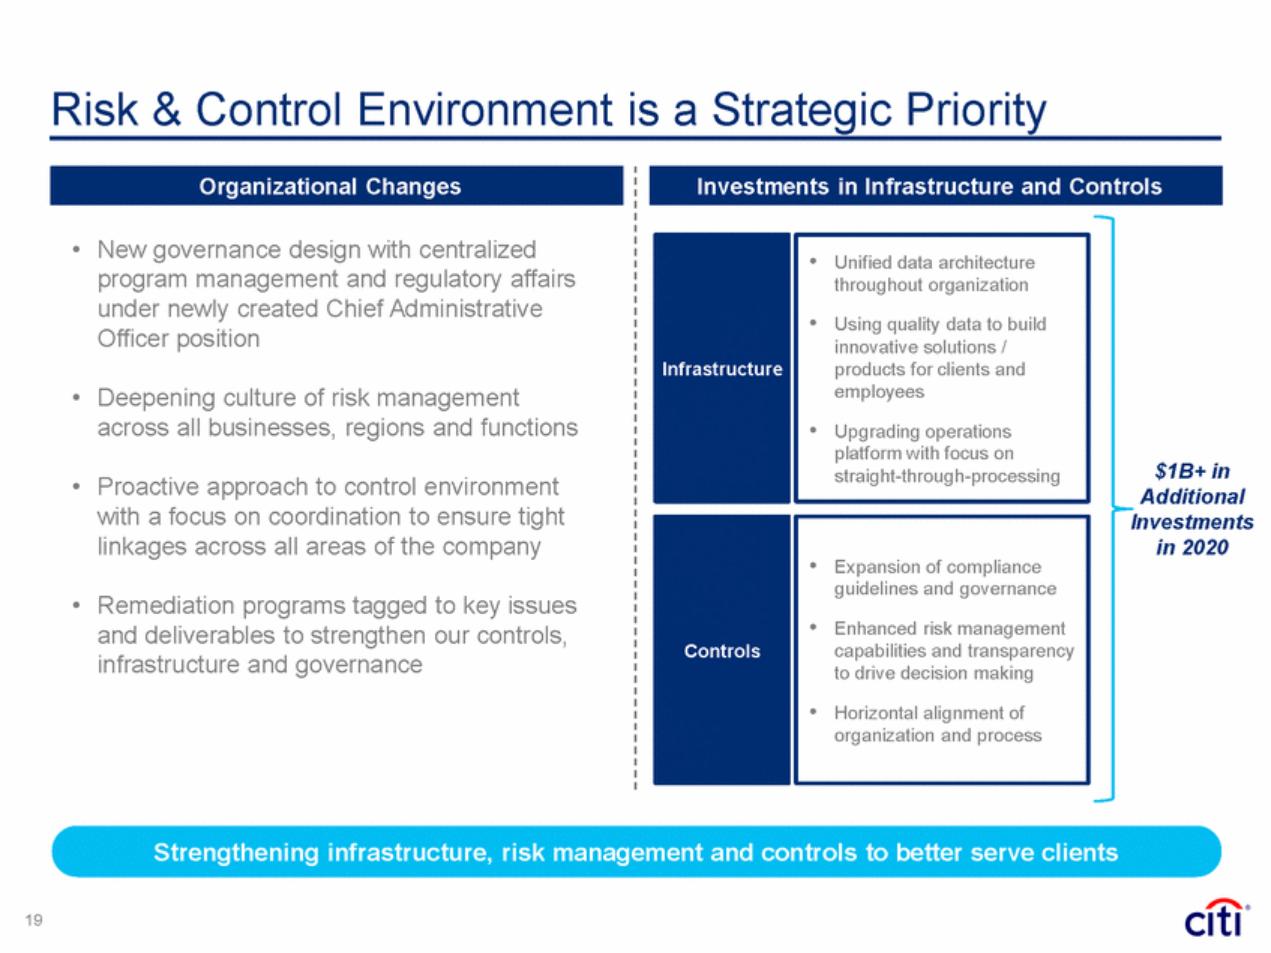
| Risk & Control Environment is a Strategic Priority • New governance design with centralized program management and regulatory affairs under newly created Chief Administrative Officer position • Deepening culture of risk management across all businesses, regions and functions $1B+ in Additional Investments in 2020 • Proactive approach to control environment with a focus on coordination to ensure tight linkages across all areas of the company • Remediation programs tagged to key issues and deliverables to strengthen our controls, infrastructure and governance Strengthening infrastructure, risk management and controls to better serve clients 19 Controls • Expansion of compliance guidelines and governance • Enhanced risk management capabilities and transparency to drive decision making • Horizontal alignment of organization and process Infrastructure • Unified data architecture throughout organization • Using quality data to build innovative solutions / products for clients and employees • Upgrading operations platform with focus on straight-through-processing Organizational Changes Investments in Infrastructure and Controls |
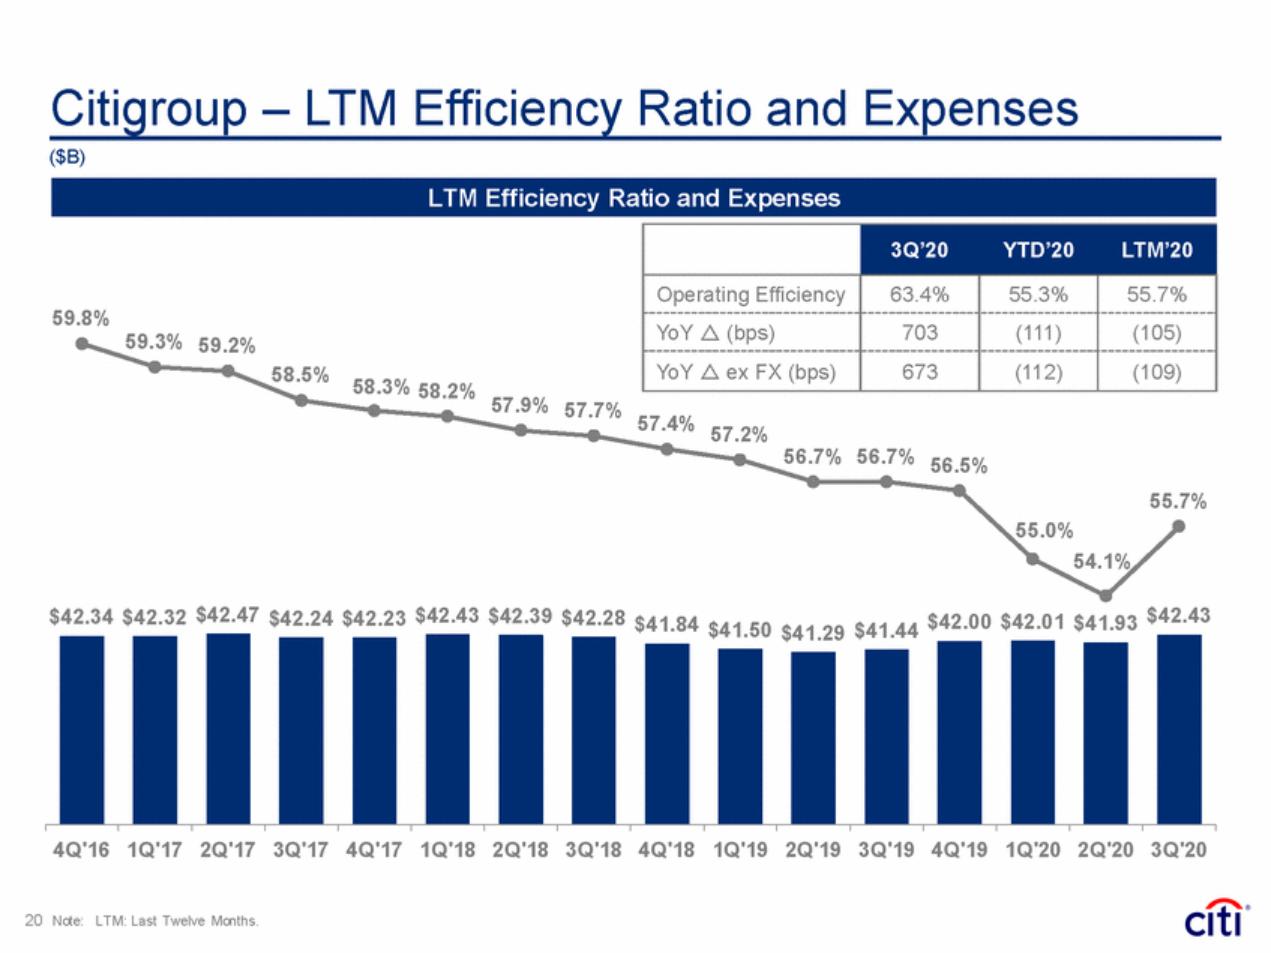
| Citigroup – LTM Efficiency Ratio and Expenses ($B) 59.8% 59.3% 59.2% 58.5% 58.3% 58.2% 57.9% 57.7% 57.4% 57.2% 56.7% 56.7% 56.5% 55.7% 55.0% 54.1% $42.34 $42.32 $42.47 $42.24 $42.23 $42.43 $42.39 $42.28 $41.84 $41.50 $41.29 $41.44 $42.00 $42.01 $41.93 $42.43 4Q'16 1Q'17 2Q'17 3Q'17 4Q'17 1Q'18 2Q'18 3Q'18 4Q'18 1Q'19 2Q'19 3Q'19 4Q'19 1Q'20 2Q'20 3Q'20 20 Note: LTM: Last Twelve Months. 3Q’20YTD’20LTM’20 Operating Efficiency 63.4% 55.3% 55.7% YoY r (bps) 703 (111) (105) YoY r ex FX (bps) 673 (112) (109) LTM Efficiency Ratio and Expenses |
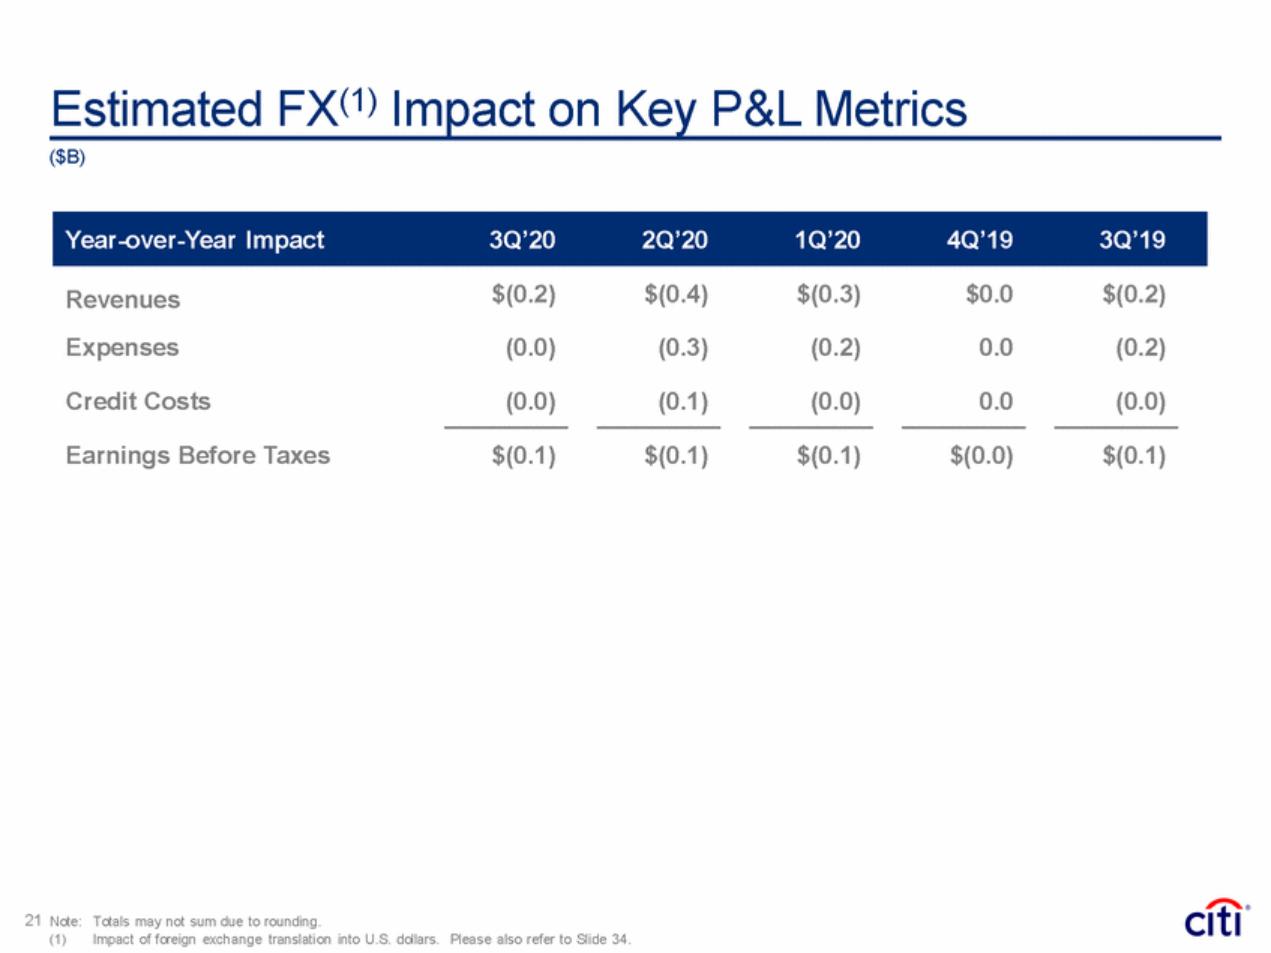
| Estimated FX(1) Impact on Key P&L Metrics ($B) $(0.2) $(0.4) $(0.3) $0.0 $(0.2) Revenues Expenses (0.0) (0.3) (0.2) 0.0 (0.2) Credit Costs (0.0) (0.1) (0.0) 0.0 (0.0) Earnings Before Taxes $(0.1) $(0.1) $(0.1) $(0.0) $(0.1) 21 Note: Totals may not sum due to rounding. (1) Impact of foreign exchange translation into U.S. dollars. Please also refer to Slide 34. Year-over-Year Impact3Q’202Q’201Q’204Q’193Q’19 |
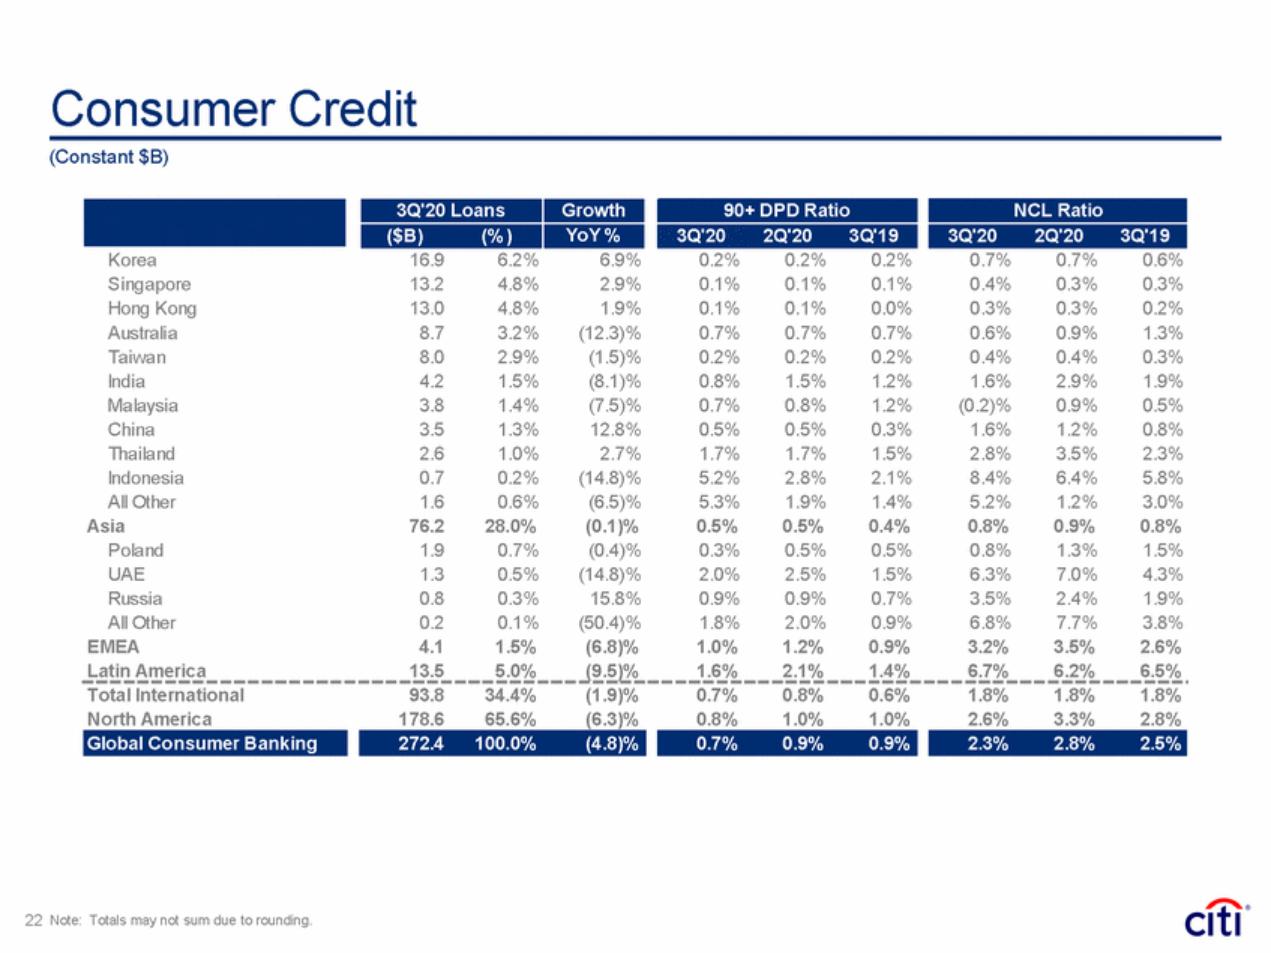
| Consumer Credit (Constant $B) 0.7% 0.4% 0.3% 0.6% 0.4% 1.6% (0.2)% 1.6% 2.8% 8.4% 5.2% 0.8% 0.8% 6.3% 3.5% 6.8% 3.2% 0.7% 0.3% 0.3% 0.9% 0.4% 2.9% 0.9% 1.2% 3.5% 6.4% 1.2% 0.9% 1.3% 7.0% 2.4% 7.7% 3.5% 0.6% 0.3% 0.2% 1.3% 0.3% 1.9% 0.5% 0.8% 2.3% 5.8% 3.0% 0.8% 1.5% 4.3% 1.9% 3.8% 2.6% Taiwan India Malaysia China Thailand Indonesia All Other Asia Poland UAE Russia All Other EMEA 8.0 4.2 3.8 3.5 2.6 0.7 1.6 76.2 1.9 1.3 0.8 0.2 4.1 2.9% 1.5% 1.4% 1.3% 1.0% 0.2% 0.6% 28.0% 0.7% 0.5% 0.3% 0.1% 1.5% (1.5)% (8.1)% (7.5)% 12.8% 2.7% (14.8)% (6.5)% (0.1)% (0.4)% (14.8)% 15.8% (50.4)% (6.8)% 0.2% 0.8% 0.7% 0.5% 1.7% 5.2% 5.3% 0.5% 0.3% 2.0% 0.9% 1.8% 1.0% 0.2% 1.5% 0.8% 0.5% 1.7% 2.8% 1.9% 0.5% 0.5% 2.5% 0.9% 2.0% 1.2% 0.2% 1.2% 1.2% 0.3% 1.5% 2.1% 1.4% 0.4% 0.5% 1.5% 0.7% 0.9% 0.9% Latin America 13.5 5.0% (9.5)% 1.6% 2.1% 1.4% 6.7% 6.2% 6.5% Total International North America 93.8 178.6 34.4% 65.6% (1.9)% (6.3)% 0.7% 0.8% 0.8% 1.0% 0.6% 1.0% 1.8% 2.6% 1.8% 3.3% 1.8% 2.8% 22 Note: Totals may not sum due to rounding. 2.3%2.8%2.5% 0.7%0.9%0.9% 272.4100.0%(4.8)% Global Consumer Banking NCL Ratio 3Q'202Q'203Q'19 3Q'20 Loans Growth 90+ DPD Ratio ($B)(% ) YoY % 3Q'20 2Q'203Q'19 Korea 16.96.2% 6.9%0.2%0.2%0.2% Singapore Hong Kong Australia 13.24.8%2.9%0.1%0.1%0.1% 13.04.8%1.9%0.1%0.1%0.0% 8.73.2%(12.3)%0.7%0.7%0.7% |
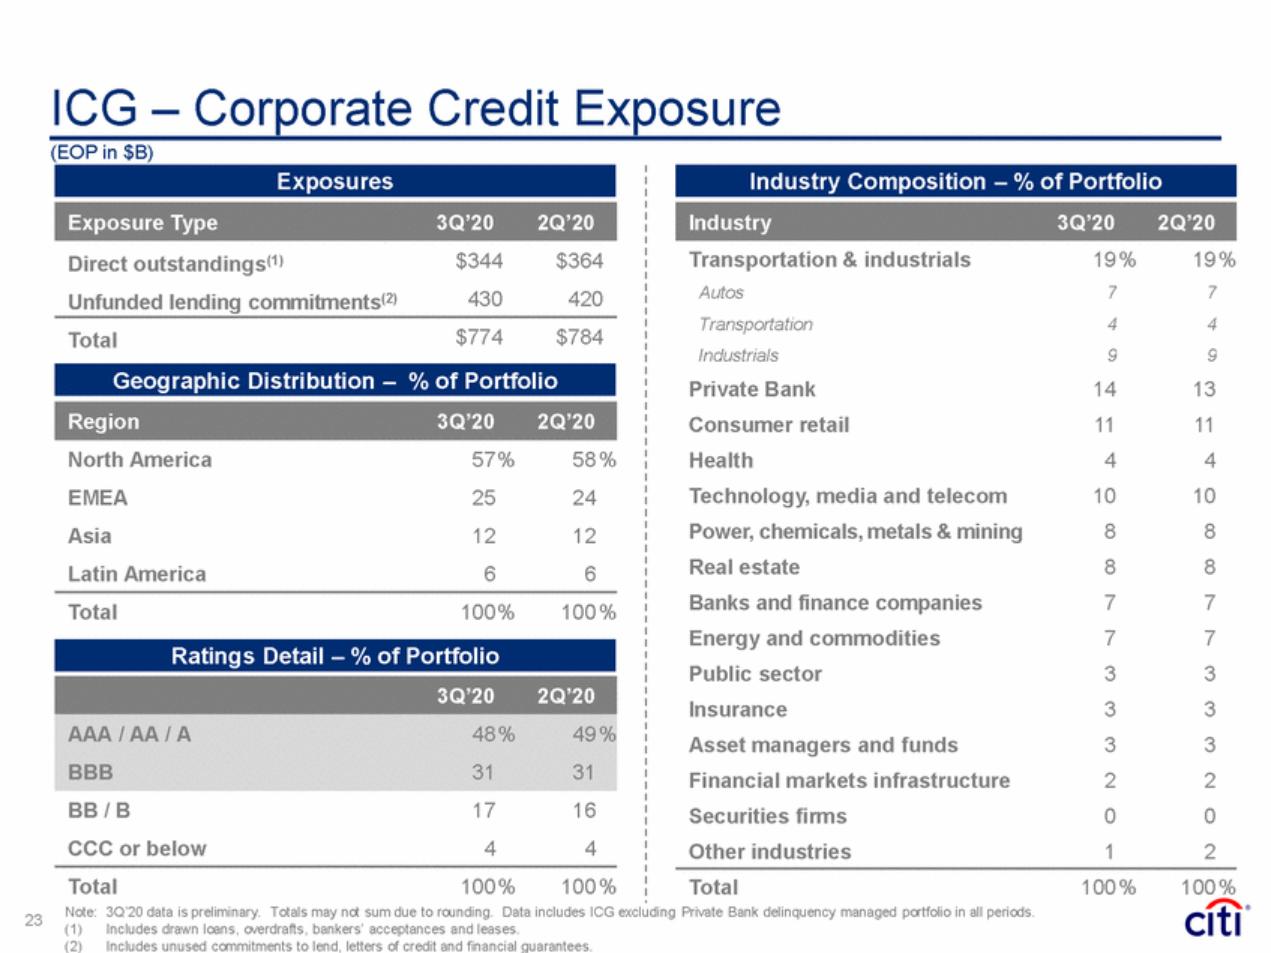
| ICG – Corporate Credit Exposure (EOP in $B) Transportation & industrials Autos Transportation Industrials Private Bank Consumer retail Health Technology, media and telecom Power, chemicals, metals & mining Real estate Banks and finance companies Energy and commodities Public sector Insurance Asset managers and funds Financial markets infrastructure Securities firms Other industries 19 % 7 4 9 14 11 4 10 8 8 7 7 3 3 3 2 0 1 19 % 7 4 9 13 11 4 10 8 8 7 7 3 3 3 2 0 2 $344 430 $364 420 Direct outstandings(1) Unfunded lending commitments(2) $774 $784 Total North America EMEA Asia Latin America 57% 25 12 6 58 % 24 12 6 Total 100% 100 % BB / B CCC or below 17 4 16 4 Total 100 % 100 % Total 100 % 100 % Note: (1) (2) 3Q’20 data is preliminary. Totals may not sum due to rounding. Data includes ICG excluding Private Bank delinquency managed portfolio in all periods. 23 Includes drawn loans, overdrafts, bankers’ acceptances and leases. Includes unused commitments to lend, letters of credit and financial guarantees. Ratings Detail – % of Portfolio 3Q’202Q’20 AAA / AA / A48 %49 % BBB3131 Region3Q’202Q’20 Geographic Distribution – % of Portfolio Industry3Q’202Q’20 Exposure Type3Q’202Q’20 Industry Composition – % of Portfolio Exposures |
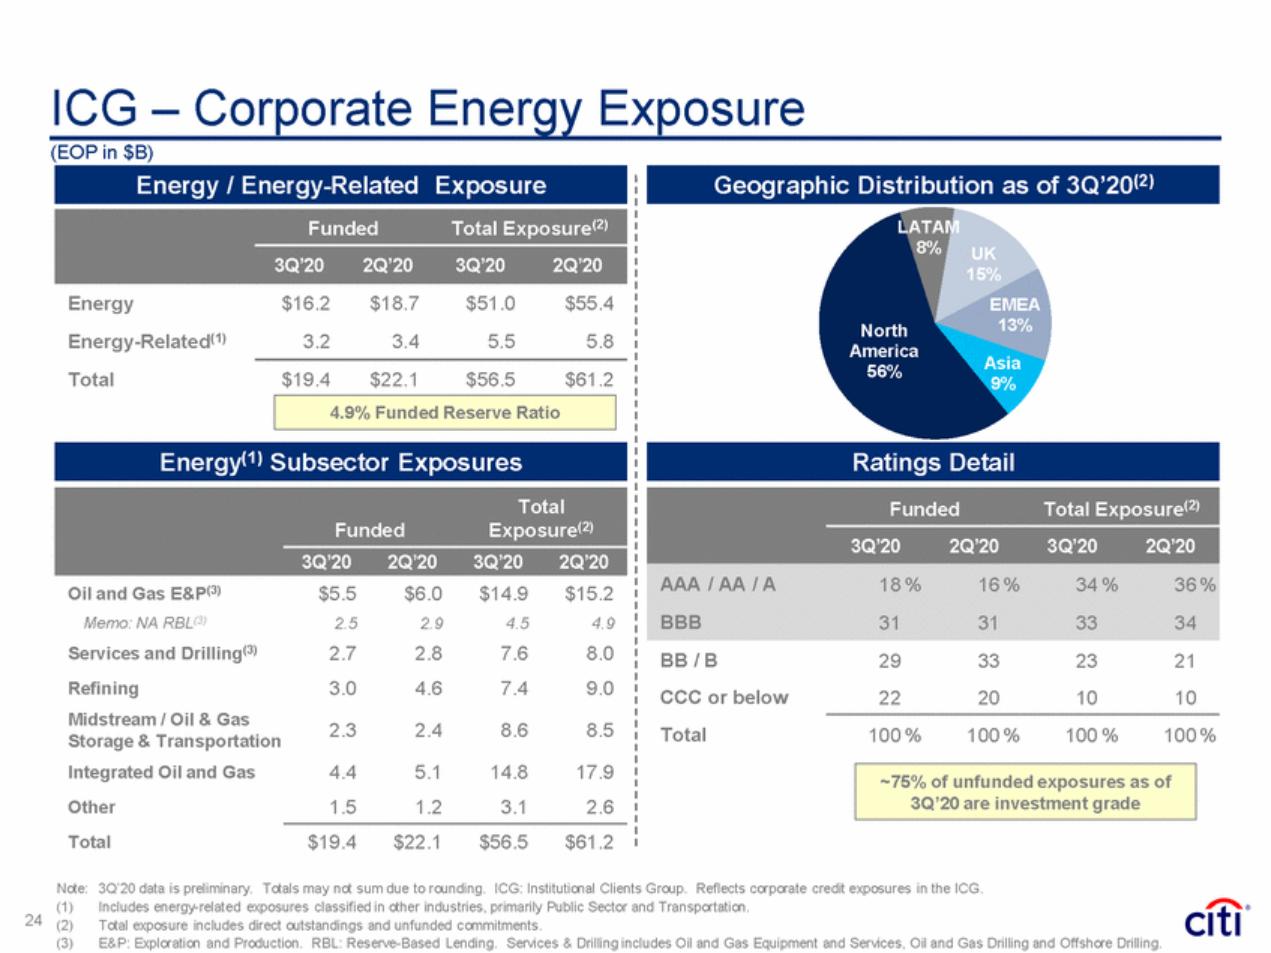
| ICG – Corporate Energy Exposure (EOP in $B) AT M UK 15% EMEA Energy Energy-Related(1) Total $16.2 3.2 $18.7 3.4 $51.0 5.5 $55.4 5.8 North America 56% Asia 9% $19.4 $22.1 $56.5 $61.2 Oil and Gas E&P(3) Memo: NA RBL(3) Services and Drilling(3) Refining Midstream / Oil & Gas Storage & Transportation Integrated Oil and Gas Other Total $5.5 2.5 2.7 3.0 $6.0 2.9 2.8 4.6 $14.9 4.5 7.6 7.4 $15.2 4.9 8.0 9.0 BB / B CCC or below Total 29 22 33 20 23 10 21 10 2.3 2.4 8.6 8.5 100 % 100 % 100 % 100 % 4.4 1.5 5.1 1.2 14.8 3.1 17.9 2.6 $19.4 $22.1 $56.5 $61.2 Note: (1) (2) (3) 3Q’20 data is preliminary. Totals may not sum due to rounding. ICG: Institutional Clients Group. Reflects corporate credit exposures in the ICG. Includes energy-related exposures classified in other industries, primarily Public Sector and Transportation. Total exposure includes direct outstandings and unfunded commitments. E&P: Exploration and Production. RBL: Reserve-Based Lending. Services & Drilling includes Oil and Gas Equipment and Services, Oil and Gas Drilling and Offshore Drilling. 24 ~75% of unfunded exposures as of 3Q’20 are investment grade 2 Total FundedExposure(2) 3Q’202Q’203Q’202Q’20 2 FundedTotal Exposure(2) 3Q’202Q’203Q’202Q’20 AAA / AA / A18 %16 %34 %36 % BBB31313334 Ratings Detail Energy(1) Subsector Exposures 4.9% Funded Reserve Ratio FundedTotal Exposure(2) 3Q’202Q’203Q’202Q’20 Geographic Distribution as of 3Q’20(2) Energy / Energy-Related Exposure |
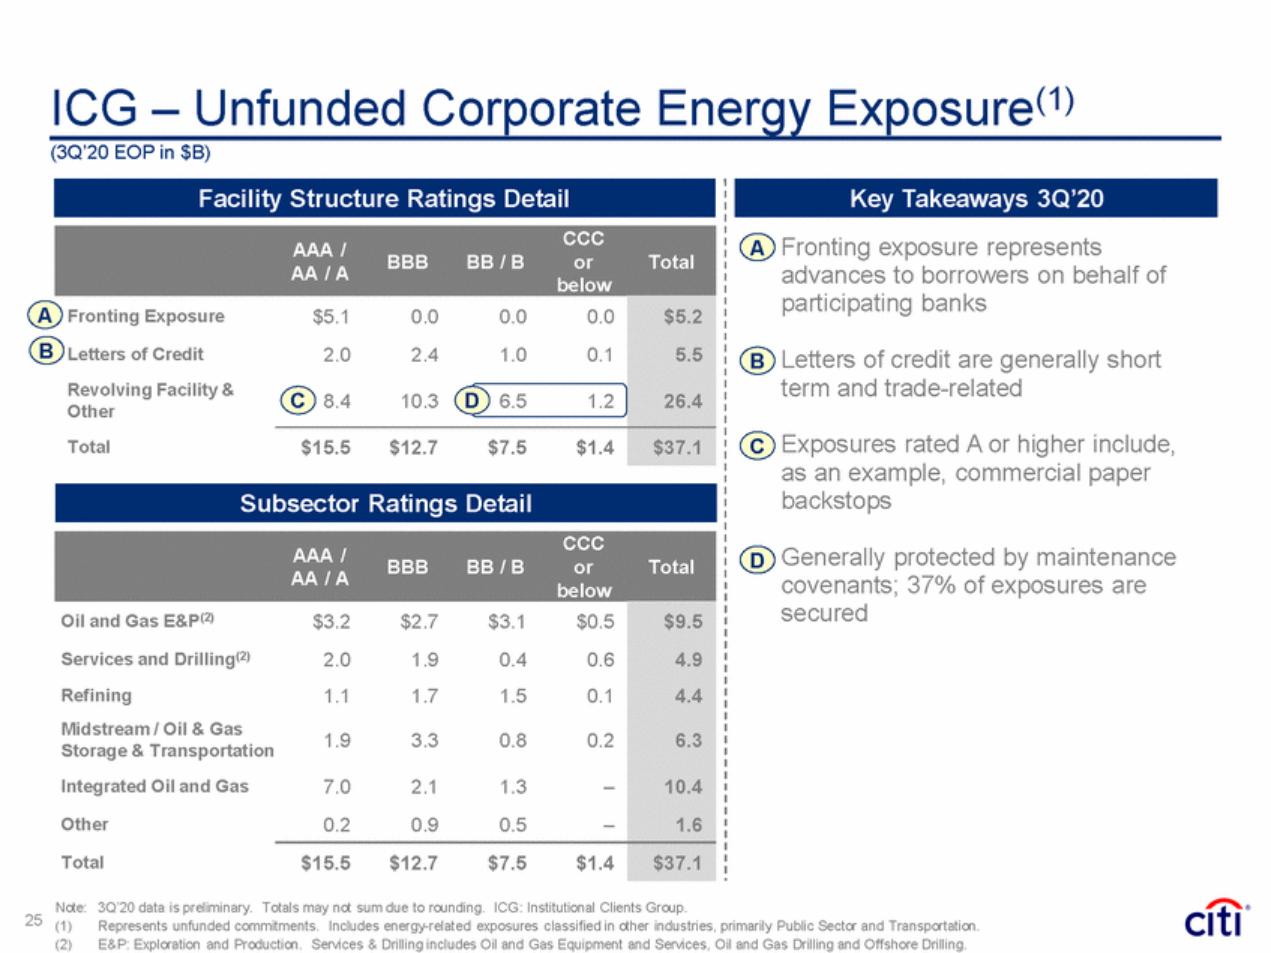
| Energy Exposure(1) ICG – Unfunded Corporate (3Q’20 EOP in $B) A• Fronting exposure represents advances to borrowers on behalf of participating banks below A B B• Letters of credit are generally short term and trade-related C• Exposures rated A or higher include, as an example, commercial paper backstops D• Generally protected by maintenance covenants; 37% of exposures are secured BBB BB / B or Total AA / A Note: (1) (2) 3Q’20 data is preliminary. Totals may not sum due to rounding. ICG: Institutional Clients Group. 25 Represents unfunded commitments. Includes energy-related exposures classified in other industries, primarily Public Sector and Transportation. E&P: Exploration and Production. Services & Drilling includes Oil and Gas Equipment and Services, Oil and Gas Drilling and Offshore Drilling. AAA /CCC below Oil and Gas E&P(2) Services and Drilling(2) Refining Midstream / Oil & Gas Storage & Transportation Integrated Oil and Gas Other Total $3.2$2.7$3.1$0.5 2.01.90.40.6 1.11.71.50.1 1.93.30.80.2 7.02.11.3– 0.20.90.5– $9.5 4.9 4.4 6.3 10.4 1.6 $15.5$12.7$7.5$1.4 $37.1 Subsector Ratings Detail AAA /CCC AA / ABBBBB / BorTotal Fronting Exposure Letters of Credit Revolving Facility & Other Total $5.10.00.00.0 2.02.41.00.1 C 8.410.3D6.51.2 $5.2 5.5 26.4 $15.5$12.7$7.5$1.4 $37.1 Key Takeaways 3Q’20 Facility Structure Ratings Detail |
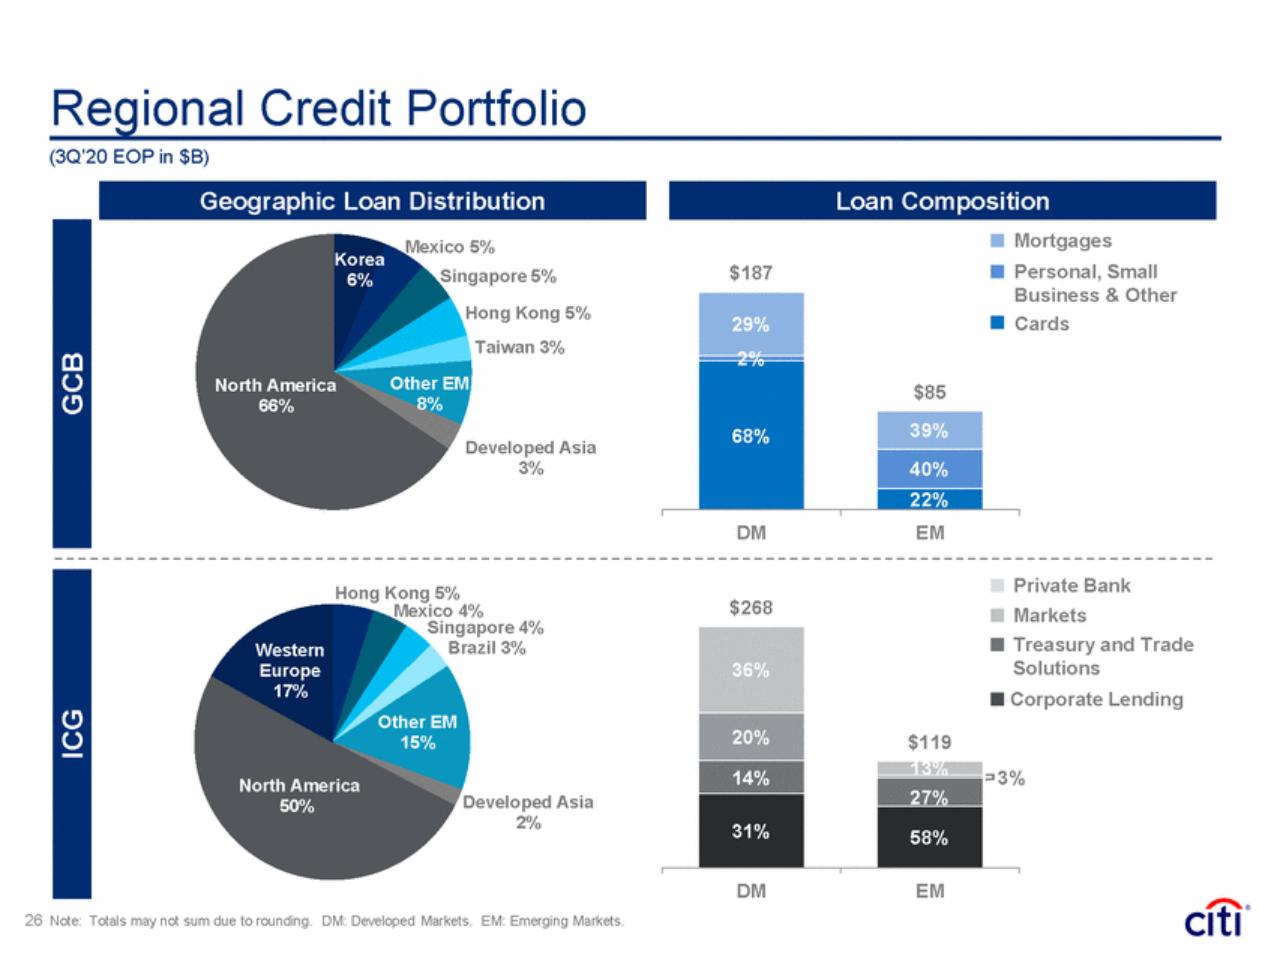
| Regional Credit Portfolio (3Q’20 EOP in $B) Mortgages Personal, Small Business & Other Mexico 5% Singapore 5% Korea 6% $187 Hong Kong 5% Taiwan 3% Cards Other 8% North America 66% Developed Asia 3% DM EM Private Bank Markets Hong Kong 5% $268 Mexico 4% Singapore 4% Brazil 3% Treasury and Trade Solutions Corporate Lending Western Europe 17% Other EM 15% 3% North America 50% Developed Asia 2% DM EM 26 Note: Totals may not sum due to rounding. DM: Developed Markets. EM: Emerging Markets. ICG GCB 36% $119 20% 14% 27% 31% 58% 29% $85 68% 39% 40% 22% Loan Composition Geographic Loan Distribution |
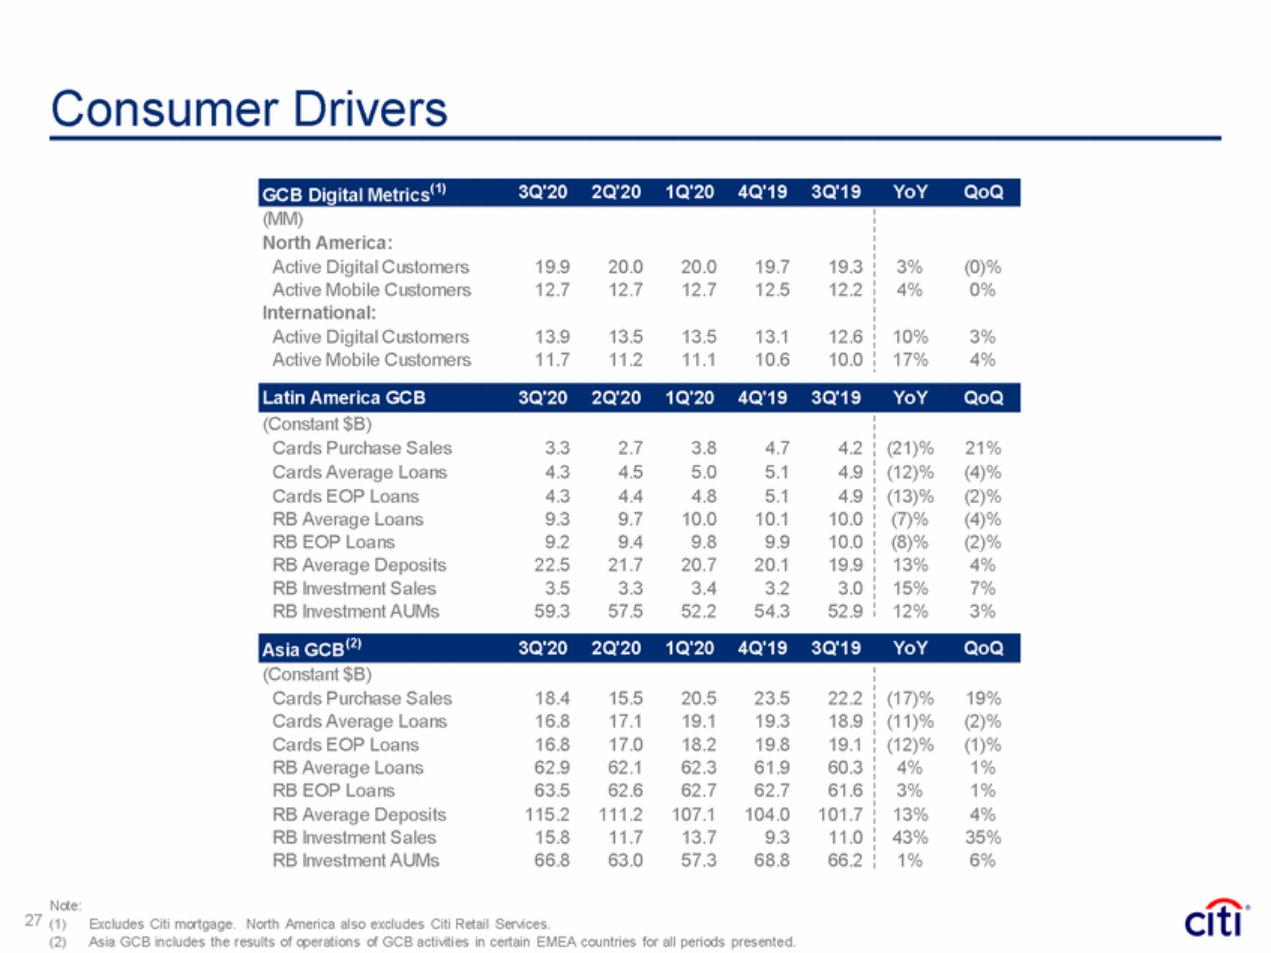
| Consumer Drivers (Constant $B) Cards Purchase Sales Cards Average Loans Cards EOP Loans RB Average Loans RB EOP Loans RB Average Deposits RB Investment Sales RB Investment AUMs 18.4 16.8 16.8 62.9 63.5 115.2 15.8 66.8 15.5 17.1 17.0 62.1 62.6 111.2 11.7 63.0 20.5 19.1 18.2 62.3 62.7 107.1 13.7 57.3 23.5 19.3 19.8 61.9 62.7 104.0 9.3 68.8 22.2 18.9 19.1 60.3 61.6 101.7 11.0 66.2 (17)% (11)% (12)% 4% 3% 13% 43% 1% 19% (2)% (1)% 1% 1% 4% 35% 6% Note: 27 (1)Excludes Citi mortgage. North America also excludes Citi Retail Services. (2) Asia GCB includes the results of operations of GCB activities in certain EMEA countries for all periods presented. Asia GCB(2)3Q'202Q'201Q'204Q'193Q'19YoYQoQ Latin America GCB 3Q'20 2Q'20 1Q'20 4Q'19 3Q'19 YoY QoQ (Constant $B) Cards Purchase Sales 3.3 2.7 3.8 4.7 4.2 Cards Average Loans 4.3 4.5 5.0 5.1 4.9 Cards EOP Loans 4.3 4.4 4.8 5.1 4.9 RB Average Loans 9.3 9.7 10.0 10.1 10.0 RB EOP Loans 9.2 9.4 9.8 9.9 10.0 RB Average Deposits 22.5 21.7 20.7 20.1 19.9 RB Investment Sales 3.5 3.3 3.4 3.2 3.0 RB Investment AUMs 59.3 57.5 52.2 54.3 52.9 (21)% 21% (12)% (4)% (13)% (2)% (7)% (4)% (8)% (2)% 13% 4% 15% 7% 12% 3% GCB Digital Metrics(1)3Q'202Q'201Q'204Q'193Q'19YoYQoQ (MM) North America: Active Digital Customers19.920.020.019.719.3 Active Mobile Customers12.712.712.712.512.2 International: Active Digital Customers13.913.513.513.112.6 Active Mobile Customers11.711.211.110.610.0 3%(0)% 4%0% 10%3% 17%4% |
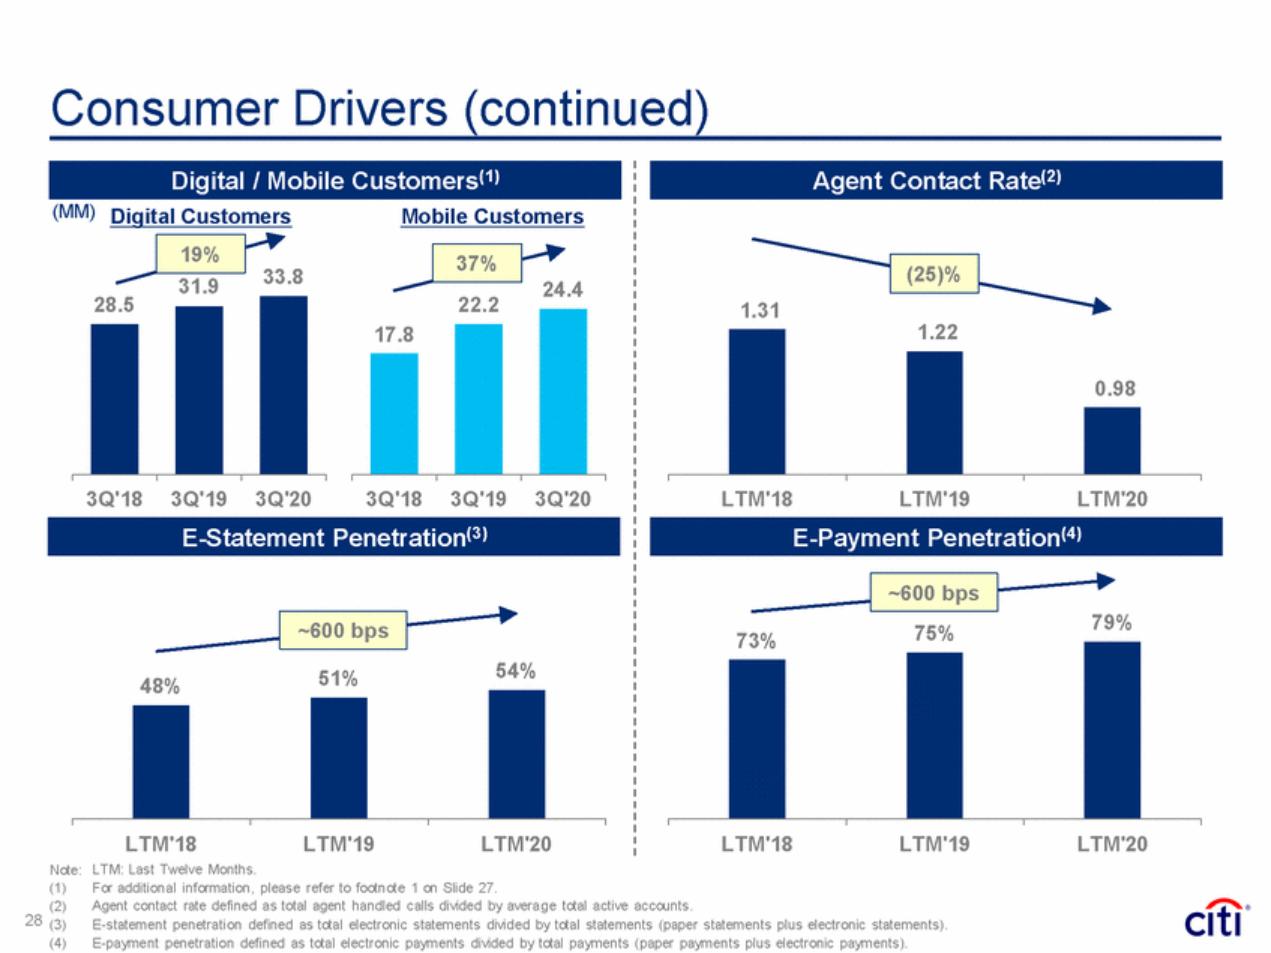
| Consumer Drivers (continued) (MM) Digital Customers Mobile Customers 33.8 31.9 24.4 28.5 22.2 1.31 3Q'18 3Q'19 3Q'20 3Q'18 3Q'19 3Q'20 LTM'18 LTM'19 LTM'20 79% 75% 73% 54% 51% 48% LTM'18 LTM: Last Twelve Months. LTM'19 LTM'20 LTM'18 LTM'19 LTM'20 Note: (1) For additional information, please refer to footnote 1 on Slide 27. Agent contact rate defined as total agent handled calls divided by average total active accounts. E-statement penetration defined as total electronic statements divided by total statements (paper statements plus electronic statements). E-payment penetration defined as total electronic payments divided by total payments (paper payments plus electronic payments). (2) 28 (3) (4) ~600 bps ~600 bps E-Statement Penetration(3) E-Payment Penetration(4) 1.22 0.98 17.8 (25)% 37% 19% Digital / Mobile Customers(1) Agent Contact Rate(2) |
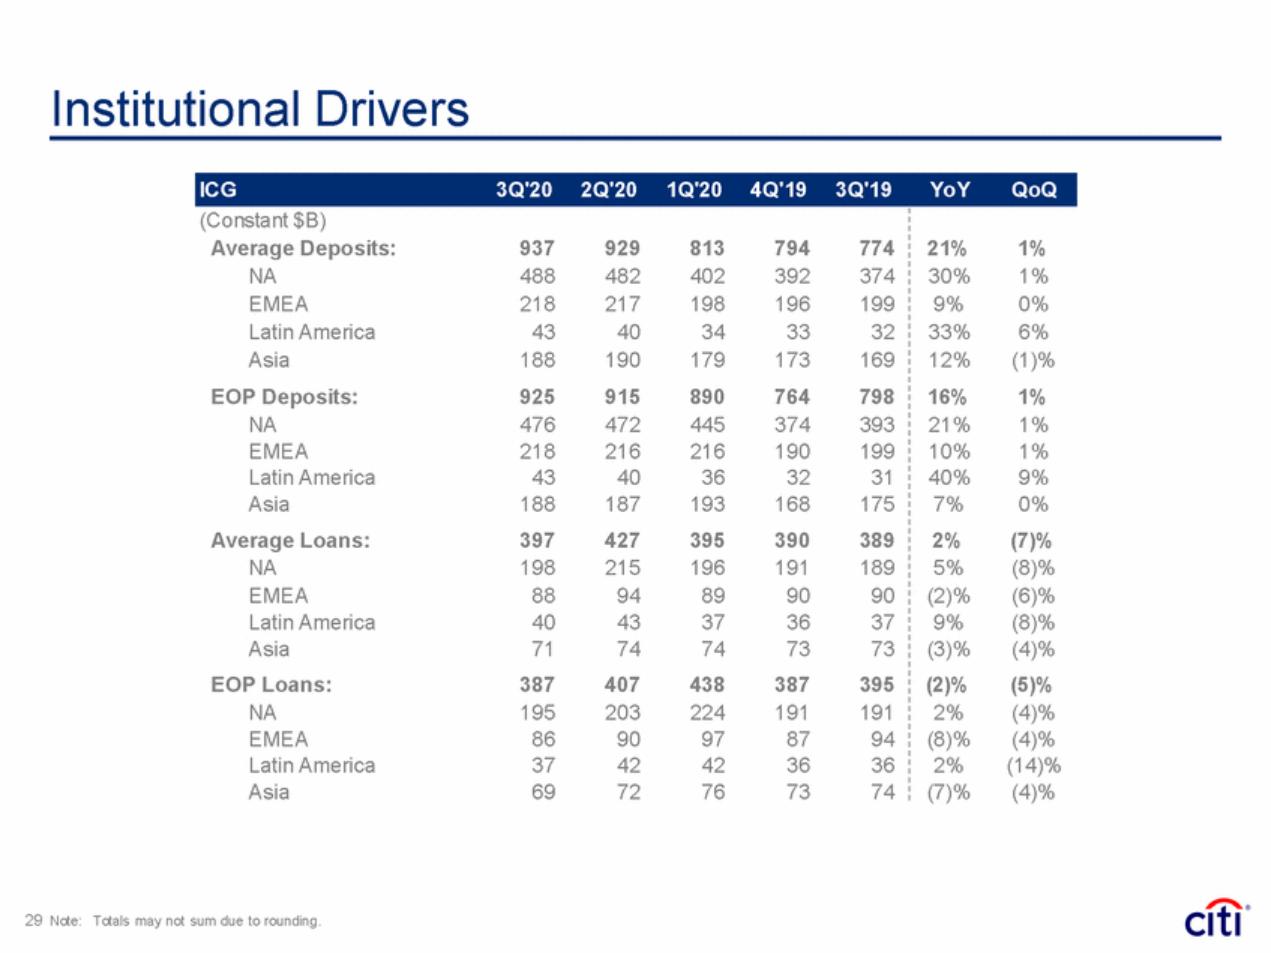
| Institutional Drivers 29 Note: Totals may not sum due to rounding. ICG3Q'202Q'201Q'204Q'193Q'19YoYQoQ (Constant $B) Average Deposits:937929813794774 NA488482402392374 EMEA218217198196199 Latin America4340343332 Asia188190179173169 EOP Deposits:925915890764798 NA476472445374393 EMEA218216216190199 Latin America4340363231 Asia188187193168175 Average Loans:397427395390389 NA198215196191189 EMEA8894899090 Latin America4043373637 Asia7174747373 EOP Loans:387407438387395 NA195203224191191 EMEA8690978794 Latin America3742423636 Asia6972767374 21%1% 30%1% 9%0% 33%6% 12%(1)% 16%1% 21%1% 10%1% 40%9% 7%0% 2%(7)% 5%(8)% (2)%(6)% 9%(8)% (3)%(4)% (2)%(5)% 2%(4)% (8)%(4)% 2%(14)% (7)%(4)% |
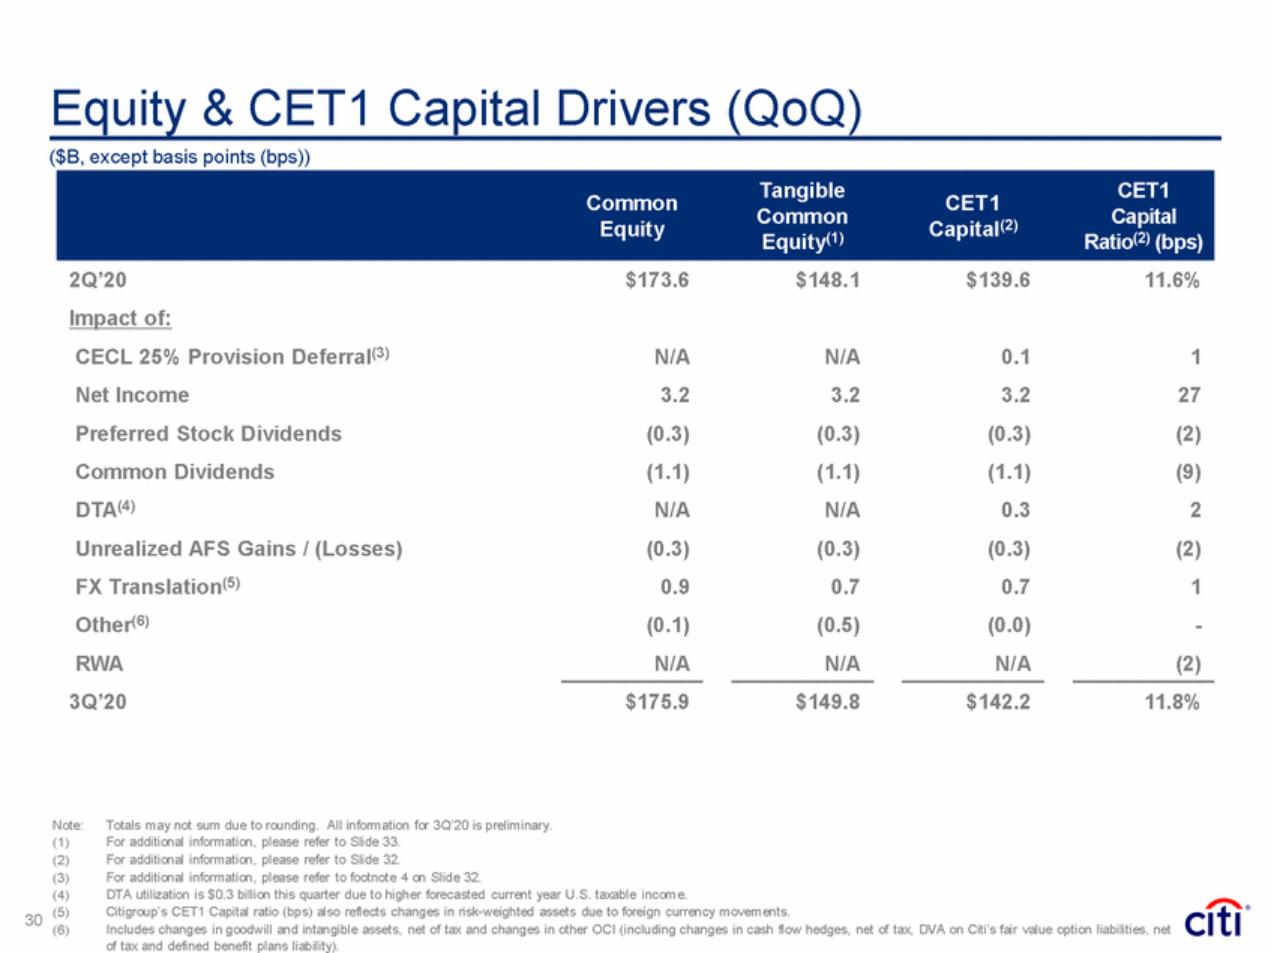
| Equity & CET1 Capital Drivers (QoQ) ($B, except basis points (bps)) Common Capital Equity Capital(2) 2Q’20 Impact of: $173.6 $148.1 $139.6 11.6% CECL 25% Provision Deferral(3) Net Income Preferred Stock Dividends Common Dividends DTA(4) Unrealized AFS Gains / (Losses) FX Translation(5) Other(6) RWA 3Q’20 N/A 3.2 (0.3) (1.1) N/A (0.3) 0.9 (0.1) N/A N/A 3.2 (0.3) (1.1) N/A (0.3) 0.7 (0.5) N/A 0.1 3.2 (0.3) (1.1) 0.3 (0.3) 0.7 (0.0) N/A 1 27 (2) (9) 2 (2) 1 - (2) $175.9 $149.8 $142.2 11.8% Note: (1) (2) (3) (4) (5) (6) Totals may not sum due to rounding. All information for 3Q’20 is preliminary. For additional information, please refer to Slide 33. For additional information, please refer to Slide 32. For additional information, please refer to footnote 4 on Slide 32. DTA utilization is $0.3 billion this quarter due to higher forecasted current year U.S. taxable income. Citigroup’s CET1 Capital ratio (bps) also reflects changes in risk-weighted assets due to foreign currency movements. Includes changes in goodwill and intangible assets, net of tax and changes in other OCI (including changes in cash flow hedges, net of tax, DVA on Citi’s fair value option liabilities, net of tax and defined benefit plans liability). 30 CommonTangibleCET1CET1 Equity(1) Ratio(2) (bps) |
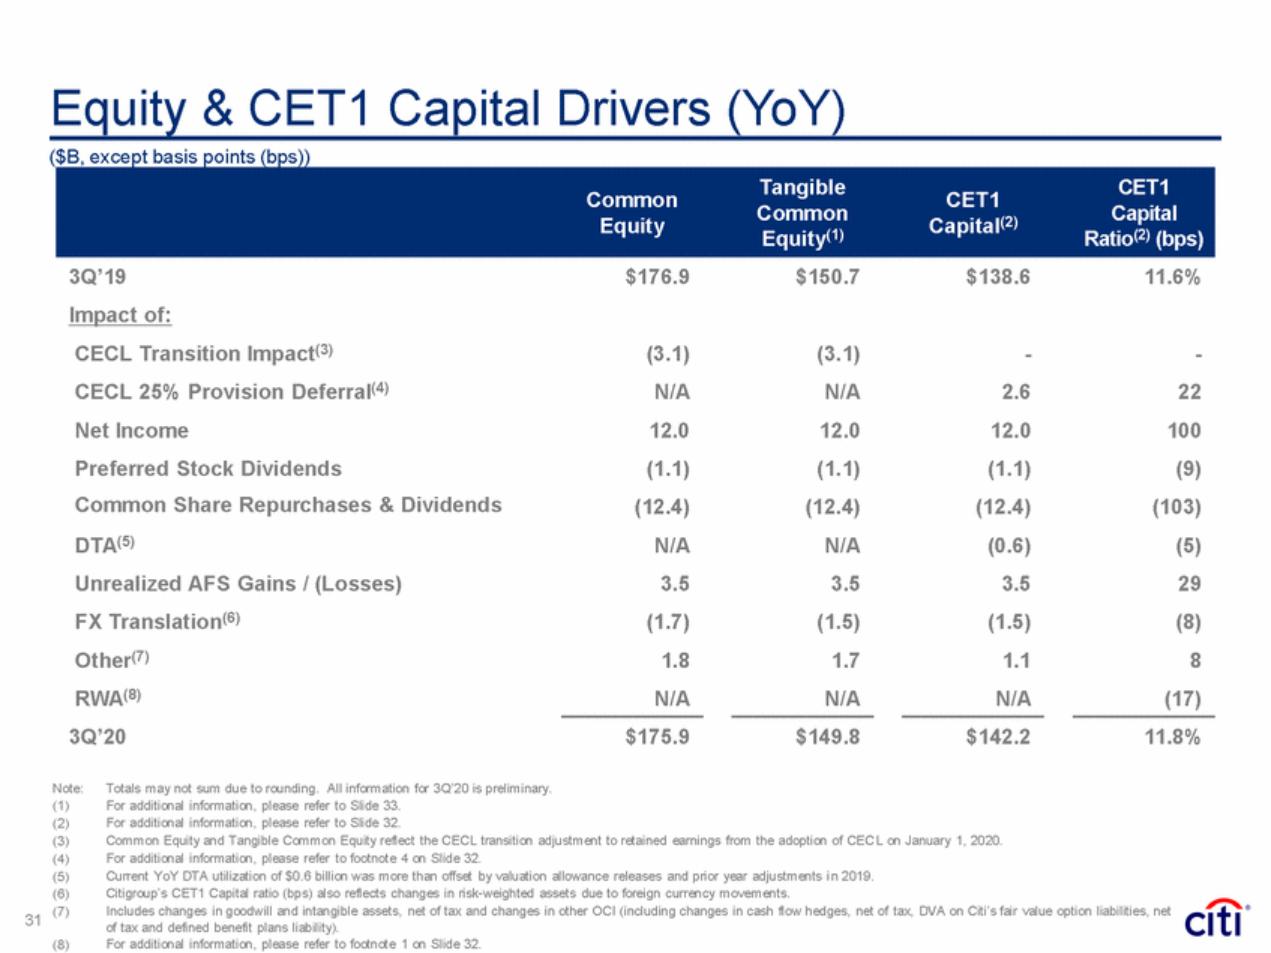
| Equity & CET1 Capital Drivers (YoY) ($B, except basis points (bps)) Common Capital Equity Capital(2) 3Q’19 Impact of: $176.9 $150.7 $138.6 11.6% CECL Transition Impact(3) CECL 25% Provision Deferral(4) Net Income Preferred Stock Dividends Common Share Repurchases & Dividends DTA(5) Unrealized AFS Gains / (Losses) FX Translation(6) Other(7) RWA(8) 3Q’20 (3.1) N/A 12.0 (1.1) (12.4) N/A 3.5 (1.7) 1.8 N/A (3.1) N/A 12.0 (1.1) (12.4) N/A 3.5 (1.5) 1.7 N/A - 2.6 12.0 (1.1) (12.4) (0.6) 3.5 (1.5) 1.1 N/A - 22 100 (9) (103) (5) 29 (8) 8 (17) $175.9 $149.8 $142.2 11.8% Note: (1) (2) (3) (4) (5) (6) (7) Totals may not sum due to rounding. All information for 3Q’20 is preliminary. For additional information, please refer to Slide 33. For additional information, please refer to Slide 32. Common Equity and Tangible Common Equity reflect the CECL transition adjustment to retained earnings from the adoption of CECL on January 1, 2020. For additional information, please refer to footnote 4 on Slide 32. Current YoY DTA utilization of $0.6 billion was more than offset by valuation allowance releases and prior year adjustments i n 2019. Citigroup’s CET1 Capital ratio (bps) also reflects changes in risk-weighted assets due to foreign currency movements. Includes changes in goodwill and intangible assets, net of tax and changes in other OCI (including changes in cash flow hedges, net of tax, DVA on Citi’s fair value option liabilities, net of tax and defined benefit plans liability). For additional information, please refer to footnote 1 on Slide 32. 31 (8) CommonTangibleCET1CET1 Equity(1) Ratio(2) (bps) |
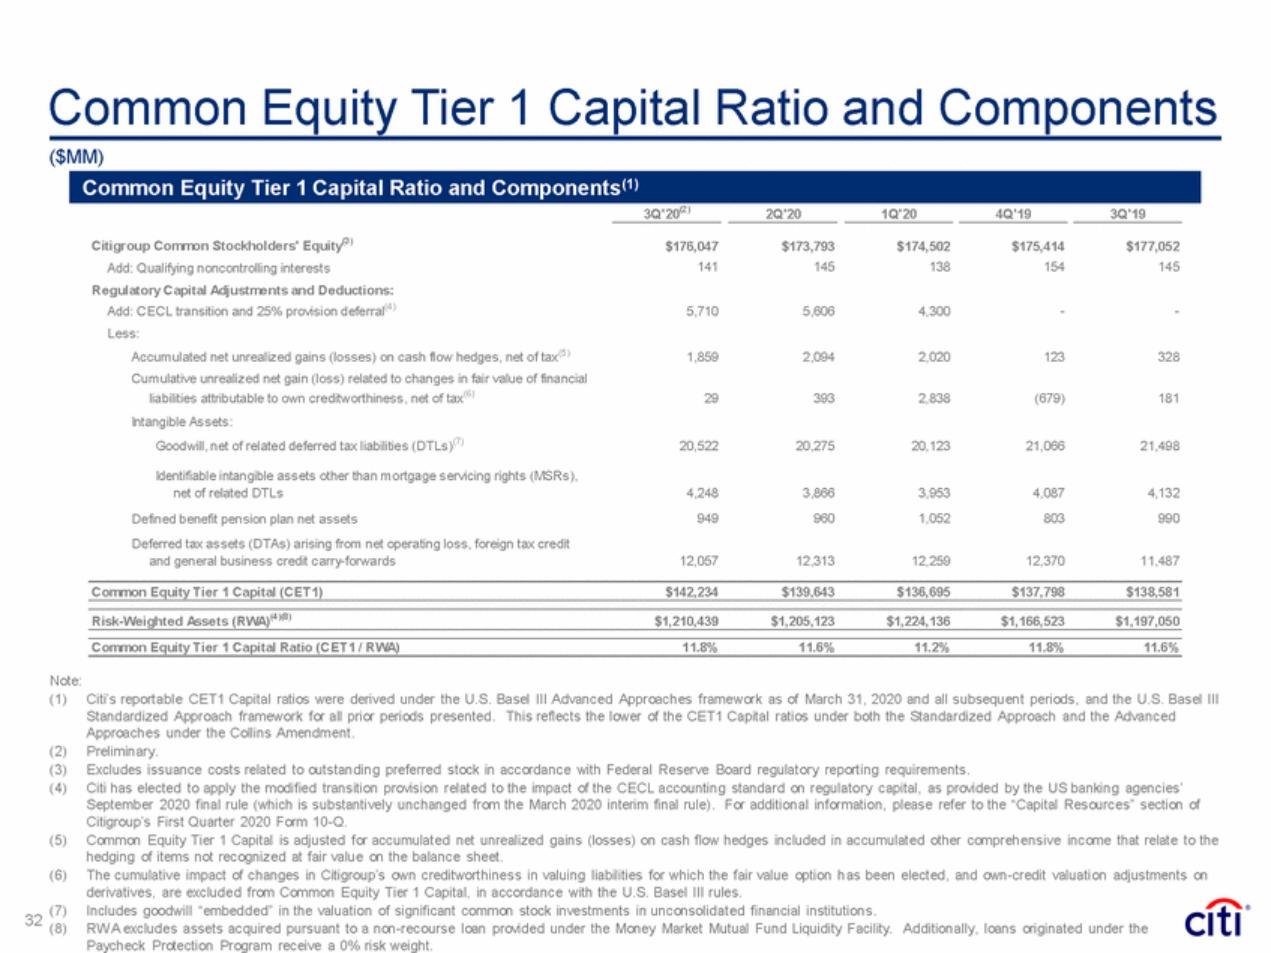
| Common Equity Tier 1 Capital Ratio and Components ($MM) 3Q'20(2) 2Q'20 1Q'20 4Q'19 3Q'19 Citigroup Common Stockholders' Equity(3) Add: Qualifying noncontrolling interests Regulatory Capital Adjustments and Deductions: Add: CECL transition and 25% provision deferral(4) Less: Accumulated net unrealized gains (losses) on cash flow hedges, net of tax(5) Cumulative unrealized net gain (loss) related to changes in fair value of financial liabilities attributable to own creditworthiness, net of tax(6) Intangible Assets: Goodwill, net of related deferred tax liabilities (DTLs)(7) Identifiable intangible assets other than mortgage servicing rights (MSRs), net of related DTLs Defined benefit pension plan net assets Deferred tax assets (DTAs) arising from net operating loss, foreign tax credit and general business credit carry-forwards $176,047 141 $173,793 145 $174,502 138 $175,414 154 $177,052 145 5,710 5,606 4,300 - - 1,859 2,094 2,020 123 328 29 393 2,838 (679) 181 20,522 20,275 20,123 21,066 21,498 4,248 949 3,866 960 3,953 1,052 4,087 803 4,132 990 12,057 12,313 12,259 12,370 11,487 Common Equity Tier 1 Capital (CET1) $142,234 $139,643 $136,695 $137,798 $138,581 Risk-Weighted Assets (RWA)(4)(8) $1,210,439 $1,205,123 $1,224,136 $1,166,523 $1,197,050 Common Equity Tier 1 Capital Ratio (CET1 / RWA) 11.8% 11.6% 11.2% 11.8% 11.6% Note: (1) Citi’s reportable CET1 Capital ratios were derived under the U.S. Basel III Advanced Approaches framework as of March 31, 2020 and all subsequent periods, and the U.S. Basel III Standardized Approach framework for all prior periods presented. This reflects the lower of the CET1 Capital ratios under both the Standardized Approach and the Advanced Approaches under the Collins Amendment. Preliminary. Excludes issuance costs related to outstanding preferred stock in accordance with Federal Reserve Board regulatory reporting requirements. Citi has elected to apply the modified transition provision related to the impact of the CECL accounting standard on regulatory capital, as provided by the US banking agencies’ September 2020 final rule (which is substantively unchanged from the March 2020 interim final rule). For additional information, please refer to the “Capital Resources” section of Citigroup’s First Quarter 2020 Form 10-Q. Common Equity Tier 1 Capital is adjusted for accumulated net unrealized gains (losses) on cash flow hedges included in accumulated other comprehensive income that relate to the hedging of items not recognized at fair value on the balance sheet. The cumulative impact of changes in Citigroup’s own creditworthiness in valuing liabilities for which the fair value option h as been elected, and own-credit valuation adjustments on derivatives, are excluded from Common Equity Tier 1 Capital, in accordance with the U.S. Basel III rules. Includes goodwill “embedded” in the valuation of significant common stock investments in unconsolidated financial institutions. RW A excludes assets acquired pursuant to a non-recourse loan provided under the Money Market Mutual Fund Liquidity Facility. Additionally, loans originated under the Paycheck Protection Program receive a 0% risk weight. (2) (3) (4) (5) (6) (7) 32 (8) Common Equity Tier 1 Capital Ratio and Components(1) |
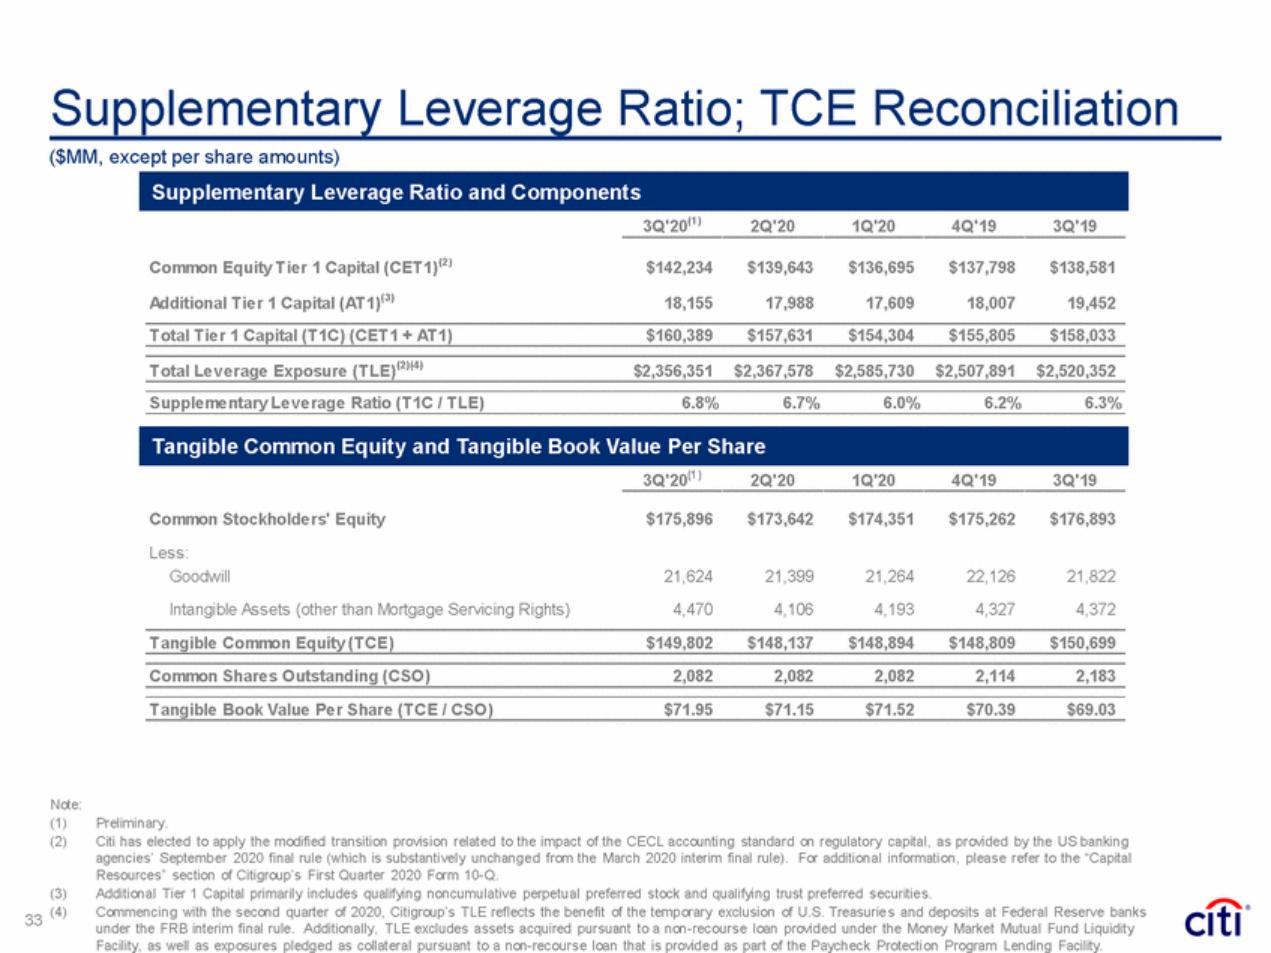
| Supplementary Leverage Ratio; TCE Reconciliation ($MM, except per share amounts) 3Q'20(1) 2Q'20 1Q'20 4Q'19 3Q'19 Common Equity Tier 1 Capital (CET1)(2) Additional Tier 1 Capital (AT1)(3) $142,234 $139,643 $136,695 $137,798 $138,581 18,155 17,988 17,609 18,007 19,452 Total Tier 1 Capital (T1C) (CET1 + AT1) $160,389 $157,631 $154,304 $155,805 $158,033 Total Leverage Exposure (TLE)(2)(4) $2,356,351 $2,367,578 $2,585,730 $2,507,891 $2,520,352 Supplementary Leverage Ratio (T1C / TLE) 6.8% 6.7% 6.0% 6.2% 6.3% 3Q'20(1) 2Q'20 1Q'20 4Q'19 3Q'19 Common Stockholders' Equity Less: Goodwill Intangible Assets (other than Mortgage Servicing Rights) $175,896 $173,642 $174,351 $175,262 $176,893 21,624 4,470 21,399 4,106 21,264 4,193 22,126 4,327 21,822 4,372 Tangible Common Equity (TCE) $149,802 $148,137 $148,894 $148,809 $150,699 Common Shares Outstanding (CSO) 2,082 2,082 2,082 2,114 2,183 Tangible Book Value Per Share (TCE / CSO) $71.95 $71.15 $71.52 $70.39 $69.03 Note: (1) (2) Preliminary. Citi has elected to apply the modified transition provision related to the impact of the CECL accounting standard on regulatory capital, as provided by the US banking agencies’ September 2020 final rule (which is substantively unchanged from the March 2020 interim final rule). For additional information, please refer to the “Capital Resources” section of Citigroup’s First Quarter 2020 Form 10-Q. Additional Tier 1 Capital primarily includes qualifying noncumulative perpetual preferred stock and qualifying trust preferred securities. Commencing with the second quarter of 2020, Citigroup’s TLE reflects the benefit of the temporary exclusion of U.S. Treasuries and deposits at Federal Reserve banks under the FRB interim final rule. Additionally, TLE excludes assets acquired pursuant to a non-recourse loan provided under the Money Market Mutual Fund Liquidity Facility, as well as exposures pledged as collateral pursuant to a non-recourse loan that is provided as part of the Paycheck Protection Program Lending Facility. (3) (4) 33 Tangible Common Equity and Tangible Book Value Per Share Supplementary Leverage Ratio and Components |
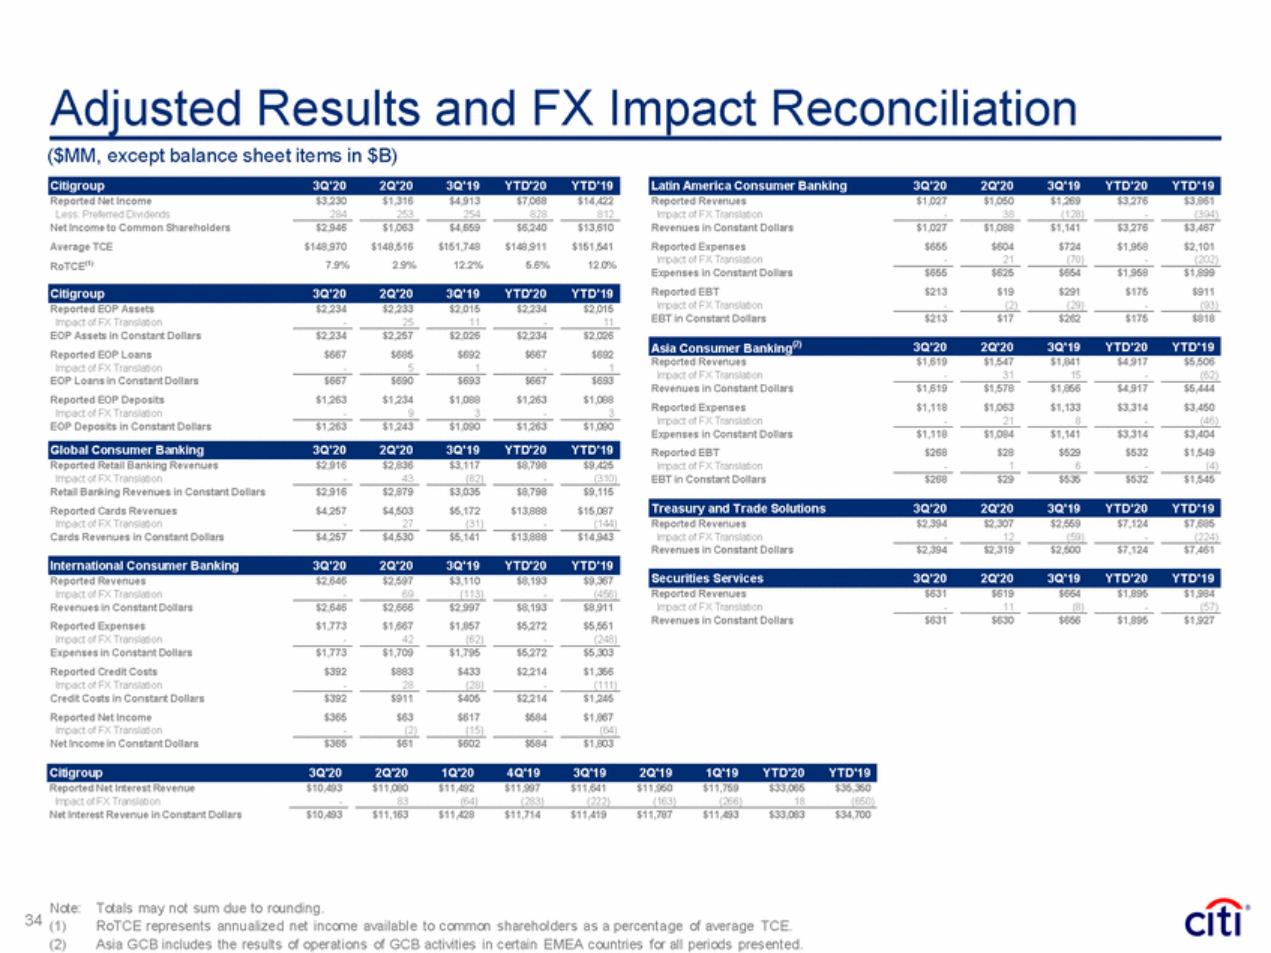
| Adjusted Results and FX Impact Reconciliation ($MM, except balance sheet items in $B) Reported Net Income Less: Preferred Dividends Net Income to Common Shareholders Average TCE $3,230 $1,316 $4,913 $7,068 $14,422 Reported Revenues Impact of FX Translation Revenues in Constant Dollars Reported Expenses Impact of FX Translation Expenses in Constant Dollars Reported EBT Impact of FX Translation EBT in Constant Dollars $1,027 $1,050 $1,269 $3,276 $3,861 284 253 254 828 812 - 38 (128) - (394) $2,946 $148,970 7.9% $1,063 $148,516 2.9% $4,659 $151,748 12.2% $6,240 $148,911 5.6% $13,610 $151,541 12.0% $1,027 $655 $1,088 $604 $1,141 $724 $3,276 $1,958 $3,467 $2,101 - 21 (70) - (202) (1) RoTCE $655 $213 $625 $19 $654 $291 (29) $1,958 $175 $1,899 $911 - (2) - (93) Reported EOP Assets Impact of FX Translation EOP Assets in Constant Dollars Reported EOP Loans Impact of FX Translation EOP Loans in Constant Dollars Reported EOP Deposits Impact of FX Translation EOP Deposits in Constant Dollars $2,234 - $2,233 25 $2,015 11 $2,234 - $2,015 11 $213 $17 $262 $175 $818 $2,234 $667 $2,257 $685 $2,026 $692 $2,234 $667 $2,026 $692 Reported Revenues Impact of FX Translation Revenues in Constant Dollars Reported Expenses Impact of FX Translation Expenses in Constant Dollars Reported EBT Impact of FX Translation EBT in Constant Dollars $1,619 $1,547 $1,841 $4,917 $5,506 - 5 1 - 1 - 31 15 - (62) $667 $1,263 $690 $1,234 $693 $1,088 $667 $1,263 $693 $1,088 $1,619 $1,118 $1,578 $1,063 $1,856 $1,133 $4,917 $3,314 $5,444 $3,450 - 9 3 - 3 - 21 8 - (46) $1,263 $1,243 $1,090 $1,263 $1,090 $1,118 $268 - $1,084 $28 1 $1,141 $529 6 $3,314 $532 - $3,404 $1,549 (4) Reported Retail Banking Revenues Impact of FX Translation Retail Banking Revenues in Constant Dollars Reported Cards Revenues Impact of FX Translation Cards Revenues in Constant Dollars $2,916 - $2,836 43 $3,117 (82) $8,798 - $9,425 (310) $268 $29 $535 $532 $1,545 $2,916 $4,257 - $2,879 $4,503 27 $3,035 $5,172 (31) $8,798 $13,888 - $9,115 $15,087 (144) Reported Revenues Impact of FX Translation Revenues in Constant Dollars $2,394 - $2,307 12 $2,559 (59) $7,124 - $7,685 (224) $4,257 $4,530 $5,141 $13,888 $14,943 $2,394 $2,319 $2,500 $7,124 $7,461 Reported Revenues Impact of FX Translation Revenues in Constant Dollars Reported Expenses Impact of FX Translation Expenses in Constant Dollars Reported Credit Costs Impact of FX Translation Credit Costs in Constant Dollars Reported Net Income Impact of FX Translation Net Income in Constant Dollars $2,646 - $2,597 69 $3,110 (113) $8,193 - $9,367 (456) Reported Revenues Impact of FX Translation Revenues in Constant Dollars $631 - $619 11 $664 (8) $1,895 - $1,984 (57) $2,646 $1,773 $2,666 $1,667 $2,997 $1,857 $8,193 $5,272 $8,911 $5,551 $631 $630 $656 $1,895 $1,927 - 42 (62) - (248) $1,773 $392 $1,709 $883 $1,795 $433 $5,272 $2,214 $5,303 $1,356 - 28 (28) - (111) $392 $365 $911 $63 $405 $617 (15) $2,214 $584 $1,245 $1,867 - (2) - (64) $365 $61 $602 $584 $1,803 Reported Net Interest Revenue Impact of FX Translation Net Interest Revenue in Constant Dollars $10,493 $11,080 $11,492 $11,997 $11,641 $11,950 $11,759 $33,065 $35,350 - 83 (64) (283) (222) (163) (266) 18 (650) $10,493 $11,163 $11,428 $11,714 $11,419 $11,787 $11,493 $33,083 $34,700 Note: 34 (1) (2) Totals may not sum due to rounding. RoTCE represents annualized net income available to common shareholders as a percentage of average TCE. Asia GCB includes the results of operations of GCB activities in certain EMEA countries for all periods presented. Citigroup 3Q'20 2Q'20 1Q'20 4Q'19 3Q'19 2Q'19 1Q'19 YTD'20 YTD'19 Securities Services 3Q'20 2Q'20 3Q'19 YT D'20 YT D'19 International Consumer Banking 3Q'20 2Q'20 3Q'19 YT D'20 YT D'19 T reasury and T rade Solutions 3Q'20 2Q'20 3Q'19 YT D'20 YT D'19 Global Consumer Banking 3Q'20 2Q'20 3Q'19 YT D'20 YT D'19 Asia Consumer Banking(2) 3Q'20 2Q'20 3Q'19 YT D'20 YT D'19 Citigroup 3Q'20 2Q'20 3Q'19 YT D'20 YT D'19 Citigroup 3Q'20 2Q'20 3Q'19 YT D'20 YT D'19 Latin America Consumer Banking 3Q'20 2Q'20 3Q'19 YT D'20 YT D'19 |

