Attached files
| file | filename |
|---|---|
| 8-K - 8-K - Old COPPER Company, Inc. | d29947d8k.htm |
Exhibit 99.1
Fifth Updated DIP Budget
(US $MMs)
| A / F | F | F | F | F | F | F | F | F | F | F | F | F | F | 4 | 5 | 4 | 13-Weeks |
|||||||||||||||||||||||||||||||||||||||||||||||||||||
| Fiscal Month | Oct | Oct | Oct | Oct | Nov | Nov | Nov | Nov | Nov | Dec | Dec | Dec | Dec | Oct | Nov | Dec | ||||||||||||||||||||||||||||||||||||||||||||||||||||||
| Fiscal Week | 36 | 37 | 38 | 39 | 40 | 41 | 42 | 43 | 44 | 45 | 46 | 47 | 48 | 39 | 44 | 48 | 4-Oct | |||||||||||||||||||||||||||||||||||||||||||||||||||||
| Year | FY20 | FY20 | FY20 | FY20 | FY20 | FY20 | FY20 | FY20 | FY20 | FY20 | FY20 | FY20 | FY20 | FY20 | FY20 | FY20 | thru | |||||||||||||||||||||||||||||||||||||||||||||||||||||
| Week Ending | 10-Oct | 17-Oct | 24-Oct | 31-Oct | 7-Nov | 14-Nov | 21-Nov | 28-Nov | 5-Dec | 12-Dec | 19-Dec | 26-Dec | 2-Jan | 31-Oct | 5-Dec | 2-Jan | 2-Jan | |||||||||||||||||||||||||||||||||||||||||||||||||||||
| Net Sales | $ | 126 | $ | 133 | $ | 122 | $ | 119 | $ | 142 | $ | 147 | $ | 164 | $ | 309 | $ | 243 | $ | 283 | $ | 318 | $ | 273 | $ | 117 | $ | 500 | $ | 1,007 | $ | 990 | $ | 2,496 | ||||||||||||||||||||||||||||||||||||
| Collections & Disbursements |
|
|||||||||||||||||||||||||||||||||||||||||||||||||||||||||||||||||||||
| Cash Receipts |
|
|||||||||||||||||||||||||||||||||||||||||||||||||||||||||||||||||||||
| 1 |
Sales Receipts | $ | 125 | $ | 136 | $ | 130 | $ | 129 | $ | 134 | $ | 150 | $ | 164 | $ | 273 | $ | 295 | $ | 266 | $ | 314 | $ | 292 | $ | 163 | $ | 520 | $ | 1,016 | $ | 1,035 | $ | 2,571 | |||||||||||||||||||||||||||||||||||
| 2 |
Other Receipts | 22 | 8 | 4 | 5 | 5 | 8 | 6 | 6 | 6 | 13 | 15 | 27 | 16 | 38 | 31 | 72 | 141 | ||||||||||||||||||||||||||||||||||||||||||||||||||||
|
|
|
|
|
|
|
|
|
|
|
|
|
|
|
|
|
|
|
|
|
|
|
|
|
|
|
|
|
|
|
|
|
|
|
|||||||||||||||||||||||||||||||||||||
| Total Collections |
$ | 147 | $ | 144 | $ | 134 | $ | 134 | $ | 139 | $ | 158 | $ | 170 | $ | 279 | $ | 300 | $ | 280 | $ | 328 | $ | 319 | $ | 180 | $ | 558 | $ | 1,047 | $ | 1,107 | $ | 2,712 | ||||||||||||||||||||||||||||||||||||
| Operating Disbursements |
|
|||||||||||||||||||||||||||||||||||||||||||||||||||||||||||||||||||||
| 3 |
Domestic Merchandise Vendor | $ | (61 | ) | $ | (53 | ) | $ | (56 | ) | $ | (64 | ) | $ | (62 | ) $ | (55 | ) $ | (46 | ) $ | (53 | ) | $ | (43 | ) | $ | (51 | ) | $ | (64 | ) | $ | (50 | ) | $ | (41 | ) | (235 | ) | (259 | ) | (206 | ) | (700 | ) | |||||||||||||||||||||||||
| 4 |
Import Merchandise Vendor | (22 | ) | (27 | ) | (25 | ) | (21 | ) | (16 | ) | (27 | ) | (26 | ) | (11 | ) | (28 | ) | (27 | ) | (28 | ) | (14 | ) | (9 | ) | (95 | ) | (108 | ) | (78 | ) | (281 | ) | |||||||||||||||||||||||||||||||||||
| 5 |
Sales, Use, and Other Taxes | (2 | ) | (13 | ) | (6 | ) | (8 | ) | (2 | ) | (16 | ) | (33 | ) | (0 | ) | (1 | ) | (9 | ) | (33 | ) | (21 | ) | (3 | ) | (30 | ) | (52 | ) | (65 | ) | (146 | ) | |||||||||||||||||||||||||||||||||||
| 6 |
Freight, Duty, and Broker | (8 | ) | (8 | ) | (23 | ) | (9 | ) | (10 | ) | (8 | ) | (28 | ) | (9 | ) | (10 | ) | (8 | ) | (7 | ) | (28 | ) | (8 | ) | (46 | ) | (65 | ) | (51 | ) | (163 | ) | |||||||||||||||||||||||||||||||||||
| 7 |
Payroll and Benefits | (16 | ) | (41 | ) | (27 | ) | (38 | ) | (18 | ) | (39 | ) | (21 | ) | (24 | ) | (38 | ) | (32 | ) | (35 | ) | (28 | ) | (35 | ) | (121 | ) | (140 | ) | (130 | ) | (392 | ) | |||||||||||||||||||||||||||||||||||
| 8 |
Occupancy | (5 | ) | (8 | ) | (7 | ) | (13 | ) | (20 | ) | (10 | ) | (12 | ) | (15 | ) | (18 | ) | (8 | ) | (7 | ) | (13 | ) | (4 | ) | (34 | ) | (75 | ) | (32 | ) | (141 | ) | |||||||||||||||||||||||||||||||||||
| 9 |
Non-Marketing Operating (NFR) | (17 | ) | (15 | ) | (17 | ) | (10 | ) | (9 | ) | (30 | ) | (11 | ) | (12 | ) | (9 | ) | (17 | ) | (23 | ) | (19 | ) | (13 | ) | (58 | ) | (71 | ) | (72 | ) | (201 | ) | |||||||||||||||||||||||||||||||||||
| 10 |
Marketing | (5 | ) | (13 | ) | (5 | ) | (7 | ) | (7 | ) | (19 | ) | (7 | ) | (5 | ) | (5 | ) | (10 | ) | (10 | ) | (15 | ) | (11 | ) | (31 | ) | (44 | ) | (45 | ) | (120 | ) | |||||||||||||||||||||||||||||||||||
| 11 |
Other | — | — | — | — | — | — | — | — | — | — | — | — | — | — | — | — | — | ||||||||||||||||||||||||||||||||||||||||||||||||||||
|
|
|
|
|
|
|
|
|
|
|
|
|
|
|
|
|
|
|
|
|
|
|
|
|
|
|
|
|
|
|
|
|
|
|
|||||||||||||||||||||||||||||||||||||
| Total Operating Disbursements |
$ | (136 | ) | $ | (178 | ) | $ | (166 | ) | $ | (170 | ) | $ | (144 | ) | $ | (204 | ) | $ | (185 | ) | $ | (130 | ) | $ | (152 | ) | $ | (161 | ) | $ | (207 | ) | $ | (189 | ) | $ | (123 | ) | $ | (649 | ) | $ | (815 | ) | $ | (680 | ) | $ | (2,144 | ) | |||||||||||||||||||
| Non-Operating Disbursements |
|
|||||||||||||||||||||||||||||||||||||||||||||||||||||||||||||||||||||
| 12 |
Debt Service and Fees | $ | (21 | ) | $ | (1 | ) | $ | (1 | ) | $ | (11 | ) | $ | (15 | ) $ | (1 | ) $ | (1 | ) $ | (1 | ) | $ | (10 | ) | $ | (1 | ) | $ | (1 | ) | $ | (1 | ) | $ | (47 | ) | (32 | ) | (27 | ) | (48 | ) | (108 | ) | |||||||||||||||||||||||||
|
13 |
Restructuring Professionals | (5 | ) | (11 | ) | (1 | ) | (7 | ) | (2 | ) | (9 | ) | (1 | ) | (11 | ) | (1 | ) | (4 | ) | (2 | ) | (11 | ) | (1 | ) | (25 | ) | (24 | ) | (18 | ) | (66 | ) | |||||||||||||||||||||||||||||||||||
| 14 |
Other Non-Operating | (1 | ) | (1 | ) | (1 | ) | (1 | ) | (1 | ) | (1 | ) | (1 | ) | (1 | ) | (1 | ) | (1 | ) | (1 | ) | (1 | ) | (1 | ) | (3 | ) | (4 | ) | (3 | ) | (10 | ) | |||||||||||||||||||||||||||||||||||
|
|
|
|
|
|
|
|
|
|
|
|
|
|
|
|
|
|
|
|
|
|
|
|
|
|
|
|
|
|
|
|
|
|
|
|||||||||||||||||||||||||||||||||||||
| Total Non-Operating Disbursements |
$ | (26 | ) | $ | (12 | ) | $ | (3 | ) | $ | (18 | ) | $ | (18 | ) | $ | (10 | ) | $ | (3 | ) | $ | (12 | ) | $ | (12 | ) | $ | (6 | ) | $ | (3 | ) | $ | (12 | ) | $ | (49 | ) | $ | (59 | ) | $ | (55 | ) | $ | (69 | ) | $ | (184 | ) | |||||||||||||||||||
|
|
|
|
|
|
|
|
|
|
|
|
|
|
|
|
|
|
|
|
|
|
|
|
|
|
|
|
|
|
|
|
|
|
|
|||||||||||||||||||||||||||||||||||||
| Net Cash Flow |
$ | (15 | ) | $ | (46 | ) | $ | (35 | ) | $ | (54 | ) | $ | (23 | ) | $ | (56 | ) | $ | (18 | ) | $ | 137 | $ | 136 | $ | 113 | $ | 119 | $ | 118 | $ | 7 | $ | (150 | ) | $ | 177 | $ | 358 | $ | 384 | ||||||||||||||||||||||||||||
|
|
|
|
|
|
|
|
|
|
|
|
|
|
|
|
|
|
|
|
|
|
|
|
|
|
|
|
|
|
|
|
|
|
|
|||||||||||||||||||||||||||||||||||||
| Liquidity |
||||||||||||||||||||||||||||||||||||||||||||||||||||||||||||||||||||||
| Short Term Investments Position |
|
|||||||||||||||||||||||||||||||||||||||||||||||||||||||||||||||||||||
| 15 |
Book Cash - Beginning | $ | 875 | $ | 860 | $ | 814 | $ | 779 | $ | 725 | $ | 702 | $ | 646 | $ | 628 | $ | 765 | $ | 901 | $ | 1,014 | $ | 1,133 | $ | 1,251 | $ | 875 | $ | 725 | $ | 901 | $ | 875 | |||||||||||||||||||||||||||||||||||
| 16 |
Plus: Net Cash Flow | (15 | ) | (46 | ) | (35 | ) | (54 | ) | (23 | ) | (56 | ) | (18 | ) | 137 | 136 | 113 | 119 | 118 | 7 | (150 | ) | 177 | 358 | 384 | ||||||||||||||||||||||||||||||||||||||||||||
| 17 |
Plus: Revolver Draw/(Paydown) | — | — | — | — | — | — | — | — | — | — | — | — | — | — | — | — | — | ||||||||||||||||||||||||||||||||||||||||||||||||||||
| 18 |
Plus: DIP/Escrow Cash Draw | — | — | — | — | — | — | — | — | — | — | — | — | — | — | — | — | — | ||||||||||||||||||||||||||||||||||||||||||||||||||||
| 19 |
Plus: Treasury Transfers | — | — | — | — | — | — | — | — | — | — | — | — | — | — | — | — | — | ||||||||||||||||||||||||||||||||||||||||||||||||||||
|
|
|
|
|
|
|
|
|
|
|
|
|
|
|
|
|
|
|
|
|
|
|
|
|
|
|
|
|
|
|
|
|
|
|
|||||||||||||||||||||||||||||||||||||
| Short Term Investments - Ending |
$ | 860 | $ | 814 | $ | 779 | $ | 725 | $ | 702 | $ | 646 | $ | 628 | $ | 765 | $ | 901 | $ | 1,014 | $ | 1,133 | $ | 1,251 | $ | 1,259 | $ | 725 | $ | 901 | $ | 1,259 | $ | 1,259 | ||||||||||||||||||||||||||||||||||||
| 20 |
DIP/Escrow Cash | $ | 225 | $ | 225 | $ | 225 | $ | 225 | $ | 225 | $ | 225 | $ | 225 | $ | 225 | $ | 225 | $ | 225 | $ | 225 | $ | 225 | $ | 225 | $ | 225 | $ | 225 | $ | 225 | $ | 225 | |||||||||||||||||||||||||||||||||||
| 21 |
Prof Fee Carveout Escrow | (66 | ) | (68 | ) | (67 | ) | (62 | ) | (70 | ) | (64 | ) | (71 | ) | (63 | ) | (71 | ) | (68 | ) | (76 | ) | (67 | ) | (75 | ) | (62 | ) | (71 | ) | (75 | ) | (75 | ) | |||||||||||||||||||||||||||||||||||
| 22 |
Posted ABL Cash Collateral / Cash Collateral L/C | (193 | ) | (209 | ) | (200 | ) | (195 | ) | (181 | ) | (132 | ) | (96 | ) | (84 | ) | (86 | ) | (249 | ) | (332 | ) | (374 | ) | (458 | ) | (195 | ) | (86 | ) | (458 | ) | (458 | ) | |||||||||||||||||||||||||||||||||||
| 23 |
Funded Reserve Account | (25 | ) | (28 | ) | (28 | ) | (28 | ) | (28 | ) | (28 | ) | (28 | ) | (28 | ) | (28 | ) | (28 | ) | (28 | ) | (28 | ) | (28 | ) | (28 | ) | (28 | ) | (28 | ) | (28 | ) | |||||||||||||||||||||||||||||||||||
|
|
|
|
|
|
|
|
|
|
|
|
|
|
|
|
|
|
|
|
|
|
|
|
|
|
|
|
|
|
|
|
|
|
|
|||||||||||||||||||||||||||||||||||||
| Total Short Term Investments and Escrowed Funds |
$ | 801 | $ | 734 | $ | 709 | $ | 665 | $ | 648 | $ | 647 | $ | 658 | $ | 816 | $ | 941 | $ | 893 | $ | 921 | $ | 1,007 | $ | 922 | $ | 665 | $ | 941 | $ | 922 | $ | 922 | ||||||||||||||||||||||||||||||||||||
|
|
|
|
|
|
|
|
|
|
|
|
|
|
|
|
|
|
|
|
|
|
|
|
|
|
|
|
|
|
|
|
|
|
|
|||||||||||||||||||||||||||||||||||||
| Intra-Month Minimum |
$ | 665 | $ | 665 | $ | 665 | $ | 665 | $ | 647 | $ | 647 | $ | 647 | $ | 647 | $ | 647 | $ | 893 | $ | 893 | $ | 893 | $ | 893 | $ | 665 | $ | 647 | $ | 893 | $ | 647 | ||||||||||||||||||||||||||||||||||||
| Pre-Petition ABL Borrowing Base and Availability |
|
|||||||||||||||||||||||||||||||||||||||||||||||||||||||||||||||||||||
| 24 |
Effective Borrowing Base | $ | 1,305 | $ | 1,287 | $ | 1,297 | $ | 1,303 | $ | 1,318 | $ | 1,370 | $ | 1,410 | $ | 1,423 | $ | 1,421 | $ | 1,244 | $ | 1,154 | $ | 1,109 | $ | 1,018 | $ | 1,303 | $ | 1,421 | $ | 1,018 | $ | 1,018 | |||||||||||||||||||||||||||||||||||
| 25 |
Less: Outstanding ABL Draws | (1,263 | ) | (1,263 | ) | (1,263 | ) | (1,263 | ) | (1,263 | ) | (1,263 | ) | (1,263 | ) | (1,263 | ) | (1,263 | ) | (1,263 | ) | (1,263 | ) | (1,263 | ) | (1,263 | ) | (1,263 | ) | (1,263 | ) | (1,263 | ) | (1,263 | ) | |||||||||||||||||||||||||||||||||||
| 26 |
Less: Letters of Credit | (137 | ) | (137 | ) | (137 | ) | (137 | ) | (137 | ) | (137 | ) | (137 | ) | (137 | ) | (137 | ) | (137 | ) | (137 | ) | (137 | ) | (137 | ) | (137 | ) | (137 | ) | (137 | ) | (137 | ) | |||||||||||||||||||||||||||||||||||
|
|
|
|
|
|
|
|
|
|
|
|
|
|
|
|
|
|
|
|
|
|
|
|
|
|
|
|
|
|
|
|
|
|
|
|||||||||||||||||||||||||||||||||||||
| Subtotal |
$ | (95 | ) | $ | (113 | ) | $ | (103 | ) | $ | (97 | ) | $ | (82 | ) | $ | (30 | ) | $ | 10 | $ | 23 | $ | 21 | $ | (156 | ) | $ | (246 | ) | $ | (291 | ) | $ | (382 | ) | $ | (97 | ) | $ | 21 | $ | (382 | ) | $ | (382 | ) | |||||||||||||||||||||||
| 27 |
Less: Pre-Petition Minimum Excess Availability | $ | (98 | ) | $ | (97 | ) | $ | (97 | ) | $ | (98 | ) | $ | (99 | ) $ | (103 | ) $ | (106 | ) $ | (107 | ) | $ | (107 | ) | $ | (93 | ) | $ | (87 | ) | $ | (83 | ) | $ | (76 | ) | (98 | ) | (107 | ) | (76 | ) | (76 | ) | |||||||||||||||||||||||||
| 28 |
Plus: Posted ABL Cash Collateral | 193 | 209 | 200 | 195 | 181 | 132 | 96 | 84 | 86 | 249 | 332 | 374 | 458 | 195 | 86 | 458 | 458 | ||||||||||||||||||||||||||||||||||||||||||||||||||||
|
|
|
|
|
|
|
|
|
|
|
|
|
|
|
|
|
|
|
|
|
|
|
|
|
|
|
|
|
|
|
|
|
|
|
|||||||||||||||||||||||||||||||||||||
| Total |
$ | — | $ | — | $ | — | $ | — | $ | — | $ | — | $ | — | $ | — | $ | — | $ | — | $ | — | $ | — | $ | — | $ | — | $ | — | $ | — | $ | — | ||||||||||||||||||||||||||||||||||||
|
|
|
|
|
|
|
|
|
|
|
|
|
|
|
|
|
|
|
|
|
|
|
|
|
|
|
|
|
|
|
|
|
|
|
|||||||||||||||||||||||||||||||||||||
Variance Report
(US $MMs)
| 1 Week From: 20-Sep to 26-Sep | 4 Weeks From: 30-Aug to 26-Sep | |||||||||||||||||||||||||||||||||||||
| Variance Report(1) | Week Beginning Week(s) Ending |
Budget 20-Sep 26-Sep |
Actual 20-Sep 26-Sep |
Budget $ |
Variance % |
Budget 30-Aug 26-Sep |
Actual 30-Aug 26-Sep |
Budget $ |
Variance % |
|||||||||||||||||||||||||||||
| Net Sales | $ | 117.8 | $ | 121.7 | $ | 3.9 | 3.3 | % | $ | 486.5 | $ | 512.5 | $ | 25.9 | 5.3 | % | ||||||||||||||||||||||
| Collections & Disbursements |
|
|||||||||||||||||||||||||||||||||||||
| Cash Receipts |
||||||||||||||||||||||||||||||||||||||
| 1 |
Sales Receipts |
|
$ | 125.6 | $ | 139.5 | $ | 13.9 | 11.0 | % | $ | 517.8 | $ | 569.5 | $ | 51.7 | 10.0 | % | ||||||||||||||||||||
| 2 |
Other Receipts |
|
91.1 | 73.9 | (17.1 | ) | -18.8 | % | 94.1 | 80.6 | (13.5 | ) | -14.3 | % | ||||||||||||||||||||||||
|
|
|
|
|
|
|
|
|
|
|
|
|
|
|
|
|
|||||||||||||||||||||||
| Total Collections |
$ | 216.7 | $ | 213.4 | $ | (3.3 | ) | -1.5 | % | $ | 611.9 | $ | 650.2 | $ | 38.2 | 6.2 | % | |||||||||||||||||||||
| Operating Disbursements |
|
|||||||||||||||||||||||||||||||||||||
| 3 |
Domestic Merchandise Vendor |
|
$ | (42.2 | ) | $ | (68.6 | ) | $ | (26.4 | ) | -62.7 | % | $ | (218.5 | ) | $ | (261.2 | ) | $ | (42.7 | ) | -19.5 | % | ||||||||||||||
| 4 |
Import Merchandise Vendor |
|
(68.7 | ) | (28.6 | ) | 40.0 | 58.3 | % | (252.5 | ) | (115.7 | ) | 136.8 | 54.2 | % | ||||||||||||||||||||||
| 5 |
Sales, Use, and Other Taxes |
|
(19.1 | ) | (12.7 | ) | 6.4 | 33.6 | % | (40.7 | ) | (36.9 | ) | 3.8 | 9.5 | % | ||||||||||||||||||||||
| 6 |
Freight, Duty, and Broker |
|
(22.1 | ) | (14.5 | ) | 7.6 | 34.5 | % | (47.3 | ) | (31.3 | ) | 16.0 | 33.8 | % | ||||||||||||||||||||||
| 7 |
Payroll and Benefits | (17.0 | ) | (20.2 | ) | (3.2 | ) | -19.2 | % | (135.2 | ) | (105.4 | ) | 29.8 | 22.1 | % | ||||||||||||||||||||||
| 8 |
Occupancy | (13.1 | ) | (16.0 | ) | (2.9 | ) | -22.1 | % | (47.3 | ) | (54.8 | ) | (7.5 | ) | -15.9 | % | |||||||||||||||||||||
| 9 |
Non-Marketing Operating (NFR) |
|
(22.6 | ) | (21.3 | ) | 1.3 | 5.6 | % | (68.0 | ) | (65.2 | ) | 2.8 | 4.1 | % | ||||||||||||||||||||||
|
10 |
Marketing | (3.0 | ) | (6.1 | ) | (3.1 | ) | -105.3 | % | (18.0 | ) | (22.8 | ) | (4.8 | ) | -26.8 | % | |||||||||||||||||||||
| 11 |
Other | — | (0.1 | ) | (0.1 | ) | 0.0 | % | — | (0.7 | ) | (0.7 | ) | 0.0 | % | |||||||||||||||||||||||
|
|
|
|
|
|
|
|
|
|
|
|
|
|
|
|
|
|||||||||||||||||||||||
| Total Operating Disbursements |
|
$ | (207.7 | ) | $ | (188.2 | ) | $ | 19.6 | 9.4 | % | $ | (827.5 | ) | $ | (694.0 | ) | $ | 133.6 | 16.1 | % | |||||||||||||||||
| Non-Operating Disbursements |
|
|||||||||||||||||||||||||||||||||||||
| 12 |
Debt Service and Fees | $ | (0.5 | ) | $ | (0.5 | ) | $ | — | 0.0 | % | $ | (12.1 | ) | $ | (2.0 | ) | $ | 10.0 | 83.2 | % | |||||||||||||||||
| 13 |
Restructuring Professionals |
|
(2.7 | ) | — | 2.7 | 100.0 | % | (17.5 | ) | (4.6 | ) | 12.9 | 73.7 | % | |||||||||||||||||||||||
| 14 |
Other Non-Operating | (1.7 | ) | (0.2 | ) | 1.5 | 86.6 | % | (7.5 | ) | (4.2 | ) | 3.3 | 44.2 | % | |||||||||||||||||||||||
|
|
|
|
|
|
|
|
|
|
|
|
|
|
|
|
|
|||||||||||||||||||||||
| Total Non-Operating Disbursements |
|
$ | (4.9 | ) | $ | (0.7 | ) | $ | 4.2 | 85.1 | % | $ | (37.1 | ) | $ | (10.8 | ) | $ | 26.2 | 70.8 | % | |||||||||||||||||
|
|
|
|
|
|
|
|
|
|
|
|
|
|
|
|
|
|||||||||||||||||||||||
| Net Cash Flow |
$ | 4.1 | $ | 24.5 | $ | 20.5 | 505.0 | % | $ | (252.7 | ) | $ | (54.6 | ) | $ | 198.1 | 78.4 | % | ||||||||||||||||||||
|
|
|
|
|
|
|
|
|
|
|
|
|
|
|
|
|
|||||||||||||||||||||||
Notes:
| (1) | This variance report reflects measurements against the Third Updated DIP Budget |
Variance Report
(US $MMs)
| 1 Week From: 27-Sep to 3-Oct | 4 Weeks From: 6-Sep to 3-Oct | |||||||||||||||||||||||||||||||||||||
| Variance Report(1) | Week Beginning Week(s) Ending |
Budget 27-Sep 3-Oct |
Actual 27-Sep 3-Oct |
Budget $ |
Variance % |
Budget 6-Sep 3-Oct |
Actual 6-Sep 3-Oct |
Budget $ |
Variance % |
|||||||||||||||||||||||||||||
| Net Sales | $ | 115.4 | $ | 136.1 | $ | 20.7 | 18.0 | % | $ | 480.2 | $ | 519.3 | $ | 39.1 | 8.1 | % | ||||||||||||||||||||||
| Collections & Disbursements |
|
|||||||||||||||||||||||||||||||||||||
| Cash Receipts |
||||||||||||||||||||||||||||||||||||||
| 1 |
Sales Receipts |
|
$ | 123.1 | $ | 151.1 | $ | 27.9 | 22.7 | % | $ | 510.8 | $ | 581.5 | $ | 70.7 | 13.8 | % | ||||||||||||||||||||
| 2 |
Other Receipts |
|
0.7 | 1.8 | 1.1 | 155.8 | % | 94.1 | 80.9 | (13.2 | ) | -14.0 | % | |||||||||||||||||||||||||
|
|
|
|
|
|
|
|
|
|
|
|
|
|
|
|
|
|||||||||||||||||||||||
| Total Collections |
|
$ | 123.8 | $ | 152.9 | $ | 29.0 | 23.4 | % | $ | 604.9 | $ | 662.4 | $ | 57.5 | 9.5 | % | |||||||||||||||||||||
| Operating Disbursements |
|
|||||||||||||||||||||||||||||||||||||
| 3 |
Domestic Merchandise Vendor |
|
$ | (80.1 | ) | $ | (68.3 | ) | $ | 11.8 | 14.7 | % | $ | (236.4 | ) | $ | (272.2 | ) | $ | (35.9 | ) | -15.2 | % | |||||||||||||||
| 4 |
Import Merchandise Vendor |
|
(45.6 | ) | (29.3 | ) | 16.3 | 35.7 | % | (233.5 | ) | (117.9 | ) | 115.6 | 49.5 | % | ||||||||||||||||||||||
| 5 |
Sales, Use, and Other Taxes |
|
(4.5 | ) | (0.6 | ) | 4.0 | 87.6 | % | (44.7 | ) | (34.8 | ) | 9.9 | 22.1 | % | ||||||||||||||||||||||
| 6 |
Freight, Duty, and Broker |
|
(8.3 | ) | (6.4 | ) | 1.9 | 23.3 | % | (47.6 | ) | (32.3 | ) | 15.3 | 32.1 | % | ||||||||||||||||||||||
| 7 |
Payroll and Benefits |
|
(50.0 | ) | (38.3 | ) | 11.6 | 23.3 | % | (128.1 | ) | (116.0 | ) | 12.0 | 9.4 | % | ||||||||||||||||||||||
| 8 |
Occupancy |
|
(14.9 | ) | (15.6 | ) | (0.7 | ) | -4.5 | % | (42.8 | ) | (44.7 | ) | (2.0 | ) | -4.6 | % | ||||||||||||||||||||
| 9 |
Non-Marketing Operating (NFR) |
|
(9.7 | ) | (22.5 | ) | (12.8 | ) | -131.2 | % | (58.4 | ) | (80.2 | ) | (21.8 | ) | -37.4 | % | ||||||||||||||||||||
|
10 |
Marketing |
|
(3.1 | ) | (3.1 | ) | (0.0 | ) | -0.7 | % | (14.7 | ) | (20.2 | ) | (5.6 | ) | -37.9 | % | ||||||||||||||||||||
| 11 |
Other |
|
— | (0.1 | ) | (0.1 | ) | 0.0 | % | — | (0.6 | ) | (0.6 | ) | 0.0 | % | ||||||||||||||||||||||
|
|
|
|
|
|
|
|
|
|
|
|
|
|
|
|
|
|||||||||||||||||||||||
| Total Operating Disbursements |
|
$ | (216.3 | ) | $ | (184.2 | ) | $ | 32.1 | 14.8 | % | $ | (806.0 | ) | $ | (719.1 | ) | $ | 86.9 | 10.8 | % | |||||||||||||||||
| Non-Operating Disbursements |
|
|||||||||||||||||||||||||||||||||||||
| 12 |
Debt Service and Fees |
|
$ | (29.8 | ) | $ | (11.2 | ) | $ | 18.6 | 62.4 | % | $ | (31.3 | ) | $ | (12.8 | ) | $ | 18.6 | 59.3 | % | ||||||||||||||||
| 13 |
Restructuring Professionals |
|
(12.4 | ) | (6.7 | ) | 5.8 | 46.5 | % | (17.0 | ) | (8.4 | ) | 8.6 | 50.8 | % | ||||||||||||||||||||||
| 14 |
Other Non-Operating |
|
(1.7 | ) | (0.5 | ) | 1.2 | 69.5 | % | (6.9 | ) | (4.7 | ) | 2.2 | 31.6 | % | ||||||||||||||||||||||
|
|
|
|
|
|
|
|
|
|
|
|
|
|
|
|
|
|||||||||||||||||||||||
| Total Non-Operating Disbursements |
|
$ | (44.0 | ) | $ | (18.4 | ) | $ | 25.6 | 58.1 | % | $ | (55.2 | ) | $ | (25.8 | ) | $ | 29.4 | 53.2 | % | |||||||||||||||||
|
|
|
|
|
|
|
|
|
|
|
|
|
|
|
|
|
|||||||||||||||||||||||
| Net Cash Flow |
$ | (136.4 | ) | $ | (49.7 | ) | $ | 86.7 | 63.5 | % | $ | (256.4 | ) | $ | (82.5 | ) | $ | 173.8 | 67.8 | % | ||||||||||||||||||
|
|
|
|
|
|
|
|
|
|
|
|
|
|
|
|
|
|||||||||||||||||||||||
Notes:
| (1) | This variance report reflects measurements against the Third Updated DIP Budget |
Covenant Testing
(US $MMs)
| 4 Weeks From: 6-Sep to 3-Oct | ||||||||||||||||||||
| Variance Report(1) | Budget 6-Sep 3-Oct |
Actual 6-Sep 3-Oct |
Variance to Budget % |
Threshold Test | ||||||||||||||||
| Cash Flow Tests | Test % | |||||||||||||||||||
| 1) Actual Receipts |
Test | |||||||||||||||||||
| 1 |
Sales Receipts | $ | 510.8 | $ | 581.5 | |||||||||||||||
| 2 |
Other Receipts | 94.1 | 80.9 | |||||||||||||||||
|
|
|
|
|
|
|
|
|
|||||||||||||
| Total Receipts |
85.0 | % | $ | 604.9 | $ | 662.4 | 109.5 | % | Pass | |||||||||||
| 2) Actual Disbs. to Merchandise Vendors |
Test | |||||||||||||||||||
| 3 |
Domestic Merchandise Vendor | $ | (236.4 | ) | $ | (272.2 | ) | |||||||||||||
| 4 |
Import Merchandise Vendor | (233.5 | ) | (117.9 | ) | |||||||||||||||
|
|
|
|
|
|
|
|
|
|||||||||||||
| Total Merchandise Vendor Disbursements |
110.0 | % | $ | (469.8 | ) | $ | (390.1 | ) | 83.0 | % | Pass | |||||||||
| 3) Actual Disbursements (excl. Pro Fees) |
||||||||||||||||||||
| 3 |
Domestic Merchandise Vendor | $ | (236.4 | ) | $ | (272.2 | ) | |||||||||||||
| 4 |
Import Merchandise Vendor | (233.5 | ) | (117.9 | ) | |||||||||||||||
| 5 |
Sales, Use, and Other Taxes | (44.7 | ) | (34.8 | ) | |||||||||||||||
| 6 |
Freight, Duty, and Broker | (47.6 | ) | (32.3 | ) | |||||||||||||||
| 7 |
Payroll and Benefits | (128.1 | ) | (116.0 | ) | |||||||||||||||
| 8 |
Occupancy | (42.8 | ) | (44.7 | ) | |||||||||||||||
| 9 |
Non-Marketing Operating (NFR) | (58.4 | ) | (80.2 | ) | |||||||||||||||
|
10 |
Marketing | (14.7 | ) | (20.2 | ) | |||||||||||||||
| 11 |
Other | — | (0.6 | ) | ||||||||||||||||
|
|
|
|
|
|||||||||||||||||
| Operating Disbursements |
$ | (806.0 | ) | $ | (719.1 | ) | ||||||||||||||
| 10 |
Debt Service and Fees | (31.3 | ) | (12.8 | ) | Test | ||||||||||||||
| 11 |
Other Non-Operating | (6.9 | ) | (4.7 | ) | |||||||||||||||
|
|
|
|
|
|||||||||||||||||
| Non-Operating Disbursements |
$ | (38.2 | ) | $ | (17.5 | ) | ||||||||||||||
|
|
|
|
|
|
|
|
|
|||||||||||||
| Total Disbursements (excl. Pro Fees) |
112.5 | % | $ | (844.2 | ) | $ | (736.6 | ) | 87.2 | % | Pass | |||||||||
|
|
|
|
|
|
|
|
|
|||||||||||||
Notes:
| (1) | This variance report reflects measurements against both the Third Updated DIP Budget |
Covenant Testing
(US $ MMs)
| Third Updated DIP Budget | Actuals Weekly Build Up |
|||||||||||||||||||||||||||||||||||||||||
| Variance Report(1) | 12-Sep | 19-Sep | 26-Sep | 3-Oct | Total | 12-Sep | 19-Sep | 26-Sep | 3-Oct | Total | ||||||||||||||||||||||||||||||||
| Cash Flow Tests |
||||||||||||||||||||||||||||||||||||||||||
| 1) Actual Receipts |
||||||||||||||||||||||||||||||||||||||||||
| 1 |
Sales Receipts | $ | 132.6 | $ | 129.5 | $ | 125.6 | $ | 123.1 | $ | 510.8 | $ | 149.5 | $ | 141.5 | $ | 139.5 | $ | 151.1 | $ | 581.5 | |||||||||||||||||||||
| 2 |
Other Receipts | 1.0 | 1.3 | 91.1 | 0.7 | 94.1 | 1.5 | 3.6 | 73.9 | 1.8 | 80.9 | |||||||||||||||||||||||||||||||
|
|
|
|
|
|
|
|
|
|
|
|
|
|
|
|
|
|
|
|
|
|||||||||||||||||||||||
| Total Receipts |
$ | 133.6 | $ | 130.8 | $ | 216.7 | $ | 123.8 | $ | 604.9 | $ | 151.1 | $ | 145.1 | $ | 213.4 | $ | 152.9 | $ | 662.4 | ||||||||||||||||||||||
| 2) Actual Disbs. to Merchandise Vendors |
|
|||||||||||||||||||||||||||||||||||||||||
| 3 |
Domestic Merchandise Vendor | $ | (73.7 | ) | $ | (40.3 | ) | $ | (42.2 | ) | $ | (80.1 | ) | $ | (236.4 | ) | $ | (56.0 | ) | $ | (79.3 | ) | $ | (68.6 | ) | $ | (68.3 | ) | $ | (272.2 | ) | |||||||||||
| 4 |
Import Merchandise Vendor | (58.4 | ) | (60.8 | ) | (68.7 | ) | (45.6 | ) | (233.5 | ) | (32.7 | ) | (27.2 | ) | (28.6 | ) | (29.3 | ) | (117.9 | ) | |||||||||||||||||||||
|
|
|
|
|
|
|
|
|
|
|
|
|
|
|
|
|
|
|
|
|
|||||||||||||||||||||||
| Total Merchandise Vendor Disbursements |
$ | (132.2 | ) | $ | (101.1 | ) | $ | (110.8 | ) | $ | (125.7 | ) | $ | (469.8 | ) | $ | (88.6 | ) | $ | (106.6 | ) | $ | (97.2 | ) | $ | (97.7 | ) | $ | (390.1 | ) | ||||||||||||
| 3) Actual Disbursements (excl. Pro Fees) |
|
|||||||||||||||||||||||||||||||||||||||||
| 3 |
Domestic Merchandise Vendor | $ | (73.7 | ) | $ | (40.3 | ) | $ | (42.2 | ) | $ | (80.1 | ) | $ | (236.4 | ) | $ | (56.0 | ) | $ | (79.3 | ) | $ | (68.6 | ) | $ | (68.3 | ) | $ | (272.2 | ) | |||||||||||
| 4 |
Import Merchandise Vendor | (58.4 | ) | (60.8 | ) | (68.7 | ) | (45.6 | ) | (233.5 | ) | (32.7 | ) | (27.2 | ) | (28.6 | ) | (29.3 | ) | (117.9 | ) | |||||||||||||||||||||
| 5 |
Sales, Use, and Other Taxes | (2.5 | ) | (18.5 | ) | (19.1 | ) | (4.5 | ) | (44.7 | ) | (0.9 | ) | (20.7 | ) | (12.7 | ) | (0.6 | ) | (34.8 | ) | |||||||||||||||||||||
| 6 |
Freight, Duty, and Broker | (8.0 | ) | (9.2 | ) | (22.1 | ) | (8.3 | ) | (47.6 | ) | (6.5 | ) | (5.0 | ) | (14.5 | ) | (6.4 | ) | (32.3 | ) | |||||||||||||||||||||
| 7 |
Payroll and Benefits | (18.2 | ) | (42.9 | ) | (17.0 | ) | (50.0 | ) | (128.1 | ) | (27.1 | ) | (30.5 | ) | (20.2 | ) | (38.3 | ) | (116.0 | ) | |||||||||||||||||||||
| 8 |
Occupancy | (7.3 | ) | (7.5 | ) | (13.1 | ) | (14.9 | ) | (42.8 | ) | (6.2 | ) | (7.0 | ) | (16.0 | ) | (15.6 | ) | (44.7 | ) | |||||||||||||||||||||
| 9 |
Non-Marketing Operating (NFR) | (15.4 | ) | (10.7 | ) | (22.6 | ) | (9.7 | ) | (58.4 | ) | (18.3 | ) | (18.1 | ) | (21.3 | ) | (22.5 | ) | (80.2 | ) | |||||||||||||||||||||
|
10 |
Marketing | (4.9 | ) | (3.7 | ) | (3.0 | ) | (3.1 | ) | (14.7 | ) | (6.4 | ) | (4.6 | ) | (6.1 | ) | (3.1 | ) | (20.2 | ) | |||||||||||||||||||||
| 11 |
Other | — | — | — | — | — | (0.1 | ) | (0.4 | ) | (0.1 | ) | (0.1 | ) | (0.6 | ) | ||||||||||||||||||||||||||
|
|
|
|
|
|
|
|
|
|
|
|
|
|
|
|
|
|
|
|
|
|||||||||||||||||||||||
| Operating Disbursements |
$ | (188.5 | ) | $ | (193.5 | ) | $ | (207.7 | ) | $ | (216.3 | ) | $ | (806.0 | ) | $ | (154.1 | ) | $ | (192.7 | ) | $ | (188.2 | ) | $ | (184.2 | ) | $ | (719.1 | ) | ||||||||||||
| 10 |
Debt Service and Fees | (0.5 | ) | (0.5 | ) | (0.5 | ) | (29.8 | ) | (31.3 | ) | (0.5 | ) | (0.5 | ) | (0.5 | ) | (11.2 | ) | (12.8 | ) | |||||||||||||||||||||
| 11 |
Other Non-Operating | (1.7 | ) | (1.7 | ) | (1.7 | ) | (1.7 | ) | (6.9 | ) | (0.1 | ) | (3.8 | ) | (0.2 | ) | (0.5 | ) | (4.7 | ) | |||||||||||||||||||||
|
|
|
|
|
|
|
|
|
|
|
|
|
|
|
|
|
|
|
|
|
|||||||||||||||||||||||
| Non-Operating Disbursements |
$ | (2.2 | ) | $ | (2.2 | ) | $ | (2.2 | ) | $ | (31.5 | ) | $ | (38.2 | ) | $ | (0.6 | ) | $ | (4.4 | ) | $ | (0.7 | ) | $ | (11.7 | ) | $ | (17.5 | ) | ||||||||||||
|
|
|
|
|
|
|
|
|
|
|
|
|
|
|
|
|
|
|
|
|
|||||||||||||||||||||||
| Total Disbursements (excl. Pro Fees) |
$ | (190.8 | ) | $ | (195.7 | ) | $ | (209.9 | ) | $ | (247.8 | ) | $ | (844.2 | ) | $ | (154.7 | ) | $ | (197.1 | ) | $ | (188.9 | ) | $ | (195.9 | ) | $ | (736.6 | ) | ||||||||||||
|
|
|
|
|
|
|
|
|
|
|
|
|
|
|
|
|
|
|
|
|
|||||||||||||||||||||||
Notes:
| (1) | This variance report reflects measurements against both the Third Updated DIP Budget |
Book Cash Report
(USD $)
| Book Cash Balance | ||||||
| Consolidated Book Cash Accounts | 3-Oct-20 | |||||
| Debtor Accounts |
||||||
| 1 |
Short Term Investment |
$ | 633,151,678 | |||
| 2 |
Escrows |
17,017,164 | ||||
| 3 |
International (incl. non-Debtors) |
19,820,646 | ||||
| 4 |
Store Accounts |
3,601,862 | ||||
| 5 |
Other Operating Accounts |
266,945,424 | ||||
| 6 |
Other Domestic non-Debtor Accounts |
4,841,878 | ||||
| 7 |
Cash on Hand (In Stores) |
27,721,852 | ||||
| 8 |
Cash In Transit |
18,131,910 | ||||
|
|
|
|||||
| Total Holdings and Subsidiaries Book Cash |
$ | 991,232,412 | ||||
|
|
|
|||||
| Test Threshold |
$ | 50,000,000 | ||||
| Minimum Required Book Cash |
Pass | |||||
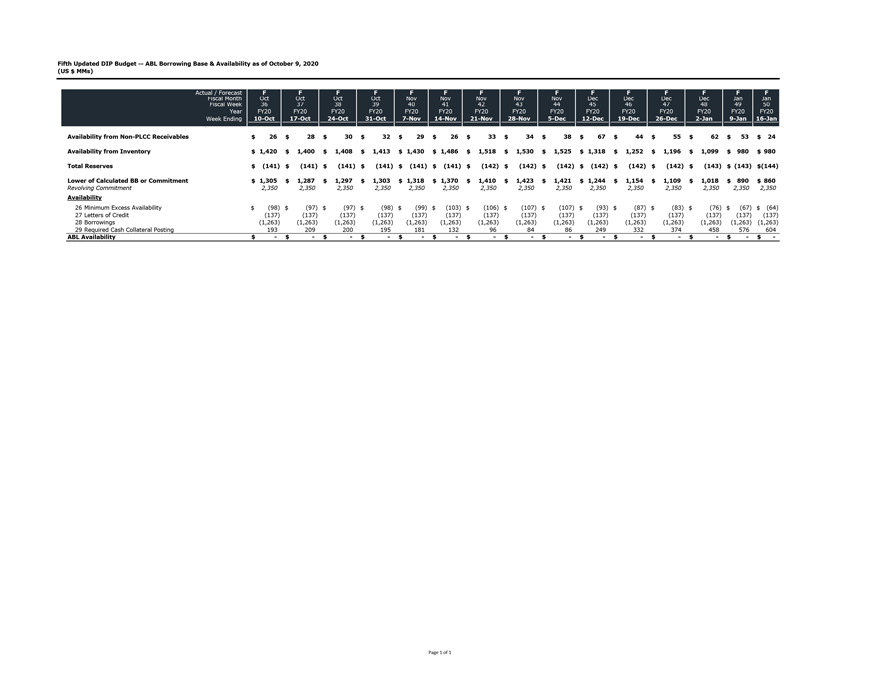
Fifth Updated DIP Budget — ABL Borrowing Base & Availability as of October 9, 2020 (US $ MMs) Actual Fiscal /
Forecast Month Oct F Oct F Oct F Oct F Nov F Nov F Nov F Nov F Nov F Dec F Dec F Dec F Dec F Jan F Jan F Fiscal Week 36 37 38 39 40 41 42 43 44 45 46 47 48 49 50 Year FY20 FY20 FY20 FY20 FY20 FY20 FY20 FY20 FY20 FY20 FY20 FY20 FY20 FY20 FY20 Week
Ending 10-Oct 17-Oct 24-Oct 31-Oct 7-Nov 14-Nov 21-Nov 28-Nov 5-Dec 12-Dec 19-Dec 26-Dec 2-Jan 9-Jan 16-Jan Availability from Non-PLCC Receivables $ 26
$ 28 $ 30
$ 32 $ 29
$ 26 $ 33
$ 34 $ 38
$ 67 $ 44
$ 55 $ 62
$ 53 $ 24 Availability from Inventory $ 1,420 $ 1,400 $ 1,408
$ 1,413 $ 1,430 $ 1,486 $ 1,518 $ 1,530 $ 1,525 $ 1,318 $ 1,252
$ 1,196 $ 1,099 $ 980 $ 980 Total Reserves $ (141) $ (141)
$ (141) $ (141) $ (141)
$ (141) $ (142) $ (142)
$ (142) $ (142) $ (142)
$ (142) $ (143) $ (143) $(144) Lower
of Calculated BB or Commitment $ 1,305 $ 1,287 $ 1,297 $ 1,303 $ 1,318 $ 1,370 $ 1,410
$ 1,423 $ 1,421 $ 1,244 $ 1,154 $ 1,109 $ 1,018 $ 890 $ 860 Revolving
Commitment 2,350 2,350
2,350 2,350
2,350 2,350 2,350
2,350
2,350 2,350 2,350
2,350 2,350 2,350 2,350 Availability 26 Minimum Excess
Availability $ (98) $ (97)
$ (97) $ (98)
$ (99) $ (103)
$ (106) $ (107)
$ (107) $ (93)
$ (87) $ (83)
$ (76) $ (67) $ (64) 27 Letters of
Credit (137) (137)
(137) (137)
(137) (137) (137)
(137)
(137)
(137) (137) (137)
(137) (137) (137) 28
Borrowings (1,263) (1,263)
(1,263) (1,263) (1,263) (1,263)
(1,263) (1,263)
(1,263) (1,263)
(1,263) (1,263)
(1,263) (1,263) (1,263) 29 Required Cash Collateral
Posting 193 209
200 195
181 132 96
84 86
249
332 374 458
576 604 ABL Availability
$ —$ —$
—$ —$
—$ —$ —$
—$ —$
—$ —$ —$
—$ —$
-
Allocation of Disbursements Report
(US $)
| 5 Weeks From Week Ending: 08-Aug to 05-Sep |
||||||||
| Disbursement Type | Retail | Total | ||||||
| Tradeweave (International Merchandise) |
$ | 87,143,657 | $ | 87,143,657 | ||||
| Oracle 11i (Domestic Merchandise) |
258,738,229 | 258,738,229 | ||||||
| Payroll & Benefits |
143,702,157 | 146,485,379 | ||||||
| Oracle R12 (NFR) |
169,784,142 | 175,537,933 | ||||||
| Treasury |
94,908,364 | 131,386,428 | ||||||
| Other |
7,531,346 | 10,330,906 | ||||||
|
|
|
|
|
|||||
| Total Disbursements |
$ | 761,807,895 | $ | 809,622,531 | ||||
Note: Total disbursements of $809.6 million includes $26.2 million of disbursements allocated to encumbered real estate, $18.0 million of disbursements allocated to unencumbered real estate and $3.6 million of disbursements allocated to intellectual property.
ABL Borrowing Base
(As of October 3, 2020)
| A. |
Available Credit Card Receivables |
$ | 28,476,593 | |||||||
| B. |
Available Inventory |
$ | 1,400,294,983 | |||||||
| C. |
Availability Reserves |
$ | 141,369,100 | |||||||
| D. |
Borrowing Base (A+B-C) |
$ | 1,287,402,476 | |||||||
| Lower of: |
||||||||||
| Borrowing Base |
$ | 1,287,402,476 | ||||||||
| Revolving Commitment |
$ | 2,350,000,000 | ||||||||
| E. |
$ | 1,287,402,476 | ||||||||
| Revolving Credit Outstandings: |
||||||||||
| Revolving Loans |
$ | 1,262,972,284 | ||||||||
| Standby Letters of Credit |
$ | 137,035,059 | ||||||||
| Commercial Letters of Credit |
$ | 0 | ||||||||
| F. |
Total Revolving Credit Outstandings |
$ | 1,400,007,343 | |||||||
| G. |
Facility Availability (E-F) |
-$ | 112,604,867 | |||||||
| H. |
Minimum Excess Availability (7.5% of E up to $200,000,000) |
$ | 96,555,186 | |||||||
| I. |
Facility Availability After Minimum Excess Availability Covenant (G-H) |
|
-$ | 209,160,052 | ||||||
|
|
|
|||||||||
Exit Costs Estimate
As of October 1, 2020
(US $ MMs)
| Emergence Related Costs(1) | Estimate | |||
| Description |
||||
| May Rent and Lease Assumption Costs |
(8.6 | ) | ||
| Contract Cures |
(47.9 | ) | ||
| Secured / Admin / 503(b)(9) Claims |
(10.0 | ) | ||
| Other Accrued but Unpaid Administrative Expenses(2) |
(299.0 | ) | ||
| Accrued Fees(3) |
(97.7 | ) | ||
| Exit Fee DIP |
(27.0 | ) | ||
| Assumed New ABL Fees |
(45.0 | ) | ||
| Assumed FILO Fees |
(10.9 | ) | ||
| Assumed New Term Fees (DIP Take Back) |
(5.0 | ) | ||
| Accrued Interest (TL, 1L Notes, DIP, ABL) |
(31.8 | ) | ||
|
|
|
|||
| Total Estimated Emergence Costs |
$ | (582.7 | ) | |
|
|
|
|||
Notes:
| (1) | Excludes payment of non-administrative claims, including DIP facility claims and ABL facility / swap liability claims. |
| (2) | Includes post-petition merchandise, marketing, CapEx, and NFR A/P as per the Business Plan provided on August 4, 2020. |
| (3) | Includes debtors’ professionals, DIP lenders’ profesionals, ABL lenders’ professionals, UCC professionals, ad hoc equity committee and other accrued fees (including UST). |
Net Working Capital Pro-Forma Adjustments and Cash Flow Comparison
Date: 10/5/2020
| Pro Forma | ||||||||||||||||||||
| September 10/3/2020 Forecast |
October 10/31/2020 Forecast |
November 12/5/2020 Forecast |
December 1/2/2021 Forecast |
January 1/30/2021 Forecast |
||||||||||||||||
| Current Assets |
$ | 3,690,257,174 | $ | 3,590,839,300 | $ | 3,603,538,687 | $ | 3,640,246,286 | $ | 3,387,766,460 | ||||||||||
| Pro-Forma Current Assets |
$ | 2,638,510,158 | $ | 2,697,537,237 | $ | 2,548,568,075 | $ | 2,204,663,063 | $ | 2,177,967,077 | ||||||||||
| Current Liabilities |
$ | 1,030,709,398 | $ | 1,056,517,905 | $ | 1,098,752,333 | $ | 1,048,025,401 | $ | 936,450,639 | ||||||||||
| Pro-Forma Current Liabilities |
$ | 921,699,036 | $ | 935,300,499 | $ | 971,457,514 | $ | 940,579,846 | $ | 806,604,151 | ||||||||||
| Pro-Forma Net Working Capital |
$ | 1,716,811,122 | $ | 1,762,236,738 | $ | 1,577,110,561 | $ | 1,264,083,217 | $ | 1,371,362,926 | ||||||||||
| Total Monthly Cash Flow |
$ | (77,879,050 | ) | $ | (154,480,043 | ) | $ | 167,633,141 | $ | 378,013,010 | $ | (225,556,319 | ) | |||||||
Note: To address perceived delays in the timing of closing the sale of the OpCo assets to Simon Property Group and Brookfield Property Group (collectively, “S-B”) pursuant to that certain non-binding letter of intent, dated as of September 10, 2020 (the “LOI”), among the Company, S-B and the members of an ad hoc group of lenders and noteholders (the “Ad Hoc Group” and, together with S-B, the “Parties”), the Parties have engaged, and are continuing to engage, in discussions regarding revisions to the purchase price adjustments set forth in the LOI. Specifically, in the course of the Parties’ discussions, the Ad Hoc Group has expressed a belief that the closing should have occurred on October 3, 2020 or closer to October 3, 2020 than an early-to-mid November closing. While the LOI does not specify a closing date, S-B has proposed that the purchase price adjustments set forth in the LOI be adjusted and calculated based on the assumption that the closing of the sale of the OpCo assets will occur on October 31, 2020, which, based on the estimates and projections provided by the Company, would result in an increase in cash available to creditors pursuant to the credit bid relative to the current projected early-to-mid-November closing, but less cash available to the creditors than if the sale closed on October 3, 2020. The Ad Hoc Group has instead proposed the creditors would bear 20% of the reduced cash availability resulting from an assumed closing date of October 3, 2020 (as compared to S-B’s proposal to assume a closing on October 31, 2020) and no part of the reduced cash availability resulting from a post-October closing. The Company estimates the reduction in cash available to creditors assuming an October 31, 2020 closing versus an October 3, 2020 closing would be approximately $104 million, with the cash available to creditors assuming an early-to-mid November closing estimated to be lower than that at October 31, 2020 by an amount that the Company has not been able to estimate at this date and that the Parties have not agreed upon at this time. The Parties reserve all of their respective rights with respect to the matters described in this note and in the disclosure herein and may participate in mediation to further discuss.
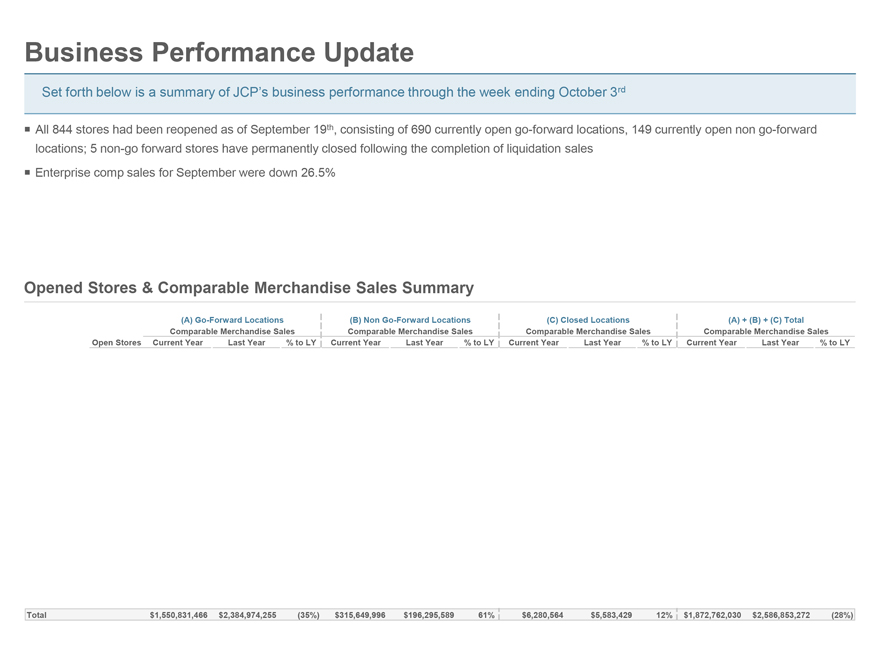
Business Performance Update Set forth below is a summary of JCP’s business performance through the week ending October 3rd ï,¡ All 844 stores had been reopened as of September 19th, consisting of 690 currently open go-forward locations, 149 currently open non go-forward locations; 5 non-go forward stores have permanently closed following the completion of liquidation sales ï,¡ Enterprise comp sales for September were down 26.5% Opened Stores & Comparable Merchandise Sales Summary (A) Go-Forward Locations (B) Non Go-Forward Locations (C) Closed Locations (A) + (B) + (C) Total Comparable Merchandise Sales Comparable Merchandise Sales Comparable Merchandise Sales Comparable Merchandise Sales Open Stores Current Year Last Year % to LY Current Year Last Year % to LY Current Year Last Year % to LY Current Year Last Year % to LY Total $1,550,831,466 $2,384,974,255 (35%) $315,649,996 $196,295,589 61% $6,280,564 $5,583,429 12% $1,872,762,030 $2,586,853,272 (28%)
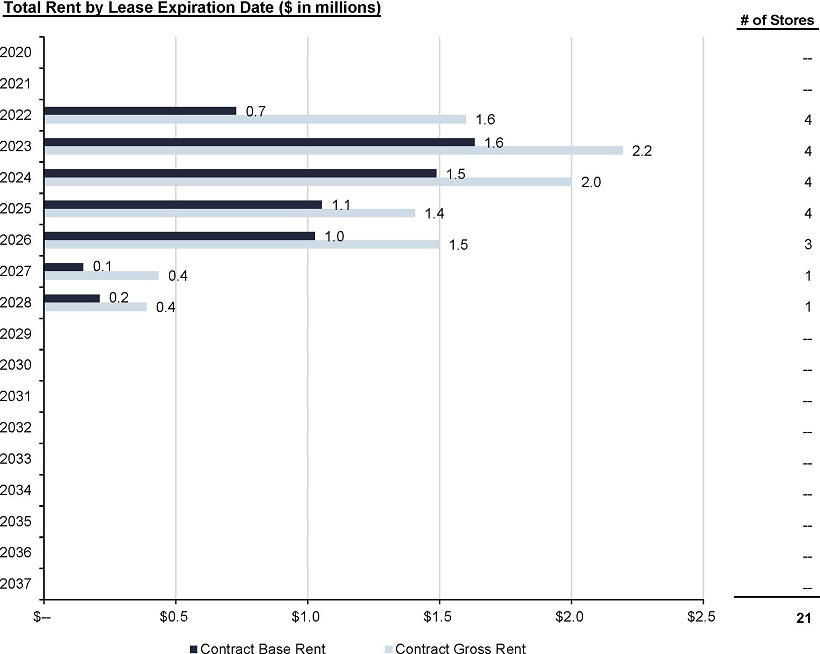
Lease Restructuring Savings Summary
| Store Count |
FY 2020 Savings |
FY 2021 Savings |
FY 2022 Savings |
FY 2023+ Savings |
Total Term Reduction Savings |
Total Rent Abatement |
Total Rent Deferral |
Total Debtor Cure |
Total Cure Waiver |
Total Cure Deferral |
Total Deal Savings (not incl. Cure) |
|||||||||||||||||||||||||||||||||||
| Approved - JCP & Lenders |
160 | $ | 34,218,238 | $ | 25,034,248 | $ | 20,828,782 | $ | 35,193,209 | $ | 0 | $ | 16,116,562 | $ | 0 | $ | 4,378,855 | $ | 4,269,675 | $ | 0 | $ | 115,274,477 | |||||||||||||||||||||||
| Approved by Company |
21 | $ | 4,805,267 | $ | 3,889,760 | $ | 3,327,225 | $ | 5,204,798 | $ | 0 | $ | 2,388,646 | $ | 0 | $ | 628,263 | $ | 628,264 | $ | 0 | $ | 17,227,049 | |||||||||||||||||||||||
| Pending Approval by Company |
— | — | — | — | — | — | — | — | — | — | — | — | ||||||||||||||||||||||||||||||||||
| Negotiations Ongoing |
267 | — | — | — | — | — | — | — | — | — | — | — | ||||||||||||||||||||||||||||||||||
| No Deal Possible |
0 | — | — | — | — | — | — | — | — | — | — | — | ||||||||||||||||||||||||||||||||||
|
|
|
|
|
|
|
|
|
|
|
|
|
|
|
|
|
|
|
|
|
|
|
|
||||||||||||||||||||||||
| TOTALS (Approved & Submitted) |
181 | $ | 39,023,505 | $ | 28,924,008 | $ | 24,156,007 | $ | 40,398,006 | $ | 0 | $ | 18,505,209 | $ | 0 | $ | 5,007,118 | $ | 4,897,939 | $ | 0 | $ | 132,501,526 | |||||||||||||||||||||||
|
|
|
|
|
|
|
|
|
|
|
|
|
|
|
|
|
|
|
|
|
|
|
|
||||||||||||||||||||||||
Forecasted Performance Summary
| Store |
FY 2020 Sales |
FY 2021 Sales | FY 2022 Sales | FY 2020 Unallocated Store Contribution Profit |
FY 2021 Unallocated Store Contribution Profit |
FY 2022 Unallocated Store Contribution Profit |
FY 2020 Unallocated Store Contribution Margin (Mean) |
FY 2020 Unallocated Store Contribution Margin (Median) |
FY 2021 Unallocated Store Contribution Margin (Mean) |
FY 2021 Unallocated Store Contribution Margin (Median) |
||||||||||||||||||||||||||||||||
| Approved - Lease Restructuring Approved by Company and Lenders |
160 | $ | 892,356,637 | $ | 1,447,780,749 | $ | 1,444,365,692 | -$ | 19,313,632 | $ | 119,195,324 | $ | 176,220,250 | -2.04 | % | -1.76 | % | 7.79 | % | 8.83 | % | |||||||||||||||||||||
| Approved - Lease Restructuring Approved by Company Only |
21 | $ | 136,858,782 | $ | 227,417,542 | $ | 231,896,956 | -$ | 476,362 | $ | 22,260,575 | $ | 30,770,202 | -0.75 | % | 0.22 | % | 9.58 | % | 9.69 | % | |||||||||||||||||||||
Forecasted Performance with Lease Restructuring Summary
| Store |
FY 2020 Sales |
FY 2021 Sales | FY 2022 Sales | FY 2020 Unallocated Store Contribution Profit |
FY 2021 Unallocated Store Contribution Profit |
FY 2022 Unallocated Store Contribution Profit |
FY 2020 Unallocated Store Contribution Margin (Mean) |
FY 2020 Unallocated Store Contribution Margin (Median) |
FY 2021 Unallocated Store Contribution Margin (Mean) |
FY 2021 Unallocated Store Contribution Margin (Median) |
||||||||||||||||||||||||||||||||
| Approved - Lease Restructuring Approved by Company and Lenders |
160 | $ | 892,356,637 | $ | 1,447,780,749 | $ | 1,444,365,692 | $ | 14,904,606 | $ | 144,229,572 | $ | 197,049,032 | 1.92 | % | 2.00 | % | 10.51 | % | 10.27 | % | |||||||||||||||||||||
| Approved - Lease Restructuring Approved by Company Only |
21 | $ | 136,858,782 | $ | 227,417,542 | $ | 231,896,956 | $ | 4,328,905 | $ | 26,150,335 | $ | 34,097,427 | 3.05 | % | 2.75 | % | 11.56 | % | 11.45 | % | |||||||||||||||||||||
Note: Tables above reflect information as of October 6, 2020
SUMMARY - LEASE RESTRUCTURINGS APPROVED BY COMPANY AND LENDERS
(AS OF OCTOBER 6, 2020)
SUMMARY - LEASE RESTRUCTURINGS APPROVED BY COMPANY AND LENDERS
(AS OF OCTOBER 6, 2020)
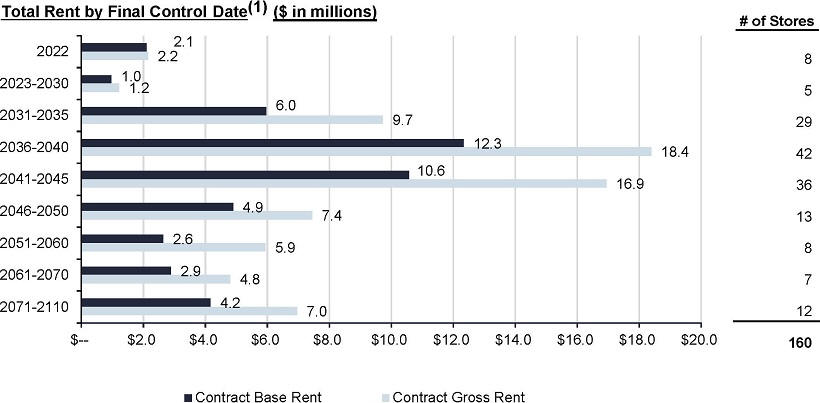
| (1) | Final Control Date represents exercise of all available extension options. |
SUMMARY - LEASE RESTRUCTURINGS APPROVED BY COMPANY ONLY
(AS OF OCTOBER 6, 2020)
SUMMARY - LEASE RESTRUCTURINGS APPROVED BY COMPANY ONLY
(AS OF OCTOBER 6, 2020)
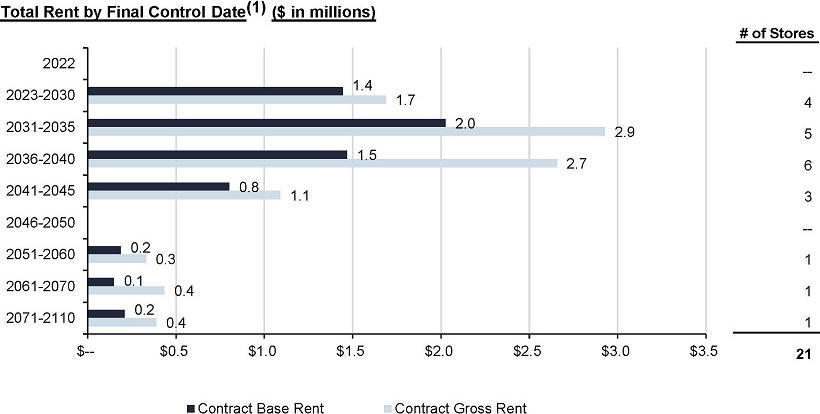
| (1) | Final Control Date represents exercise of all available extension options. |
CONFIDENTIAL
SUBJECT TO FRE 408
FOR DISCUSSION PURPOSES ONLY /
SUBJECT TO MATERIAL CHANGE
| Project Jewel |

|
|||
|
First Lien Minority Group Proposed Transaction |
September 23, 2020
CONFIDENTIAL
SUBJECT TO FRE 408
FOR DISCUSSION PURPOSES ONLY /
SUBJECT TO MATERIAL CHANGE
| Proposed Transaction Structure |
|
|||
OVERVIEW
| • | Step 1: Simon / Brookfield to acquire OpCo assets from the Debtors |
| • | Proceeds from OpCo sale to be paid to the Debtors and ultimately distributed to creditors of the Debtors’ estates pursuant to a Chapter 11 plan (the “Plan”) |
| • | Simon / Brookfield LOI contemplates (a) $500mm of Take Back 1L Debt, (b) a $300mm cash equity contribution (subject to a working capital adjustment) and (c) a potential earnout |
| • | Step 21: Bidder formed by the members of the First Lien Minority Group to acquire PropCo from the Debtors for $1.0bn in cash |
| • | Proceeds from PropCo sale used to repay DIP Facility with excess proceeds to be distributed under the Plan |
| • | Any proceeds from LiquidationCo (or liquidation trust interests) to be distributed to the creditors of the Debtors’ estates pursuant to the Plan |
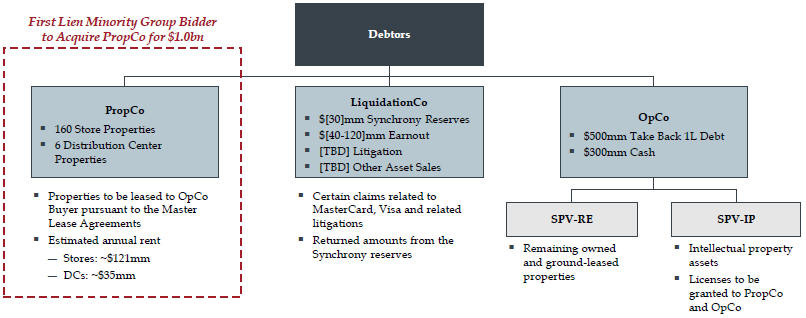
| 1. | Step 2 occurs contemporaneously with Step 1 |
[1]
CONFIDENTIAL
SUBJECT TO FRE 408
FOR DISCUSSION PURPOSES ONLY /
SUBJECT TO MATERIAL CHANGE
| Summary Term Sheet |
|
|||
| BIDDER | • An entity to be formed by the members of the First Lien Minority Group | |
| BID | • Bidder will acquire all of the equity interests of PropCo, which will own the 160 owned and ground-leased store properties (“Store Properties”) and six distribution center properties (“DC Properties”) as contemplated in the DIP Lender Group’s credit bid term sheet, for $1.0bn in cash
• PropCo will also own all fixtures, equipment and other goods (other than inventory) contained within such properties (and any tort claims, insurance proceeds and general intangibles directly related to such properties) | |
| MASTER LEASE AGREEMENTS | • Consummation of PropCo acquisition will be conditioned on consummation of the sale of OpCo assets to OpCo Buyer as contemplated by the Simon / Brookfield LOI
• PropCo will lease the Store and DC Properties to OpCo Buyer pursuant to master leases on the terms included in the Simon / Brookfield LOI | |
| EXCLUDED ENTITIES | • OpCo
• LiquidationCo | |
| DEFINITIVE AGREEMENTS | • Consistent with terms outlined in the DIP Lender Group’s credit bid and APA term sheets (as applicable to PropCo) | |
[2]
CONFIDENTIAL
SUBJECT TO FRE 408
FOR DISCUSSION PURPOSES ONLY /
SUBJECT TO MATERIAL CHANGE
Transaction Recoveries Analysis
| First Lien Minority Lender Group Proposal |
|
|||
| Distributable | ||||
| ($ in millions) | Value | |||
| Cash to Lenders (post-OpCo Sale) |
$ | 300 | ||
| OpCo Sale Take Back 1L Debt |
500 | |||
| PropCo Sale Cash |
1,000 | |||
| LiquidationCo |
[TBD | ] | ||
|
|
|
|||
| Total |
$ | 1,800 | ||
| Claims | % of Class | Recovery | % Recovery | |||||||||||||
| DIP Facility |
||||||||||||||||
| DIP Lender Group |
$ | 844 | 93.8 | % | $ | 844 | 100.0 | % | ||||||||
| Minority Lender Group |
56 | 6.2 | % | 56 | 100.0 | % | ||||||||||
|
|
|
|
|
|
|
|
|
|||||||||
| Total |
$ | 900 | 100.0 | % | $ | 900 | 100.0 | % | ||||||||
|
Distributable Value Remaining |
$ | 900 | ||||||||||||||
| 1L Debt |
||||||||||||||||
| DIP Lender Group |
$ | 1,177 | 74.9 | % | $ | 674 | 57.3 | % | ||||||||
| Minority Lender Group |
304 | 19.4 | % | 174 | 57.3 | % | ||||||||||
| Other 1L Lenders |
90 | 5.7 | % | 52 | 57.3 | % | ||||||||||
|
|
|
|
|
|
|
|
|
|||||||||
| Total |
$ | 1,571 | 100.0 | % | $ | 900 | 57.3 | % | ||||||||
| Note: | Based on disclosed First Lien Minority Group holdings as of 9/18/20 |
[3]
CONFIDENTIAL
SUBJECT TO FRE 408
FOR DISCUSSION PURPOSES ONLY /
SUBJECT TO MATERIAL CHANGE
| Disclaimer |
|
|||
This presentation has been prepared by Moelis & Company LLC (“Moelis”) for the members of the ad hoc group of First Lien Term Loans and First Lien Notes (the “Ad Hoc Group”) of J.C. Penney Company, Inc. (the “Company”) represented by Akin Gump Strauss Hauer & Feld LLP in connection with a discussion regarding the matters described herein based on information provided by the Company and publicly available information. Moelis has not assumed any responsibility for independently verifying the information herein, Moelis makes no representation or warranty as to the accuracy, completeness or reasonableness of the information herein and Moelis disclaims any liability with respect to the information herein. In this presentation, Moelis has used certain projections, forecasts or other forward-looking statements with respect to the Company and/or other parties which were provided to Moelis by the Company, such other parties and/or is publicly available and which Moelis has assumed were prepared based on the best available estimates and judgments of the preparer as to the future performance of the Company and/or such other parties. This presentation speaks only as of its date and Moelis assumes no obligation to update it or to advise any person that its conclusions or advice has changed.
This presentation is solely for informational purposes. This presentation is not intended to provide the sole basis for any decision on any transaction and is not a recommendation with respect to any transaction. The recipient should make its own independent business decision based on all other information, advice and the recipient’s own judgment. This presentation is not an offer to sell or a solicitation of an indication of interest to purchase any security, option, commodity, future, loan or currency. It is not a commitment to underwrite any security, to loan any funds or to make any investment. Moelis does not offer tax, accounting or legal advice.
Moelis provides mergers and acquisitions, restructuring and other advisory services to clients and its affiliates manage private investment partnerships. Its personnel may make statements or provide advice that is contrary to information contained in this material. Our proprietary interests may conflict with your interests. Moelis may from time to time have positions in or effect transactions in securities described in this presentation. Moelis may have advised, may seek to advise and may in the future advise or invest in companies mentioned in this presentation.
This presentation is confidential and may not be disclosed to any other person or relied upon without the prior written consent of Moelis.
[4]