Attached files
| file | filename |
|---|---|
| EX-99.3 - EXHIBIT 99.3 - New Home Co Inc. | ex_206719.htm |
| EX-99.1 - EXHIBIT 99.1 - New Home Co Inc. | ex_206675.htm |
| 8-K - FORM 8-K - New Home Co Inc. | nwhm20201012_8k.htm |
Exhibit 99.2
SUMMARY
This summary contains basic information about our business and this offering and highlights selected information contained elsewhere in this offering memorandum or in documents incorporated by reference. This summary is not complete and does not contain all of the information that you should consider before deciding whether or not to invest in the notes offered hereby. For a more complete understanding of our business and this offering before making an investment decision, you should read this entire offering memorandum, especially the description of the terms and conditions of the notes discussed under “Description of the Notes” and the risks discussed under “Risk Factors” included in, or otherwise incorporated by reference in, this offering memorandum, as well as the consolidated financial statements and related notes and other information incorporated by reference in this offering memorandum.
Our Business
Company Overview
We are a new generation homebuilder focused on the design, construction and sale of innovative and consumer-driven homes in major metropolitan areas within select growth markets in California and Arizona, including Southern California, the San Francisco Bay area, metro Sacramento and the greater Phoenix area.
We were founded in 2009, towards the end of an unprecedented downturn in the U.S. homebuilding industry, as The New Home Company LLC. In January 2014, we renamed our company The New Home Company Inc. and completed our initial public offering of shares of our common stock. We believe our management team has extensive and complementary construction, design, marketing, development and entitlement expertise, as well as strong relationships with key land sellers within each of our local markets, and a reputation for quality building, which provide a competitive advantage in being able to acquire land, participate in and create masterplans, obtain entitlements and build quality homes.
We are organized into three reportable segments: Arizona homebuilding, California homebuilding and fee building. Our California homebuilding operation is comprised of divisions in Northern California and Southern California. Our primary business focus is building and selling homes for our own account and we also have a fee building business.
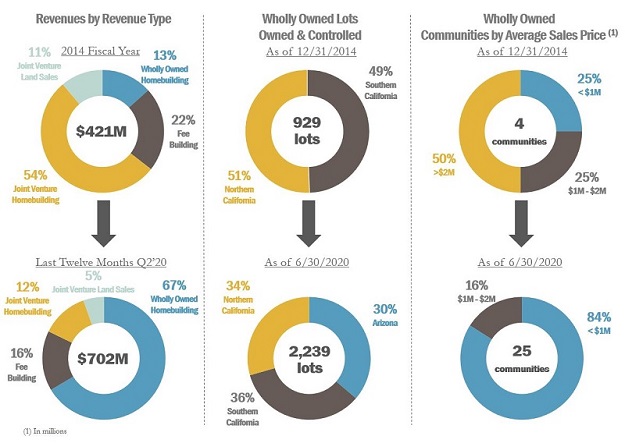
Since our IPO in 2014, we have made meaningful shifts in our business as we have strategically pursued a shift from joint venture to wholly owned communities and income, increased geographic diversification and an expansion of our product offerings to include a higher concentration of more affordably priced homes.
Homebuilding Operations
We are currently focused on identifying unique sites and creating communities that allow us to design, construct and sell consumer driven, single-family detached and attached homes in major metropolitan areas in Southern California, metro Sacramento, the San Francisco Bay area and the greater Phoenix area. We seek sites where we are rewarded for thoughtful land planning and architecture, quality construction, and excellent customer experience. Additional defining characteristics of our markets generally include barriers to entry, job growth, high employment to building permit ratios and increasing populations, which can create growing demand for new housing. We have more recently expanded our portfolio to include more affordable offerings in strong locations, but remain committed to delivering a premium product and experience, which we believe differentiates us from our competitors. We perform consumer research that helps us create land plans and design homes that meet the needs and desires of our targeted buyers. We believe our approach to market research and construction expertise across an extensive product offering allows us the flexibility to pursue a wide array of land acquisition opportunities and appeals to a broad range of potential homebuyers, including entry-level, move-up, move-down and luxury customers. As of December 31, 2019, the homes that we and our unconsolidated joint ventures built ranged in price from approximately $300,000 to over $3 million, with home sizes ranging from approximately 700 to 5,000 square feet. Our homebuilding operations are comprised of two reportable segments, Arizona homebuilding and California homebuilding. Total homebuilding revenue contributed to 86%, 76% and 75% of total revenue for the years ended December 31, 2019, 2018 and 2017, respectively. For the years ended December 31, 2019, 2018 and 2017, the average sales price of homes delivered from our wholly owned communities was approximately $927,000, $1.0 million and $1.6 million, respectively. For the six months ended June 30, 2020, the average sales price of homes delivered from our wholly owned communities was approximately $826,000. We believe that customer-focused community creation and product development, our reputation for high quality construction, as well as exemplary customer service, are key components of the lifestyle connection we seek to establish with each homebuyer.
Additionally, we strive to enhance the home-buying experience and buyers’ personal investment in their homes by actively engaging them in the selection of design options and upgrades in many of our communities. We believe that our on-site design studios in such communities allow buyers to personalize our home offerings with dedicated designers who are knowledgeable about the attributes of the homes offered in the community. We believe that the active participation of buyers in selecting options and upgrades results in buyers becoming more personally invested in their homes. We also believe our emphasis on customer care provides us a competitive advantage. Our commitment to customer satisfaction is a key element of company culture, which fosters an environment where team members can innovate.
We seek to reduce upfront capital and exposure to land risk through the use of land options and other flexible land acquisition and development arrangements. As of June 30, 2020, the Company owned approximately 1,352 lots and had options to purchase an additional 887 lots. We believe our lot option strategy allows us to leverage and establish a homebuilding platform focused on high-growth, land-constrained markets. In addition, we believe that our professional reputation and long-standing relationships with key land sellers, including masterplan community developers, brokers and other builders, as well as our land development joint venture partners, enable us to acquire well-positioned land parcels in our existing markets as well as new target markets. We have also utilized joint ventures to assist in leveraging our entity-level capital and investing in a homebuilding and land development platform, but joint ventures have increasingly become a less meaningful component of our business. We own a minority interest in our joint ventures, but serve as the administrative member, general partner, manager or management member and earn management fees from such joint ventures. Under most of our joint venture agreements, certain major decisions must be approved by the applicable joint venture’s executive committee, which is comprised of both our representatives and representatives of our joint venture partners. As of September 30, 2020, we held membership interests in nine unconsolidated joint ventures. Of the nine joint ventures, three have active homebuilding or land development activities ongoing and the balance are effectively inactive with only limited warranty activities. Our McKinley Village joint venture in Sacramento closed its last home in August 2020. Of the three active joint ventures, one is a homebuilding joint venture with seven remaining homes to be delivered, one is a land development venture with only three lots to be sold, and the last is our land development joint venture in Folsom, CA, for which we made a decision to exit during our 2020 second quarter.As further discussed in “—Recent Developments—Preliminary Third Quarter 2020 Estimated Results,” our land development joint venture in Folsom, California is currently marketing its property in a competitive bidding process to sell its remaining undeveloped lots.
Fee Building Operations & Services
Although our primary business focus is building and selling homes for our own account, we also selectively provide general contracting, construction management and coordination services, sales and marketing services and escrow coordination services as part of agreements with third-parties and the Company’s unconsolidated joint ventures. We refer to these projects as “fee building projects.” Our fee business is comprised primarily of building for third party landowners for a fee with such third party landowners paying or reimbursing the Company for all costs associated with construction. Our fee building segment also includes our management fee revenues that we receive for serving as the managing member or other similar role in our joint ventures. We believe our fee building business complements our homebuilding business as it leverages overhead and supplements income using nominal capital. One of our wholly owned subsidiaries is usually the general contractor for our and our unconsolidated joint ventures’ projects and engages third party subcontractors for home construction and land development.
For the year ended December 31, 2019, 96% of our fee building revenue represents billings to third-party land owners for general contracting and construction management services and 4% represents management fees from unconsolidated joint ventures and third-party land owners for construction and sales management services. Our services with respect to fee building projects may include design, development, construction, escrow, and sales and marketing services. We earn revenue on our fee building projects either as a flat fee for the project or as a percentage of the cost or revenue of the project depending upon the terms of the agreement with our customer. For the years ended December 31, 2019, 2018 and 2017, fee building revenue contributed to 14%, 24% and 25%, respectively, of total consolidated revenue. For the twelve months ended June 30, 2020 and the year ended December 31, 2019, our fee building contribution margin, excluding joint venture management fees, was $3.4 million and $4.0 million, respectively. The Company’s fee building revenues have historically been concentrated with a small number of customers, including Irvine Pacific, LP (“Irvine Pacific”) who accounted for 14%, 23%, and 25% of our total consolidated revenues for the years ended December 31, 2019, 2018 and 2017, respectively. In August 2020, however, Irvine Pacific made a decision to begin building homes using their own general contractor’s license, effectively terminating the Company’s fee building arrangement with Irvine Pacific moving forward. Although we are transitioning construction management responsibilities to Irvine Pacific and are not expected to be engaged for new fee building contracts with them going forward, we are currently in the process of finishing certain existing homes under construction and generating revenues in connection therewith, which we expect to continue through the first quarter of 2021. The Company is actively seeking and entering into new fee building opportunities with other land developers with the objective of at least partially offsetting the expected reduction in Irvine Pacific business in future years, such as our new fee building relationship with FivePoint. See “—Recent Developments—Preliminary Third Quarter 2020 Estimated Results” and “Risk Factors—Risks Related to our Business—A large proportion of our fee building revenue is from one customer.”
The following table shows the percentage of each segment’s revenue in relation to our consolidated total revenues for the years ended December 31, 2019, 2018 and 2017:
|
Year Ended December 31, |
||||||||||||||||||||||||
|
(Dollars in thousands) |
||||||||||||||||||||||||
|
2019 |
% of |
2018 |
% of |
2017 |
% of |
|||||||||||||||||||
|
Homebuilding revenues: |
||||||||||||||||||||||||
|
California home sales |
$ | 472,242 | 71 | % | $ | 504,029 | 76 | % | $ | 560,842 | 75 | % | ||||||||||||
|
Arizona home sales |
60,110 | 9 | % | — | — | % | — | — | % | |||||||||||||||
|
Total homebuilding revenues |
532,352 | 86 | % | 504,029 | 76 | % | 560,842 | 75 | % | |||||||||||||||
| Land sales revenues | $ | 41,664 | 6 | % | $ | — | — | % | $ | — | — | % | ||||||||||||
|
Fee building revenues, including management fees |
95,333 | 14 | % | 163,537 | 24 | % | 190,324 | 25 | % | |||||||||||||||
|
Total revenues |
$ | 669,349 | 100 | % | $ | 667,566 | 100 | % | $ | 751,166 | 100 | % | ||||||||||||
Summary of Owned and Controlled Lots
As of June 30, 2020, we owned or controlled an aggregate of 2,239 lots in our homebuilding segment and 892 lots through our fee building segment. The following table presents certain information with respect to our wholly owned and fee building lots as of June 30, 2020 and December 31, 2019 and 2018:
|
June 30, |
Change |
December 31, |
Change |
December 31, |
||||||||||||||||||||||||
|
2020 |
Amount |
% |
2019 |
Amount |
% |
2018 |
||||||||||||||||||||||
|
Lots Owned |
1,352 | (226 | ) | (14 | )% | 1,578 | (89 | ) | (5 | )% | 1,667 | |||||||||||||||||
|
Lots Controlled(1) |
887 | (236 | ) | (21 | )% | 1,123 | (22 | ) | (2 | )% | 1,145 | |||||||||||||||||
|
Total Lots Owned and Controlled - Wholly Owned |
2,239 | (462 | ) | (17 | )% | 2,701 | (111 | ) | (4 | )% | 2,812 | |||||||||||||||||
|
Fee Building Lots(2) |
892 | (243 | ) | (21 | )% | 1,135 | 329 | 41 | % | 806 | ||||||||||||||||||
|
(1) |
Includes lots that we control under purchase and sales agreements or option agreements subject to customary conditions and have not yet closed. There can be no assurance that such acquisitions will occur. See "Cautionary Statement Concerning Forward-Looking Statements." |
|
(2) |
Lots owned by third party property owners for which we perform general contracting or construction management services. |
Backlog
At December 31, 2019 and 2018, homes under contract, but not yet delivered (“backlog”) totaled 149 and 191, respectively, with an estimated sales value of $125.8 million and $207.1 million, respectively. We expect to deliver all of the homes in backlog at December 31, 2019 during 2020 under existing home order contracts or through the replacement of an existing contract with a new home order contract. As of June 30, 2020, backlog totaled 235 homes with an estimated sales value of $168.8 million. The estimated backlog sales value as of June 30, 2020 may be impacted by, among other things, subsequent home order cancellations, incentives provided, and/or options and upgrades selected.
Acquisition Process
Our land acquisition strategy focuses on purchasing entitled finished, or partially improved land sufficient for construction of homes over a two- to three-year period from the initiation of homebuilding activity. We also selectively acquire parcels that require land development activities. Our acquisition process generally includes the following steps aimed at reducing development and market cycle risk:
• review of the status of entitlements and other governmental processing, including title reviews;
• identification of target buyer and appropriate housing product;
• determination of land plan to accommodate desired housing product;
• completion of environmental reviews and third-party market studies;
• preparation of detailed budgets for all cost categories;
• completion of due diligence on the land parcel prior to committing to the acquisition;
• limitation on the size of an acquisition relative to the Company’s pro forma capitalization; and
• centralized acquisition procedure through a land committee and full Board approval process for larger acquisitions.
Before purchasing a land parcel, we engage and work closely with outside architects and consultants to design our homes and communities.
We also differentiate our acquisition strategy based on whether the land is in a masterplan community, or part of a larger development. For land which is not part of a larger development or masterplan, we generally enter into a purchase agreement with the land owner and deliver a deposit, which becomes nonrefundable upon the expiration of a specified due diligence period. The closing is generally tied to the date on which we have obtained development entitlements for the land. For land which is part of a larger development being developed by a master developer, we generally enter into a purchase agreement with the master developer and pay a deposit that becomes nonrefundable upon expiration of the due diligence period. The closing in master developments is generally tied to the issuance of final land development entitlements and completion of certain infrastructure and other improvements by the master developer. In master developments we may acquire all of the land at the closing or we may acquire the land in “phases”. In master developments we may be required to (a) pay to the master developer a share of our net profit in excess of a specified margin, (b) pay to the master developer marketing fees and/or (c) grant the master developer the right to repurchase the land if we fail to develop the land in accordance with applicable development requirements or wish to sell the land in bulk. Our acquisition and development financing is generally obtained using one or more of the following: (i) proceeds from the sale of debt securities, (ii) unsecured lines of credit; (iii) secured acquisition and development loans; and/or (iv) land bank arrangements with providers who take title to the land at closing subject to agreements which obligate us to perform all development activities with respect to the land and provide us with an option to purchase the land.
Construction, Marketing and Sales Process
We typically develop communities in phases based upon projected sales. We seek to control the timing of construction of subsequent phases in the same community based on sales demand in prior phases. Our construction process is driven by sales contracts that often precede the start of the construction of homes, however, depending on the price point, product, and buyer demand we also engage in some speculative building. The determination that a potential home buyer is qualified to obtain the financing necessary to complete the purchase is an integral part of our process. Once qualified, our designers, which are often at on-site design centers, work with the buyer to tailor the home to meet the buyer’s needs and budget.
Land Development and Construction
We customarily acquire improved or unimproved land zoned for residential use. To control larger land parcels or gain access to certain desirable parcels, we sometimes form land development joint ventures with third parties in order to provide us with a pipeline of land to acquire from the joint venture when the lots are developed. If we purchase raw land or partially developed land, we will perform development work that may include negotiating with governmental agencies and local communities to obtain any necessary zoning, environmental and other regulatory approvals and permits, and constructing, as necessary, roads, water, sewer and drainage systems and recreational facilities like parks, community centers, pools, and hiking and biking trails.
The design of our homes must conform to zoning requirements, building codes and energy efficiency laws. As a result, we contract with a number of architects, engineers, and other consultants in connection with the design process. We act as a general contractor (and certain of our wholly owned subsidiaries hold the general contractor’s licenses in California and Arizona) with our supervisory employees coordinating most of the land development and construction work on a project. Independent architectural design, engineering and other consulting firms are generally engaged on a project-by-project basis to assist in project planning and community and home design, and subcontractors and trade partners are engaged to perform all of the physical development and construction work. Although we generally do not have long-term contractual commitments with our subcontractors, trade partners, suppliers or laborers, we maintain strong and long-standing relationships with many of our subcontractors and trade partners. We believe that our relationships with subcontractors and trade partners have been enhanced through involving them prior to the start of a new community, maintaining our schedules and making timely payments. By dealing fairly, we believe we are able to keep our key subcontractors and trade partners loyal to us.
Sales and Marketing
In connection with the sale and marketing of our homes, we make extensive use of advertising and other promotional activities, including through our website, social-media, brochures, direct mail and other community-specific collateral materials. With the onset of the COVID-19 pandemic, we have focused on transforming our customer experience online through innovative digital options, including (i) shifting to a remote selling environment through the use of our online sales concierges; (ii) providing virtual options for online home tours, design center selections and new home demonstrations; and (iii) providing for self-guided tour options to allow homebuyers to tour model homes privately and at their leisure. The information contained in, or that can be accessed through, our website is not incorporated by reference and is not a part of this offering memorandum.
We primarily sell our homes through our own sales representatives and through the use of outside brokers. It is also fairly common that a third party broker representing a homebuyer receives co-broker commissions in connection with a sale. One of our wholly owned subsidiaries holds the corporate broker’s licenses in California and Arizona. Our in-house sales force works from sales offices located in model homes or sales centers close to, or within each community. Sales representatives assist potential buyers by providing them with floor plan, price and community amenity information, construction timetables, and tours of model homes.
Generally, we build model homes at each project and have them professionally decorated and landscaped to display design features and options available for purchase in the design center. We believe that model homes play a significant role in helping homebuyers understand the efficiencies and value provided by each floor plan type. Structural changes in design from the model homes, other than those predetermined, are not generally permitted, but homebuyers may select various other optional construction and design amenities. The specific options selected for each community are based upon the price of the home and anticipated buyer preferences. Options include structural (room configurations or pre-determined additional square footage), electrical, plumbing and finish options (flooring, cabinets, fixtures).
We typically sell homes using sales contracts that include cash deposits by the purchasers. Most homebuyers utilize long-term mortgage financing to purchase a home, and mortgage lenders will usually make loans only to qualified borrowers. Before entering into sales contracts, we pre-qualify many of our customers through a third party preferred mortgage provider. However, purchasers can generally cancel sales contracts if they are unable to sell their existing homes, if they fail to qualify for financing, or under certain other circumstances. For our communities, the cancellation rate of buyers who contracted to buy a home but did not close escrow as a percentage of overall orders was 11%, 10% and 9% for the years ended December 31, 2019, 2018 and 2017, respectively, and 14% for the six months ended June 30, 2020. Cancellation rates are subject to a variety of factors, including those beyond our control, such as adverse economic or housing market conditions and increases in mortgage interest rates. Cancellation rates have increased gradually over the last couple of years which we believe is consistent with our transition to offering more affordable homes, which generally have higher cancellation rates than move-up and luxury home offerings. In addition, the cancellation rate for the six months ended June 30, 2020 was impacted by increased cancellations in March and April 2020 as a result of the economic impact COVID-19 had on our buyers’ confidence. However, consumer confidence rebounded in the latter part of the 2020 second quarter with cancellation rates being even year-over-year for the 2020 second quarter compared to the prior year period.
Quality Control and Customer Service
We pay particular attention to the product design process and carefully consider quality and choice of materials in order to attempt to eliminate building deficiencies. The quality and workmanship of the subcontractors and trade partners we employ are monitored using our personnel and third-party consultants. We make regular inspections and evaluations of our subcontractors and trade partners to seek to ensure that our standards are met.
We utilize a third party quality control provider and maintain customer service staff whose role includes providing a positive experience for each customer throughout the delivery and post-delivery periods. These employees are responsible for providing after-sales customer service, including the coordination of warranty requests. Our quality and service initiatives include taking homebuyers on a comprehensive tour of their home during construction and prior to delivery. In addition, we generally use a third party, Eliant, to conduct homebuyer surveys in order to improve our performance and evaluate our standards of quality and customer satisfaction.
Insurance and Warranty Program
We provide a limited one-year warranty to our homeowners covering workmanship and materials. In addition, we generally provide a more limited warranty, which generally ranges from a minimum of two years up to the period covered by the applicable statute of repose, that covers certain defined construction defects. The limited warranty covering construction defects is transferable to subsequent buyers and provides for the resolution of unresolved construction-related disputes through binding arbitration. Additionally, we have dedicated customer service staff that work with our homebuyers and coordinate with subcontractors and trade partners, as necessary, during the warranty period. While our subcontractors who perform our homebuilding work generally provide us with an indemnity for claims relating to their workmanship and materials, we also purchase general liability insurance that covers development and construction activity at each of our communities. Our subcontractors are usually covered by these programs through an owner-controlled insurance program, or “OCIP.” Consultants such as engineers and architects are generally not covered by the OCIP but are required to maintain their own insurance. In general, we maintain insurance, subject to deductibles and self-insured retentions, to protect us against various risks associated with our activities, including, among others, general liability, “all-risk” property, construction defects, workers’ compensation, automobile, and employee fidelity. Our warranty and litigation reserves are presented on a gross basis before coverage from insurance, and expected recoveries from insurance carriers are presented as a receivable, the net result of which is equivalent to our expected costs associated with the deductibles and self-insured amounts for warranty and construction defect claims.
Our Business Strengths and Strategies
Premium brand rewarded for customer service, quality and design
The New Home Company Inc. is a premium brand that leverages its expertise across all product segments. We believe our emphasis on, and reputation for, customer service, quality and design differentiate our brand and provide our customers with a superior home buying experience. Our homes are competitively priced, but are not designed to be the lowest priced option in the market. Our core operating philosophy is to provide a positive, memorable experience for our home buyers by actively engaging with them in the building process, tailoring the product to the buyer’s lifestyle needs and enhancing communication, knowledge and satisfaction. Among the numerous customer service, quality and design awards we have received, Eliant Homebuyer Survey Company has rated our company in the top two of overall homebuyer satisfaction for the past eight years, as well as America’s top builder in four of the past eight years. In addition, we’ve been awarded over 300 other architectural, design, sales and customer service awards including over 25 community of the year awards. We’ve been recognized as having one of the top communities or master plans in the United States for five consecutive years. While we have strategically expanded our portfolio to include more affordable product offerings, we remain committed to our premium brand through The New Home Company credo, which is comprised of the following pillars:
|
● |
One of the most recognized builders in customer experience
|
|
● |
Among the best-in-class in quality
|
|
● |
Leading design
|
|
● |
Choice: Making our home yours
|
|
● |
Giving back |
Strategically positioned in highly attractive submarkets
We focus on operating in highly sought-after locations and master-planned communities in our markets where we believe we can be rewarded for our premium brand. Certain defining characteristics of our markets include land constraints, barriers to entry, potential for job growth and increasing populations. Based on data from John Burns Real Estate Consulting, all of our markets, as of July 2020, exhibit resale home supply below the U.S. average of 3.1 months of supply, leading to an attractive supply versus demand dynamic. Within our markets, we focus on positioning our communities in submarkets with convenient access to employment centers, good schools and life-enhancing amenities. Our management team has deep local market knowledge of the homebuilding, land planning and development businesses in our markets and we believe our existing land positions, strong local relationships, reputation for quality building and ability to source accretive land acquisition opportunities position us to capitalize on the positive housing market expansion underway in our markets.
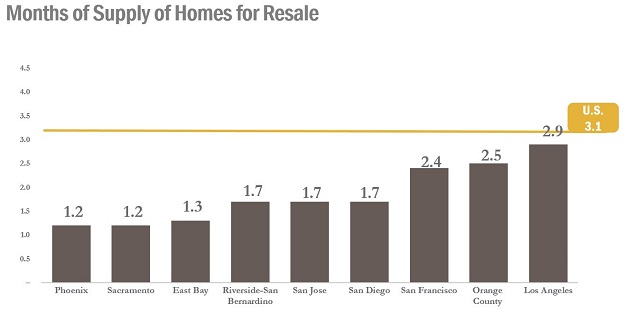
Source: John Burns Real Estate Consulting; Data as of July 2020
Note: Months of supply of homes for resale defined as the current supply of homes divided by average number of homes sold per month
Product and geographic diversification to drive margin improvement
Over the last several years we have focused on expanding our product offerings as well as our geographic diversification. We believe our diversification strategy enables us to better serve a wide range of buyers, to adapt quickly to changing market conditions and to improve performance while strategically reducing risk.
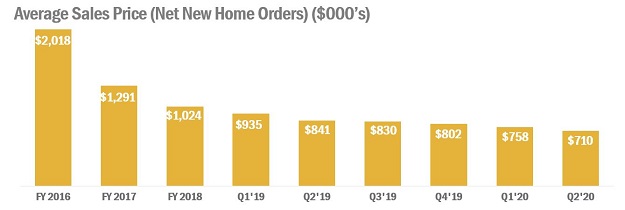
Beginning in 2017, we embarked on a strategy to expand our product offerings to include a higher concentration of more affordably priced homes. Our more affordably priced product continues to emphasize highly desirable locations, innovative architecture and state-of-the-art design, but is priced at a level that caters to a wider range of buyers. Since embarking on this strategy, we have reduced our average sales price for net new home orders from $2.0 million for the year ended 2016 to $710,000 for the 2020 second quarter. We have increased our percentage of entry level communities from 18% of total active communities in the first quarter of 2019 to 44% of total active communities in the second quarter of 2020 and have increased our percentage of entry level homes sold from 21% of net new orders for the 12 months ended March 31, 2019 to 42% of net new orders for the 12 months ended June 30, 2020. Our increased focus on the more affordable price point has helped us achieve an improved sales pace and inventory turnover through shorter cycle times as well as improving gross margins.
We expanded geographically outside of California through our entry into the greater Phoenix, Arizona market in 2016 and began selling and delivering homes in that market in 2017. As of June 30, 2020, approximately 30% of our 2,239 wholly owned lots owned and controlled are located in our Arizona market. In addition, we have expanded our market positioning and presence in more affordable markets in California, including the Inland Empire in Southern California and Sacramento in Northern California.
Intense focus on cash flow generation and reducing leverage
Over the past 18 months, we have prioritized and focused intensely on generating cash flow and reducing our leverage. We have done so by tightly managing our construction starts and selling through our speculative inventory levels, curtailing our land spend, selling select land positions, and right-sizing our selling, marketing and overhead cost structure. Our gross general and administrative expenses have decreased as community count has remained flat with overall headcount down 37% as of September 30, 2020, as compared to January 2019.
The second quarter of 2020 represented our fifth consecutive quarter of positive cash flow from operations. We ended the second quarter of 2020 with a debt-to-capital ratio of 60.0% and a net debt-to-capital ratio of 51.5%, a 620 basis point improvement from the second quarter of 2019.
We intend to use the net proceeds from this offering of $250 million aggregate principal amount of notes, together with cash on hand, to fund the redemption of all $292.3 million of our outstanding existing notes, further demonstrating our commitment to debt reduction. We remain focused on maintaining a proper balance between building liquidity, managing leverage and rebuilding our land and community pipeline.
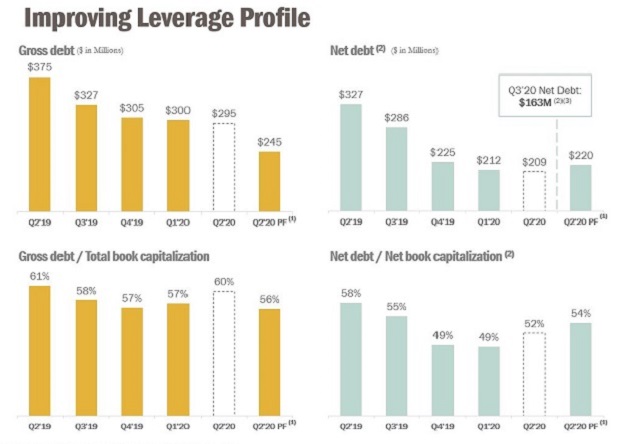
Note: All values shown net of debt discounts and debt issuance costs
(1) On a pro forma as adjusted basis after giving effect to the Transactions (as defined herein), as if such transactions had occurred on June 30, 2020
(2) Net debt is a non-GAAP financial measure defined as total debt, net of unamortized discount, premium and debt issuance costs less cash, cash equivalents and restricted cash to the extent necessary to reduce the debt balance to zero. For a reconciliation of net debt to its more directly comparable GAAP financial measure, see Note 7 to “—Summary Consolidated Financial Data.”
(3) Third quarter 2020 estimated financial results are preliminary and unaudited and, as such, actual results may vary. See “—Recent Developments—Preliminary Third Quarter 2020 Estimated Results” and “Cautionary Statement Concerning Forward-Looking Statements.”
Repositioned balance sheet with focus on margin improvement
Over the past several quarters we have taken decisive actions in regards to underperforming assets, including recording inventory impairment and abandonment charges for certain wholly owned communities and investments in two land development joint ventures to reposition our balance sheet. We believe these actions will provide us with greater flexibility to sell homes at a faster pace, reduce the amount of future capital contributions to the two land development joint ventures and allow us to redeploy capital more quickly into projects with better return profiles. We also anticipate these charges will result in a federal income tax carry-back refund from the recently passed CARES Act. We are focused on improving our gross margins through a combination of higher sales absorption pace, lower anticipated interest costs and the opening of new, more affordable communities including our recent expansion into Arizona.
Fee business leverages overhead and adds supplemental profits
Our fee building business, through which we construct homes on behalf of landowners, allows us to supplement our home sales revenue and profits utilizing nominal capital, leveraging our SG&A, strengthening our relationships with masterplan developers and other land owners, and, we believe, gives us access to a number of the best trade partners in our markets given the scale of our operations. We are actively seeking and entering into new fee building opportunities with other land developers with the objective of at least partially offsetting the expected reduction in Irvine Pacific business in future years, such as our new fee building relationship with FivePoint.
Recent Developments
Preliminary Third Quarter 2020 Estimated Results
Although our consolidated financial statements as of and for the three months ended September 30, 2020 are not yet complete or available as of the date of this offering memorandum, on October 13, 2020 we reported certain preliminary estimated financial information as of and for the three months ended September 30, 2020.
Preliminary Consolidated Statement of Operations Data (Estimated for the Three Months Ended September 30, 2020)
|
Three Months Ended September 30, |
||||||||||||
|
2020 |
2019 |
% Change |
||||||||||
|
(dollars in thousands, unaudited) |
||||||||||||
|
Home sales revenue |
$ | 117,426 | $ | 118,781 | (1 | )% | ||||||
|
Fee building revenues, including management fees |
$ | 13,418 | $ | 22,262 | (40 | )% | ||||||
For the 2020 third quarter, we expect our gross margins to exceed 12.5%.
Preliminary Consolidated Balance Sheet Data (Estimated as of September 30, 2020)
|
As of |
As of |
As of |
||||||||||
|
(dollars in thousands, unaudited) |
||||||||||||
|
Cash and cash equivalents |
$ | 126,375 | $ | 85,588 | $ | 79,314 | ||||||
|
Total debt, net |
$ | 290,272 | $ | 295,124 | $ | 304,832 | ||||||
Preliminary Operating Data (Estimated as of and for the Three Months Ended September 30, 2020)
|
Three Months Ended September 30, |
||||||||||||
|
2020 |
2019 |
% Change |
||||||||||
|
Net New Home Orders |
251 | 124 | 102 | % | ||||||||
|
New Home Deliveries |
157 | 124 | 27 | % | ||||||||
|
As of September 30, 2020 |
As of |
As of December |
||||||||||
|
(dollars in thousands, unaudited) |
||||||||||||
|
Backlog (dollar value) |
$ | 207,138 | $ | 168,793 | $ | 125,803 | ||||||
We made progress on a number of fronts during the 2020 third quarter as homebuyer demand continued to build momentum throughout the quarter. Monthly sales absorption rates improved sequentially with each month in the quarter, with September 2020 representing the highest monthly net order total in our history. We experienced solid pricing power during the 2020 third quarter with most of our communities increasing prices. The higher sales absorption pace and increased pricing resulted in improved year-over-year 2020 third quarter gross margins and gross margins in backlog, as compared to the prior year period. In addition, we strengthened our balance sheet by generating positive operating cash flow during the 2020 third quarter, which resulted in an ending cash and cash equivalents balance of $126.4 million, a $40.8 million increase compared to the end of the 2020 second quarter.
Net new home orders for the 2020 third quarter increased 102% as compared to the prior year period to 251 homes, comprised of 73, 79 and 99 net new home orders for July 2020, August 2020 and September 2020, respectively. In particular, September 2020 net new home orders increased 106%, as compared to September 2019. The increase in net new home orders was driven primarily by a 75% increase in our monthly sales absorption rate to 3.5 net orders per community in the 2020 third quarter, comprised of 3.2, 3.4 and 4.0 for July 2020, August 2020 and September 2020, respectively, with each of our markets experiencing significant improvement as compared to 2.0 net new home orders per community in the 2019 third quarter and, to a lesser extent, a 14% year-over-year increase in average selling communities. Cancellation rate for the 2020 third quarter was 6%, as compared to 11% in the 2019 third quarter. We ended the 2020 third quarter with 25 actively selling communities, a 14% increase compared to the 2019 third quarter.
Homes in backlog at the end of the 2020 third quarter increased 59% to 329, as compared to 207 homes at the end of the 2019 third quarter. The increase in homes in backlog was driven by higher net orders during the quarter, which was partially offset by a higher backlog conversion rate. The dollar value of homes in backlog as of September 30, 2020 was $207.1 million, as compared to $185.8 million as of September 30, 2019, an 11% increase. Consistent with our strategy to pivot to more-affordable product offerings, including our expansion in Arizona, the average selling price of homes in backlog at the end of the 2020 third quarter was $630,000, as compared to $897,000 at the end of the 2019 third quarter.
Home sales revenue for the 2020 third quarter was approximately $117.4 million, as compared to $118.8 million for the 2019 third quarter. The slight year-over-year decrease in home sales revenue was largely the result of a 22% decrease in average selling price driven by our strategic shift to more-affordable product, which was partially offset by a 27% increase in new home deliveries for the 2020 third quarter compared to the 2019 third quarter. The increase in new home deliveries resulted from a higher number of homes in backlog at the beginning of the 2020 third quarter coupled with a higher backlog conversion rate of 67% for the 2020 third quarter, as compared to 60% for the 2019 third quarter. The average sales price of our new home deliveries for the 2020 third quarter was approximately $748,000, as compared to $958,000 for the 2019 third quarter.
For the 2020 third quarter, fee building revenues were $13.4 million, as compared to $22.3 million for the prior year period. The decrease in fee revenues resulted primarily from a decrease in construction activity at fee building communities in Irvine. In August 2020, Irvine Pacific, our largest customer, made a decision to begin building homes using their own general contractor’s license, effectively terminating our fee building arrangement with Irvine Pacific moving forward. Although we are transitioning construction management responsibilities to Irvine Pacific and are not expected to be engaged for new fee building contracts with them going forward, we are currently in the process of finishing certain existing homes under construction and generating revenues in connection therewith, which we expect to continue through the first quarter of 2021. The Company is actively seeking and entering into new fee building opportunities with other land developers with the objective of at least partially offsetting the expected reduction in Irvine Pacific business in future years, such as our new fee building relationship with FivePoint.
During the 2020 third quarter, we repurchased and retired $5.2 million in aggregate principal amount of our existing notes, and as of September 30, 2020, we had $290.3 million of outstanding existing notes, net of unamortized discount, premium and debt issuance costs, and had no borrowings outstanding under our existing revolving credit facility.
In addition, the Company is in the process of exiting its land development joint venture in Folsom, California, which has marketed its property in a competitive bidding process and is currently in negotiations with multiple third party land buyers to sell its remaining undeveloped lots.
We have provided the above preliminary estimated financial results because our financial closing procedures for the three months ended September 30, 2020 are not yet complete. The preliminary estimated financial information set forth above does not represent a comprehensive statement of our results of operations or financial condition as of or for the three months ended September 30, 2020 and is based solely on information available to us as of the date of this offering memorandum. Our results of operations and financial condition as of and for the three months ended September 30, 2020 may vary from our current expectations and may be different from the information described above as our quarterly financial statement preparation process is not yet complete and additional developments and adjustments may arise between now and the time the financial statements and other disclosures for this period are finalized, including all disclosures required by GAAP. In addition, these preliminary estimates are not necessarily indicative of the results to be achieved for the remainder of 2020 or in any future period. There can be no assurance that these estimates will be realized, and estimates are subject to risks and uncertainties, many of which are not within our control. The foregoing information should not be viewed as a substitute for full financial statements prepared in accordance with GAAP or as a measure of performance. Accordingly, you should not place undue reliance on such preliminary estimated financial information. Our preliminary estimated financial results are forward-looking statements. See “Cautionary Statement Concerning Forward-Looking Statements” and “Risk Factors.”
The preliminary estimated financial information has been prepared by, and is the responsibility of, our management. KPMG LLP has not audited, reviewed, compiled, or applied any agreed-upon procedures with respect to the preliminary financial data. Accordingly, KPMG LLP does not express an opinion or any other form of assurance with respect thereto.
COVID-19 Pandemic
On March 11, 2020, the World Health Organization characterized the outbreak of COVID-19 as a global pandemic. From the beginning of the pandemic, we have taken and continue to take a number of strategic and actions in response to the COVID-19 crisis to continue to provide uninterrupted service to our customers while protecting their health and safety, as well as that of our employees and vendors. We have implemented several health and safety protocols to protect our employees, trade partners and customers as required by state and local government agencies and taking into consideration the CDC and other public health authorities’ guidelines. While over the past several months, state and local governments began to relax certain “stay-at-home” and similar public health mandates that were implemented in response to the COVID-19 pandemic, with the resurgence of COVID-19 throughout the nation, there is no assurance as to what level of activity may be permitted to continue. We have been able to continue most of our homebuilding operations during the government-mandated “stay-at-home” orders as residential construction was designated as an essential business as part of critical infrastructure in most jurisdictions in which we operate and homebuilding operations are continuing at all of our jobsites with appropriate safety measures in place. In late June 2020, our model home sales offices reopened to the public with appropriate enhanced sanitation and social-distancing measures in place. While appointments are not necessary, they are still encouraged, and our sales operations continue to leverage our virtual sales tools to connect with our customers online. We have also focused on transforming our customer experience online through innovative digital options, including (i) shifting to a remote selling environment through the use of our online sales concierges; (ii) providing virtual options for online home tours, design center selections and new home demonstrations; and (iii) providing for self-guided tour options to allow homebuyers to tour model homes privately and at their leisure. Although we allowed our corporate and divisional offices to reopen at limited capacity during June 2020, we actively encourage our employees to utilize a work-from-home model where practicable to further limit capacity. During the reopening process, we instituted several safety protocols, such as distancing and personal protective equipment requirements and enhanced premises cleaning, all in accordance with applicable public health orders and advice.
While all of the above-referenced steps are necessary and appropriate in light of the COVID-19 pandemic, they do impact our ability to operate our business in its ordinary and traditional course. These actions, combined with a reduction in the availability, capacity, and efficiency of municipal and private services necessary to progress land development, homebuilding, mortgage loan originations, and home sales, which in each case has varied by market depending on the scope of the restrictions local authorities have established, tempered our sales pace and delayed home construction and deliveries for certain projects during the latter part of March and through a portion of the second quarter. The potential magnitude or duration of the business, operational and economic impacts from the unprecedented public health effort to contain and combat the spread of COVID-19 are uncertain and include, among other things, significant volatility in financial markets and the economy. In addition, we can provide no assurance as to whether the COVID-19 public health effort will be intensified to such an extent that we will not be able to conduct any business operations in certain of our served markets or at all for an indefinite period.
Following the significant decline in demand resulting from the COVID-19 pandemic that we experienced starting at the end of the 2020 first quarter through mid-second quarter 2020, sales absorption steadily improved. We attribute the recently higher level of demand to a number of factors, including low interest rates, a continued undersupply of homes, and consumers’ increased focus on the importance of home. We believe these factors will continue to support demand in the near term. Nevertheless, our year-over-year order improvement is not necessarily indicative of future results due to various factors including seasonality, anticipated community openings and closeouts, and continued uncertainty surrounding the economic and housing market environments due to the impacts of the ongoing COVID-19 pandemic and the related COVID-19 control responses.
Although economic conditions have improved since mid-March and April, in particular for the housing industry, we remain cautious as to the impact of the COVID-19 pandemic on the economy, among other things. Economic conditions in the United States continue to remain uncertain, in particular with respect to unemployment levels, and regarding the extent to which and how long COVID-19 and related government directives, actions and economic relief efforts will impact the U.S. economy, employment levels, financial markets, secondary mortgage markets, consumer confidence, demand for our homes and availability of mortgage loans to homebuyers. Political uncertainty and civil unrest also have the potential to adversely impact the economy. The extent of such impacts on our operational and financial performance will depend on future developments, including the duration and spread of COVID-19, whether there are subsequent outbreaks of the virus, and the related impacts on the economy, financial markets, and our customers, trade partners and employees, all of which are highly uncertain, unpredictable and outside our control.
Given this uncertainty, at the onset of the COVID-19 pandemic, we immediately took several steps to preserve capital, including implementing additional cost cutting measures, curtailing the acquisition and development of land, renegotiating lot takedown arrangements and limiting the number of speculative homes under construction. In the past few months, as economic conditions have improved, especially for the housing industry, we have been actively evaluating new land transactions to rebuild our pipeline. During 2020, we also made strategic decisions to (i) structure an exit from a land development joint venture in Northern California which resulted in a $20.0 million other-than-temporary impairment charge in the 2020 second quarter, (ii) to cease further development at a wholly owned community in Scottsdale, Arizona resulting in a $14.0 million project abandonment charge during the 2020 first quarter, and (iii) exit a land development joint venture in Southern California which resulted in a $2.3 million other-than-temporary impairment charge in the 2020 first quarter. By not continuing with these projects, the Company will avoid significant capital outlays and help preserve capital for the future, as well as be able to seek federal tax refunds.
While the COVID-19 pandemic and related mitigation efforts have created significant uncertainty as to general economic and housing market conditions for the remainder of 2020 and beyond, we believe that we will be able to fund our current and foreseeable liquidity needs with our cash on hand, cash generated from operations, our existing revolving credit facility or, if consummated, our new revolving credit facility, to the extent available, and through accessing debt or equity capital, as needed, although no assurances can be provided that such additional debt or equity capital will be available or on acceptable terms, especially in light of the current COVID-19 pandemic, that the Revolving Credit Facility Refinancing will be consummated or, if consummated, as to the terms thereof or the amount of commitments that will be obtained in respect thereof.
See “Risk Factors—Our business has been materially and adversely disrupted by the present COVID-19 outbreak and could be materially and adversely disrupted by another pandemic, epidemic or outbreak of infectious disease, or similar public health threat, or fear of such an event, in the United States or elsewhere, and the measures implemented to address such an event by government agencies and authorities” for further discussion of the potential impacts on our business, results of operations, financial condition and cash flows from the COVID-19 pandemic and “—Refinancing of the Revolving Credit Facility.”
We will continue to closely monitor any updates from the CDC and guidance from federal and local and government and public health agencies and adjust our operations accordingly. While we cannot reasonably estimate the length or severity of this pandemic, an extended economic slowdown in the U.S. could materially impact our results of operations in fiscal 2020 and potentially beyond.
Redemption of Senior Notes due 2022
Substantially concurrently with this offering of the notes, we intend to issue a notice of conditional redemption for all $292.3 million of our outstanding existing notes, which were issued on March 17, 2017 in an aggregate principal amount of $250 million and on May 4, 2017 in an aggregate principal amount of $75 million (the “Redemption”). The notice provides for a redemption date of November 12, 2020 (the “Redemption Date”), at a redemption price equal to 101.813% of the principal amount of the existing notes redeemed, plus accrued and unpaid interest, if any, to the Redemption Date (the “Redemption Price”). This offering memorandum is not an offer to purchase or a solicitation of an offer to sell, or a notice of redemption with respect to, the existing notes, and any Redemption shall be made only pursuant to a redemption notice delivered pursuant to and in accordance with the indenture governing the existing notes. The Redemption is conditioned on the issuance of the notes offered hereby.
Substantially concurrently with the issuance of the notes, we intend to satisfy and discharge the indenture governing the existing notes by, pursuant to the terms of such indenture, depositing with the trustee for the existing notes an amount in cash sufficient to pay the Redemption Price on the Redemption Date.
We intend to use the net proceeds from this offering, together with cash on hand, to fund the Redemption and to pay related fees and expenses. See “Use of Proceeds.”
As used herein, “Transactions” means the (i) issuance and sale by us of the notes offered hereby, (ii) the Redemption, (iii) the repurchase of $5.2 million aggregate principal amount of our existing notes in open market transactions in August and September of 2020 and (iv) the payment of related fees and expenses in connection with the foregoing.
Refinancing of the Revolving Credit Facility
In connection with the issuance of the notes, we are in the process of pursuing a potential refinancing (the “Revolving Credit Facility Refinancing”) of our existing revolving credit facility. We refer to the new senior unsecured credit facility that would be established in such Revolving Credit Facility Refinancing as the “new revolving credit facility” and the credit agreement that would govern the same as the “New Credit Agreement.”
We expect that the new revolving credit facility will provide for aggregate revolving commitments of up to $60 million and that the terms of the new revolving credit facility, if established, will be substantially similar to those applicable to the existing revolving credit facility, except that we expect (1) the maturity of the new revolving credit facility will be April 30, 2023; and (2) the uncommitted accordion feature of the new revolving credit facility will be decreased from $150 million to $100 million, subject to certain financial and other conditions. The effectiveness of the new revolving credit facility is expected to be conditioned on, among other things, the issuance of the notes offered hereby. We have engaged JPMorgan Chase Bank, N.A. to use commercially reasonable efforts to arrange the Revolving Credit Facility Refinancing and, if consummated, to act as administrative agent under the New Credit Agreement. JPMorgan Chase Bank, N.A. has commenced a syndication process in respect of the new revolving credit facility; however, there can be no assurances that the Revolving Credit Facility Refinancing will be consummated or, if consummated, as to the terms thereof or the amount of commitments that will be obtained in respect thereof.
Corporate Information
The New Home Company Inc. was incorporated in Delaware in 2014 and our predecessor company was founded in 2009. Our principal executive offices are located at 85 Enterprise, Suite 450, Aliso Viejo, California 92656. Our main telephone number is (949) 382-7800.
SUMMARY CONSOLIDATED FINANCIAL DATA
The following table sets forth certain of our historical consolidated financial and other data. The summary historical consolidated balance sheet data as of December 31, 2017 are derived from our audited consolidated financial statements that do not appear elsewhere in this offering memorandum nor are they incorporated by reference herein. The summary historical consolidated financial and other data as of December 31, 2019 and 2018, and for each of the three years ended December 31, 2019, have been derived from our audited consolidated financial statements and the related notes incorporated by reference in this offering memorandum. The summary historical consolidated financial and other data as of June 30, 2020 and for the six months ended June 30, 2020 and 2019 have been derived from our unaudited consolidated financial statements and the related notes incorporated by reference in this offering memorandum. The summary historical consolidated interim financial data as of and for the six months ended June 30, 2020 and 2019 have been prepared on the same basis as our audited consolidated financial statements and, in our opinion, reflect all adjustments, consisting only of normal and recurring adjustments, necessary for a fair presentation of this data in all material respects. Our historical results for any prior period are not necessarily indicative of results expected in any future period. The following information is a summary only and should be read together with our consolidated financial statements and the related notes incorporated in this offering memorandum by reference. See “Where You Can Find More Information.”
The summary historical unaudited consolidated financial data for the twelve months ended June 30, 2020 have been derived by adding the historical consolidated financial data for the fiscal year ended December 31, 2019 to the historical consolidated financial data for the six months ended June 30, 2020 and subtracting the historical consolidated financial data for the six months ended June 30, 2019.
You should read the information below along with all other financial information and analysis presented in this offering memorandum, including “Capitalization” and our consolidated financial statements and related notes included in our Annual Report on Form 10-K for the year ended December 31, 2019 and our Quarterly Reports on Form 10-Q for the quarters ended March 31, 2020 and June 30, 2020, all incorporated by reference in this offering memorandum.
|
Twelve Months |
Six Months Ended June 30, |
Year Ended December 31, |
||||||||||||||||||||||
|
2020 |
2020 |
2019 |
2019 |
2018 |
2017 |
|||||||||||||||||||
|
(dollars in thousands) |
||||||||||||||||||||||||
|
Statement of Operations Data |
||||||||||||||||||||||||
|
Revenues: |
||||||||||||||||||||||||
|
Home sales |
$ | 466,118 | $ | 173,416 | $ | 239,650 | $ | 532,352 | $ | 504,029 | $ | 560,842 | ||||||||||||
|
Land sales |
41,821 | 157 | — | 41,664 | — | — | ||||||||||||||||||
|
Fee building, including management fees from unconsolidated joint ventures(1) |
110,806 | 57,420 | 41,947 | 95,333 | 163,537 | 190,324 | ||||||||||||||||||
| 618,745 | 230,993 | 281,597 | 669,349 | 667,566 | 751,166 | |||||||||||||||||||
|
Cost of Sales: |
||||||||||||||||||||||||
|
Home sales |
410,401 | 150,938 | 210,094 | 469,557 | 436,530 | 473,213 | ||||||||||||||||||
|
Home sales impairments |
27,300 | 19,000 | — | 8,300 | 10,000 | 2,200 | ||||||||||||||||||
|
Land sales |
43,326 | 157 | — | 43,169 | — | — | ||||||||||||||||||
|
Land sales impairments |
1,900 | — | — | 1,900 | — | — | ||||||||||||||||||
|
Fee building |
108,725 | 56,482 | 41,038 | 93,281 | 159,136 | 184,827 | ||||||||||||||||||
| 591,652 | 226,577 | 251,132 | 616,207 | 605,666 | 660,240 | |||||||||||||||||||
|
Gross Margin: |
||||||||||||||||||||||||
|
Home sales |
28,417 | 3,478 | 29,556 | 54,495 | 57,499 | 85,429 | ||||||||||||||||||
|
Land sales |
(3,405 | ) | — | — | (3,405 | ) | — | — | ||||||||||||||||
|
Fee building |
2,081 | 938 | 909 | 2,052 | 4,401 | 5,497 | ||||||||||||||||||
| 27,093 | 4,416 | 30,465 | 53,142 | 61,900 | 90,926 | |||||||||||||||||||
|
Home sales gross margin |
6.1 | % | 2.0 | % | 12.3 | % | 10.2 | % | 11.4 | % | 15.2 | % | ||||||||||||
|
Home sales gross margin before impairments(2) |
12.0 | % | 13.0 | % | 12.3 | % | 11.8 | % | 13.4 | % | 15.6 | % | ||||||||||||
|
Land sales gross margin |
(8.1% | ) | — | % | N/A | (8.2 | )% | N/A | N/A | |||||||||||||||
|
Fee building gross margin |
1.9 | % | 1.6 | % | 2.2 | % | 2.2 | % | 2.7 | % | 2.9 | % | ||||||||||||
|
Selling and marketing expenses |
(31,847 | ) | (13,852 | ) | (18,362 | ) | (36,357 | ) | (36,065 | ) | (32,702 | ) | ||||||||||||
|
General and administrative expenses |
(25,406 | ) | (12,915 | ) | (13,232 | ) | (25,723 | ) | (25,966 | ) | (26,330 | ) | ||||||||||||
|
Equity in net income (loss) of unconsolidated joint ventures |
(25,771 | ) | (21,899 | ) | 369 | (3,503 | ) | (19,653 | ) | 866 | ||||||||||||||
|
Interest expense |
(1,989 | ) | (1,989 | ) | — | — | — | — | ||||||||||||||||
|
Project abandonment costs |
(14,205 | ) | (14,130 | ) | (19 | ) | (94 | ) | (206 | ) | (383 | ) | ||||||||||||
|
Gain on early extinguishment of debt |
774 | 579 | 969 | 1,164 | — | — | ||||||||||||||||||
|
Other income (expense), net |
(14 | ) | 155 | (276 | ) | (445 | ) | (315 | ) | 154 | ||||||||||||||
|
Pretax income (loss) |
(71,365 | ) | (59,635 | ) | (86 | ) | (11,816 | ) | (20,305 | ) | 32,531 | |||||||||||||
|
(Provision) benefit for income taxes |
30,991 | 26,866 | (310 | ) | 3,815 | 6,075 | (15,390 | ) | ||||||||||||||||
|
Net income (loss) |
(40,374 | ) | (32,769 | ) | (396 | ) | (8,001 | ) | (14,230 | ) | 17,141 | |||||||||||||
|
Net (income) loss attributable to noncontrolling interest |
(17 | ) | — | (19 | ) | (36 | ) | 14 | 11 | |||||||||||||||
|
Net income (loss) attributable to The New Home Company Inc. |
$ | (40,391 | ) | $ | (32,769 | ) | $ | (415 | ) | $ | (8,037 | ) | $ | (14,216 | ) | $ | 17,152 | |||||||
|
Other Financial Data, including Non-GAAP Measures (unaudited): |
||||||||||||||||||||||||
|
Interest incurred |
$ | 25,982 | $ | 12,530 | $ | 15,367 | $ | 28,819 | $ | 28,377 | $ | 21,978 | ||||||||||||
|
Adjusted homebuilding gross margin(2) |
$ | 81,615 | $ | 33,225 | $ | 40,709 | $ | 89,099 | $ | 86,177 | $ | 98,650 | ||||||||||||
|
Adjusted homebuilding gross margin percentage(2) |
17.5 | % | 19.2 | % | 17.0 | % | 16.7 | % | 17.1 | % | 17.6 | % | ||||||||||||
|
Adjusted EBITDA(3) |
$ | 36,859 | $ | 13,375 | $ | 17,946 | $ | 41,430 | $ | 38,668 | $ | 50,109 | ||||||||||||
|
Adjusted EBITDA margin percentage(3) |
6.0 | % | 5.8 | % | 6.4 | % | 6.2 | % | 5.8 | % | 6.7 | % | ||||||||||||
|
Ratio of Adjusted EBITDA to total interest incurred(3) |
|
1.4x |
|
1.1x |
|
1.2x |
|
1.4x |
|
1.4x |
|
2.3x | ||||||||||||
| Gross general and administrative expenses, excluding severance and including general and administrative expenses allocated to fee building cost of sales(4) | $ | 28,754 | $ | 13,890 | $ | 14,453 | $ | 29,317 | $ | 33,170 | $ | 34,630 | ||||||||||||
|
Operating Data: |
||||||||||||||||||||||||
|
Total selling communities |
25 | 25 | 20 | 21 | 20 | 17 | ||||||||||||||||||
|
Total net new home orders |
562 | 296 | 266 | 532 | 536 | 412 | ||||||||||||||||||
|
New homes delivered |
534 | 210 | 250 | 574 | 498 | 341 | ||||||||||||||||||
|
Average sales price of homes delivered |
$ | 873 | $ | 826 | $ | 959 | $ | 927 | $ | 1,012 | $ | 1,645 | ||||||||||||
|
Cancellation rate |
12 | % | 14 | % | 12 | % | 11 | % | 10 | % | 9 | % | ||||||||||||
|
Backlog (number of homes) |
235 | 235 | 207 | 149 | 191 | 153 | ||||||||||||||||||
|
Backlog (dollar value) |
$ | 168,793 | $ | 168,793 | $ | 201,589 | $ | 125,803 | $ | 207,071 | $ | 162,250 | ||||||||||||
|
June 30, 2020 |
December 31, |
|||||||||||||||||||
|
Actual |
Pro Forma As |
2019 |
2018 |
2017 |
||||||||||||||||
|
Consolidated Balance Sheet Data |
||||||||||||||||||||
|
Cash and cash equivalents(6) |
$ | 85,588 | $ | 25,338 | $ | 79,314 | $ | 42,273 | $ | 123,546 | ||||||||||
|
Real estate inventories |
370,949 | 373,025 | 433,938 | 566,290 | 416,143 | |||||||||||||||
|
Investment in and advances to unconsolidated joint ventures |
12,931 | 12,931 | 30,217 | 34,330 | 55,824 | |||||||||||||||
|
Total assets |
541,594 | 483,420 | 603,189 | 696,097 | 644,512 | |||||||||||||||
|
Total debt |
295,124 | 245,000 | 304,832 | 387,648 | 318,656 | |||||||||||||||
|
Total liabilities |
344,516 | 294,257 | 370,430 | 456,067 | 380,432 | |||||||||||||||
|
Stockholders’ equity |
196,966 | 189,050 | 232,647 | 239,954 | 263,990 | |||||||||||||||
|
Select Credit Statistics: |
||||||||||||||||||||
|
Ratio of cash and inventory to debt |
|
1.5x |
|
1.6x | 1.7x | 1.6x |
|
1.7x | ||||||||||||
|
Ratio of debt-to-capital |
60.0 | % | 56.4 | % | 56.7 | % | 61.8 | % | 54.7 | % | ||||||||||
|
Ratio of net debt-to-capital(7) |
51.5 | % | 53.7 | % | 49.2 | % | 59.0 | % | 42.4 | % | ||||||||||
|
Ratio of debt to Adjusted EBITDA(3) |
|
8.0x |
|
6.6x |
|
7.4x |
|
10.0x |
|
6.4x | ||||||||||
|
Ratio of net debt to Adjusted EBITDA(3) |
|
5.7x |
|
6.0x | 5.4x | 8.9x | 3.9x | |||||||||||||
|
(1) |
Management fees from unconsolidated joint ventures were $1.4 million for the twelve months ended June 30, 2020, $0.6 million for the six months ended June 30, 2020 and $1.9 million, $3.4 million and $4.9 million for the years ended December 31, 2019, 2018 and 2017, respectively. |
|
(2) |
Home sales gross margin before impairments (also referred to as homebuilding gross margin before impairments) and adjusted homebuilding gross margin are non-GAAP measures. The homebuilding gross margin before impairments percentage and the adjusted homebuilding gross margin percentage are each calculated by dividing homebuilding gross margin before impairments and adjusted homebuilding gross margin, respectively, by home sales revenue for a given period. We believe this information is meaningful as it isolates the impact that impairments and leverage have on homebuilding gross margin and permits investors to make better comparisons with our competitors who also break out and adjust gross margins in a similar fashion. The following table reconciles homebuilding gross margin and homebuilding gross margin percentage, as reported and prepared in accordance with GAAP, to the non-GAAP measures homebuilding gross margin before impairments and adjusted homebuilding gross margin. |
| Twelve Months Ended June 30, |
Six Months Ended June 30, |
Year Ended December 31, | ||||||||||||||||||||||
| 2020 | 2020 | 2019 | 2019 | 2018 | 2017 | |||||||||||||||||||
| (dollars in thousands) | ||||||||||||||||||||||||
|
Home sales revenue |
$ | 466,118 | $ | 173,416 | $ | 239,650 | $ | 532,352 | $ | 504,029 | $ | 560,842 | ||||||||||||
|
Cost of home sales |
437,701 | 169,938 | 210,094 | 477,857 | 446,530 | 475,413 | ||||||||||||||||||
|
Homebuilding gross margin |
28,417 | 3,478 | 29,556 | 54,495 | 57,499 | 85,429 | ||||||||||||||||||
|
Add: Home sales impairments |
27,300 | 19,000 | — | 8,300 | 10,000 | 2,200 | ||||||||||||||||||
|
Homebuilding gross margin before impairments |
55,717 | 22,478 | 29,556 | 62,795 | 67,499 | 87,629 | ||||||||||||||||||
|
Add: interest in cost of home sales |
25,898 | 10,747 | 11,153 | 26,304 | 18,678 | 11,021 | ||||||||||||||||||
|
Adjusted homebuilding gross margin |
$ | 81,615 | $ | 33,225 | $ | 40,709 | $ | 89,099 | $ | 86,177 | $ | 98,650 | ||||||||||||
|
Adjusted homebuilding gross margin percentage |
17.5 | % | 19.2 | % | 17.0 | % | 16.7 | % | 17.1 | % | 17.6 | % | ||||||||||||
| (3) | Adjusted EBITDA, adjusted EBITDA margin percentage, the ratio of adjusted EBITDA to total interest incurred, the ratio of debt to Adjusted EBITDA and the ratio of net debt to Adjusted EBITDA are non-GAAP measures. Adjusted EBITDA means net income (loss) (plus cash distributions of income from unconsolidated joint ventures) before (a) income taxes, (b) interest expense, (c) amortization of previously capitalized interest included in cost of sales (excluding amounts included in impairment charges), (d) severance charges (e) noncash inventory impairment charges and abandoned project costs, (f) gain on early extinguishment of debt, (g) depreciation and amortization, (h) amortization of stock-based compensation (i) equity in net (income) loss from unconsolidated joint ventures. Adjusted EBITDA margin percentage is calculated by dividing adjusted EBITDA by total revenue for a given twelve-month period. The ratio of adjusted EBITDA to total interest incurred is calculated by dividing adjusted EBITDA by total interest incurred for a given twelve-month period. The ratio of debt to Adjusted EBITDA is calculated by dividing debt at the period end by Adjusted EBITDA for a given period. The ratio of net debt to Adjusted EBITDA is calculated by dividing debt at the period end less cash, cash equivalents and restricted cash by Adjusted EBITDA for a given period. Other companies may calculate adjusted EBITDA and related ratios differently. Management believes that Adjusted EBITDA assists investors in understanding and comparing the operating characteristics of homebuilding activities by eliminating many of the differences in companies’ respective capitalization, interest costs, tax position, level of impairments and other non-recurring items. Due to the significance of the GAAP components excluded, Adjusted EBITDA should not be considered in isolation or as an alternative to net income (loss), cash flows from operations or any other performance measure prescribed by GAAP. A reconciliation of net income (loss) to Adjusted EBITDA, and the calculations of Adjusted EBITDA margin percentage, the ratio of Adjusted EBITDA to total interest incurred, the ratio of debt to Adjusted EBITDA, and the ratio of net debt to Adjusted EBITDA are provided in the following table. |
| Twelve Months Ended June 30, |
Six Months Ended June 30, |
Year Ended December 31, | ||||||||||||||||||||||
| 2020 | 2020 | 2019 | 2019 | 2018 | 2017 | |||||||||||||||||||
| (dollars in thousands) | ||||||||||||||||||||||||
|
Net income (loss) |
$ | (40,374 | ) | $ | (32,769 | ) | $ | (396 | ) | $ | (8,001 | ) | $ | (14,230 | ) | $ | 17,141 | |||||||
|
Interest amortized to cost of sales excluding impairment charges, and interest expense(8) |
28,817 | 12,736 | 11,153 | 27,234 | 18,678 | 11,021 | ||||||||||||||||||
|
Provision (benefit) for income taxes |
(30,991 | ) | (26,866 | ) | 310 | (3,815 | ) | (6,075 | ) | 15,390 | ||||||||||||||
|
Depreciation and amortization |
7,538 | 3,623 | 5,042 | 8,957 | 6,631 | 449 | ||||||||||||||||||
|
EBITDA |
(35,010 | ) | (43,276 | ) | 16,109 | 24,375 | 5,004 | 44,001 | ||||||||||||||||
|
Add: amortization of stock-based compensation |
2,281 | 1,110 | 1,089 | 2,260 | 3,090 | 2,803 | ||||||||||||||||||
|
Add: cash distributions of income from unconsolidated joint ventures |
95 | — | 279 | 374 | 715 | 1,588 | ||||||||||||||||||
|
Add: severance charges |
1,091 | 1,091 | 1,788 | 1,788 | — | — | ||||||||||||||||||
|
Add: noncash inventory impairments and abandonments |
43,405 | 33,130 | 19 | 10,294 | 10,206 | 2,583 | ||||||||||||||||||
|
Less: gain on early extinguishment of debt |
(774 | ) | (579 | ) | (969 | ) | (1,164 | ) | — | — | ||||||||||||||
|
Less: equity in net (income) loss from unconsolidated joint ventures |
25,771 | 21,899 | (369 | ) | 3,503 | 19,653 | (866 | ) | ||||||||||||||||
|
Adjusted EBITDA |
$ | 36,859 | $ | 13,375 | $ | 17,946 | $ | 41,430 | $ | 38,668 | $ | 50,109 | ||||||||||||
|
Adjusted EBITDA margin percentage |
6.0 | % | 5.8 | % | 6.4 | % | 6.2 | % | 5.8 | % | 6.7 | % | ||||||||||||
|
Ratio of adjusted EBITDA to total interest incurred |
1.4x |
1.1x |
1.2x |
1.4x |
1.4x |
2.3x |
||||||||||||||||||
|
Ratio of debt to Adjusted EBITDA |
8.0x |
7.4x |
10.0x |
6.4x |
||||||||||||||||||||
|
Ratio of net debt to Adjusted EBITDA |
5.7x |
5.4x |
8.9x |
3.9x |
||||||||||||||||||||
| (4) | Gross general and administrative expenses, excluding severance and including general and administrative expenses allocated to fee building cost of sales is a non-GAAP measure. The following table reconciles our general and administrative expenses, as prepared in accordance with GAAP, to the non-GAAP measure of gross general and administrative expenses, excluding severance charges and including general and administrative expenses allocated to fee building cost of sales. We believe that gross general and administrative expenses, excluding severance charges and including general and administrative expenses allocated to fee building cost of sales are relevant financial measures for management and investors to understand the expenses of our overall homebuilding operations and without the impact of isolated events to make better comparisons with our competitors. |
| Twelve Months Ended June 30, |
Six Months Ended June 30, |
Year Ended December 31, | ||||||||||||||||||||||
| 2020 | 2020 | 2019 | 2019 | 2018 | 2017 | |||||||||||||||||||
| (dollars in thousands) | ||||||||||||||||||||||||
|
General and administrative expenses |
$ | 25,406 | $ | 12,915 | $ | 13,232 | $ | 25,723 | $ | 25,966 | $ | 26,330 | ||||||||||||
|
Add: G&A allocated to fee building cost of sales |
4,221 | 1,848 | 3,009 | 5,382 | 7,204 | 8,300 | ||||||||||||||||||
|
Less: Severance |
(873 | ) | (873 | ) | (1,788 | ) | (1,788 | ) | — | — | ||||||||||||||
|
Gross general and administrative expenses, excluding severance and including general and administrative expenses allocated to fee building cost of sales |
$ | 28,754 | $ | 13,890 | $ | 14,453 | $ | 29,317 | $ | 33,170 | $ | 34,630 | ||||||||||||
|
(5) |
Gives effect to the Transactions, as if such Transactions had occurred on June 30, 2020. See “Summary—Recent Developments—Redemption of Senior Notes due 2022,” “Use of Proceeds” and “Capitalization.” |
|
(6) |
Cash and cash equivalents, as of June 30, 2020 on a pro forma as adjusted basis, reflects the use of cash on hand to (i) repurchase $5.2 million aggregate principal amount of our existing notes in open market transactions in August and September of 2020 and to (ii) partially fund the Redemption of our existing notes and to pay related fees and expenses. As of the date of this offering memorandum, $292.3 million aggregate principal amount of the existing notes were outstanding. Does not give effect to the use of cash on hand to make a required interest payment on the existing notes on October 1, 2020. |
|
(7) |
The ratio of net debt-to-capital is a non-GAAP measure. The following table reconciles our ratio of debt-to-capital, as prepared in accordance with GAAP, to the non-GAAP ratio of net debt-to-capital. The ratio of debt-to-capital is computed as the quotient obtained by dividing total debt, net of unamortized discount, premium and debt issuance costs by total capital (the sum of total debt, net of unamortized discount, premium and debt issuance costs plus equity, exclusive of noncontrolling interest). The ratio of net debt-to-capital is computed as the quotient obtained by dividing net debt (which is total debt, net of unamortized discount, premium and debt issuance costs less cash, cash equivalents and restricted cash to the extent necessary to reduce the debt balance to zero) by total capital, exclusive of noncontrolling interest. We believe the ratio of net debt-to-capital is a relevant financial measure for investors to understand the leverage employed in our operations and as an indicator of our ability to obtain financing. We believe that by deducting our cash from our debt, we provide a measure of our indebtedness that takes into account our cash liquidity. We believe this provides useful information as the ratio of debt-to-capital does not take into account our liquidity and we believe that the ratio net of cash provides supplemental information by which our financial position may be considered. Investors may also find this to be helpful when comparing our leverage to the leverage of our competitors that present similar information. |
| June 30, 2020 | December 31, | |||||||||||||||||||
| Actual | As Adjusted(5) | 2019 | 2018 | 2017 | ||||||||||||||||
|
Total debt, net of unamortized discount, premium and debt issuance costs |
$ | 295,124 | $ | 245,000 | $ | 304,832 | $ | 387,648 | $ | 318,656 | ||||||||||
|
Equity, exclusive of noncontrolling interest |
196,966 | 189,050 | 232,647 | 239,954 | 263,990 | |||||||||||||||
|
Total capital |
$ | 492,090 | $ | 434,050 | $ | 537,479 | $ | 627,602 | $ | 582,646 | ||||||||||
|
Ratio of debt-to-capital |
60.0 | % | 56.4 | % | 56.7 | % | 61.8 | % | 54.7 | % | ||||||||||
|
Total debt, net of unamortized discount, premium and debt issuance costs |
$ | 295,124 | $ | 245,000 | $ | 304,832 | $ | 387,648 | $ | 318,656 | ||||||||||
|
Less: cash, cash equivalents and restricted cash |
85,732 | 25,482 | 79,431 | 42,542 | 123,970 | |||||||||||||||
|
Net debt |
209,392 | 219,518 | 225,401 | 345,106 | 194,686 | |||||||||||||||
|
Equity, exclusive of noncontrolling interest |
196,966 | 189,050 | 232,647 | 239,954 | 263,990 | |||||||||||||||
|
Total capital |
$ | 406,358 | $ | 408,568 | $ | 458,048 | $ | 585,060 | $ | 458,676 | ||||||||||
|
Ratio of net debt-to-capital |
51.5 | % | 53.7 | % | 49.2 | % | 59.0 | % | 42.4 | % | ||||||||||
|
(8) |
Due to an inadvertent oversight in prior year periods, interest amortized to certain inventory impairment charges and to equity in net income (loss) of unconsolidated joint ventures was duplicated in the adjusted EBITDA calculation. The prior period has been restated to correct this duplication. |
RISK FACTORS
An investment in the notes involves significant risk. In addition to the other information in this offering memorandum, prospective investors should carefully consider the risks described in this section and included or incorporated by reference in this offering memorandum before making an investment in the notes. If any of the risks and uncertainties discussed in this offering memorandum or included or incorporated by reference in this offering memorandum were to occur, our business, prospects, liquidity, financial condition and results of operations could be materially and adversely affected, in which case our ability to pay interest or principal on the notes or otherwise fulfill our obligations under the Indenture would be adversely affected. Some statements in this offering memorandum, including statements in the following risk factors, constitute forward-looking statements. Please refer to the section of this offering memorandum entitled “Cautionary Statement Concerning Forward-Looking Statements.”
Risks Related to Our Business
Our business has been materially and adversely disrupted by the present COVID-19 outbreak and could be materially and adversely disrupted by another pandemic, epidemic or outbreak of infectious disease, or similar public health threat, or fear of such an event, in the United States or elsewhere, and the measures implemented to address such an event by government agencies and authorities.
A pandemic, epidemic or similar serious public health issue, such as the present outbreak of COVID-19, and the measures taken by international, federal, state and local governments, and other authorities to address it, could significantly disrupt our business for an extended period. Further, a significant outbreak of contagious diseases, such as COVID-19, could result in a widespread health crisis that could adversely affect the global economy and financial markets, resulting in an economic downturn. As a result, consumer confidence may wane and demand for our homes may decline having a material adverse impact on our consolidated financial statements.
On March 11, 2020, the World Health Organization characterized the outbreak of COVID-19 a global pandemic and recommended containment and mitigation measures. On March 13, 2020, the United States declared a national emergency concerning the outbreak, and most states and municipalities have declared public health emergencies including the states in which we operate, California and Arizona. Along with these declarations, California and Arizona have enacted, at various times, ”stay-at-home”, “shelter-in-place” and other restrictive orders to contain and combat the outbreak and spread of COVID-19 that substantially restricted daily activities for individuals and many businesses to curtail or cease normal operations.
In response to the stay-at-home and shelter-in-place orders in California and Arizona, our model homes and design studios were closed to the public and operated on an appointment-only basis, as permitted, following recommended distancing and other health and safety protocols when meeting in person with a customer. Associates at our corporate and divisional offices moved to a work-from-home model for nearly all employees. Construction activities at our job sites within most of the jurisdictions in which we operate were permitted to continue during the stay-at-home and shelter-in-place orders, however, careful protocols were set in place to protect our employees and trade partners that impacted operational efficiency. The restrictions we have taken to contain the outbreak as well as a reduction in the availability, capacity and efficiency of municipal and private services necessary to operations has and may continue to temper our sales pace and delay the delivery of our homes at certain communities.
As conditions started to improve in late May 2020 as state and local governments in our markets began relaxing the public health restrictions described above and we began to gradually take steps to effectively resume nearly all of our operations (with enhanced safety measures), including reopening our model homes and design studios and expanding construction and customer care service activities to the extent permitted. However, in late May, the states in which we operate each began to experience a severe spike in transmissions of COVID-19 which caused state and local authorities in California and Arizona to take various actions to pause the relaxation on restrictions and in some cases re-implement similar restrictive measures and closure orders. Throughout the 2020 third quarter, conditions improved and we began to see pandemic-related government restrictions begin to ease again. However, COVID-19 has recently resurged in a number of places throughout the country and the world, accordingly, we remain uncertain of the potential full magnitude or duration of the business and economic impacts from the unprecedented public health effort to contain and combat the spread of COVID-19, which include, among other things, a recession, high unemployment levels, and significant volatility in financial markets and the price of our common stock. In addition, we can provide no assurance as to whether the COVID-19 public health effort will be intensified to such an extent, particularly in response to the current or any resurgence in infections, that we will not be able to conduct any business operations in certain of our markets or at all for an indefinite period.
Our business can be negatively impacted as a result of a number of additional factors influenced by the COVID-19 pandemic, including as a result of an unwillingness of customers to visit model homes or employees to return to work due to fears about illness, school closures or other concerns; disruptions to the supply chain for building materials; disruptions in the mortgage financing markets; illness of key executives; inefficiencies due to safety protocols and social distancing; and costs incurred to disinfect contaminated employee work spaces, model homes or construction work sites.
We are uncertain of the potential full magnitude or duration of the business and economic impacts from the unprecedented public health effort to contain and combat the spread of COVID-19, which include, among other things, significant volatility in financial markets and a sharp decrease in the value of equity securities, including our common stock. In addition, we can provide no assurance as to whether the COVID-19 public health effort will be intensified to such an extent that we will no longer be designated an essential business or that we will not be able to conduct any business operations in certain of our served markets or at all for an indefinite period.
Our business could also be negatively impacted over the medium-to-longer term if the disruptions related to COVID-19 decrease consumer confidence generally or with respect to purchasing a home; cause civil unrest, similar to what arose at the end of May related to efforts to institute law enforcement and other social and political reforms and which may also affect our business in the short and/or medium-to-longer term; negatively impact mortgage availability or the federal government’s mortgage loan-related programs; or precipitate a prolonged economic downturn and/or an extended rise in unemployment or tempering of wage growth, any of which could lower demand for our products as occurred during the later part of the 2020 first quarter and earlier months of the 2020 second quarter; impair our ability to sell and build homes in a typical manner, or at all, generate revenues and cash flows, and/or access capital or lending markets (or significantly increase the costs of doing so), as may be necessary to sustain our business; increase our use of sales incentives and concessions which could adversely affect our margins; increase the costs or decrease the supply of building materials or the availability of subcontractors and other talent, including as a result of infections or medically necessary or recommended self-quarantining, or governmental mandates to direct production activities to support public health efforts; and/or result in our recognizing charges in current and future periods, which may be material, for inventory impairments or land option contract abandonments, or both, related to our current inventory assets. For example, during the 2020 first quarter, we decided to terminate our option contract for a luxury condominium project in Scottsdale, Arizona in large part due to significant economic uncertainty related to COVID-19 and recorded an abandonment charge of $14.0 million related to the capitalized costs that have accumulated to the portion of the project that is being abandoned. Circumstances related to the COVID-19 pandemic and associated economic relief measures were considered in our 2020 second quarter decision to exit the joint venture in Folsom, California which resulted in a $20.0 million other-than-temporary impairment charge for the period. The long-term economic impact and near-term financial impacts may cause us to incur other abandonment or impairment charges in the future, but the impact of COVID-19 cannot be reliably quantified or estimated at this time.
Should the adverse impacts described above (or others that are currently unknown) occur, whether individually or collectively, we would expect to experience, among other things, decreases in our net orders, homes delivered, average selling prices, revenues and profitability, as we did in the 2020 second quarter, and such impacts could be material to our financial statements in 2020 and beyond. In addition, should the COVID-19 public health effort intensify to such an extent that we cannot operate in most or all of our served markets, we could generate few or no orders and deliver few, if any, homes during the applicable period, which could be prolonged. Along with a potential increase in cancellations of home purchase contracts, if there are prolonged government restrictions on our business and our customers, and/or an extended economic recession, we could be unable to produce revenues and cash flows sufficient to conduct our business; meet the terms of our covenants and other requirements under the existing revolving credit facility or, if consummated, the new revolving credit facility, the existing notes and the notes. Such a circumstance could, among other things, exhaust our available liquidity (and ability to access liquidity sources) and/or trigger an acceleration to pay a significant portion or all of our then-outstanding debt obligations, which we may be unable to do.
In addition to the risks described above, the COVID-19 pandemic may also have the effect of heightening other risks disclosed in the “Risk Factors” sections of this offering memorandum and our Annual Report on Form 10-K for the year ended December 31, 2019 and Quarterly Reports on Form 10-Q for the quarters ended March 31, 2020 and June 30, 2020, all incorporated by reference in this offering memorandum, including, but not limited to, risks related to deterioration in homebuilding and general economic conditions, our geographic concentration, competition, availability of mortgage financing, inventory risks and impairments, supply and/or labor shortages, access to capital markets (including the debt and secondary mortgage markets), impact on joint ventures, compliance with the terms of our indebtedness (including our existing revolving credit facility or, if consummated, our new revolving credit facility, the indenture governing our existing notes and the indenture that will govern the notes offered hereby), potential downgrades of credit ratings, and our leverage.