Attached files
| file | filename |
|---|---|
| 8-K - 8-K - Matson, Inc. | matx-20201008x8k.htm |
| EX-99.1 - EX-99.1 - Matson, Inc. | matx-20201008xex99d1.htm |
Exhibit 99.2
| 1 Preliminary Third Quarter 2020 Earnings Supplement Third Quarter 2020 Preliminary Earnings Supplement October 8, 2020 |
| 2 Preliminary Third Quarter 2020 Earnings Supplement Forward-Looking Statements Statements made during this presentation that set forth expectations, predictions, projections or are about future events are based on facts and situations that are known to us as of October 8, 2020. We believe that our expectations and assumptions are reasonable. Actual results may differ materially, due to risks and uncertainties, such as those described on pages 24-34 of our Form 10-Q filed on May 5, 2020 and other subsequent filings by Matson with the SEC. Statements made during this presentation are not guarantees of future performance. We do not undertake any obligation to update our forward-looking statements. |
| 3 Preliminary Third Quarter 2020 Earnings Supplement Preliminary Third Quarter 2020 Results • Matson’s lines of business continued to perform well in 3Q20 despite the ongoing challenges from the COVID-19 pandemic and related economic effects • China service, consisting of CLX and CLX+, was the primary driver of the increase in consolidated operating income year-over-year • Now confident CLX+ service can be permanent – Continued strong demand expected for our transpacific expedited ocean services – Leverages Matson’s unique 15-year track record of operating the fastest and most reliable service in the industry – Westbound seafood back-haul from AAX call in Dutch Harbor expected to help long-term economics • Ocean Transportation – China strength – CLX+ voyages and increased capacity in the CLX service – Hawaii, Alaska and Guam volumes improved from levels achieved in 2Q20 as freight demand improved with reopening of local economies; Alaska and Guam volume higher YoY, and Hawaii volume approached 3Q19 level • Logistics – Continued reopening of the U.S. economy led to improved performance in all of the business lines |
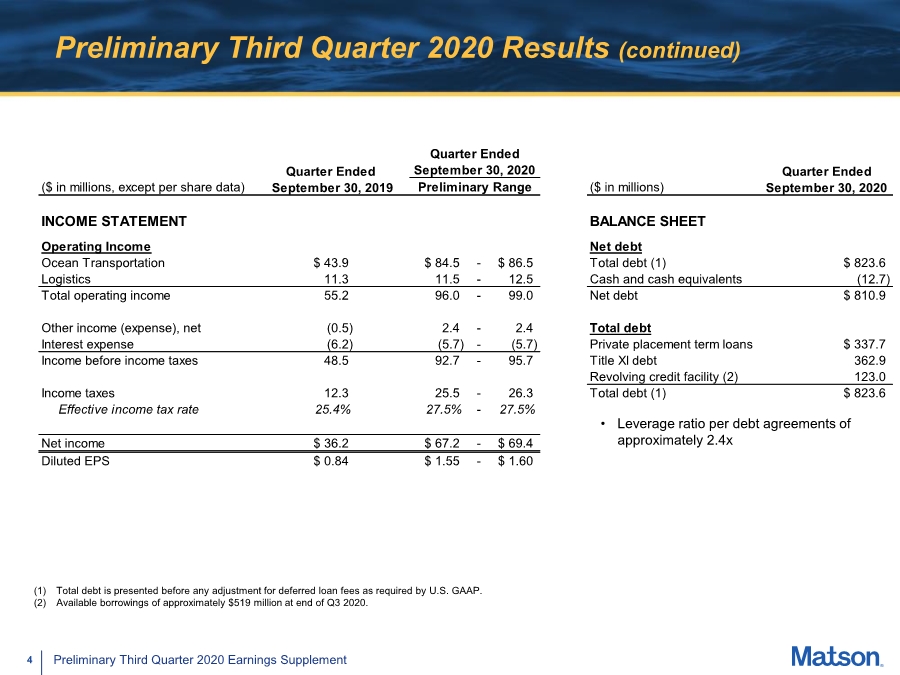
| 4 Preliminary Third Quarter 2020 Earnings Supplement ($ in millions, except per share data) Preliminary Range ($ in millions) INCOME STATEMENT BALANCE SHEET Operating Income Net debt Ocean Transportation $ 43.9 $ 84.5 - $ 86.5 Total debt (1) $ 823.6 Logistics 11.3 11.5 - 12.5 Cash and cash equivalents (12.7) Total operating income 55.2 96.0 - 99.0 Net debt $ 810.9 Other income (expense), net (0.5) 2.4 - 2.4 Total debt Interest expense (6.2) (5.7) -(5.7) Private placement term loans $ 337.7 Income before income taxes 48.5 92.7 - 95.7 Title XI debt 362.9 Revolving credit facility (2) 123.0 Income taxes 12.3 25.5 - 26.3 Total debt (1) $ 823.6 Effective income tax rate 25.4% 27.5% - 27.5% Net income $ 36.2 $ 67.2 - $ 69.4 Diluted EPS $ 0.84 $ 1.55 - $ 1.60 Quarter Ended September 30, 2020 Quarter Ended September 30, 2020 Quarter Ended September 30, 2019 Preliminary Third Quarter 2020 Results (continued) (1) Total debt is presented before any adjustment for deferred loan fees as required by U.S. GAAP. (2) Available borrowings of approximately $519 million at end of Q3 2020. • Leverage ratio per debt agreements of approximately 2.4x |
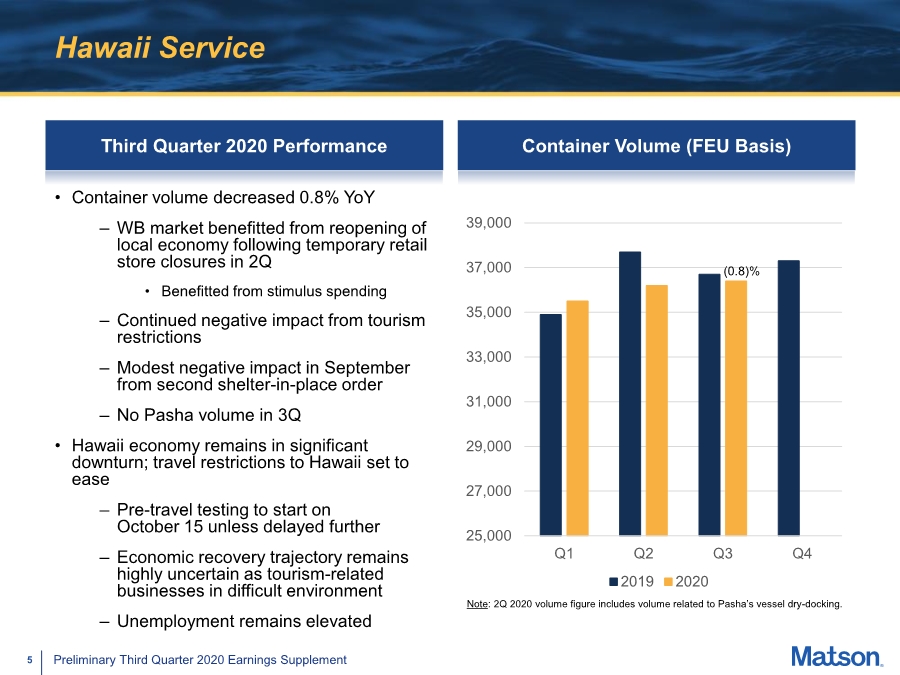
| 5 Preliminary Third Quarter 2020 Earnings Supplement Hawaii Service Third Quarter 2020 Performance • Container volume decreased 0.8% YoY – WB market benefitted from reopening of local economy following temporary retail store closures in 2Q • Benefitted from stimulus spending – Continued negative impact from tourism restrictions – Modest negative impact in September from second shelter-in-place order – No Pasha volume in 3Q • Hawaii economy remains in significant downturn; travel restrictions to Hawaii set to ease – Pre-travel testing to start on October 15 unless delayed further – Economic recovery trajectory remains highly uncertain as tourism-related businesses in difficult environment – Unemployment remains elevated Container Volume (FEU Basis) 25,000 27,000 29,000 31,000 33,000 35,000 37,000 39,000 Q1 Q2 Q3 Q4 2019 2020 Note: 2Q 2020 volume figure includes volume related to Pasha’s vessel dry-docking. (0.8)% |
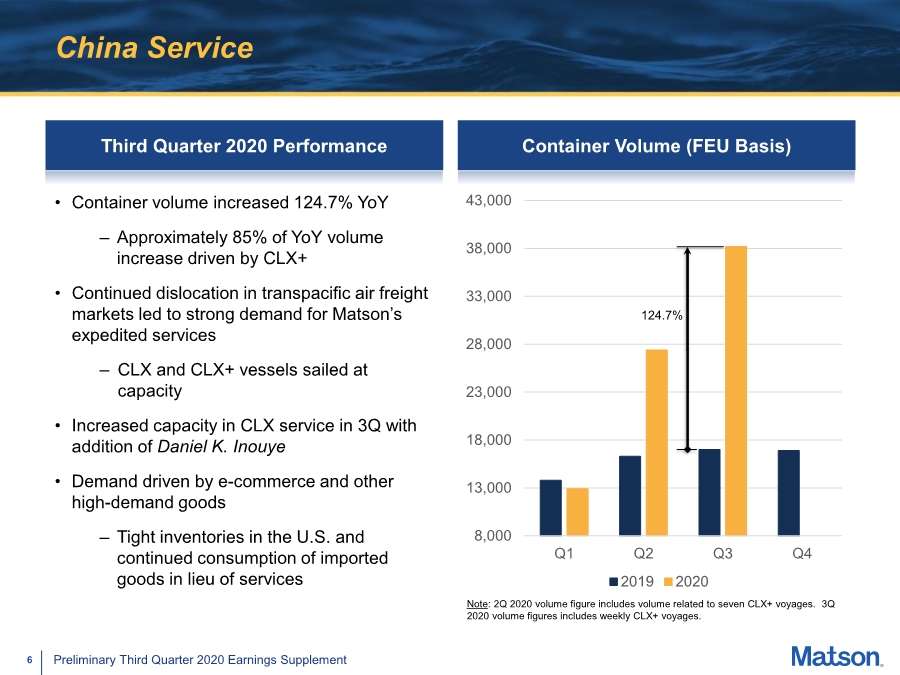
| 6 Preliminary Third Quarter 2020 Earnings Supplement China Service Third Quarter 2020 Performance • Container volume increased 124.7% YoY – Approximately 85% of YoY volume increase driven by CLX+ • Continued dislocation in transpacific air freight markets led to strong demand for Matson’s expedited services – CLX and CLX+ vessels sailed at capacity • Increased capacity in CLX service in 3Q with addition of Daniel K. Inouye • Demand driven by e-commerce and other high-demand goods – Tight inventories in the U.S. and continued consumption of imported goods in lieu of services Container Volume (FEU Basis) 8,000 13,000 18,000 23,000 28,000 33,000 38,000 43,000 Q1 Q2 Q3 Q4 2019 2020 Note: 2Q 2020 volume figure includes volume related to seven CLX+ voyages. 3Q 2020 volume figures includes weekly CLX+ voyages. 124.7% |
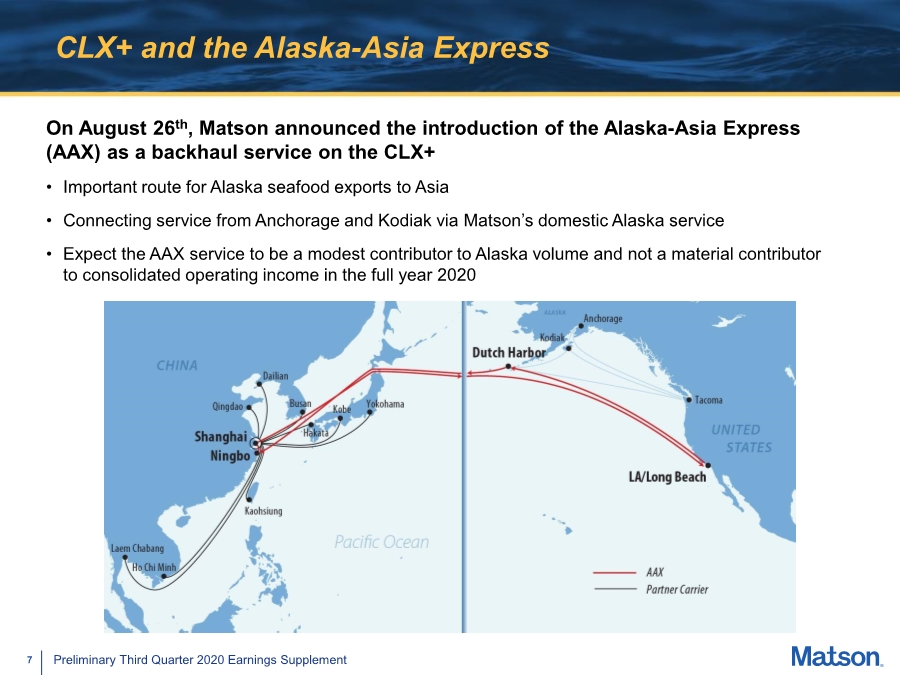
| 7 Preliminary Third Quarter 2020 Earnings Supplement CLX+ and the Alaska-Asia Express On August 26th, Matson announced the introduction of the Alaska-Asia Express (AAX) as a backhaul service on the CLX+ • Important route for Alaska seafood exports to Asia • Connecting service from Anchorage and Kodiak via Matson’s domestic Alaska service • Expect the AAX service to be a modest contributor to Alaska volume and not a material contributor to consolidated operating income in the full year 2020 |
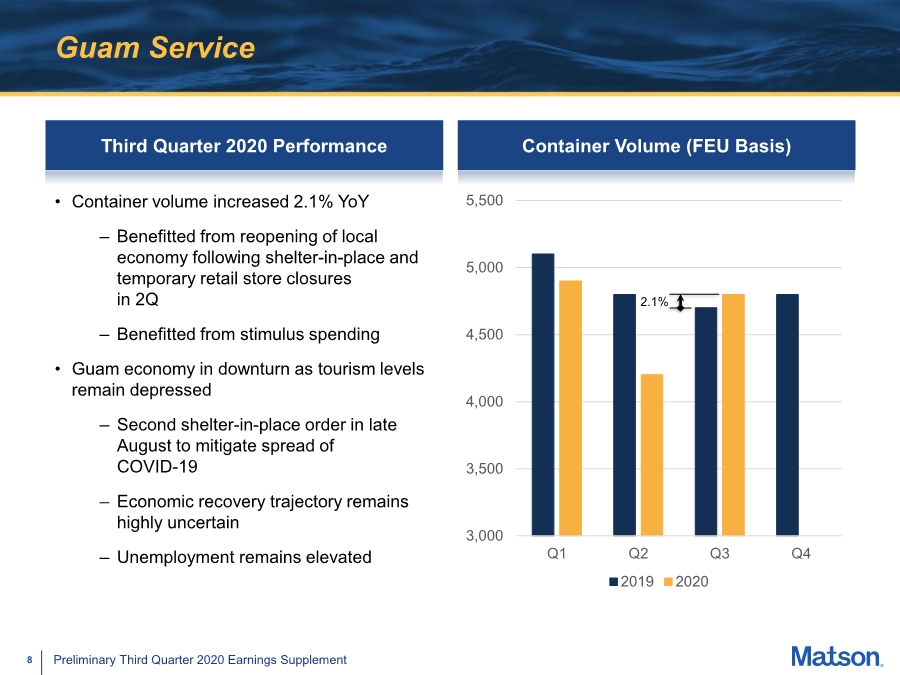
| 8 Preliminary Third Quarter 2020 Earnings Supplement Guam Service Third Quarter 2020 Performance • Container volume increased 2.1% YoY – Benefitted from reopening of local economy following shelter-in-place and temporary retail store closures in 2Q – Benefitted from stimulus spending • Guam economy in downturn as tourism levels remain depressed – Second shelter-in-place order in late August to mitigate spread of COVID-19 – Economic recovery trajectory remains highly uncertain – Unemployment remains elevated Container Volume (FEU Basis) 3,000 3,500 4,000 4,500 5,000 5,500 Q1 Q2 Q3 Q4 2019 2020 2.1% |
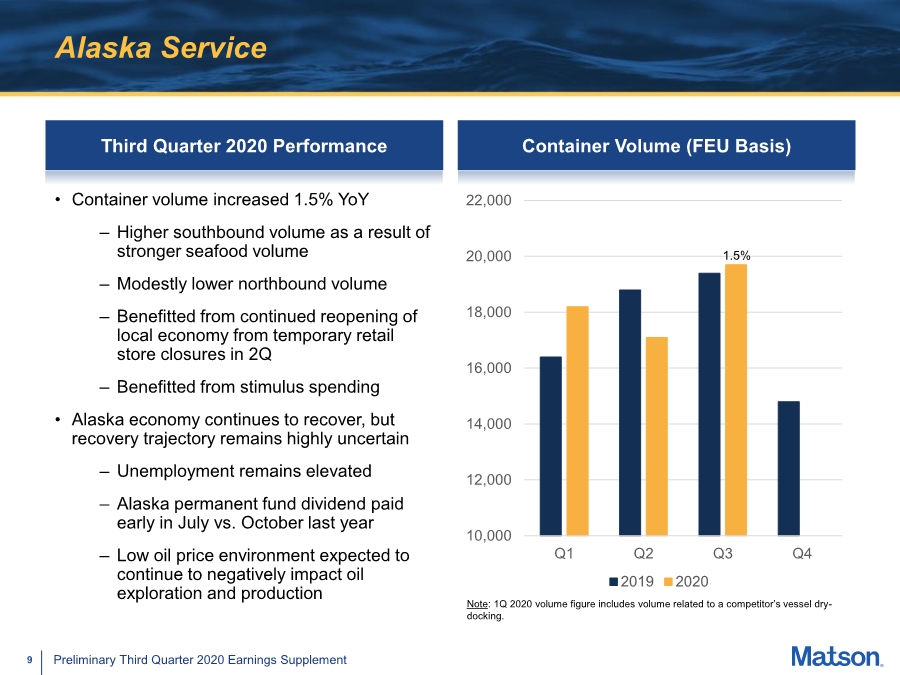
| 9 Preliminary Third Quarter 2020 Earnings Supplement Alaska Service Third Quarter 2020 Performance • Container volume increased 1.5% YoY – Higher southbound volume as a result of stronger seafood volume – Modestly lower northbound volume – Benefitted from continued reopening of local economy from temporary retail store closures in 2Q – Benefitted from stimulus spending • Alaska economy continues to recover, but recovery trajectory remains highly uncertain – Unemployment remains elevated – Alaska permanent fund dividend paid early in July vs. October last year – Low oil price environment expected to continue to negatively impact oil exploration and production Container Volume (FEU Basis) Note: 1Q 2020 volume figure includes volume related to a competitor’s vessel dry- docking. 10,000 12,000 14,000 16,000 18,000 20,000 22,000 Q1 Q2 Q3 Q4 2019 2020 1.5% |
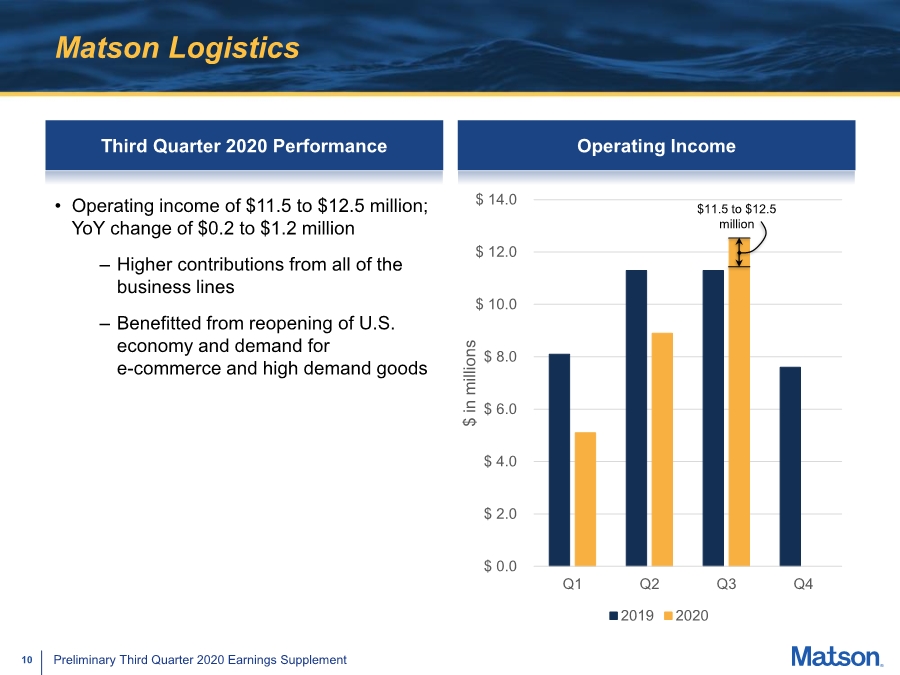
| 10 Preliminary Third Quarter 2020 Earnings Supplement Matson Logistics Third Quarter 2020 Performance Operating Income $ 0.0 $ 2.0 $ 4.0 $ 6.0 $ 8.0 $ 10.0 $ 12.0 $ 14.0 Q1 Q2 Q3 Q4 $ in millions 2019 2020 • Operating income of $11.5 to $12.5 million; YoY change of $0.2 to $1.2 million – Higher contributions from all of the business lines – Benefitted from reopening of U.S. economy and demand for e-commerce and high demand goods $11.5 to $12.5 million |

