Attached files
| file | filename |
|---|---|
| EX-10.31 - SECURITIES PURCHASE AGREEMENT - Alternus Energy Inc. | altn_ex1031.htm |
| EX-32.2 - CERTIFICATION - Alternus Energy Inc. | altn_ex322.htm |
| EX-32.1 - CERTIFICATION - Alternus Energy Inc. | altn_ex321.htm |
| EX-31.2 - CERTIFICATION - Alternus Energy Inc. | altn_ex312.htm |
| EX-31.1 - CERTIFICATION - Alternus Energy Inc. | altn_ex311.htm |
| EX-21.1 - LIST OF SUBSIDIARIES - Alternus Energy Inc. | altn_ex211.htm |
| EX-10.30 - CONVERTIBLE PROMISSORY NOTE - Alternus Energy Inc. | altn_ex1030.htm |
| EX-10.29 - SETTLEMENT AGREEMENT - Alternus Energy Inc. | altn_ex1029.htm |
| EX-10.28 - SECURITIES PURCHASE AGREEMENT - Alternus Energy Inc. | altn_ex1028.htm |
| EX-10.27 - SECURITIES PURCHASE AGREEMENT - Alternus Energy Inc. | altn_ex1027.htm |
| EX-10.26 - CONVERTIBLE PROMISSORY NOTE - Alternus Energy Inc. | altn_ex1026.htm |
| EX-10.25 - SECURITIES PURCHASE AGREEMENT - Alternus Energy Inc. | altn_ex1025.htm |
| EX-10.24 - CONVERTIBLE PROMISSORY NOTE - Alternus Energy Inc. | altn_ex1024.htm |
UNITED STATES
SECURITIES AND EXCHANGE COMMISSION
Washington, D.C. 20549
FORM 10-K
| ☒ | ANNUAL REPORT PURSUANT TO SECTION 13 OR 15(d) OF THE SECURITIES EXCHANGE ACT OF 1934 |
For the fiscal year ended December 31, 2019
Or
| ☐ | TRANSITION REPORT PURSUANT TO SECTION 13 OR 15(d) OF THE SECURITIES EXCHANGE ACT OF 1934 |
For the transition period from ______ to _______
Commission file number: 000-56085
| Alternus Energy Inc. |
| (Exact name of registrant as specified in its charter) |
| Nevada |
| 46-4996419 |
| (State or other jurisdiction of incorporation or organization) |
| (I.R.S. Employer Identification No.) |
|
|
|
|
| One World Trade Center, Suite 8500 |
| 10007 |
| (Address of principal executive office) |
| (Zip Code) |
(212) 220-7434
(Registrant’s telephone number, including area code)
Securities registered pursuant to Section 12(b) of the Act: None
| Title of each class |
| Trading Symbol(s) |
| Name of each exchange on which registered |
| None |
| N/A |
| N/A |
Securities registered pursuant to Section 12(g) of the Act:
Common Stock, par value $0.001 per share
(Title of each class)
Indicate by check mark if the registrant is a well-known seasoned issuer, as defined in Rule 405 of the Securities Act. Yes ☐ No ☒
Indicate by check mark if the registrant is not required to file reports pursuant to Section 13 or 15(d) of the Act. Yes ☐ No ☒
Indicate by check mark whether the registrant (1) has filed all reports required to be filed by Section 13 or 15(d) of the Securities Exchange Act of 1934 during the preceding 12 months (or for such shorter period that the registrant was required to file such reports), and (2) has been subject to such filing requirements for the past 90 days. Yes ☒ No ☐
Indicate by check mark whether the registrant has submitted electronically every Interactive Data File required to be submitted pursuant to Rule 405 of Regulation S-T (§ 232.405 of this chapter) during the preceding 12 months (or for such shorter period that the registrant was required to submit such files).. Yes ☒ No ☐
Indicate by check mark whether the registrant is a large accelerated filer, an accelerated filer, a non-accelerated filer, smaller reporting company, or an emerging growth company. See the definitions of “large accelerated filer,” “accelerated filer,” “smaller reporting company,” and “emerging growth company” in Rule 12b-2 of the Exchange Act.
| Large accelerated filer | ☐ | Accelerated filer | ☐ |
| Non-accelerated filer | ☒ | Smaller reporting company | ☒ |
| Emerging growth company | ☒ |
|
|
If an emerging growth company, indicate by check mark if the registrant has elected not to use the extended transition period for complying with any new or revised financial accounting standards provided pursuant to Section 13(a) of the Exchange Act. ☐
Indicate by check mark whether the registrant is a shell company (as defined in Rule 12b-2 of the Act). Yes ☐ No ☒
The aggregate market value of the voting common stock held by non-affiliates of the registrant, based upon the closing sale price of the Common Stock on June 30, 2019 was approximately $17 million.
As of September 30, 2020, the Company had 120,520,492 shares of Class A Common Stock and 15,000,000 shares of Class B Common Stock.
| 2 |
STATEMENT REGARDING FORWARD-LOOKING STATEMENTS
This communication contains forward-looking statements within the meaning of Section 27A of the Securities Act of 1933, as amended (the “Securities Act”), and Section 21E of the Securities Exchange Act of 1934, as amended (the “Exchange Act”). Forward-looking statements can be identified by the fact that they do not relate strictly to historical or current facts. Forward-looking statements typically contain words such as “anticipate,” “believe,” “estimate,” “expect,” “goal,” “intend,” “opportunities,” “plan,” “potential,” “project,” “target,” “can,” “could,” “may,” “should,” “will,” “would” or similar words, constitute “forward-looking statements.” These forward-looking statements, which are based on our current plans, expectations and projections about future events, should not be unduly relied upon. These statements involve known and unknown risks, uncertainties and other factors, including, without limitation, those discussed under “Risk Factors,” that may cause our actual results, performance and achievements to materially differ from any future results, performance and achievements expressed or implied by such forward-looking statements. We caution you therefore against relying on any of these forward-looking statements.
The forward-looking statements included herein are based upon our assumptions, estimates and beliefs and involve judgments with respect to, among other things, future economic, competitive and market conditions and future business decisions, all of which are difficult or impossible to predict accurately and many of which are beyond our control. Although we believe that the expectations reflected in such forward-looking statements are based on reasonable assumptions, our actual results and performance could differ materially from those set forth in the forward-looking statements and may be affected by a variety of risks and other factors, which may cause our actual results, performance or achievements to differ materially from any future results, performance or achievements expressed or implied by these forward-looking statements. Some of the key factors that could cause actual results to differ from our expectations include, but are not limited to:
|
| • | We are a holding company and rely on distributions and other payments, advances and transfers of funds from our subsidiaries to meet our obligations |
|
| • | The reduction, modification or elimination of government subsidies and economic incentives |
|
| • | Decreases in the spot market price of electricity could harm our revenue and reduce the competitiveness of solar parks in grid-parity markets |
|
| • | The seasonality of our operations may affect our liquidity and will affect our quarterly results |
|
| • | Our acquisition strategy exposes us to substantial risk |
|
| • | The delay between making significant upfront investments in our solar parks and receiving revenue could materially and adversely affect our liquidity, business and results of operations |
|
| • | Failure to manage our growing and changing business could have a material adverse effect on our business, prospects, financial condition and results of operations |
|
| • | Our IPP business requires significant financial resources. If we do not successfully execute our financing plan, we may have to sell certain of our IPP solar parks |
|
| • | the condition of the debt and equity capital markets and our ability to borrow additional funds and access capital markets, as well as our substantial indebtedness and the possibility that we may incur additional indebtedness in the future |
Any of the assumptions underlying forward-looking statements could be inaccurate. All forward-looking statements are made as of the date of this report and the risk that actual results will differ materially from the expectations expressed in this Annual Report on Form 10-K will increase with the passage of time. Except as otherwise required by the federal securities laws, we undertake no obligation to publicly update or revise any forward-looking statements after the date of this report, whether as a result of new information, future events, changed circumstances or any other reason. In light of the significant uncertainties inherent in the forward-looking statements included in this report, the inclusion of such forward-looking statements should not be regarded as a representation by us or any other person that the objectives and plans set forth in this report will be achieved.
| 3 |
| Table of Contents |
GLOSSARY OF TERMS
Unless otherwise indicated or the context otherwise requires, references in this report to the terms below will have the following meanings:
|
| • | “Alternus Energy,” “we,” “our,” “us”, “ALTN” and the “Company” refer to Alternus Energy Inc. and its consolidated subsidiaries; |
|
|
|
|
|
| • | “common stock” refers to both Class A and Class B common stock, unless otherwise designated. |
|
|
|
|
|
| • | “EPC” are to engineering, procurement and construction services; |
|
|
|
|
|
| • | “FiT” are to feed-in tariff(s); |
|
|
|
|
|
| • | “IPP” are to independent power producer and refer to our business where we own and operate solar parks and derive revenue from selling electricity to the power grid; |
|
|
|
|
|
| • | “watt” or “W” are to the measurement of total electrical power, where “kilowatt” or “kW” means one thousand watts, “megawatts” or “MW” means one million watts and “gigawatt” or “GW” means one billion watts; |
|
|
|
|
|
| • | “kWh” are to kilowatt hour(s); |
|
|
|
|
|
| • | “MWh” are to megawatt hour(s); |
|
|
|
|
|
| • | “O&M” are to operations and maintenance services provided for commercially operating solar parks; |
|
|
|
|
|
| • | “PPA” are to power purchase agreements; |
|
|
|
|
|
| • | “PV” are to photovoltaic; |
|
|
|
|
|
| • | “RON” and “Romania Leu” are to the legal currency of Romania; |
|
|
|
|
|
| • | “TW” are to terawatt |
|
|
|
|
|
| • | “US$” and “U.S. dollar” are to the legal currency of the United States of America; |
|
|
|
|
|
| • | “€” and “Euro” are to the legal currency of the European Union; |
|
|
|
|
|
| • | “Residential solar” = <10 kW; |
|
|
|
|
|
| • | “Commercial solar” = <250 kW; |
|
|
|
|
|
| • | Industrial = <1000 kW; and |
|
|
|
|
|
| • | Utility-scale = >1000 kW, ground-mounted; and |
|
|
|
|
|
| • | “¥” and “Japanese Yen” are to the legal currency of Japan. |
We calculate the size of the PV market based on the volume of PV modules delivered to installation sites, including modules awaiting installation or connection to the power grid. PV panels generate direct current (“DC”) electricity, while electricity systems are based on alternating current (“AC”) electricity. The data presented in DC power numbers are, on average, greater by approximately 15% than the equivalent AC power numbers. All historical and forecast data are presented in DC power numbers.
Our operating results are reported in U.S. dollars. Our current projects revenue and expenses are generated in other currencies, including the Euro and the Romanian LEI. This may change in the future if we elect to alter the mix of our portfolio within our existing markets or elect to expand into new markets. In addition, our investments (including intercompany loans) in renewable energy facilities in foreign countries are exposed to foreign currency fluctuations. As a result, we expect our revenues and expenses will be exposed to foreign exchange fluctuations in local currencies where our renewable energy facilities are located. To the extent we do not hedge these exposures, fluctuations in foreign exchange rates could negatively impact our profitability and financial position.
| 4 |
| Table of Contents |
Overview
Our principal executive offices are located in the United States at One World Trade Center, Suite 8500, New York, NY 10007. Our telephone number is (212) 220-7434. Our European operations center is located in Ireland at Suite 11, Plaza 212, Blanchardstown Corporate Park 2, Dublin 15, D15 PK64, Ireland. Our website address is www.alternusenergy.com and our email is contact@alternusenergy.com. Information contained in, and that can be accessed through, our website is not incorporated into and does not form a part of this Annual Report on Form 10-K. Investor inquiries should be directed to us at the telephone number and email outlined above.
Alternus Energy was incorporated in the State of Colorado on January 1, 2000, and then reorganized as a Nevada corporation on November 8, 2006 under the name Asset Realization Inc. On September 11, 2008 the Company changed its name to World Assurance Group, Inc. On April 24, 2015, the Company changed its name to Power Clouds Inc. On November 29, 2018, the Company changed its name to Alternus Energy Inc. and its stock ticker symbol changed from PWCL to ALTN.
Alternus Energy is a U.S. holding company with no stand-alone operations and no material assets other than its ownership interest in its subsidiaries. All of the Company’s operations are conducted through, and its income derived from, its various subsidiaries, which are organized and operated according to the laws of their jurisdiction of incorporation in various countries around the world, and consolidated by the Company.
ALTN Subsidiaries and Principal Activities
AE Europe B.V. (Formerly named Power Clouds Europe B.V.)
In August of 2016, the Company incorporated a new wholly owned subsidiary in the Netherlands, Power Clouds Europe B.V. (now named AE Europe B.V.) AE Europe B.V. was incorporated to ultimately hold the Company’s European operating companies and sub-holding companies as appropriate.
PC-Italia-01 S.R.L. (Formerly named Power Clouds Wind Italia S.R.L.)
In June of 2015, PWCL incorporated a company in Italy, PC-Italia-01 S.R.L. (formerly named Power Clouds Wind Italia S.R.L.). PC-Italia-01 S.R.L. was incorporated to acquire Italian special purpose vehicles (“SPV”), power plants and/or other assets located in Italy. During the quarter ended March 31, 2017, PC-Italia-01 completed the acquisition of Tre Vallie Energia S.r.l in Italy which operates a 1MW PV solar park. During the quarter ended September 2018, the Company sold the asset.
PC-Italia-02 S.p.A. (Formerly PC-Italia-02 S.R.L.)
In August of 2016, the Company incorporated a new company in Italy, PC-Italia-02 S.R.L. (now organized as a S.p.A.) as a wholly owned subsidiary of AE Europe B.V. PC-Italia-02 S.p.A. was incorporated to acquire Italian SPVs, power plants and/or other assets located in Italy. During the quarter ended March 31, 2017, PC-Italia-02 completed the acquisition of the Sant’Angelo Energia S.r.l. in Italy which operates a 702kW PV solar park. Subsequently, in April of 2019, PC-Italia-02 S.R.L. acquired four additional SPVs in Italy, CIC Rooftop 2 S.r.l., CIC RT Treviso S.r.l., SPV White One S.r.l. and CTS Power 2 S.r.l.
PCG_HoldCo GmbH & PCG_GP UG
In June of 2018, the Company acquired 100% of the share capital of two companies in Germany which were renamed as PCG_HoldCo GmbH and PCG_GP UG immediately thereafter. These two companies were acquired in order to acquire German SPVs, PV solar parks and/or other assets located in Germany. During the year ended December 31, 2018, PCG_HoldCo completed the acquisitions of four SPVs in Germany, PSM 20, GRK 17.2, GRT 1.1 and PSM 40. In December of 2018, PCG_HoldCo acquired 100% of the share capital of another company in Germany which was renamed as ALTN HoldCo UG.
| 5 |
| Table of Contents |
Alternus Energy International Limited
In March of 2019, the Company incorporated a new wholly owned subsidiary in Ireland, Alternus Energy International Limited. Alternus Energy International Limited was incorporated to establish our European operations center.
AEN 01 B.V.
In June of 2019, the Company incorporated a new wholly owned subsidiary in the Netherlands, AEN 01 B.V. AEN 01 B.V. was incorporated to acquire Netherlands special purpose vehicles (SPVs), project rights and other solar energy assets in the Netherlands. During the quarter ended December 31, 2019, AEN 01 B.V. completed the acquisition of Zonnepark Rilland B.V. in the Netherlands, which operates a 11.75MW PV solar park.
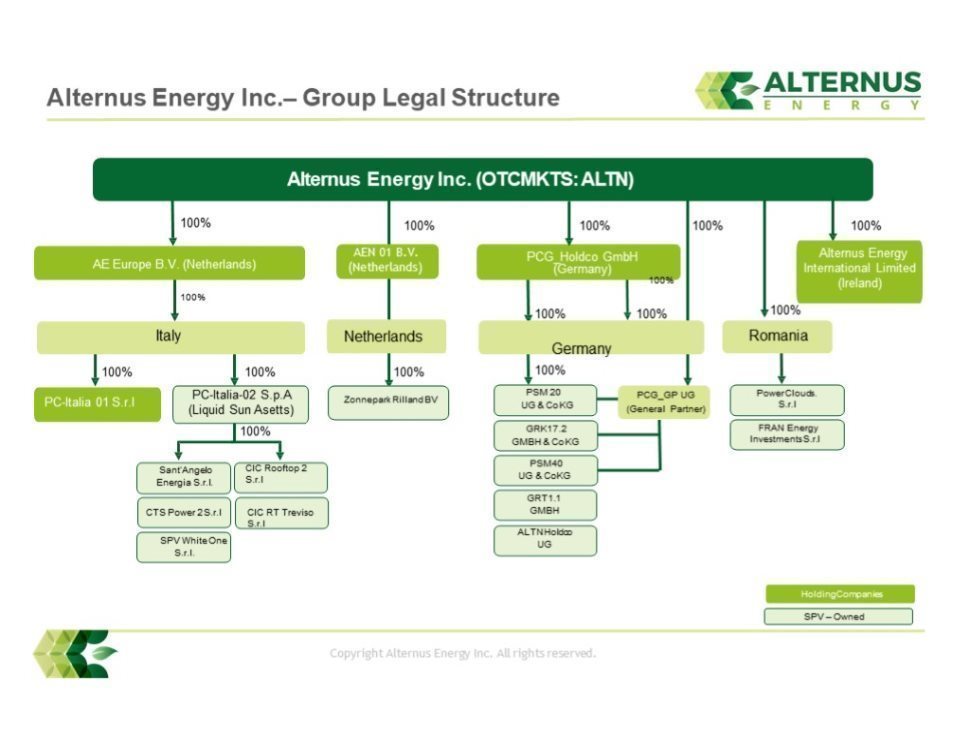
In summary, Alternus Energy is a holding company that operates through the following twenty operating subsidiaries as of the date of this Annual Report on Form 10-K:
| Subsidiary | Principal Activity | Date Acquired / Established | ALTN Ownership | Country of Operation |
| Power Clouds SRL | SPV | March 31, 2015 | 99.5%* | Romania |
| F.R.A.N. Energy Investment SRL | SPV | March 31, 2015 | 99.5%* | Romania |
| AE Europe B.V. | Holding Company | August 2016 | 100% | Netherlands |
| PC-Italia-01 S.R.L. | Sub-Holding | June 2015 | 100% (via PCE) | Italy |
| PC-Italia-02 S.p.A. | SPV | August 2016 | 100% (via PCE) | Italy |
| Sant’Angelo Energia S.r.l. | SPV | March 30, 2017 | 100% (via PC_Italia_02) | Italy |
| PCG_HoldCo GmbH | Holding Company | July 6, 2018 | 100% | Germany |
| PCG_GP UG | General Partner (Management Company) | August 30, 2018 | 100% | Germany |
| PSM 20 UG | SPV | November 14, 2018 | 100% (via PCG_HoldCo) | Germany |
| PSM 40 UG | SPV | December 28, 2018 | 100% (via PCG_HoldCo) | Germany |
| GRK 17.2 GmbH & Co KG | SPV | November 17, 2018 | 100% (via PCG_HoldCo) | Germany |
| GRT 1.1 GmbH & Co KG | SPV | December 21, 2018 | 100% (via PCG_HoldCo) | Germany |
| ALTN HoldCo UG | SPV | December 14, 2018 | 100% (via PCG HoldCo) | Germany |
| Alternus Energy International Ltd. | European Operational Centre | March 1, 2019 | 100% | Ireland |
| CIC Rooftop 2 S.r.l. | SPV | April 23, 2019 | 100% (via PC-Italia-02) | Italy |
| CIC RT Treviso S.r.l. | SPV | April 23, 2019 | 100% (via PC-Italia-02) | Italy |
| SPV White One S.r.l. | SPV | April 23, 2019 | 100% (via PC-Italia-02) | Italy |
| CTS Power 2 S.r.l. | SPV | April 23, 2019 | 100% (via PC-Italia-02) | Italy |
| AEN 01 B.V. | SPV | June 13, 2019 | 100% | Netherlands |
| Zonnepark Rilland B.V. | SPV | December 20, 2019 | 100% | Netherlands |
| 6 |
| Table of Contents |
The following chart illustrates the principal entities as described above in our corporate structure as of December 31, 2019:
| 7 |
| Table of Contents |
Our Business Strategy
We aim to become a leading global IPP in green energy, by owning and operating a global network of distributed and connected green energy power plants, in countries where the combination of economic, environmental and political policies is optimized and supportive for the long-term, ever-growing need for clean renewable energy. Diversity across multiple parks in multiple jurisdictions provides highly diversified income streams backed by long term, government FiTs and PPAs.
To achieve this goal, we intend to pursue the following strategies:
|
| • | Continue our proven growth strategy targeted on acquiring independent solar PV projects either newly constructed or already operational in secondary markets in order to build a diversified portfolio across multiple geographies. Our niche focus on small to midsize solar PV parks and working with local developers allows us to acquire parks at prices of up to 25% below market; |
|
| ○ | Our focus on individual or small groups of PV solar parks precludes access by investment funds as the sellers have a very limited market; |
|
| ○ | Exclusive Developer Agreements: contracts with these partners results in little competition in acquisition pricing, leading to below market acquisition prices; these Developer Agreements provide us with the exclusive right to acquire a pipeline of projects from a third-party developer in a specific country (ie. Germany), the consideration for which is a fixed margin to be paid to the partner. We recently entered into two additional similar contracts, again providing us with the right to acquire projects from developers, exclusively, at a discount. These agreements result in decreased construction / acquisition costs due to volume discounts from our developer partner as they benefit from economies of scale, which leads to below market acquisition prices. We also expect to enter into similar agreements in the future, as we will look to grow the Company by providing the financing required for development and construction of assets. |
|
| ○ | We work directly with specialist development partners in each country; |
|
| • | Expand our global IPP portfolio in regions with attractive returns on investment and increase our stable recurring revenue and cash flow; |
|
|
|
|
|
| • | Optimize our financing sources to support long-term growth and profitability in a cost-efficient manner; and |
We do not operate our business on a quarter-by-quarter basis, but rather, with long-term shareholder value creation as a priority. We aim to maximize return for our shareholders by acquiring positive cash flow assets with long-term income streams at the lowest possible risk and we will continue to operate with this priority as we continue to invest in our infrastructure and additional solar PV parks to increase our installed power and long term revenue streams.
Our goal is to grow our asset base and within our operations provide sufficient liquidity for recurring growth capital expenditures and general purposes.
Our Portfolio
Our current portfolio consists of solar PV parks located in Romania, Italy, Germany and the Netherlands with a total owned capacity of 40.8MW as of December 31, 2019. The German and Italian projects enjoy 20-year government counter-party FiT contracts at fixed sales prices that provide long-term predictable positive cash flows at average 85% gross margins. The Romanian parks operate under a “green certificate” government incentive scheme over a minimum of 15 years whereby the projects earn a certain number of GCs for the energy produced that are then subsequently sold to the Romanian energy market. The Netherlands project has a fifteen year contracted revenue stream as part of a government program.
The following table lists the solar PV parks that comprise our portfolio as of December 31, 2019:
| Country | MWs Owned, (Installed and Operational) | MWs Owned (Not Yet Operational) |
Total Owned |
| Romania | 6.1 MW | — | 6.1MW |
| Italy | 7.9 MW | -- | 7.9MW |
| Germany | 1.4 MW | 13.6MW | 15.0MW |
| Netherlands | 11.8 MW | -- | 11.8MW |
| Total | 27.2 MW | 13.6MW | 40.8MW |
| 8 |
| Table of Contents |
Changes within Our Portfolio
The following table provides an overview of the changes in our MWs Owned (Installed and Operational) within our portfolio from December 31, 2018 through December 31, 2019:
|
Description |
| Facility Type |
| Nameplate Capacity (MW) |
|
| Number of Sites |
| Weighted Average Remaining Duration of PPA (Years |
| ||||
|
|
|
|
| |||||||||||
| Total Portfolio as of December 31, 2018 |
|
|
|
| 9.0 |
|
|
| 5.0 |
|
|
| 13.0 |
|
| Acquisition of Italy Parks |
| Solar |
|
| 5.0 |
|
|
| 4.0 |
|
|
| 13.0 |
|
| Transfer from Construction to Completion in Germany |
| Solar |
|
| 1.4 |
|
|
| 3.0 |
|
|
| 20.0 |
|
| Acquisition of Netherlands Park |
| Solar |
|
| 11.8 |
|
|
| 1.0 |
|
|
| 15.0 |
|
| Total Portfolio as of December 31, 2019 |
|
|
|
| 27.2 |
|
|
| 13.0 |
|
|
| 15.0 |
|
_______
| (1) | Represents weighted-average remaining term of PPAs and calculated as of December 31, 2019 and December 31, 2018, respectively. |
Our Competitive Strengths
We believe the following competitive strengths have contributed and will continue to contribute to our success:
|
| • | We are an IPP with comfort in operating across all aspects of the solar PV value chain from development through to ownership – as opposed to just buying operating parks where the high levels of competition from investment funds tends to be. In this way we have opportunities to acquire projects earlier in the process and so lock out investment fund competitors; |
|
|
|
|
|
| • | We provide a minimum committed offtake for local developers which makes us a more attractive partner as they have a single trusted customer that allows developers to plan effectively and grow faster. As a result, we have been able to sign developer contracts that provide us with a right of first refusal for all projects developed by our partners and therefore lock out other market operators for these projects (“Developer Agreements”); |
|
|
|
|
|
| • | Given the above, we also benefit from Developer Agreements through decreased construction / acquisition costs due to volume discounts from our developer partner as they benefit from economies of scale. With this approach we have a proven ability to acquire parks at prices of up to 25% below the prices that investment funds will pay for the same assets. This also provides an immediate equity cushion in the projects we acquire as we will always have the ability to sell the projects at higher costs than we acquired them; |
|
|
|
|
|
| • | Our proven track record of identifying and entering solar PV markets, on-the-ground capabilities and global platform give us key competitive advantages in developing and operating solar parks globally; |
|
|
|
|
|
| • | Our existing pipeline of secured solar PV parks provides us with clear and actionable opportunities to grow power generation and earnings as these are required; |
|
|
|
|
|
| • | Our comprehensive project development capabilities, in collaboration with local teams on the ground, allow us to consistently deliver high quality solar parks at competitive costs; |
|
|
|
|
|
| • | We are technology and supplier agnostic and as such we have the flexibility to choose from a broad range of leading manufacturers, O&M experts, top tier suppliers and EPC vendors globally and continue to benefit from falling component and service costs; |
|
|
|
|
|
| • | As a public company, management believes it will have access to a variety of flexible financing sources which are not available to other market participants which allows us to structure transactions more flexibly than our competitors, even though some competitors may have a lower cost of capital than we can currently achieve; |
|
|
|
|
|
| • | We are led by a highly experienced management team supported by strong, localized execution capabilities across all key functions and locations. |
| 9 |
| Table of Contents |
Our Competition
Power generation is a capital-intensive business with numerous industry participants. We compete to acquire solar PV parks and project rights with other renewable energy developers, IPPs and financial investors based on cost of capital, development expertise, pipeline, price, operations and management expertise, global footprint, brand reputation and the ability to monetize green attributes (such as green certificates (“GCs”) and tax incentives) of renewable power.
We face specific competition in two distinct areas, projects under development and operational projects from competitors. Each segment has different competitors due to the nature of market participants as outlined below;
| Competitor | Competitor Weakness | Competitor Strength | How We Compete | ||
| Pension/ Specialist Investment Funds | • | Tend to focus exclusively on acquiring operational parks (even if just completed) | • | Lower cost of equity capital | We compete by entering the construction process earlier with niche partners, thereby locking them out of projects we acquire from small developer partners who cannot access these competitors due to their size. |
| • | Will not take any construction or development risk | • | Large funds available to deploy | ||
|
| • | Only acquire large scale projects due to minimum transaction size requirement | • | Will also commission projects to be constructed for them – but large ones | |
|
|
|
|
|
|
|
| Other IPP’s | • | May not take any construction or development risk | • | Larger players will have lower cost of equity capital | We provide guaranteed minimum offtake of developed projects under exclusive right of first refusal contracts that locks out the competitors. |
|
| • | Smaller IPP’s will have similar cost of capital as ALTN | • | Will commission projects to be constructed for them and will also work with portfolios of smaller parks | Our established agent and trusted partner network sources projects before market, and we have first mover advantage. |
|
| • | Potential geographic focus so not present in all markets | • | Operational history and track record | As we continue to grow, we mitigate any operational history advantages of the competitors. |
Notwithstanding the above, it is management’s belief that the solar PV market is in high growth globally with many participants constantly arriving. There is also an increasing demand for projects from both government and corporates. In this environment although there are many players and participants, there is currently room for many participants and there does not appear to be significant industry consolidation and it remains a very fragmented market.
With our proven niche focus on partner and project acquisition we feel we currently compete effectively in the markets we address. In addition, we believe that given our current growth strategy and as a public reporting company we will have opportunities to consolidate certain market participants and segments in certain geographies over time that may not be available to other participants. If successful, this would further enhance our market position and sustained competitiveness in the medium to long term.
Nevertheless, we expect to face increased competition in all aspects of our business, target markets and industry segments, financing options, and partner availability as markets mature as countries reach their targeted renewable energy generation.
| 10 |
| Table of Contents |
Our Challenges
Our ability to successfully execute our strategies is subject to a number of risks and uncertainties.
See “Risk Factors” and “Special Note Regarding Forward-Looking Statements” for a discussion of these and other risks and uncertainties associated with our business.
Seasonality and Resource Availability
The amount of electricity produced, and revenues generated by, our solar generation facilities is dependent in part on the amount of sunlight, or irradiation, where the assets are located. As shorter daylight hours in winter months result in less irradiation, the electricity generated by these facilities will vary depending on the season. Irradiation can also be variable at a particular location from period to period due to weather or other meteorological patterns, which can affect operating results. As the majority of our solar power plants are located in the Northern Hemisphere (Europe) we expect our current solar portfolio’s power generation to be at its lowest during the first and fourth quarters of each year. Therefore, we expect our first and fourth quarter solar revenue to be lower than in other quarters. As a result, on average, each solar park generates approximately 15% of its annual revenues in Q1 every year, 35% in each of Q2 and Q3, and the remaining 15% in Q4. Our costs are relatively flat over a year, and so we will always report lower profits in Q1 and Q4 as compared to the middle of the year.
Environmental and Government Regulation
Environmental Matters
We are subject to environmental laws and regulations in the jurisdictions in which we own and operate renewable energy facilities. These laws and regulations generally require that governmental permits and approvals be obtained and maintained both before construction and during operation of these renewable energy facilities. We incur costs in the ordinary course of business to comply with these laws, regulations and permit requirements. We do not anticipate material capital expenditures for environmental compliance for our renewable energy facilities in the next several years. While we do not expect that the costs of compliance would generally have a material impact on our business, financial condition or results of operations, it is possible that as the size of our portfolio grows we may become subject to new or modified regulatory regimes that may impose unanticipated requirements on our business as a whole that were not anticipated with respect to any individual renewable energy facility. Additionally, environmental laws and regulations frequently change and often become more stringent, or subject to more stringent interpretation or enforcement, and therefore future changes could require us to incur materially higher costs which could have a material negative impact on our financial performance or results of operations.
Regulatory Matters, Government Legislation and Incentives
In Romania, Italy, Germany and the Netherlands, the Company is generally subject to the regulations of the relevant energy regulatory agencies applicable to all producers of electricity under the relevant feed-in tariff or other governmental incentive programs (collectively “FiT”) (including the FiT rates); however, it is not subject to regulation as a traditional public utility (i.e., regulation of our financial organization and rates other than FiT rates).
As the size of our portfolio grows, or as applicable rules and regulations evolve, we may become subject to new or modified regulatory regimes that may impose unanticipated requirements on our business as a whole that were not anticipated with respect to any individual renewable energy facility. Any local, state, federal or international regulations could place significant restrictions on our ability to operate our business and execute our business plan by prohibiting or otherwise restricting the sale of electricity by us. If we were deemed to be subject to the same state, federal or foreign regulatory authorities as traditional utility companies, or if new regulatory bodies were established to oversee the renewable energy industry in Europe or in international markets, our operating costs could materially increase, adversely affecting our results of operations.
Each of the countries in which we operate has established various incentives and financial mechanisms to reduce the cost of renewable energy and to accelerate the adoption of PV solar and other renewable energies. These incentives include tax credits, cash grants, favorable tax treatment and depreciation, rebates, GCs, net energy metering programs, FiTs and other incentives. These incentives help catalyze private sector investments in renewable energy and efficiency measures. Changes in the government incentives in each of these jurisdictions could have a material impact on our financial performance.
| 11 |
| Table of Contents |
Europe
In December 2018, the new revised Renewables Energy Directive (2018/2001) entered into force, establishing a new binding renewable energy target for the EU for 2030 of at least 32%, with a clause for a possible upwards revision by 2023. To put that into perspective, energy from renewable sources made up approximately 17.5% at the end of 2017. This revised directive puts a further impetus on EU member states to ensure they deliver on their individual renewable energy targets. Each country has their own framework in place to promote renewable energy. These mechanisms vary from country to country. We have briefly summarized the historical and current position for solar PV for each country we currently operate in below.
Romania
Romanian regulation on support for energy produced from renewable sources is set out in the Law 220/2008. This law, under modifications 139/2010 and 184/2018 sets out a national target of 24% of gross energy produced to come from renewable energy sources by the year 2020. It also sets out national targets regarding the percentage of electricity produced from renewable sources of energy in the final gross consumption of electricity for years 2010, 2015 and 2020 which is 33%, 35% and 38%, respectively. Under the law, the National Energy Regulatory Authority (ANRE) is the body which qualifies the renewable energy installations that benefit from the support scheme, in the terms of the Regulations for qualifying producers of electricity from renewable sources, so as to apply the green certificate promotion system and it elaborates the regulatory guidelines for the monitoring of production costs/revenues of producers from renewable sources which benefit from the promotion scheme by means of GCs.
All renewable energy installations connected up to December 31, 2016 are entitled to receive GCs for a period of 15 years after the ANRE grant the accreditation for the renewable energy installation. All GCs are valid up to December 31, 2030 and can be traded until this date even if a period of 15 years has already been reached. The value of each GC as set out in Law 220/2008 in euro denomination is a minimum of 27 euros to a maximum of 55 euros. Each year these values are indexed by ANRE according to the average inflation parameter in the month of December of the previous year per Eurostat communications and the value in LEI is calculated at a medium exchange rate set by the National Bank of Romania. Currently the minimum rate is set at 136.82 LEI. Operators can also receive additional income for the energy produced by their renewable energy installation as described below.
The solar PV parks that were connected up to December 31, 2013 received six GCs for each MWh delivered to the grid. From these six GCs, only four GCs per MWh can currently be traded while the other two are postponed for trading until December 31, 2020. The postponed GCs are to be reinstated starting from January 2021 in equal tranches until December 2030. Solar parks that were connected from January 1, 2014 up to December 31, 2016 received only three GCs per MWh. When the legislation was introduced the government had set a quota for solar PV to be installed. They set a timeline of six years for the GCs scheme, however the quota for solar PV was actually achieved in two years instead of six as it was not controlled by the government on a time or operator basis. The budget therefore ran out before the end of the programme (December 31, 2016) which gave rise to the changes as described above.
An operator can sell the energy and GCs produced in several ways:
|
| 1. | Sell energy though OPCOM, the exchange market for energy (SPOT market), based on daily forecasting. Regarding GC sales, there are two sessions every month where all producers upload a maximum of 10,000 GCs they have for sale. The market is anonymous and there is no visibility between the seller and the buyer. Additionally, there is another anonymous market where you can stay for one month and buyers are not obliged to buy only during the two sessions organized per month; |
|
|
|
|
|
| 2. | Sign a PPA and sell the GCs to a trader or grid operator. This can only be carried out for plants up to 3 MW in size per licensed producer. The price the buyer pays for GCs cannot be lower than €29/GC; or |
|
|
|
|
|
| 3. | Have contracts in place directly with a buyer for the GC and also sell energy on the SPOT market through OPCOM provided the park is up to 3 MW in size. |
| 12 |
| Table of Contents |
Currently there is no support scheme in place for commercial scale renewables in Romania as the country met its 2020 targets for renewable energy early in 2017. Under Law 184/2018 there is a prosumer support scheme for solar of up to 27kW.
Italy
The Gestore dei Servizi Energetici - GSE S.p.A. plays a central role in the promotion, support and development of renewable energy sources in Italy. GSE’s sole shareholder is the Italian Ministry of Economy and Finance which, in consultation with the Ministry of Economic Development, provides guidance on GSE’s activities. GSE promotes sustainable development by granting economic support for electricity generation from renewable energy sources and by organizing communication campaigns to raise awareness of environmentally-sustainable energy use.
Italian regulation on support for energy produced from solar PV was set out in the “Conto Energia” under legislative decree 387 in 2003. From 2003 to 2012, there were four more iterations of this law which stipulated the conditions under which solar PV could be supported via a FiT subsidy. Under the original regulation a FiT was guaranteed for 20 years, which was a flat nominal fee depending on a number of variables. However the targets set out in the legislation were met earlier than expected and had to be revised as described below under law decree No. 91. In addition to the FiT, operators can also receive income for the energy produced by their park from energy sold on the spot market or via a PPA. “Conto Energia” was finalized in July 2013 for new installations. Italy was one of a handful of countries in the EU to meet its 2020 targets for renewable energy use early in 2017.
Original FiT Support
|
| • | Attractive incentive: flat nominal FiT for 20 years PLUS sale of electricity at the pool price; |
|
| • | Provision of priority access to power grid for renewable energy projects and guaranteed off-take of power; |
|
| • | Scheme funded by the end consumers through a surcharge to the electricity bill. |
The law decree No. 91 (converted into ordinary law August 11, 2014) introduced, inter alia, measures aimed at reducing end-users’ electricity bills in the short to medium term by spreading incentives over a longer period due to rapid build-up of renewable capacity. Three options (A,B,C) to the FiT were provided as follows:
|
| A. | Reduction of 19% with four-year extension (over the original 20 years); |
|
| B. | Reduction for the first five years of 14.5% followed by six years of progressive increase of 4.1% followed by five years of FiT 14.5% higher than the original FiT (the increase equal to the opposite of the decrease of the first five years); |
|
| C. | Reduction of 8% over the remainder of the FiT period. |
A new incentive decree known as Fer Decree 2019 was introduced in Italy in July 2019. The Decree sets out procedures and requirements for accessing financial supports for renewable energy sources. Solar PV will be supported under this decree in a number of ways through the mechanism of registers and auctions for access to incentives through a tendering process managed by the GSE. It also sets out regulation for PPA’s.
Germany
The responsibility for the energy transition and all aspects related to it, including climate change, in Germany is concentrated at the Federal Ministry for Economic Affairs and Energy (BMWi). The main national regulatory authority is the Federal Network Agency for Electricity, Gas, Telecommunications, Post and Railway (Bundesnetzagentur - BNetzA) under the authority of the BMWi.
German regulation on support for energy produced from renewable sources is set out in the Renewable Energy Sources Act 2017 (EEG 2017) set out by the BMWi. The EEG 2017 provides a stable regulatory framework and the basis for a new growth phase in Germany. It sets out the structure for competition-based funding for renewable energy in Germany. It stipulates an annual target of 1.9GW of solar PV to be added to the grid under the new legislation introduced in December 2018 (Energiesammelgesetz). It sets out an overall target of 52GW for solar PV installations which are guaranteed a FiT, at which point the FiT support is capped.
| 13 |
| Table of Contents |
Auction Process under EEG 2017
|
| • | The auction process provides up to 600MW of solar power advertised each year for auction. |
|
| • | Under the new legislation (Energiesammelgesetz) introduced in December 2018, in 2019 there will be two tender rounds of 500MW each for PV systems exceeding 750kW. In 2020, the law foresees four additional tenders with a cumulative capacity of 1.4GW; and in 2021, another four dates are scheduled with an aggregate capacity of 1.6GW. |
|
| • | All capacity constructed under these specific tenders will not be added to Germany’s 52GW cap of PV installations. Once this cap is reached, the federal government plans to discontinue FiT subsidies for the solar industry. Unless extended, the cap will likely be achieved by3Q of 2020. This will potentially impact our solar projects if they have not achieved commercial operation by that date. |
FiT Support and Eligibility
|
| • | Installations of less than 750kW are exempted from the auction scheme and are supported by a FiT scheme under EEG 2017. |
|
| • | This includes all new small and medium-sized commercial and industrial rooftop or ground mounted PV systems. |
|
| • | The FiT contract spans 20 years and once a contract is set, that FiT is received for the duration of the contract subject to Section 49 EEG 2017, as explained below. |
|
| • | Additional energy sales revenue is not applicable under the FiT Contract. |
|
| • | Payments are made on a monthly basis by the grid system operator and direct marketing company as supported under EEG 2017 for all electricity fed into the grid by the installation. |
Netherlands
The Stimulation of Sustainable Energy Production, otherwise known as the SDE+ is the scheme that supports renewable energy production in the Netherlands. It is managed by the Netherlands Enterprise Agency Rijksdienst voor Ondernemend Nederland (RVO) and supported by the Ministry of Economic Affairs and Climate Policy. It provides an operating grant subsidy for renewable energy production through a tender based system. The duration of the subsidy once granted, under SDE+ is up to a maximum of 15 years. The overall target of the SDE+ is to have 16% renewable energy production by 2023. To put this into perspective the total share of renewables was 7.4% by the end of 2018 in the Netherlands up from 6.6% the previous year. The Netherlands added approximately 2.5GW of solar PV in 2019. The largest market segment was rooftop solar with approximately 40% in the commercial & industrial segment and an equal share in the residential segment with utility scale segment including ground mounted and floating solar responsible for approximately 20% of the market.
The subsidies work by compensating the difference between the wholesale price of electricity from fossil fuel sources and the price of electricity from renewable sources via a Feed-in-Tariff. The amount received depends on energy price trends. If the energy price goes up, an SDE+ contribution applies, but the energy purchaser will pay more. If, on the other hand, the energy price falls, a higher SDE+ contribution applies, but less will be received from the energy purchaser.
|
| · | The SDE+ Scheme uses a tender system in which different renewable technologies compete with each other for a subsidy award. |
|
| · | The RVO pay the granted SDE+ subsidy (Feed-in-Tariff) every month based on an actual production and this amount is adjusted at the end of each calendar year based on total production output and energy market rates. |
|
| · | Currently the subsidy is made available in 2 stages throughout the year usually in Spring and Autumn. |
|
| · | In 2019 under the SDE+ subsidies were made available under 2 main categories of Solar PV - 1. A capacity of ≥ 15kWp and < 1MWp and a capacity of ≥ 1MWp (with a large scale connection to the grid) |
|
| · | For parks of 500KWp+ or smaller installations when combined add up to 500KWp, a feasibility study must be provided through the application process, and if the solar installation is to be built in a field or to a facade or on water (floating system) an environmental permit must be acquired prior to applying. |
|
| · | Park operation must start at the latest within 1.5 years for installations < 1MWp and up to 3 years for building related installations ≥ 1MWp and up to 4 years for non-building related systems after the SDE+ has been granted |
|
| · | The SDE+ scheme allows for the possibility of banking meaning that in case of less energy production than the estimated annual production, the difference can be used in later years (underproduction). Producers can also carry over any excess output to a following year (overproduction). This can be used if production is lower than estimated in a later year. |
|
| · | The scheme is financed through a levy on the use of electricity and gas. |
| 14 |
| Table of Contents |
Revenues and Customers
During the year ended December 31, 2019, two customers represented 56% and 30% of revenues and 37% and 9% of accounts receivable balance. During the year ended December 31, 2018, two different customers represented 29% and 26% of revenues and 34% and 1% of accounts receivable balance.
Employees
As of December 31, 2019, we had approximately six employees, of whom two were located in the United States and four were located outside the United States, and approximately nine contractors, all located in Europe, performing various services, business development and management functions. None of our employees or consultants are presently covered by any collective bargaining agreement. We believe our relationships with our employees and contractors are good.
Available Information
We make available free of charge through our website (www.alternusenergy.com) the reports we file with the SEC, including our annual reports on Form 10-K, quarterly reports on Form 10-Q, current reports on Form 8-K and amendments to those reports filed or furnished pursuant to Section 13(a) or 15(d) of the Exchange Act, as soon as reasonably practicable after we electronically file such material with, or furnish it to, the SEC. The SEC maintains an internet site containing these reports and proxy and information statements at www.sec.gov.
The following corporate governance documents are posted on our website at www.alternusenergy.com:
|
| · | Foreign Corrupt Practices Policy; |
|
| · | Insider Trading Policy; |
|
| · | Audit Committee Charter; |
|
| · | Code of Business Conduct and Ethics – All Employees; |
|
| · | Code of Ethics – Senior & Accounting. |
If you would like a printed copy of any of these corporate governance documents, please send your request to Alternus Energy Inc., One World Trade Center, Suite 8500, New York, NY 10007.
The information on our website is not incorporated by reference into this Annual Report on Form 10-K and does not constitute part of this Annual Report on Form 10-K.
Risks Relating to Our Business
The following risk factors discuss the principal risks we face. Any of these risk factors could have a significant or material adverse effect on our business, results of operations, financial condition or liquidity. They could also cause significant fluctuations and volatility in the trading price of our securities. Readers should not consider any descriptions of these factors to be a complete set of all potential risks and uncertainties that could affect us. These factors should be considered carefully together with the other information contained in this Annual Report on Form 10-K and the other reports and materials filed by us with the SEC. Furthermore, many of these risks are interrelated, and the occurrence of certain of them may in turn cause the emergence or exacerbate the effect of others. Such a combination could materially increase the severity of the impact of these risks on our business, results of operations, financial condition and liquidity.
| 15 |
| Table of Contents |
Risks Related to Our Business and Industry
We are a holding company and rely on distributions and other payments, advances and transfers of funds from our subsidiaries to meet our obligations.
We have no direct operations and derive all of our cash flow from our subsidiaries. Because we conduct our operations through our subsidiaries, we depend on those entities for payments or distributions to meet our obligations. The deterioration of the earnings from, or other available assets of, our subsidiaries for any reason could limit or impair their ability to pay us.
The reduction, modification or elimination of government subsidies and economic incentives may reduce the economic benefits of our existing solar parks and our opportunities to develop or acquire suitable new solar parks.
Government subsidies and incentives have primarily been in the form of FiT price support schemes, tax credits, net metering and other incentives to end users, distributors, system integrators and manufacturers of solar energy products. The availability and size of such subsidies and incentives depend, to a large extent, on political and policy developments relating to environmental concerns in a given country. Changes in policies could lead to a significant reduction in or a discontinuation of the support for renewable energies in such country. Government subsidies and incentives for solar energy were recently reduced in some countries and may be further reduced or eliminated in the future. For example, in Germany, there is general consensus that the FiT scheme under the EEG 2017 will be discontinued in 2020 as they reach their target of 52GW for the subsidy support scheme and in Italy, the FiT scheme under ‘‘Conto Energia’’ was restructured in 2014 due to a rapid build-up of renewable capacity. Changes also occurred in Romania when, similar to what happened in Italy, a rapid build-up of solar PV projects forced the government to restructure their GC incentive scheme.
While some of the reductions in government subsidies and economic incentives apply only to future solar parks, they could diminish the availability of our opportunities to continue to develop or acquire suitable newly developed solar parks. Some of these reductions may apply retroactively to existing solar parks, which could significantly reduce the economic benefits we receive from the existing solar parks. Moreover, some of the solar program subsidies and incentives expire or decline over time, are limited in total funding, require renewal from regulatory authorities or require us to meet certain investment or performance criteria. A significant reduction in the scope or discontinuation of government incentive programs in our target markets and globally could have a material adverse effect on our business, financial condition, results of operations and prospects.
Decreases in the spot market price of electricity could harm our revenue and reduce the competitiveness of solar parks in grid-parity markets.
The electricity prices for solar parks are either fixed through long-term PPAs or are variable and determined by the spot market. Although the price of electricity as of December 31, 2019 was fixed through PPAs and FiT for 100% of our owned capacity, in countries where the price of electricity is sufficiently high that solar parks can be profitably developed without the need for government price supports, a condition known as “grid-parity”, solar parks may choose not to enter into PPAs and sell based on the spot market price of electricity. Revenue for our solar parks in Italy and Romania will also fluctuate with the electricity spot market after the expiration of any PPA, unless renewed. Even then the new PPA may be at the lower prevailing energy prices at the time. The market price of electricity can be subject to significant fluctuations and can be affected by drivers such as the cost of traditional fossil fuels used for electricity generation, the discovery of new fossil fuel sources, additional electricity generation capacity, additional electric transmission and distribution lines, technological or regulatory changes, increased energy conservation or for a number of other reasons.
Decreases in the spot price of electricity in such countries would render PV energy less competitive compared to other forms of electricity. For example, PV may no longer be in grid parity if the price of fossil fuels used for electricity generation decreased sufficiently. In this situation, our solar parks may no longer be profitable in that market and we may not be able to recoup the time and effort invested in applying for permits or developing solar parks. A reduction in electricity prices would render our solar parks less economically attractive. If the retail price of energy were to decrease due to any of these reasons, or others, our business and results of operations may be materially and adversely affected.
| 16 |
| Table of Contents |
The seasonality of our operations may affect our liquidity and will affect our quarterly results.
We will need to maintain sufficient financial liquidity to absorb the impact of seasonal variations in energy production or other significant events. Our principal sources of liquidity are cash generated from our operating activities, the cash retained by us for working capital purposes out of the gross proceeds of financing activities as well as our borrowing capacity under our existing credit facilities, subject to any conditions required to draw under such existing credit facilities. Our quarterly results of operations may fluctuate significantly for various reasons, mostly related to economic incentives and weather patterns. Therefore, results for any quarterly period should not be relied upon as being indicative of performance in future quarterly periods or the full fiscal year.
For instance, the amount of electricity and revenues generated by our solar generation facilities is dependent in part on the amount of sunlight, or irradiation, where the assets are located. Due to shorter daylight hours in winter months which results in less irradiation, the generation produced by these facilities will vary depending on the season.
If we fail to adequately manage the fluctuations in the timing of distributions from our renewable energy facilities, our business, financial condition or results of operations could be materially affected. The seasonality of our energy production may create increased demands on our working capital reserves and borrowing capacity under our existing credit facilities during periods where cash generated from operating activities are lower. In the event that our working capital reserves and borrowing capacity under our existing credit facilities are insufficient to meet our financial requirements, or in the event that the restrictive covenants in our existing credit facilities restrict our access to such facilities, we may require additional equity or debt financing to maintain our solvency. Additional equity or debt financing may not be available when required or available on commercially favorable terms or on terms that are otherwise satisfactory to us, in which event our financial condition may be materially adversely affected.
Our acquisition strategy exposes us to substantial risk.
Our acquisition of renewable energy facilities or of companies that own and operate renewable energy facilities is subject to substantial risk, including but not limited to the failure to identify material problems during due diligence (for which we may not be indemnified post-closing), the risk of over-paying for assets (or not making acquisitions on an accretive basis), the ability to obtain or retain customers and, if the renewable energy facilities are in new markets, the risks of entering markets where we have limited experience. While we perform due diligence on prospective acquisitions, we may not be able to discover all potential operational deficiencies in such renewable energy facilities. In addition, our expectations for the operating performance of newly constructed renewable energy facilities as well as those under construction are based on assumptions and estimates made without the benefit of operating history. However, the ability of these renewable energy facilities to meet our performance expectations is subject to the risks inherent in newly constructed renewable energy facilities and the construction of such facilities, including, but not limited to, degradation of equipment in excess of our expectations, system failures and outages.
Future acquisitions may not perform as expected or the returns from such acquisitions may not support the financing utilized to acquire them or maintain them. Furthermore, integration and consolidation of acquisitions requires substantial human, financial and other resources and may divert management’s attention from our existing business concerns, disrupt our ongoing business or not be successfully integrated. Even if we consummate acquisitions that we believe will be accretive to such cash per unit, those acquisitions may in fact result in a decrease in such cash per unit as a result of incorrect assumptions in our evaluation of such acquisitions, unforeseen consequences or other external events beyond our control. Furthermore, if we consummate any future acquisitions, our capitalization and results of operations may change significantly, and stockholders will generally not have the opportunity to evaluate the economic, financial and other relevant information that we will consider in determining the application of these funds and other resources. As a result, the consummation of acquisitions may have a material adverse effect on our business, financial condition, results of operations and cash flows.
| 17 |
| Table of Contents |
The delay between making significant upfront investments in our solar parks and receiving revenue could materially and adversely affect our liquidity, business and results of operations.
There are generally multiple months between our initial significant upfront investments in developing permits to build solar parks we expect to own and operate and when we begin to receive revenue from the sale of electricity generated by such solar parks after grid connection. Such investments include, without limitation, legal, accounting and other third-party fees, costs associated with feasibility studies, payments for land rights, government permits, grid reservation and other payments, which may be non-refundable. Furthermore, we have historically relied on third party equity contribution, bridging and bank loans to pay for costs and expenses incurred during project development, especially to third parties for PV modules and balance-of-system components and EPC and O&M services. Solar parks typically generate revenue only after becoming commercially operational and once they are able to sell electricity to the power grid. Between our initial investments in the development of solar parks (through our model of working with local developers) and their connection to the transmission grid, there may be adverse developments impacting such solar parks. The timing gap between our upfront investments and actual generation of revenue, or any added delay due to unforeseen events, could put strains on our liquidity and resources and materially and adversely affect our profitability and results of operations.
Failure to manage our growing and changing business could have a material adverse effect on our business, prospects, financial condition and results of operations.
We intend to expand our business significantly within selected existing markets and in a number of new locations in the future. As we grow, we expect to encounter additional challenges to our internal processes, external construction management, capital commitment process, project funding infrastructure, acquisition funding and financing capabilities. Our existing operations, personnel, systems and internal control may not be adequate to support our growth and expansion and may require us to make additional unanticipated investments in our infrastructure. To manage the future growth of our operations, we will be required to improve our administrative, operational and financial systems, procedures and controls, and maintain, expand, train and manage our growing employee base. We will need to hire and train project development personnel to expand and manage our project development efforts. If we are unable to manage our growth effectively, we may not be able to take advantage of market opportunities, execute our business strategies successfully or respond to competitive pressures. As a result, our business, prospects, financial condition and results of operations could be materially and adversely affected.
Our IPP business requires significant financial resources. If we do not successfully execute our financing plan, we may have to sell certain of our IPP solar parks
As reflected in the accompanying financial statements, the Company had net loss of $3.0 million for the year ended December 31, 2019, and a net loss of $1.9 million for the year ended December 31, 2018. The Company had accumulated shareholders’ equity of $3.9 million as of December 31, 2019 and $5.0 million as of December 31, 2018. The Company had a working capital deficit of $23.8 million as of December 31, 2019 and $14.1 million as of December 31, 2018. Given the current level of cash resources, receivables and long-term supply contracts, management believes the Company’s current level of operations is sufficient to mitigate such uncertainty. The working capital deficit for 2019 and 2018 is related to the acquisition of long-term assets that will be refinanced with long term debt in 2020. These assets will also provide long term cash flow to the Company.
Our principal sources of liquidity to date have been cash from our operations and borrowings from banks and our shareholders. We leverage bank facilities in certain countries in order to meet working capital requirements for construction activities. Our principal uses of cash have been for pipeline development, working capital and general corporate purposes.
The Company reviews our forecasted cash flows on an on-going basis to ensure that we will have sufficient capital from a combination of internally generated cash flows and proceeds from financing activities, if required, in order to fund our working capital and capital expenditures. We believe that adequate sources of liquidity will exist to fund our working capital and capital expenditures, and to meet our short-term debt obligations, other liabilities and commitments as they become due.
| 18 |
| Table of Contents |
We cannot assure you that we will successfully execute our financing plan. If we do not successfully execute this plan, we may not be able to continue as a going concern. Such failure could materially and adversely affect our financial condition, results of operations and business prospects.
We may not be able to develop or acquire additional attractive IPP solar parks to grow our project portfolio.
Our current business strategy is to become a global IPP and to own and operate all of the solar parks we develop and acquire. As part of our growth plan, we may, in the future, acquire solar parks in various development stages through a competitive bidding process as part of the auction schemes in the various jurisdictions we plan to grow and establish ourselves in as well as the current countries we operate in. We will be competing for project awards based on, among other things, pricing, technical and engineering expertise, financing capabilities, past experience and track record. It may be difficult to predict whether and when we will be awarded a new solar park. The bidding and selection process is also affected by a number of factors, including factors which may be beyond our control, such as market conditions or government incentive programs. Our competitors may have greater financial resources, a more effective or established localized business presence or a greater willingness or ability to operate with little or no operating margins for sustained periods of time. Any increase in competition during the bidding process or reduction in our competitive capabilities could have a significant adverse impact on our market share and on the margins we generate from our solar parks.
Other difficulties executing this growth strategy, particularly in new jurisdictions we may enter, include:
|
| · | Accurately prioritizing geographic markets for entry, including estimates on addressable market demand; |
|
|
|
|
|
| · | Obtaining construction, environmental and other permits and approvals; |
|
|
|
|
|
| · | Securing land, rooftop or other site control; |
|
|
|
|
|
| · | Managing local operational, capital investment or components sourcing regulatory requirements; |
|
|
|
|
|
| · | Connecting to the power grid on schedule and within budget; |
|
|
|
|
|
| · | Connecting to the power grid if there is insufficient grid capacity; |
|
|
|
|
|
| · | Identifying, attracting and retaining qualified development specialists, technical engineering specialists and other personnel; |
|
|
|
|
|
| · | Managing any acquired assets; |
|
|
|
|
|
| · | Securing cost-competitive financing on attractive terms; |
|
|
|
|
|
| · | Operating and maintaining solar parks to maintain the power output and system performance; and |
|
|
|
|
|
| · | Collecting FiT payments and other economic incentives as expected. |
We may not be able to find suitable sites for the development of IPP solar parks.
Solar parks require solar and geological conditions that can only be found in a limited number of geographic areas. Further, large, utility-scale solar parks must be interconnected to the power grid in order to deliver electricity, which requires us, through our local partnerships, to find suitable sites with capacity on the power grid available. Our competitors may impede our development efforts by acquiring control of all or a portion of a PV site we seek to develop. Even when we have identified a desirable site for solar park, our ability to obtain site control with respect to the site is subject to our ability to finance the transaction and growing competition from other solar power producers that may have better access to local government support, financing or other resources. If we are unable to find or obtain site control for suitable PV sites on commercially acceptable terms, our ability to develop new solar parks on a timely basis or at all might be harmed, which could have a material adverse effect on our business, financial condition and results of operations.
| 19 |
| Table of Contents |
Our limited operating history may not serve as an adequate basis to judge our future prospects and results of operations.
We began our business in 2014 and therefore have a limited operating history. After our initial two parks totaling 6 MW were constructed in Romania in 2014 we began to acquire existing operational solar parks in Italy. In 2018, in order to diversify our growth strategy and increase recurring revenue and cash flow, we began to focus on acquiring project rights and co-development of solar parks as well as the acquisition of existing operational parks. As of December 31, 2019, we had a total of 40.8 MW of solar parks in ownership with 27.2 MW in operation giving a carrying value of $33.5million.
We intend to further expand our business operations in Europe and over time, we also aim to establish operations outside of Europe and enter other select geographies where high solar radiation accessibility, regulatory environments, power pricing, land availability, sufficient and cost effect financing access and overall power market trends support our high return on capital employed (ROCE) targets that we achieve today. Our rapidly evolving business and, in particular, our relatively limited operating history may not be an adequate basis for evaluating our business prospects and financial performance, and makes it difficult to predict the future results of operations. In particular, our results of operations, financial condition and future success depend, to a significant extent, on our ability to develop and continue good working relationships with local developers, who identify suitable sites and obtain required regulatory approvals on behalf of Alternus Energy, our ability to arrange financing from various sources, construct solar parks in a cost-effective and timely manner with our EPC partners, expand our project pipeline and manage and operate solar parks that we develop and acquire. If we cannot do so, we may not be able to expand our business at a profit or at all, maintain our competitive position, satisfy our contractual obligations or sustain growth and profitability.
Our growth prospects and future profitability depend to a significant extent the availability of additional funding options with acceptable terms.
We require a significant amount of cash to fund the acquisition, installation and construction of our projects and other aspects of our operations. We may also require additional cash due to changing business conditions or other future developments, including any investments or acquisitions we may decide to pursue in order to remain competitive. Historically, we have used bank loans, bridging loans and third-party equity contribution to fund our project acquisition and development. We expect to seek to expand our business with third-party financing options, including bank loans, equity partners, financial leases and securitization. However, we cannot guarantee that we will be successful in locating additional suitable sources of financing in the time periods required or at all, or on terms or at costs that we find attractive or acceptable, which may render it impossible for us to fully execute our growth plan.
In 2018, we began to strategically expand our IPP portfolio. Installing and constructing solar parks requires significant upfront capital expenditure and there may be a significant delay before we can recoup our investments through the long-term recurring revenue of our IPP solar parks. Our ability to obtain external financing is subject to a number of uncertainties, including:
|
| · | Our future financial condition, results of operations and cash flows; |
|
|
|
|
|
| · | The general condition of global equity and debt capital markets; |
|
|
|
|
|
| · | Regulatory and government support in the form of tax credits, rebates, FiT price support schemes and other incentives; |
|
|
|
|
|
| · | The continued confidence of banks and other financial institutions in our company and the PV industry; |
|
|
|
|
|
| · | Economic, regulatory, social, political and other conditions in the jurisdictions where we operate; and |
|
|
|
|
|
| · | Our ability to comply with any financial covenants under the debt financing. |
Any additional equity financing may be dilutive to our shareholders and any debt financing may require restrictive covenants. Additional funds may not be available on terms commercially acceptable to us. Failure to manage discretionary spending and raise additional capital or debt financing as required may adversely impact our ability to achieve our intended business objectives.
| 20 |
| Table of Contents |
The loss of the services of our key employees, particularly the services rendered by Mr. Vincent Browne, our Chief Executive Officer and Chairman of the Board, could harm our business.
Our success depends to a significant degree on the services rendered to us by our key employees. In particular, we are heavily dependent on the continued services of Mr. Vincent Browne, our Chief Executive Officer and Chairman of the Board. The loss of any key employees, including other executive officers or members of our senior management team, and our potential inability to attract highly skilled personnel with sufficient experience in our industry to replace them, could harm our business. In addition, we do not maintain any “key-man” insurance policies on Mr. Vincent Browne or any other employees.
If we fail to attract, train and retain sufficient numbers of qualified people, our prospects, business, financial condition and results of operations will be materially and adversely affected. In order to continue to operate in our rapidly changing business, we believe it is important to attract and retain personnel with experience and expertise relevant to the solar industry. Due to the level of technical expertise necessary to support our business strategy, our success will depend upon our ability to attract and retain highly skilled and seasoned professionals in the solar industry. Competition for highly skilled personnel is intense and there may be only a limited number of persons with the requisite skills to serve in these positions. Due to the competitive nature of the labor markets in which we operate, we may be unsuccessful in attracting and retaining these personnel. Our inability to attract and retain key personnel could adversely affect our ability to operate and grow.
A majority of directors and certain of our officers live outside the United States, making it potentially difficult for an investor to enforce liabilities in foreign jurisdictions.
We are a Nevada corporation and, as such, are subject to the jurisdiction of the State of Nevada and the United States courts for purposes of any lawsuit, action or proceeding by investors herein. An investor would have the ability to effect service of process on the Company within the United States. However, a majority of our directors (namely Vincent Browne and John McQuillan) and certain of our executive officers (namely our CEO, Mr. Browne) are non-residents of the United States. Therefore, it may be difficult for investors to:
|
| · | effect service of process within the United States against our non-U.S. resident directors or officers; |
|
| · | enforce U.S. court judgments based upon the civil liability provisions of the U.S. federal securities laws against any of the above referenced foreign persons in the United States; |
|
| · | enforce in foreign courts U.S. court judgments based on the civil liability provisions of the U.S. federal securities laws against the above foreign persons; and |
|
|
|
|
|
| · | bring an original action in foreign courts to enforce liabilities based upon the U.S. federal securities laws against the above foreign persons. |
We may become involved in costly and time-consuming litigation which may require significant attention from our management relating to prior investments in an affiliated company.
There are a number of individuals who invested in an affiliated company, Power Clouds Holdings Pte Ltd (PCH) based in Singapore, between 2013 and 2015. Although there is no lawsuit filed at this time, they may bring a claim against PCH and could also potentially include us as a co-defendant in such a lawsuit for delayed repayment of their investment of approximately $34 million. Furthermore, we do not believe there is any standing that would allow us to be included in such a lawsuit and would seek to be immediately dismissed from such a lawsuit, but we may be unsuccessful in this regard.
If we were found to be liable on any of the claims against us in the future, we would incur a charge against earnings to the extent a reserve had not been established for coverage. If amounts ultimately realized from the claims by us were materially lower than the balances included in our financial statements, we would incur a charge against earnings to the extent profit had already been accrued. Charges and write-downs associated with such legal proceedings could have a material adverse effect on our financial condition, results of operations and cash flow. Moreover, legal proceedings, particularly those resulting in judgments or findings against us, may harm our reputation and competitiveness in the market.
| 21 |
| Table of Contents |
Our legal rights to certain real properties used for our solar parks are subject to third party rights and may be challenged by property owners or third parties.
We are subject to the risk of potential disputes with property owners or third parties who otherwise have rights to or interests in the properties used for our solar parks. Such disputes, whether resolved in our favor or not, may divert management’s attention, harm our reputation or otherwise disrupt our business. An adverse decision from a court or the absence of an agreement with such third-parties may result in additional costs and delays in the construction and operating phases of any solar park so situated.
Our international operations require significant management resources and present legal, compliance and execution risks in multiple jurisdictions.
We have adopted a business model under which we maintain significant operations and facilities through our subsidiaries located in Europe while our corporate management team and directors are primarily based in Ireland and the US. The nature of our business may stretch our management resources as well as make it difficult for our corporate management to effectively monitor local execution teams. The nature of our operations and limited resources of our management may create risks and uncertainties when executing our strategy and conducting operations in multiple jurisdictions, which could affect our costs and results of operations.
If sufficient demand for solar parks does not develop or takes longer to develop than we anticipate, our business, financial condition, results of operations and prospects could be materially and adversely affected
The PV market is at a relatively early stage of development in some of the markets that we intend to enter. The PV industry continues to experience lower costs, improved efficiency and higher electricity output. However, trends in the PV industry are based only on limited data and may not be reliable. Many factors may affect the demand for solar parks, including:
|
| · | The cost and availability of credit, loans and other forms of financing for solar parks; |
|
|
|
|
|
| · | Fluctuations in economic and market conditions that affect the viability of conventional and non-solar renewable energy sources; |
|
|
|
|
|
| · | The cost-effectiveness of solar parks compared to conventional and other non-solar energy sources; |
|
|
|
|
|
| · | The performance and reliability of solar parks compared to conventional and other non-solar energy sources; |
|
|
|
|
|
| · | The availability of grid capacity to dispatch power generated from solar parks; |
|
|
|
|
|
| · | Environmental concerns related to solar parks and other local permit issues; |
|
|
|
|
|
| · | The availability of government subsidies and incentives to support the development of the PV industry; |
|
|
|
|
|
| · | Public perceptions of the direct and indirect benefits of adopting renewable energy technology; |
|
|
|
|
|
| · | The success of other alternative energy generation technologies, such as fuel cells, wind power and biomass; |
|
|
|
|
|
| · | Regulations and policies governing the electric utility industry that may present technical, regulatory and economic barriers to the purchase and use of solar energy; and |
|
|
|
|
|
| · | The deregulation of the electric power industry and the broader energy industry. |
| 22 |
| Table of Contents |
If market demand for solar parks fails to develop sufficiently, our business, financial condition, results of operations and prospects could be materially and adversely affected.
We face significant competition in certain markets in which we operate.
We face significant competition in certain markets in which we operate. Our primary competitors are local and international developers and operators of solar parks, many of which are integrated with upstream PV manufacturers. In the future we may also compete with utilities generating power from conventional fossil fuels and other sources of renewable energy in regions that have achieved grid parity.
Some of our competitors may have advantages over us in terms of greater operational, financial, technical, management or other resources in particular markets or in general. Our market position depends on our financing, development and operation capabilities, reputation, experience and track record. Our competitors may also enter into strategic alliances or form affiliates with other competitors to our detriment. Suppliers or contractors may merge with our competitors which may limit our choices of contractors and hence the flexibility of our overall project execution capabilities. There can be no assurance that our current or potential competitors will not offer solar parks or services comparable or superior to those that we offer at the same or lower prices or adapt more quickly than we do. Increased competition may result in price reductions, reduced profit margins and loss of market share.
We are subject to risks associated with fluctuations in the prices of PV modules and balance-of-system components or in the costs of design, construction and labor.
We procure supplies for solar park construction, such as PV modules and balance-of-system components, from third-party suppliers. We typically enter into contracts with our suppliers and contractors on a project-by-project basis or a project portfolio basis. We generally do not maintain long-term contracts with our suppliers. Therefore we are exposed to fluctuations in prices for our PV modules and balance-of-system components. Increases in the prices of PV products or balance-of-system components or fluctuations in design, construction, labor and installation costs may increase the cost of procuring equipment and engaging contractors and hence materially and adversely affect our results of operations.
PV project development is challenging and may ultimately not be successful, which could have a material adverse effect on our business, financial condition and results of operations.
Our current business model is to form partnerships with local in-country developers who generally provide us with “ready to build” projects. However, we are still exposed to the costs of the pre-construction development stage depending on the agreements with our local partner.
The development and construction of solar parks involves numerous risks and uncertainties and requires extensive research, planning and due diligence. We may be required to make significant capital expenditures for land and interconnection rights, preliminary engineering, permitting, legal and other expenses before we can determine whether a solar park is economically, technologically or otherwise feasible. Success in developing a particular solar park is contingent upon, among other things:
|
| · | Securing suitable project sites, necessary rights of way and satisfactory land rights in the appropriate locations with capacity on the transmission grid; |
|
|
|
|
|
| · | Negotiating satisfactory engineering, procurement and construction agreements and land use and access rights; |
|
|
|
|
|
| · | Negotiating and receiving required permits and approvals for project development from government authorities on schedule; |
|
|
|
|
|
| · | Completing all required regulatory and administrative procedures needed to obtain permits and agreements; |
|
|
|
|
|
| · | Procuring rights to interconnect the solar park to the electric grid or to transmit energy; |
|
|
|
|
|
| · | Paying interconnection and other deposits, some of which may be non-refundable; |
|
|
|
|
|
| · | Negotiating favorable payment terms with suppliers; |
|
|
|
|
|
| · | Signing PPAs or other arrangements that are commercially acceptable; |
|
|
|
|
|
| · | Obtaining construction financing, including debt financing and own equity contribution; and |
|
|
|
|
|
| · | Satisfactorily completing construction on schedule. |
| 23 |
| Table of Contents |
Successful completion of a particular solar park may be adversely affected by numerous factors, including without limitation:
|
| · | Unanticipated changes in project plans or defective or late execution; |
|
|
|
|
|
| · | Difficulties in obtaining and maintaining governmental permits, licenses and approvals required by existing laws and regulations or additional regulatory requirements not previously anticipated; |
|
|
|
|
|
| · | The inability to procure adequate financing with acceptable terms, especially for engineering, procurement and construction; |
|
|
|
|
|
| · | Unforeseeable engineering problems, construction or other unexpected delays and contractor performance shortfalls; |
|
|
|
|
|
| · | Labor, equipment and materials supply delays, shortages or disruptions, or work stoppages; |
|
|
|
|
|
| · | Adverse weather, environmental and geological conditions, force majeure and other events out of our control; and |
|
|
|
|
|
| · | Cost over-runs, due to any one or more of the foregoing factors. |
Accordingly, some of the solar parks in our pipeline may not be completed or even proceed to construction. If a number of solar parks are not completed, our business, financial condition and results of operations could be materially and adversely affected.
Our construction activities may be subject to cost overruns or delays.
Construction of our solar parks may be adversely affected by circumstances outside of our control, including inclement weather, a failure to receive regulatory approvals on schedule or third-party delays in providing PV modules, inverters or other materials. Obtaining full permits for our solar parks is time consuming and we may not be able to meet our expected timetable for obtaining full permits for our solar parks in the pipeline. We may not be able to negotiate satisfactory engineering, procurement and construction agreements with third parties. Changes in project plans or designs, or defective or late execution may increase our costs and cause delays. Increases in the prices of PV products and balance-of-system components may increase procurement costs. Labor shortages, work stoppages or labor disputes could significantly delay a project or otherwise increase our costs. In addition, delays in obtaining or our inability to obtain required construction permits could also delay or hinder the construction of our solar parks. A lack of proper construction permits or post-construction approvals could delay or prevent us from commencing operation and connecting to the relevant grid.
Moreover, we rely on a limited number of third-party suppliers for certain components and equipment used in the construction of our solar parks, such as PV modules. The failure of a supplier to supply components and equipment in a timely manner, or at all, or to supply components and equipment that meet our quality, quantity and cost requirements, could impair our ability to install solar parks or may increase our costs. To the extent the processes that our suppliers use to manufacture components are proprietary, we may be unable to obtain comparable components from alternative suppliers.
| 24 |
| Table of Contents |
In addition, we typically utilize and rely on third-party contractors to construct and install our solar parks. If our contractors do not satisfy their obligations or do not perform work that meets our quality standards or if there is a shortage of third-party contractors or if there are labor strikes that interfere with the ability of our employees or contractors to complete their work on time or within budget, we could experience significant delays or cost overruns.
We may not be able to recover any of these losses in connection with construction cost overruns or delays. In addition, if we are unable to connect a solar park to the power grid on schedule, we may experience lower FiT, as FiT regimes generally ratchet down the FiT awarded to solar parks that connect later to the power grid. If the solar park is significantly delayed, we may only be able to obtain reduced FiT payments or may even become ineligible for FiT payments. A reduction or forfeiture of FiT payments would materially and adversely affect the financial results and results of operations for that solar park. Any of the contingencies discussed above could lead us to fail to generate our expected return from our solar parks and result in unanticipated and significant revenue and earnings losses.
We may be subject to unforeseen costs, liabilities or obligations when operating and maintaining solar parks.
We have a contract with a third party O&M company to carry out the O&M of our solar parks. They may subcontract certain on-the-ground O&M services, including security and repair, to third-parties, who may not perform their services adequately. If our third-party contractors fail to properly operate and maintain the solar parks, the solar parks may experience decreased performance, reduced useful life or shut downs. Through changes in our own operation or in local conditions, the costs of operating the project may increase, including costs related to labor, equipment, insurance and taxes. If they are careless or negligent, resulting in damage to third parties, we may become liable for the consequences of any resulting damage. We may also experience equipment malfunction or failure, leading to unexpected maintenance needs, unplanned outages or other operational issues. In addition, inconsistencies in the quality of solar panels, PV modules, balance-of-system components or maintenance services for our solar parks may affect the system efficiency of our solar parks. We may also encounter difficulties selling electricity to the power grid due to failures in infrastructure or transmission systems. To the extent that any of the foregoing affects our ability to sell electricity to the power grid, or we incur increased costs in relation to operating and maintaining solar parks, our business, financial condition and results of operation could be materially and adversely affected.
Refurbishment of renewable energy facilities involve significant risks that could result in unplanned power outages or reduced output.
Our facilities may require periodic upgrading and improvement. Any unexpected operational or mechanical failure, such as the failure of a single inverter, or other failures associated with breakdowns and forced outages generally, and any decreased operational or management performance, could reduce our facilities’ generating capacity below expected levels, reducing our revenues. Unanticipated capital expenditures associated with upgrading or repairing our facilities may also reduce profitability.
We may also choose to refurbish or upgrade our facilities based on our assessment that such activity will provide adequate financial returns and key assumptions underpinning a decision to make such an investment may prove incorrect, including assumptions regarding construction costs, timing, available financing and future power prices. This could have a material adverse effect on our business, financial condition, results of operations and cash flows.
Moreover, spare parts for solar facilities and key pieces of equipment may be hard to acquire or unavailable to us. Sources of some significant spare parts and other equipment are located outside of the jurisdictions in which we operate. Suppliers of some spare parts have filed, or will in the future file for, bankruptcy protection, potentially reducing the availability of parts that we require to operate certain of our power generation facilities. Other suppliers may for other reasons cease to manufacture parts that we require to operate certain of our power generation facilities. If we were to experience a shortage of or inability to acquire critical spare parts we could incur significant delays in returning facilities to full operation, which could negatively impact our business financial condition, results of operations and cash flows.
| 25 |
| Table of Contents |
Our project operations may be adversely affected by weather and climate conditions, natural disasters and adverse work environments.
Solar parks depend on the amount and intensity of sunlight, which is affected by weather and climate conditions. Any change of such conditions in the areas we operate that reduces solar radiation will adversely affect our business and results of operations. In addition, we may operate in areas that are under the threat of floods, earthquakes, landslides, mudslides, sandstorms, drought, or other inclement weather and climate conditions or natural disasters. If inclement weather or climatic conditions or natural disasters occur in areas where our solar parks and project teams are located, project development, connectivity to the power grid and the provision of O&M services may be adversely affected. In particular, materials may not be delivered as scheduled and labor may not be available. As some of our solar parks are located in the same region, such solar parks may be simultaneously affected by weather and climate conditions, natural disasters and adverse work environments.
During periods of curtailed activity, we may continue to incur operating expenses. We may bear some or all of the losses associated with such unforeseen events. Moreover, natural disasters which are beyond our control may adversely affect the economy, infrastructure and communities in the countries and regions where we conduct our business operations. Such conditions may result in personal injuries or fatalities or have an adverse effect on our work performance, progress and efficiency or even result in personal injuries or fatalities.
We are subject to counterparty risks under our FiT price support schemes and GC Schemes.
As an IPP, we generate electricity income primarily pursuant to FiT price support schemes or GCs, which subjects us to counterparty risks with respect to regulatory regimes. Our FiT price support schemes in one region or country are generally signed with a limited number of electric utilities. We rely on these electric utilities to fulfill their responsibilities for the full and timely payment of our tariffs. In addition, the relevant regulatory authorities may retroactively alter their FiT price support regimes or GC schemes in light of changing economic circumstances, changing industry conditions or for any number of other reasons. For example, in Romania the GC scheme under Law 220/2008 had to undergo a restructuring as the quota for solar PV was actually achieved in a faster time frame than expected because the process was not controlled on a time or operator basis. In Italy the FiT support scheme under ‘‘Conto Energia’’ also experienced a restructuring due to the quota for solar PV being met sooner than expected. If the relevant government authorities or the local power grid companies do not perform their obligations under the FiT or GC price support schemes and we are unable to enforce our contractual rights, our results of operations and financial condition may be materially and adversely affected.
We may fail to comply with laws and regulations in the countries where we develop, construct and operate solar parks.
In order to develop solar parks we must obtain a variety of approvals, permits and licenses from various authorities. The procedures for obtaining such approvals, permits and licenses vary from country to country, making it onerous and costly to track the requirements of individual localities and comply with the varying standards. We seek to form partnerships with local in-country developers to assist with these requirements, but any failure to obtain the required approvals, permits or licenses or to comply with the conditions associated therewith could result in fines, sanctions, suspension, revocation or non-renewal of approvals, permits or licenses, or even criminal penalties, which could have a material adverse effect on our business, financial condition and results of operations.
While we strive to work with our local counsel and other advisers to comply with all of the laws and regulations of each jurisdiction in which we have operations, there may be instances of noncompliance, such as late filings of annual accounts with the appropriate governmental authorities, failure to notify governmental authorities of certain transactions, failure to hold annual meetings as required, failure to register directors or office changes or other local requirements which may result in fines, sanctions and other penalties against the non-complying subsidiaries and its directors and officers. While we do not believe our past and any continuing non-compliances, singularly or in the aggregate, will have a material adverse effect on our business, financial condition or results of operation, we cannot assure you that similar or other non-compliances will not occur in the future which may materially and adversely affect our business, financial condition or results of operation.
| 26 |
| Table of Contents |
Any new government regulations pertaining to our business or solar parks may result in significant additional expenses. We cannot assure you that we will be able to promptly and adequately respond to changes of laws and regulations in various jurisdictions, or that our employees and contractors will act in accordance with our internal policies and procedures. Failure to comply with laws and regulations where we develop, construct and operate solar parks may materially and adversely affect our business, results of operations and financial condition.
We may become involved in costly and time-consuming litigation and other regulatory proceedings, which may require significant attention from our management.
Although we are not currently involved in any significant litigation, administrative or arbitral proceedings, we may, in the ordinary course of our business, become involved in such proceedings. Claims may be brought against or by us from time to time regarding, for example, defective or incomplete work, defective products, personal injuries or deaths, damage to or destruction of property, breach of warranty, late completion of work, delayed payments, intellectual property rights or regulatory compliance, and may subject us to litigation, arbitration and other legal proceedings, which may be expensive, lengthy, disruptive to normal business operations and require significant attention from our management. For example, although we are not involved in the litigation, a class action lawsuit was filed on June 12th 2018 by various solar companies located in Romania against the Romanian government to compensate for damages incurred as a result of the Romanian government’s changes to its solar incentive programs.
If we were found to be liable on any of the claims against us in the future, we would incur a charge against earnings to the extent a reserve had not been established for coverage. If amounts ultimately realized from the claims by us were materially lower than the balances included in our financial statements, we would incur a charge against earnings to the extent profit had already been accrued. Charges and write-downs associated with such legal proceedings could have a material adverse effect on our financial condition, results of operations and cash flow. Moreover, legal proceedings, particularly those resulting in judgments or findings against us, may harm our reputation and competitiveness in the market.
We may not be able to adequately protect our intellectual property rights, including trademarks and know-how, which could harm our competitiveness.
We rely on a combination of copyright, trademark and trade secret laws, as well as nondisclosure agreements and other contractual restrictions, to establish and protect our proprietary rights. Our practice is to affix copyright notices on our corporate literature in order to assert copyright protection for these works. Employees are required to execute confidentiality and non-use agreements that transfer any rights they may have in copyrightable works or patentable technologies to us. In addition, prior to entering into discussions with potential business partners or customers regarding our business and technologies, we generally require that such parties enter into nondisclosure agreements with us. If these discussions result in a license or other business relationship, we also generally require that the agreement setting forth the parties’ respective rights and obligations include provisions for the protection of our intellectual property rights. The steps taken by us may not, however, be adequate to prevent the misappropriation of our proprietary rights. To date, we do not have any federally registered trademarks.
Despite our efforts to protect our proprietary rights, unauthorized parties may attempt to duplicate aspects of our business or to obtain and use information that we regard as proprietary. Our steps to protect our proprietary property may not be adequate to prevent misappropriation of such. If we fail to protect our proprietary information, our business, financial condition and results of operations could be harmed significantly.
Intellectual property laws and means of enforcement of intellectual property laws vary by jurisdiction. Enforcement of our intellectual property rights could be time-consuming and costly. We may not be able to immediately detect and remediate unauthorized use of our intellectual property. In the event that the measures taken by us or the protection afforded by law do not adequately safeguard our intellectual property rights, we could suffer losses in revenue and profit due to competing offerings of services that exploit our intellectual properties. Furthermore, we cannot assure that any of our intellectual property rights will not be challenged by third parties. Adverse rulings in any litigation or proceedings could result in the loss of our proprietary rights and subject us to substantial liabilities, or even disrupt our business operations.
| 27 |
| Table of Contents |
Fluctuations in foreign currency exchange rates may negatively affect our revenue, cost of sales and gross margins and could result in exchange losses
Our subsidiaries trade in their functional currencies in the course of their business operations. Our investment holding companies transact in functional currencies of their subsidiaries. Our investment holding companies have foreign financing and investing activities, which expose the Company to foreign currency risk. Any increased costs or reduced revenue as a result of foreign exchange rate fluctuations could adversely affect our profit margins. The fluctuation of foreign exchange rates also affects the value of our monetary and other assets and liabilities denominated in local currencies, primarily the Euro and Romania LEI. Generally, an appreciation of the U.S. dollar against relevant local currencies could result in a foreign exchange loss for assets denominated in such local currencies and a foreign exchange gain for liabilities denominated in such local currencies. Conversely, a devaluation of the U.S. dollar against relevant local currencies could result in a foreign exchange gain for assets denominated in such local currencies and a foreign exchange loss for liabilities denominated in such local currencies.
We could also expand our business into emerging markets, some of which may have an uncertain regulatory environment relating to currency policy. Conducting business in such emerging markets could cause our exposure to foreign exchange rate fluctuation risks to increase. Although we access a variety of financing solutions that are tailored to the geographic location of our projects and to local regulations, we have not entered into any hedging transactions to reduce the foreign exchange rate fluctuation risks, but may do so in the future when we deem it appropriate to do in light of the significance of such risks. However, if we decide to hedge our foreign exchange exposure in the future, we cannot assure you that we will be able to reduce our foreign currency risk exposure in an effective manner, at reasonable costs, or at all.
We have limited business insurance coverage internationally.
The insurance industry in many parts of the world is still in an early stage of development. Insurance companies in many countries offer only limited business insurance options. As a result, we have not maintained, and generally do not maintain, full liability, hazard or other insurance covering our services, business, operations, errors, acts or omissions, personnel or properties. To the extent that we are unable to recover from others for any uninsured losses, such losses could result in a loss of capital and significant harm to our business. If any action, suit, or proceeding is brought against us and we are unable to pay a judgment rendered against us or defend ourselves against such action, suit, or proceeding, our business, financial condition and operations could be negatively affected.
There can be no assurance on the accuracy or completeness of certain facts, forecasts and other statistics obtained from various government publications, market data providers and other independent third-party sources, including industry expert reports, contained in this Annual Report on Form 10-K.
Certain facts, forecasts and other statistics relating to the various countries and regions and the solar industry contained in this Annual Report on Form 10-K have been derived from various government publications, market data providers and other third-party sources. While we have no reason to believe that such information is false or misleading or that any fact has been omitted that would render such information false or misleading, we cannot guarantee the accuracy and completeness of such information. While we have taken reasonable care to ensure that such facts, forecasts and other statistics have been accurately reproduced from their respective sources, these facts, forecasts and other statistics have not been independently verified by us, our directors and advisers or any other parties and none of us make any representation as to the accuracy or completeness of such information. Due to possibly flawed or ineffective collection methods or discrepancies between published information and market practice and other problems, the facts, forecasts and statistics contained herein may be inaccurate or may not be comparable to information produced by other parties. Therefore, investors should give consideration as to how much weight or importance they should attach to or place on such facts, forecasts or statistics and in all cases, such information should not be unduly relied upon.
If we are unable to integrate acquired businesses effectively, our operating results may be adversely affected.
From time to time, we seek to expand our business through acquisitions. We may not be able to successfully integrate acquired businesses and, where desired, their product portfolios into ours, and therefore we may not be able to realize the intended benefits. If we fail to successfully integrate acquisitions or product portfolios, or if they fail to perform as we anticipate, our existing businesses and our revenue and operating results could be adversely affected. If the due diligence of the operations of acquired businesses performed by us and by third parties on our behalf is inadequate or flawed, or if we later discover unforeseen financial or business liabilities, acquired businesses and their assets may not perform as expected. Additionally, acquisitions could result in difficulties assimilating acquired operations and, where deemed desirable, transitioning overlapping products into a single product line and the diversion of capital and management’s attention away from other business issues and opportunities. The failure to integrate acquired businesses effectively may adversely impact our business, results of operations or financial condition.
| 28 |
| Table of Contents |
We conduct our business operations globally and are subject to global and local risks related to economic, regulatory, social and political uncertainties.
We conduct our business operations in a number of countries and, as of December 31, 2019, have acquired and developed 27.2 MW of solar parks globally. We also own an additional 13.6MW of solar parks which are currently in different stages of development.. Our business is therefore subject to diverse and constantly changing economic, regulatory, social and political conditions in the jurisdictions in which we operate.
Operating in the international marketplace exposes us to a number of risks globally and in each of the jurisdictions where we operate, including without limitation:
|
| · | Economic and financial conditions, including the stability of credit markets, foreign currency controls and fluctuations; |
|
|
|
|
|
| · | Changes in government regulations, policies, tax and incentives, particularly those concerning the electric utility industry and the solar industry; |
|
|
|
|
|
| · | Complex regulations in numerous jurisdictions, including trade restrictions or embargoes; |
|
|
|
|
|
| · | Political risks, including risks of expropriation and nationalization of assets, potential losses due to civil unrests, acts of terrorism and war, regional and global political or military tensions, strained or altered foreign relations, and trade protectionism, restrictions or embargoes; |
|
|
|
|
|
| · | Compliance with local environmental, safety, health and other labor laws and regulations, which can be onerous and costly, as the magnitude, complexity and continuous amendments to the laws and regulations are difficult to predict and liabilities, costs, obligations and requirements associated with these laws and regulations can be substantial; |
|
|
|
|
|
| · | Dependence on governments, utility companies and other entities for electricity, water, telecommunications, transportation and other utilities or infrastructure needs; |
|
|
|
|
|
| · | Local corporate governance and other legal requirements; |
|
|
|
|
|
| · | Difficulties with local operating and market conditions, particularly regarding customs, taxation and labor; and |
|
|
|
|
|
| · | Failure of our contractual parties to honor their obligations to us, and potential disputes with developers, clients, contractors, suppliers or local residents or communities; |
Moreover, as we enter new markets in different jurisdictions, we will face different regulatory regimes, business practices, governmental requirements and industry conditions. As a result, our prior experiences and knowledge in other jurisdictions may not be relevant, and we may spend substantial resources familiarizing ourselves with the new environment and conditions. To the extent that our business operations are affected by unexpected and adverse economic, regulatory, social or political conditions in the jurisdictions in which we have operations, we may experience project disruptions, loss of assets and personnel, and other indirect losses that could adversely affect our business, financial condition and results of operations.
| 29 |
| Table of Contents |
Geopolitical trends toward protectionism and nationalism and the dissolution or weakening of international trade pacts may increase the cost of, or otherwise interfere with, our conduct of business. Uncertainty about current and future economic and political conditions which affect us, our customers and partners makes it difficult for us to forecast operating results and to make decisions about future investments. For instance, in June 2016, voters in the United Kingdom approved an advisory referendum to withdraw from the EU (commonly referred to as “Brexit”). The Brexit vote and the perceptions as to the impact of the withdrawal of the United Kingdom from the EU may adversely affect business activity, political stability and economic conditions in the United Kingdom, the EU and elsewhere. It is uncertain at this time how the policies of the current U.S. presidential administration and Congress will affect our business, including potentially through increased import tariffs and other influences on U.S. trade relations with other countries, such as Canada, Mexico and China. The imposition of tariffs or other trade barriers could increase our costs and reduce the competitiveness of our offerings in certain markets. In addition, other countries may change their own policies on business and foreign investment in companies in their respective countries. In addition, as discussed in more detail below, recently enacted U.S. tax reform legislation could have a material and adverse impact on our cash flows and financial condition. There may also be changes to, and introductions of, new tax laws in various foreign countries in which we do business or other future proposals to change U.S. or state or local tax law. Any of these proposals, changes or new tax laws could significantly and adversely impact how we are taxed on both U.S. and foreign earnings.
The various risks inherent in doing business in the U.S. generally also exist when doing business outside of the U.S., and may be exaggerated by the difficulty of doing business in numerous sovereign jurisdictions due to differences in culture, laws and regulations.
Our international operations require us to comply with anti-corruption laws and regulations of the United States government and various non-U.S. jurisdictions.
Doing business in multiple countries requires us and our subsidiaries to comply with the laws and regulations of the United States government and various non-U.S. jurisdictions. Our failure to comply with these rules and regulations may expose us to liabilities. These laws and regulations may apply to us, our subsidiaries, individual directors, officers, employees and agents, and may restrict our operations, trade practices, investment decisions and partnering activities. In particular, our non-U.S. operations are subject to United States and foreign anti-corruption laws and regulations, such as the Foreign Corrupt Practices Act of 1977, as amended (“FCPA”). The FCPA prohibits United States companies and their officers, directors, employees and agents acting on their behalf from corruptly offering, promising, authorizing or providing anything of value to foreign officials for the purposes of influencing official decisions or obtaining or retaining business or otherwise obtaining favorable treatment. The FCPA also requires companies to make and keep books, records and accounts that accurately and fairly reflect transactions and dispositions of assets and to maintain a system of adequate internal accounting controls. As part of our business, Alternus Energy and its officers, directors, employees and third party agents regularly deal with government bodies and government owned and controlled businesses, the employees and representatives of which may be considered foreign officials for purposes of the FCPA. As a result, business dealings between our employees and any such foreign official could expose us to the risk of violating anti-corruption laws even if such business practices may be customary or are not otherwise prohibited between us and a private third party. Violations of these legal requirements are punishable by criminal fines and imprisonment, civil penalties, disgorgement of profits, injunctions, debarment from government contracts as well as other remedial measures. We have established policies and procedures designed to assist us and our personnel in complying with applicable United States and non-U.S. laws and regulations; however, there is no assurance that these policies and procedures will completely eliminate the risk of a violation of these legal requirements, and any such violation (inadvertent or otherwise) could have a material adverse effect on our business, financial condition and results of operations.
The Company could be subject to changes in its tax rates, the adoption of new U.S. or international tax legislation or exposure to additional tax liabilities, which could have a material and adverse impact on the Company’s operating results, cash flows and financial condition.
The Company is subject to taxes in the U.S. and numerous foreign jurisdictions, where a number of the Company’s subsidiaries are organized. Due to economic, regulatory and political conditions, tax rates in various jurisdictions including the U.S. may be subject to change. The Company’s future effective tax rates could be affected by changes in the mix of earnings in countries with differing statutory tax rates, changes in the valuation of deferred tax assets and liabilities and changes in tax laws or their interpretation, such as interpretations as to the legality of tax advantages granted under the EU state aid rules.
| 30 |
| Table of Contents |
Tax examinations and audits could have a material and adverse impact on the Company’s cash flows and financial condition.
The Company is subject to the examination of its tax returns and other tax matters by the U.S. Internal Revenue Service and other tax authorities and governmental bodies. The Company regularly assesses the likelihood of an adverse outcome resulting from such examinations to determine the adequacy of its provision for taxes. There can be no assurance as to the outcome of any such examinations.
If the Company’s effective tax rates were to increase, or if the ultimate determination of the Company’s taxes owed were for an amount in excess of amounts previously accrued, the Company’s operating results, cash flows and financial condition could be materially and adversely affected.
Business interruptions, whether due to catastrophic disasters or other events, could adversely affect our operations, financial condition and cash flows.
Our operations and those of our contract manufacturers and outsourced service providers are vulnerable to interruption by fire, earthquake, hurricane, flood or other natural disaster, power loss, computer viruses, computer systems failure, telecommunications failure, quarantines, national catastrophe, terrorist activities, war and other events beyond our control. For instance, some of our solar parks are located in Italy, near to medium risk areas regarding seismic activity and may be vulnerable to damage from earthquakes. If any disaster were to occur, our ability and the ability of our contract manufacturers and outsourced service providers to operate could be seriously impaired and we could experience material harm to our business, operating results and financial condition. In addition, the coverage or limits of our business interruption insurance may not be sufficient to compensate for any losses or damages that may occur.
Other catastrophic events, such as pandemic diseases, may also disrupt our business operations. For example, the recent outbreak of the COVID-19 coronavirus has resulted in closures of manufacturing facilities, travel restrictions, disruptions to supply chains and disruptions to workplaces as employees and contractors cease to be available to perform critical work functions. A prolonged disruption could limit the availability of certain parts required to operate our facilities and adversely impact the ability of our contractors and other service providers to service our equipment, which may result in operational delays. It could also adversely impact our efforts to repower certain facilities, causing important construction milestones to be missed.
Any such terrorist acts, environmental repercussions or disruptions, natural disasters, theft incidents or other catastrophic events could result in a significant decrease in revenues or significant reconstruction, remediation or replacement costs, beyond what could be recovered through insurance policies, which could have a material adverse effect on our business, financial condition, results of operations and cash flows.
Our business, results of operations, financial condition and cash flows have been and may continue to be materially and adversely affected by the outbreak of the novel respiratory illness coronavirus (“COVID-19”).
On March 11, 2020, the World Health Organization declared the outbreak of the novel respiratory illness COVID-19 a pandemic. The new strain of COVID-19 is considered to be highly contagious and poses a serious public health threat. The outbreak of COVID-19 emerged in China and spread to Europe, where we have significant operations. We generate our revenue from the sale of electricity from our solar parks in Italy, Germany, and Romania.
Any outbreak of such epidemic illness or other adverse public health developments may materially and adversely affect the global economy, our markets and our business. A prolonged disruption or any further unforeseen delay in our operations in Europe could continue to result in delays in the increased costs and reduced revenue from our operations.
We cannot foresee whether the outbreak of COVID-19 will be effectively contained, nor can we predict the severity and duration of its impact. If the outbreak of COVID-19 is not effectively and timely controlled, our business operations and financial condition may be materially and adversely affected as a result of the deteriorating market outlook, the slowdown in regional and national economic growth, weakened liquidity and financial condition of our customers or other factors that we cannot foresee. Any of these factors and other factors beyond our control could have an adverse effect on the overall business environment, cause uncertainties in the regions where we conduct business, cause our business to suffer in ways that we cannot predict and materially and adversely impact our business, financial condition and results of operations.
| 31 |
| Table of Contents |
In 2020 and as of the date of this Annual Report, the outbreak of COVID-19 has caused significant volatility in global markets and in the market price of our securities. The volatility and market uncertainty caused by COVID-19 has resulted in a delay to our current funding initiatives and we have also seen our cost of borrowing increase since the outbreak began. Delays in planned new funding being available caused by COVID-19 may result in us not being able to meet our obligations under existing loan facilities. If we are unable to negotiate suitable extensions to existing loan agreements with our lenders before their expiration, then some of our lenders may initiate legal proceedings against us to recover their funds including taking possession of our underlying assets. In such an event, any assets that would no longer be owned or controlled by the Company would have a material adverse impact on our results of operations and financial condition. Increased borrowing costs may make some of our projects uneconomical.
In addition, the recent outbreak of COVID-19 has resulted in closures of manufacturing facilities, travel restrictions, disruptions to supply chains and disruptions to workplaces as employees and contractors cease to be available to perform critical work functions. These aforesaid restrictions have negatively impacted the construction timelines of our German facilities which will delay their planned operational dates resulting in a delay in cash inflows from operations to service existing loan facilities on these assets. Any prolonged and uncontained outbreak of COVID-19 could contribute to a general slowdown in the global economy, and adversely impact our ability to operate our business and the businesses of our counterparties, any of which could have a materially adverse impact on our business, results of operations and financial condition. Moreover, governmental authorities may recommend or impose other measures that could cause significant disruptions to our business operations in the regions most impacted by the coronavirus to which we are particularly exposed in Europe. A prolonged disruption could affect our business negatively in a variety of ways: it could limit the availability of certain parts required to operate our facilities; adversely impact the ability of our contractors and other service providers to service our equipment, resulting in further operational delays; or adversely impact our efforts to repower certain facilities, causing important construction milestones to be missed. Any of the foregoing events or other unforeseen consequences of public health problems could materially adversely affect our business, results of operations and financial condition.
Our use and enjoyment of real property rights for our renewable energy facilities may be adversely affected by the rights of lienholders and leaseholders, or even the government, that are superior to those of the grantors of those real property rights to us.
Renewable energy facilities generally are and are likely to be located on land occupied by the facility pursuant to long-term easements and leases. The ownership interests in the land subject to these easements and leases may be subject to mortgages securing loans or other liens (such as tax liens) and other easement and lease rights of third parties (such as leases of oil or mineral rights) that were created prior to the facility’s easements and leases. As a result, the facility’s rights under these easements or leases may be subject, and subordinate, to the rights of those third parties, or even to the government. We perform title searches and obtain title insurance to protect ourselves against these risks. Such measures may, however, be inadequate to protect us against all risk of loss of our rights to use the land on which our renewable energy facilities are located, which could have a material adverse effect on our business, financial condition and results of operations.
We have a significant number of foreign subsidiaries with whom we have entered into many related party transactions. Our relationship with these entities could adversely affect us in the event of their bankruptcy or similar insolvency proceeding.
We have historically entered into many transactions with our affiliates. These transactions include financial guarantees and other credit support arrangements, including letters of comfort to such affiliates pursuant to which we undertake to provide financial support to these affiliates and adequate resources as required to ensure that they are able to meet certain liabilities and local solvency requirements. We are currently party to many such affiliate transactions, and it is likely we will enter into new and similar affiliate transactions in the future.
| 32 |
| Table of Contents |
In the event that any of these affiliates become bankrupt or insolvent, there can be no assurance that a court or other foreign tribunal, liquidator, monitor, trustee or similar party would not seek to enforce these intercompany arrangements and guarantees or otherwise seek relief against us and our other affiliates. If any of our material foreign subsidiaries (e.g., subsidiaries that hold a significant number of our customer contracts, or that are the parent company of other material subsidiaries) becomes subject to a bankruptcy, liquidation or similar insolvency proceeding, such proceeding could have a material adverse effect on our business and results of operations.
Risks Related to Our Indebtedness
Our substantial indebtedness could adversely affect our business, financial condition and results of operations.
We have incurred substantial corporate and project-level indebtedness. We believe our substantial indebtedness will increase as an IPP. As of December 31, 2019, we had $22.7 million in outstanding short-term borrowings and $14.1 million in outstanding long-term bank borrowings.
This substantial indebtedness will likely have consequences on our business, results of operations and financial condition, including, but not limited to, the following:
|
| · | Reducing the availability of our cash flow to fund working capital and operations, including payments to suppliers for PV modules and balance-of-system components and to contractors for design, engineering, procurement and construction services, capital expenditures, acquisitions and other general corporate purposes as a result of our debt service obligations; |
|
|
|
|
|
| · | Limiting our ability to obtain additional financing, including to refinance our outstanding debt; |
|
|
|
|
|
| · | Limiting our flexibility in planning for, or reacting to general adverse economic and industry conditions; |
|
|
|
|
|
| · | Increasing our vulnerability to, changes in our business, competition, the industry in which we operate and the general economy; and |
|
|
|
|
|
| · | Potentially increasing the cost of any additional financing. |
Any of these factors and other consequences that may result from our substantial indebtedness could have an adverse effect on our business, financial condition and results of operations as well as our ability to meet our payment obligations under our debt. Our ability to meet our payment obligations under our outstanding debt depends on our ability to generate significant cash flow in the future. This, to some extent, is subject to general economic, financial, competitive, legislative and regulatory factors as well as other factors that are beyond our control.
If we fail to comply with financial and other covenants under our loan agreements, our financial condition, results of operations and business prospects may be materially and adversely affected.
We enter into loan agreements containing financial and other covenants that require us to maintain certain financial ratios or impose certain restrictions on disposition of our assets or the conduct of our business. We may not be able to comply with some of those financial and other covenants from time to time. In addition, we typically pledge our solar park assets or account or trade receivables to raise debt financing, and we are restricted from creating additional security over our assets. Such account or trade receivables will include all income generated from the sale of electricity in the solar parks. If we are in breach of one or more financial or other covenants or negative pledges clause under any of our loan agreements and are not able to obtain waivers from the lenders or prepay such loan, such breach would constitute an event of default under the loan agreement. As a result, repayment of the indebtedness under the relevant loan agreement may be accelerated, which may in turn require us to repay the entire principal amount including interest accrued, if any, of certain of our other existing indebtedness prior to their maturity under cross-default provisions of other loan agreements. If we are required to repay a significant portion or all of our existing indebtedness prior to their maturity, we may lack sufficient financial resources to do so. In that case, the pledgees may auction or sell the assets or interest of our solar parks to enforce their rights under the pledge contracts and loan agreements. Any of those events could have a material adverse effect on our financial condition, results of operations and business prospects.
| 33 |
| Table of Contents |
We may not be able to generate sufficient cash to service all of our indebtedness and our other ongoing liquidity needs, and we may be forced to take other actions to satisfy our obligations under our indebtedness, which may not be successful.
Our ability to make scheduled payments on or to refinance our debt obligations and to fund our planned capital expenditures, acquisitions and other ongoing liquidity needs depends on our financial condition and operating performance, which are subject to prevailing economic and competitive conditions and to certain financial, business and other factors beyond our control. There can be no assurance that we will maintain a level of cash flow from operating activities in an amount sufficient to permit us to pay the principal, premium, if any, and interest on our indebtedness. If our cash flow and capital resources are insufficient to fund our debt service obligations, we may be forced to reduce or delay investments and capital expenditures, or to seek additional capital or restructure or refinance our indebtedness. These alternative measures may not be successful and may not permit us to meet our scheduled debt service obligations. In the absence of such operating results and resources, we could face substantial liquidity problems and might be required to dispose of material assets or operations to meet our debt service and other obligations. Certain of our credit facilities restrict the ability of the Company and its subsidiaries to dispose of assets and use the proceeds from the disposition. Accordingly, we may not be able to consummate those dispositions or to obtain any proceeds on terms acceptable to us or at all, and any such proceeds may not be adequate to meet any debt service obligations when due.
Despite our level of indebtedness, we and our subsidiaries may be able to incur additional indebtedness. This could further exacerbate the risks associated with our degree of leverage.
We and our subsidiaries may be able to incur additional indebtedness in the future. Although our debt agreements contain restrictions on the incurrence of additional indebtedness, these restrictions are subject to a number of significant qualifications and exceptions, and any indebtedness incurred in compliance with these restrictions could be substantial. To the extent new debt is added to our and our subsidiaries’ currently anticipated debt levels, the related risks that we and our subsidiaries face could intensify.
We have significant indebtedness. Our level of indebtedness could adversely affect our business, results of operations, and financial condition. If we are unable to comply with the financial and non-financial covenants governing our indebtedness or obtain waivers of any defaults that occur with respect to our indebtedness, or amend, replace or refinance any or all of the agreements governing our indebtedness and/or otherwise secure additional capital, we may be unable to continue as a going concern.
Our auditors’ report on our December 31, 2019 financial statements, reflect that there is substantial doubt about our ability to continue as a going concern for twelve months from the issuance of this Annual Report on Form 10-K. Our operating revenues are insufficient to fund our operations and our assets already are pledged to secure our indebtedness to various third party secured creditors, respectively. The unavailability of additional financing could require us to delay, scale back or terminate our acquisition efforts as well as our own business activities, which would have a material adverse effect on the Company and its viability and prospects.
The terms of our indebtedness, including the covenants and the dates on which principal and interest payments on our indebtedness are due, increases the risk that we will be unable to continue as a going concern. To continue as a going concern over the next twelve months, we must make payments on our debt as they come due and comply with the covenants in the agreements governing our indebtedness or, if we fail to do so, to (i) negotiate and obtain waivers of or forbearances with respect to any defaults that occur with respect to our indebtedness, (ii) amend, replace, refinance or restructure any or all of the agreements governing our indebtedness, and/or (iii) otherwise secure additional capital. However, we cannot provide any assurances that we will be successful in accomplishing any of these plans.
| 34 |
| Table of Contents |
Risks Related to Ownership of Our Common Stock and our status as a Public Company
Trading in our stock is subject to regulatory restrictions that limit a shareholder’s ability to buy and sell our stock.
There is currently a very limited trading market for our stock, and applicable SEC and other rules may prevent such a market from developing. For example:
| ·
| Our stock is categorized as a “penny stock” under applicable SEC rules. SEC rules impose certain sales practice requirements on broker-dealers who sell penny stocks that do not apply to other securities, including a requirement that a broker-dealer deliver a standardized risk disclosure document prior to completing a transaction in a penny stock. Similarly, FINRA places certain restrictions on transactions involving low-priced securities, including our common stock. Our common stock is not listed on any national securities exchange, and it does not currently qualify for listing on any major exchange, including the New York Stock Exchange or Nasdaq. |
The above factor limits liquidity in the market for our common stock, and may therefore make it more difficult for our shareholders to sell their stock. The lack of trading in our stock may in turn make it more difficult for us to raise capital through issuances of stock, as potential investors may be reluctant to invest given the difficulties they may face if they later choose to sell the stock they purchase.
The price of our common stock may be volatile and fluctuate substantially.
The market price of our common stock is likely to be highly volatile and may fluctuate substantially due to the following factors (in addition to the other risk factors described in this section):
|
| · | actual or anticipated fluctuations in our results of operations; |
|
| · | variance in our financial performance from the expectations of equity research analysts; |
|
| · | conditions and trends in the markets we serve; |
|
| · | announcements of significant new services or products by us or our competitors; |
|
| · | additions of or changes to key employees; |
|
| · | changes in market valuations or earnings of our competitors; |
|
| · | the trading volume of our common stock; |
|
| · | future sales of our equity securities; |
|
| · | changes in the estimation of the future sizes and growth rates of our markets; |
|
| · | legislation or regulatory policies, practices or actions; and |
|
| · | general economic conditions. |
In addition, the stock markets in general have experienced extreme price and volume fluctuations that have at times been unrelated or disproportionate to the operating performance of the particular companies affected. These market and industry factors may materially harm the market price of our common stock irrespective of our operating performance.
| 35 |
| Table of Contents |
Mr. Vincent Browne controls a significant amount of our shares, and his interests may not align with the interests of our other stockholders.
Currently, our CEO and Chairman of the Board, Mr. Vincent Browne, holds approximately 94.5% of total voting power and a 50.7% beneficial ownership in our company and we expect that he will continue to have substantial control of our Company. This significant concentration of share ownership and voting power may adversely affect or reduce the trading price of our common stock because investors often perceive a disadvantage in owning shares in a company with one or several controlling stockholders. Mr. Browne has the ability to significantly influence or control the outcome of all matters requiring stockholders’ approvals, including electing and removing directors and management and approving mergers or other business combination transactions. He also has the ability to significantly influence or control the approval of significant corporate transactions. These actions may be taken even if they are opposed by our other stockholders. This concentration of share ownership and voting power may also discourage, delay or prevent a change in control of our company, which could deprive our stockholders of an opportunity to receive a premium for their shares as part of a possible sale of our company. Accordingly, no persons should purchase any shares unless they are willing to entrust all aspects of control to our management.
In addition, at the present time, Mr. Browne is also the owner, sole officer and director of Growthcap Investments Inc., VestCo Corp. and Power Clouds Holdings Pte. Ltd. Mr. Browne has fiduciary duties to both us and Growthcap, VestCo Corp. and Power Clouds Holdings Pte. Ltd., and may become subject to conflicts of interest on certain matters where Growthcap, VestCo Corp. or Power Clouds Holding’s interests may not be aligned with the interests of our minority stockholders. For more information regarding our principal stockholders, see “Security Ownership of Certain Beneficial Owners and Management”.
We currently do not intend to pay dividends on our common stock.
We do not currently anticipate that we will pay any cash dividends on shares of our common stock for the foreseeable future. Any determination to pay dividends in the future will be at the discretion of our Board of Directors and will depend on results of operations, financial condition, contractual restrictions, restrictions imposed by applicable law and other factors our Board of Directors deems relevant.
Transfers or issuances of our equity may impair or reduce our ability to utilize our net operating loss carryforwards and certain other tax attributes in the future.
Section 382 of the Code contains rules that limit the ability of a company that undergoes an “ownership change” to utilize its net operating loss and tax credit carry forwards and certain built-in losses recognized in years after the ownership change. An “ownership change” is generally defined as an increase in ownership of a corporation’s stock by more than 50 percentage points over a rolling three-year period by stockholders that own (directly or indirectly), or are treated as owning, 5% or more of the stock of a corporation at any time during the relevant rolling three-year period. If an ownership change occurs, Section 382 imposes an annual limitation on the use of pre-ownership change net operating losses, credits and certain other tax attributes to offset taxable income earned after the ownership change. The annual limitation is equal to the product of the applicable long-term tax exempt rate in effect for the month in which the ownership change occurs and the value of the company’s stock immediately before the ownership change (with some adjustments). For example, this annual limitation may be adjusted to reflect any unused annual limitation for prior years and certain recognized (or treated as recognized) built-in gains and losses for the year. In addition, Section 383 generally limits the amount of tax liability in any post-ownership change year that can be reduced by pre-ownership change tax credit carryforwards or capital loss carryforwards.
No assurance can be given that subsequent transactions (including an issuance of additional shares of our common stock) will not result in an ownership change. Even if a subsequent transaction does not result in an ownership change, it may materially increase the likelihood that we will undergo an ownership change in the future. Also, sales of stock by stockholders, whose interests may differ from our interests, may increase the likelihood that we undergo, or may cause, an ownership change. If we were to undergo another “ownership change,” it could have a material adverse effect on our business, financial condition, results of operations and cash flows.
| 36 |
| Table of Contents |
If securities or industry analysts do not publish research or reports or publish unfavorable research or reports about our business, our stock price and trading volume could decline.
The trading market for our common stock will depend in part on the research and reports that securities or industry analysts publish about us, our business, our market or our competitors. We may not obtain research coverage by securities and industry analysts. If no securities or industry analysts commence coverage of the Company, the trading price for our stock could be negatively impacted. In the event we obtain securities or industry analyst coverage, if one or more of the analysts who covers us publishes unfavorable research or reports or downgrades our stock, our stock price would likely decline. If one or more of these analysts ceases to cover us or fails to regularly publish reports on us, interest in our stock could decrease, which could cause our stock price or trading volume to decline.
Our articles of incorporation contain anti-takeover provisions that could have a material and adverse effect on the rights of holders of our common stock.
Our articles of incorporation limit the ability of others to acquire control of our company or cause us to engage in change of control transactions. These provisions could have the effect of depriving our shareholders of an opportunity to sell their shares at a premium over prevailing market prices by discouraging third parties from seeking to obtain control of our company in a tender offer or similar transaction. For example, our Board of Directors has the authority, without further action by our shareholders, to issue preferred shares in one or more series and to fix their designations, powers, preferences, privileges and relative participating, optional or special rights and the qualifications, limitations or restrictions, including dividend rights, conversion rights, voting rights, terms of redemption and liquidation preferences, any or all of which may be greater than the rights associated with our common stock. Preferred shares could be issued quickly with terms calculated to delay or prevent a change in control of our company or make removal of management more difficult. If our Board of Directors decides to issue preferred shares, the price of our common stock may fall and the voting and other rights of the holders of our common stock may be materially and adversely affected.
Indemnification rights held by our directors and officers may result in substantial expenditures by our company and may discourage lawsuits against our directors and officers.
The indemnification obligations provided in our articles of incorporation, our bylaws and contractually to our directors and officers could result in the Company incurring substantial expenditures to cover the cost of settlement or damage awards against directors and officers, which we may be unable to recoup. These provisions and resulting costs may also discourage us from bringing a lawsuit against directors and officers for breaches of their fiduciary duties, and may similarly discourage the filing of derivative litigation by our shareholders against our directors and officers even though such actions, if successful, might otherwise benefit us and our shareholders. We may also provide indemnification rights to our employees with similar results.
If we fail to implement and maintain an effective system of internal controls, we may be unable to accurately report our results of operations or prevent fraud or fail to meet our reporting obligations and investor confidence may be materially and adversely affected.
As a smaller reporting company as defined in Rule 12b-2 under the Securities Exchange Act of 1934, as amended, we are required to evaluate our internal control over financial reporting under Section 404 of the Sarbanes-Oxley Act of 2002 (“Section 404”). Section 404 requires us to include an internal control report with the Annual Report on Form 10-K. This report must include management’s assessment of the effectiveness of our internal control over financial reporting as of the end of the fiscal year. This report must also include disclosure of any material weaknesses in internal control over financial reporting that we have identified. In addition, once we cease to be an “emerging growth company” as such term is defined in the JOBS Act, our independent registered public accounting firm may need to report on the effectiveness of our internal control over financial reporting.
Our management may conclude that our internal control over financial reporting is not effective. Moreover, even if our management concludes that our internal control over financial reporting is effective, our independent registered public accounting firm, after conducting its own independent testing, may issue a report that is qualified if it is not satisfied with our internal controls or the level at which our controls are documented, designed, operated or reviewed, or if it interprets the relevant requirements differently from us. In addition, our reporting obligations may place a significant strain on our management, operational and financial resources and systems for the foreseeable future. We currently have limited accounting personnel and other resources with which to address our internal controls and procedures. Therefore, we may be unable to timely complete our evaluation testing and any required remediation.
| 37 |
| Table of Contents |
If we fail to maintain the adequacy of our internal control over financial reporting, as these standards are modified, supplemented or amended from time to time, we may not be able to conclude on an ongoing basis that we have effective internal control over financial reporting in accordance with Section 404. If we fail to achieve and maintain an effective internal control environment, we could suffer material misstatements in our financial statements and fail to meet our reporting obligations, which would likely cause investors to lose confidence in our reported financial information. This could in turn limit our access to capital markets, harm our results of operations and lead to a decline in the trading price of our common stock. Additionally, ineffective internal control over financial reporting could expose us to increased risk of fraud or misuse of corporate assets and subject us to potential delisting from the stock exchange on which we list, regulatory investigations and civil or criminal sanctions. We may also be required to restate our financial statements from prior periods.
We are an “emerging growth company” under the JOBS Act of 2012, and we cannot be certain if the reduced disclosure requirements applicable to emerging growth companies will make our common stock less attractive to investors.
We are an “emerging growth company,” as defined in the Jumpstart Our Business Startups Act of 2012 (“JOBS Act”), and we may take advantage of certain exemptions from various reporting requirements that are applicable to other public companies that are not “emerging growth companies” including, but not limited to, not being required to comply with the auditor attestation requirements of Section 404 of the Sarbanes-Oxley Act, reduced disclosure obligations regarding executive compensation in our periodic reports and proxy statements, and exemptions from the requirements of holding a nonbinding advisory vote on executive compensation and shareholder approval of any golden parachute payments not previously approved. We cannot predict if investors will find our common stock less attractive because we may rely on these exemptions. If some investors find our common stock less attractive as a result, there may be a less active trading market for our common stock and our stock price may be more volatile.
In addition, Section 107 of the JOBS Act also provides that an “emerging growth company” can take advantage of the extended transition period provided in Section 7(a)(2)(B) of the Securities Act for complying with new or revised accounting standards. In other words, an “emerging growth company” can delay the adoption of certain accounting standards until those standards would otherwise apply to private companies. We are choosing to take advantage of the extended transition period for complying with new or revised accounting standards. As a result, our financial statements may not be comparable to those of companies that comply with public company effective dates.
We will remain an “emerging growth company” for up to five years, although we will lose that status sooner if our revenues exceed $1 billion, if we issue more than $1 billion in non-convertible debt in a three year period, or if the market value of our common stock that is held by non-affiliates exceeds $700 million as of any December 31.
Item 1B. Unresolved Staff Comments
Not applicable
Our principal executive offices are located at One World Trade Center, Suite 8500, New York, NY 10007. Our European operations center is located at Suite 11, Plaza 212, Blanchardstown Corporate Park 2, Dublin 15, D15 PK64, Ireland.
As of December 31, 2019, we had 5 leased facilities located in 7 countries. These included five office facilities located in the United States, Ireland, Romania, Germany and the Netherlands, and land leases in Romania, Italy, Germany and the Netherlands on which our operating solar parks are situated. Our solar park portfolio consists of an aggregate total of approximately 100 acres of land and rooftop space with a combined capacity of 40.8MW. All of our facilities are leased, with terms ranging from monthly leases to 25 years.
| 38 |
| Table of Contents |
The following table provides the location for our most significant facilities, as of December 31, 2019:
| Location |
| Type of Facility |
| Leased Properties: | ||
| New York, NY USA |
| Office: Corporate Headquarters |
| Dublin, Ireland |
| Office: European Operations Center |
| Romania |
| Office |
| Frankfurt, Germany |
| Office |
| Schiphol, Netherlands |
| Office |
| Romania |
| Land Lease |
| Italy |
| Rooftop and Land Lease |
| Germany |
| Rooftop and Land Lease |
| Netherlands |
| Land Lease |
We believe that all of our facilities are in good condition and are well maintained. Our facilities are used for current operations. For additional information regarding obligations under operating leases, see Note 7, “Commitments and Contingencies,” to our audited Consolidated Financial Statements included elsewhere in this report.
The costs associated with our properties can be found in Note 6 to our consolidated financial statements.
See Note 8. Commitments and Contingencies to our consolidated financial statements included in this Annual Report on Form 10-K for disclosures concerning our legal proceedings, which disclosures are incorporated herein by reference
Item 4. Mine Safety Disclosures
Not applicable.
| 39 |
| Table of Contents |
Market Information
Our Class A common stock is currently quoted on the OTC Pink stock market, under the symbol “ALTN.” Trading in our common stock is limited.
The following table sets forth the high and low bid prices of our common stock during the last two fiscal years and (from January 1, 2018 to December 31, 2019). These prices reflect inter-dealer quotations, without retail mark-up, mark-down or commission and may not necessarily represent actual transactions.
| Quarter Ended |
| High Bid |
|
| Low Bid |
| ||
| Fiscal year ended December 31, 2020: |
|
|
|
|
|
| ||
| June 30, 2020 |
| $ | 0.13 |
|
| $ | 0.07 |
|
| March 31, 2020 |
| $ | 0.20 |
|
| $ | 0.08 |
|
| Fiscal year ending December 31, 2019: |
|
|
|
|
|
|
|
|
| December 31, 2019 |
| $ | 0.30 |
|
| $ | 0.15 |
|
| September 30, 2019 |
| $ | 0.35 |
|
| $ | 0.17 |
|
| June 30, 2019 |
| $ | 0.58 |
|
| $ | 0.06 |
|
| March 31, 2019 |
| $ | 0.17 |
|
| $ | 0.03 |
|
| Fiscal year ended December 31, 2018: |
|
|
|
|
|
|
|
|
| December 31, 2018 |
| $ | 0.14 |
|
| $ | 0.02 |
|
| September 30, 2018 |
| $ | 0.15 |
|
| $ | 0.06 |
|
| June 30, 2018 |
| $ | 0.15 |
|
| $ | 0.05 |
|
| March 31, 2018 |
| $ | 0.20 |
|
| $ | 0.07 |
|
| 40 |
| Table of Contents |
Holders
As of December 31, 2019, there were approximately 128 holders of record of our Class A Common Stock, and one holder of record of our Class B Common Stock.
Dividends
We currently intend to retain all available funds and any future earnings to fund the development and growth of our business, and therefore we do not anticipate paying any cash dividends in the foreseeable future.
Additionally, our ability to pay dividends on our common stock will be limited by restrictions on the ability of our subsidiaries and us to pay dividends or make distributions under the terms of current and any future agreements governing our indebtedness. Any future determination to pay dividends will be at the discretion of our Board of Directors, subject to compliance with covenants in our current and future agreements governing our indebtedness, and will depend upon our results of operations, financial condition, capital requirements and other factors that our Board of Directors deems relevant.
In addition, since we are a holding company, substantially all of the assets shown on our consolidated balance sheet are held by our subsidiaries. Accordingly, our earnings, cash flow and ability to pay dividends are largely dependent upon the earnings and cash flows of our subsidiaries and the distribution of profits from the operating subsidiaries to us as the parent company.
Recent Issuance of Unregistered Securities
We issued the following unregistered securities during the fiscal year ended December 31, 2019:
| · | We issued 22,165,876 shares of Class A Common Stock valued at $1,458,314 based on the market price of the stock on date of issuance, in exchange for services rendered. |
|
| · | We issued 290,000 shares of Class A Common Stock as partial consideration for gross proceeds of $290,000. |
| · | We issued 15,000,000 shares of Class B Common Stock to Growthcap Investments Inc., a company controlled by our CEO, Mr. Browne, in exchange for the return of 15,000,000 shares of Class A Common Stock. | |
|
| · | We issued 5,000,000 shares of Series E Convertible Preferred Stock in exchange for the return of 50,000,000 shares of Class A Common Stock. |
We issued the following unregistered securities during the fiscal year ended December 31, 2018:
|
| · | During the year ended December 31, 2018, the Company issued a total of 9,250,000 shares of restricted common stock in exchange for services rendered. The value was based on the stock price of the various dates of issuance equal to $516,500 and is recorded in selling, general and administrative expenses. |
|
| · | On November 27, 2018 the 30,000,000 shares of Series D Convertible Preferred Stock held by Power Clouds Holdings Pte. Ltd. automatically converted into 30,000,000 shares of restricted Class A common stock due to the increase in total authorized common shares to 450,000,000. |
Each of the securities offerings or transactions described above was exempt from registration under Regulation S, Regulation D or Section 4(a)(2) of the Securities Act. The shares issued in these transactions were restricted (i.e., not freely tradable), and the certificates evidencing such shares contained a legend (1) stating that the shares have not been registered under the Securities Act, and (2) setting forth or referring to the restrictions on transferability and sale of the shares under the Securities Act.
| 41 |
| Table of Contents |
Item 6. Selected Financial Data
Not applicable.
Item 7. Management’s Discussion and Analysis of Financial Condition and Results of Operations.
Forward-Looking Statements
The following is a discussion and analysis of our financial condition and results of operations for the fiscal years ended December 31, 2019 and 2018. You should read this discussion and analysis together with our Consolidated Financial Statements and related notes and the other financial information included elsewhere in this Annual Report on Form 10-K. This discussion contains forward-looking statements that involve significant risks and uncertainties. As a result of many factors, such as those set forth under “Risk Factors” and elsewhere in this Annual Report on Form 10-K, our actual results may differ materially from those anticipated in these forward-looking statements. See “Cautionary Statement Regarding Forward-Looking Statements.”
Overview
We are a global IPP. We develop, own and operate solar PV parks that connect directly to national power grids. Our current revenue streams are generated from long-term, government-mandated, fixed price supply contracts with terms of between 15-20 years in the form of government FiTs and other energy incentives. Our current contracts deliver annual revenues, of which approximately 75% are generated from these sources with the remaining 25% deriving from revenues generated under contracted PPAs with other energy operators and by sales to the general energy market in the countries we operate. In general, these contracts generate an average sales rate for every kWh of green energy produced by our solar parks. Our current focus is on the European solar PV market. However, we are also actively exploring opportunities in other countries outside of Europe.
The Company is not a manufacturer of solar panels or other related equipment but generates 100% of its revenues from energy sales under long term contracts as described above. By design, we currently focus exclusively on energy generation and as a result, we are technology agnostic and can therefore customize our solar parks based on local environmental and regulatory requirements and continue to take advantage of falling component prices over time.
We use annual contracted revenues as a key metric in our financial management of the business as we feel it better reflects the long-term stability of operations. Annual contracted revenues is defined as the estimated future revenue based on the remaining term, price and estimated production of the offtake contract of the solar park. It must be noted that the actual revenues reported by the Company in a particular year may be lower than the annual contracted revenues because not all parks may be revenue generating for the full year in their first year of operation, and also to allow for timing of acquisitions that take place throughout the financial year.
Our goal is to grow our asset base and within our operations provide sufficient liquidity for recurring growth capital expenditures and general purposes. We expect to achieve this growth and deliver returns by focusing on the following initiatives:
Value-Oriented Acquisitions:
We focus on sourcing off-market transactions at more attractive valuations than auction processes. We believe that targeting smaller solar projects 1MW to 20 MWs and working within country developer partners allows us to acquire high quality assets at attractive relative values. We continue to develop an acquisition pipeline across our scope of operations.
Margin Enhancements:
We believe there is significant opportunity to enhance our cash flow through optimizing the performance of our existing assets. In the second quarter of 2019, we executed service agreements with BayWa r.e., such agreements provide reduction in operations and maintenance expense, provide 24/7 monitoring of our assets and increase revenue through deployment of technology.
| 42 |
| Table of Contents |
Factors that Significantly Affect our Results of Operations and Business
We expect the following factors will affect our results of operations:
Offtake contracts
Our revenue is primarily a function of the volume of electricity generated and sold by our renewable energy facilities as well as, where applicable, the sale of green energy certificates and other environmental attributes related to energy generation. Our current portfolio of renewable energy facilities is generally contracted under long-term FiT program or PPAs with creditworthy counterparties. As of December 31, 2019, the weighted average remaining life of our FiT and PPAs was 13 years. Pricing of the electricity sold under these FiT and PPAs is generally fixed for the duration of the contract, although some of our PPAs have price escalators based on an index (such as the consumer price index) or other rates specified in the applicable PPA.
We also generate RECs as we produce electricity. RECs are accounted for as governmental incentives and are considered operational revenue as part of the solar facilities. These RECs are currently sold pursuant to agreements with third parties and the arrangements is recognized as the underlying electricity is generated.
Project operations and generation availability
Our revenue is a function of the volume of electricity generated and sold by our renewable energy facilities. The volume of electricity generated and sold by our renewable energy facilities during a particular period is impacted by the number of facilities that have achieved commercial operations, as well as both scheduled and unexpected repair and maintenance required to keep our facilities operational.
The costs we incur to operate, maintain and manage our renewable energy facilities also affect our results of operations. Equipment performance represents the primary factor affecting our operating results because equipment downtime impacts the volume of the electricity that we are able to generate from our renewable energy facilities. The volume of electricity generated and sold by our facilities will also be negatively impacted if any facilities experience higher than normal downtime as a result of equipment failures, electrical grid disruption or curtailment, weather disruptions, or other events beyond our control.
Seasonality and resource variability
The amount of electricity produced and revenues generated by our solar generation facilities is dependent in part on the amount of sunlight, or irradiation, where the assets are located. As shorter daylight hours in winter months result in less irradiation, the electricity generated by these facilities will vary depending on the season. Irradiation can also be variable at a particular location from period to period due to weather or other meteorological patterns, which can affect operating results. As the majority of our solar power plants are located in the Northern Hemisphere (Europe) we expect our current solar portfolio’s power generation to be at its lowest during the first and fourth quarters of each year. Therefore, we expect our first and fourth quarter solar revenue to be lower than in other quarters. As a result, on average, each solar park generates approximately 15% of its annual revenues in Q1 every year, 35% in each of Q2 and Q3, and the remaining 15% in Q4. Our costs are relatively flat over a year, and so we will always report lower profits in Q1 and Q4 as compared to the middle of the year.
Interest rates on our debt
Interest rates on our senior debt are mostly fixed for the full term of the finance at low interest rates ranging from 1.7% to 4.2%. The relative certainty of cash flows and the fixed nature of the senior debt payments provide sufficient coverage ratios. Additionally, our senior financing is project specific with no cross-collateralization and with no recourse to the parent. In this environment all free cash flows therefore are available to cover corporate costs and for reinvestment in new projects.
In addition to the project specific senior debt, we use a small amount of promissory notes that reduces, and in some cases eliminates, the requirement for us to provide equity in the acquisition of the projects. As of December 31, 2019, 89% of our total liabilities was project related debt.
| 43 |
| Table of Contents |
Cash distribution restrictions
In certain cases, we obtain project-level or other limited or non-recourse financing for our renewable energy facilities which may limit our ability to distribute funds to the parent company, Alternus Energy Inc. for corporate operational costs. These limitations typically require that the project-level cash is used to meet debt obligations and fund operating reserves of the operating subsidiary. These financing arrangements also generally limit our ability to distribute funds generated from the projects if defaults have occurred or would occur with the giving of notice or the lapse of time, or both.
Renewable energy facility acquisitions and investments
Our long-term growth strategy is dependent on our ability to acquire additional renewable power generation assets. This growth is expected to be comprised of additional acquisitions across our scope of operations both in our current focus countries and new countries.
Renewable power has been one of the fastest growing sources of electricity generation globally over the past decade. We expect the renewable energy generation segment in particular to continue to offer growth opportunities driven by:
| · | the continued reduction in the cost of solar and other renewable energy technologies, which we believe will lead to grid parity in an increasing number of markets; |
|
|
|
| · | distribution charges and the effects of an aging transmission infrastructure, which enable renewable energy generation sources located at a customer’s site, or distributed generation, to be more competitive with, or cheaper than, grid-supplied electricity; |
|
|
|
| · | the replacement of aging and conventional power generation facilities in the face of increasing industry challenges, such as regulatory barriers, increasing costs of and difficulties in obtaining and maintaining applicable permits, and the decommissioning of certain types of conventional power generation facilities, such as coal and nuclear facilities; |
|
|
|
| · | the ability to couple renewable energy generation with other forms of power generation and/or storage, creating a hybrid energy solution capable of providing energy on a 24/7 basis while reducing the average cost of electricity obtained through the system; |
|
|
|
| · | the desire of energy consumers to lock in long-term pricing for a reliable energy source; |
|
|
|
| · | renewable energy generation’s ability to utilize freely available sources of fuel, thus avoiding the risks of price volatility and market disruptions associated with many conventional fuel sources; |
|
|
|
| · | environmental concerns over conventional power generation; and |
|
|
|
| · | government policies that encourage development of renewable power, such as country, state or provincial renewable portfolio standard programs, which motivate utilities to procure electricity from renewable resources. |
Access to capital markets
Our ability to acquire additional clean power generation assets and manage our other commitments will likely be dependent on our ability to raise or borrow additional funds and access debt and equity capital markets, including the equity capital markets, the corporate debt markets and the project finance market for project-level debt. We accessed the capital markets several times in 2018 and 2019, in connection with long-term project debt, and corporate loans and equity. Limitations on our ability to access the corporate and project finance debt and equity capital markets in the future on terms that are accretive to our existing cash flows would be expected to negatively affect our results of operations, business and future growth.
| 44 |
| Table of Contents |
Foreign exchange
Our operating results are reported in United States Dollars. Our current projects revenue and expenses are generated in other currencies, including the Euro, and the Romanian LEI. This mix may continue to change in the future if we elect to alter the mix of our portfolio within our existing markets or elect to expand into new markets. In addition, our investments (including intercompany loans) in renewable energy facilities in foreign countries are exposed to foreign currency fluctuations. As a result, we expect our revenues and expenses will be exposed to foreign exchange fluctuations in local currencies where our renewable energy facilities are located. To the extent we do not hedge these exposures, fluctuations in foreign exchange rates could negatively impact our profitability and financial position.
EPC costs for Solar Projects
EPC costs for solar projects include the costs of construction, connection and procurement. The most significant contributor to EPC costs is the cost of components such as modules, inverters and mounting systems. Our supplier and technology, agnosticism, our strong supply chain management and our strong relationships with equipment suppliers have enabled us to historically purchase equipment at relatively competitive technical performance, prices, terms and conditions.
In recent years, the prices of modules, inverters and mounting systems have decreased as a result of oversupply and improving technology. As the costs of our components have decreased, our solar parks have become more cost competitive and our profitability has increased. As a result, our solar parks have begun to offer electricity at increasingly competitive rates, which has increased the attractiveness of our investment return and our revenue. We expect the cost of components will continue to gradually decrease. Moreover, newly commercialized PV technologies are expected to further drive down EPC costs and increase the energy output of PV systems, which will further increase the competitiveness of our solar parks and allow solar energy to achieve grid parity in more and more markets.
Key Metrics
Operating Metrics
We regularly review a number of operating metrics to evaluate our performance, identify trends affecting our business, formulate financial projections and make certain strategic decisions. We consider a solar park operating when it has achieved connection and begins selling electricity to the energy grid.
Operating Nameplate capacity
We measure the electricity-generating production capacity of our renewable energy facilities in nameplate capacity. We express nameplate capacity in direct current (“DC”), for all facilities. The size of our renewable energy facilities varies significantly among the assets comprising our portfolio.
We believe the combined nameplate capacity of our portfolio is indicative of our overall production capacity and period to period comparisons of our nameplate capacity are indicative of the growth rate of our business. The table below outlines our operating renewable energy facilities as of December 31, 2018 and 2019.
| MWs (DC) Nameplate Capacity by Country |
| 2019 |
|
| 2018 |
| ||
| Romania |
|
| 6.1 |
|
|
| 6.1 |
|
| Italy |
|
| 7.9 |
|
|
| 2.9 |
|
| Germany |
|
| 1.4 |
|
|
| - |
|
| Netherlands |
|
| 11.8 |
|
|
| - |
|
| Total |
|
| 27.2 |
|
|
| 9.0 |
|
In addition to the above, as of December 31, 2019, we own an additional 13.6MW of projects that are still under construction...
| 45 |
| Table of Contents |
Megawatt hours sold
Megawatt hours (“MWh”) sold refers to the actual volume of electricity sold by our renewable energy facilities during a particular period. We track kWh sold as an indicator of our ability to realize cash flows from the generation of electricity at our renewable energy facilities. Our kWh sold for renewable energy facilities for the year ended December 31, 2019 and 2018, were as follows:
| MWhs by Country |
| 2019 |
|
| 2018 |
| ||
| Romania |
|
| 6,476,760 |
|
|
| 6,574,852 |
|
| Italy |
|
| 5,177,688 |
|
|
| 1,951,467 |
|
| Germany |
|
| 1,027,144 |
|
|
| - |
|
| Netherlands |
|
| 72,032 |
|
|
| - |
|
| Total |
|
| 12,753,624 |
|
|
| 8,526,319 |
|
Consolidated Results of Operations
The following table illustrates the consolidated results of operations for the year ended December 31, 2019 and 2018.
|
|
| 2019 |
|
| 2018 |
| ||
| Revenues |
| $ | 2,585,568 |
|
| $ | 2,592,964 |
|
| Cost of revenues |
|
| (738,097 | ) |
|
| (1,278,614 | ) |
| Gross Profit |
|
| 1,847,471 |
|
|
| 1,314,350 |
|
| Operating Expenses |
|
|
|
|
|
|
|
|
| Selling, general and administrative |
|
| 4,453,155 |
|
|
| 1,817,567 |
|
| Loss on disposal of investment in energy asset |
|
| - |
|
|
| 681,421 |
|
| Depreciation, amortization, and accretion |
|
| 1,193,107 |
|
|
| 699,573 |
|
| Total Operating Expenses |
|
| 5,646,262 |
|
|
| 3,198,561 |
|
| Loss from Operations |
|
| (3,798,791 | ) |
|
| (1,884,211 | ) |
| Other Income (Expense) |
|
|
|
|
|
|
|
|
| Interest expense |
|
| (3,210,299 | ) |
|
| (1,412,864 | ) |
| Other income (expense) |
|
| (132,976 | ) |
|
| 480 |
|
| Gain on bargain purchase |
|
| 4,113,148 |
|
|
| 1,623,883 |
|
| Total other income (expense) |
|
| 769,873 |
|
|
| 211,499 |
|
| (Loss) Before Provision for Income Taxes |
|
| (3,028,918 | ) |
|
| (1,672,712 | ) |
| Provision for Income Taxes |
|
| - |
|
|
| (180,000 | ) |
| Net Loss |
| $ | (3,028,918 | ) |
| $ | (1,852,712 | ) |
Major Components of Our Results of Operations
For the year ended December 31, 2019 compared to December 31, 2018.
We generate our revenue from the sale of electricity from our solar parks. The revenue is either from a Feed in Tariff (Fit) program, Power Purchase Agreement (PPA), or Renewable Energy Credit (RECs)
| 46 |
| Table of Contents |
Operating Revenues, net
Operating revenues, net for the for the year ended December 31, 2019 and 2018 were as follows:
| Net Revenue, by Country |
| 2019 |
|
| 2018 |
|
| Change |
| |||
| Italy |
| $ | 1,533,298 |
|
| $ | 829,794 |
|
| $ | 703,504 |
|
| Romania |
|
| 932,382 |
|
|
| 1,763,170 |
|
|
| (830,788 | ) |
| Germany |
|
| 106,734 |
|
|
| - |
|
|
| 106,734 |
|
| Netherlands |
|
| 13,154 |
|
|
| - |
|
|
| 13,154 |
|
| Total |
| $ | 2,585,568 |
|
| $ | 2,592,964 |
|
| $ | (7,396 | ) |
Net revenue decreased slightly for the year ended 2019 compared to 2018. The decrease was due to lower production and no energy trading revenue in Romania, and offset by the new acquisitions in Italy, Germany, and the Netherlands.
| Net Revenue, by Offtake Type |
| 2019 |
|
| 2018 |
|
| Change |
| |||
| Feed in Tariff |
| $ | 1,653,186 |
|
| $ | 829,794 |
|
| $ | 823,392 |
|
| Green Certificates |
|
| 631,740 |
|
|
| 789,740 |
|
|
| (158,000 | ) |
| Energy Offtake Agreements |
|
| 300,642 |
|
|
| 973,430 |
|
|
| (672,788 | ) |
| Total |
| $ | 2,585,568 |
|
| $ | 2,592,964 |
|
| $ | (7,396 | ) |
Cost of Revenues
We capitalize the equipment costs, development costs, engineering and construction related costs. Our cost of revenues with regards to our IPP solar parks primarily is a result of the asset management, operations and maintenance, as well as tax, insurance, and lease expenses. Certain economic incentive programs, such as FiT regimes, generally include mechanisms that ratchet down incentives over time. As a result, we seek to connect our IPP solar parks to the local power grids and commence operations in a timely manner to benefit from more favorable existing incentives. Therefore, we generally seek to make capital investments during times when incentives are most favorable.
Cost of revenues for the year ended December 31, 2019 and 2018 were as follows:
| Cost of Revenue, by Country |
| 2019 |
|
| 2018 |
|
| Change |
| |||
| Italy |
| $ | 206,149 |
|
| $ | 132,776 |
|
| $ | 73,373 |
|
| Romania |
|
| 490,001 |
|
|
| 1,145,838 |
|
|
| (655,837 | ) |
| Germany |
|
| 41,947 |
|
|
| - |
|
|
| 41,947 |
|
| Netherlands |
|
| - |
|
|
| - |
|
|
| - |
|
| Total |
| $ | 738,097 |
|
| $ | 1,278,614 |
|
| $ | (540,517 | ) |
Cost of revenue decreased by $540,517 for the year ended December 31, 2019, compared to 2018. This was due to reduction of operating costs in the Romania plant specific to reduction of operations and maintenance cost and no expenses related to energy trading. Gross profit in Italy was significantly higher than Romania due to the fact that in 2018 Romania had higher costs associated with the sale of energy and green certificates, which decreased the profit margin.
Gross profit
Gross profit is equal to revenue less cost of revenues. Our gross profit depends on a combination of factors, including primarily our revenue model, the geographic distribution of the solar parks, the mix of electricity sold during the reporting period, the costs of services outsourced to third-party contractors and management costs.
| 47 |
| Table of Contents |
Gross profit for the years ended December 31, 2019 and 2018 were as follows:
|
|
| For the Year Ended |
| |||||||||
| Gross Profit, by Country |
| 2019 |
|
| 2018 |
|
| Change |
| |||
| Italy |
| $ | 1,327,149 |
|
| $ | 697,018 |
|
| $ | 630,131 |
|
| Romania |
|
| 442,381 |
|
|
| 617,332 |
|
|
| (174,951 | ) |
| Germany |
|
| 64,787 |
|
|
| - |
|
|
| 64,787 |
|
| Netherlands |
|
| 13,154 |
|
|
| - |
|
|
| 13,154 |
|
| Total |
| $ | 1,847,471 |
|
| $ | 1,314,350 |
|
| $ | 533,121 |
|
|
|
|
|
|
|
|
|
|
|
|
|
|
|
| Gross Profit % |
|
| 71.5 | % |
|
| 50.7 | % |
|
| 20.8 | % |
Gross profit increased for the year ended December 31, 2019 by $533,121 compared to 2018, which was due to higher sales volume and lower cost of revenue in Italy as a result of the new acquisition. In January of 2019, we executed a new operations and maintenance agreement with Baywa, which lowered our operations and maintenance cost in Romania by 13%. In 2018 Romania had higher costs associated with the sale of energy and green certificates, which decreased the profit margin.
Selling, General and Administrative Expenses
Selling, general and administrative expenses for the years ended December 31, 2019 and 2018 were as follows:
|
|
| 2019 |
|
| 2018 |
|
| Change |
| |||
| Selling, General and Administrative Expenses |
|
| 4,453,155 |
|
|
| 1,817,567 |
|
|
| (2,635,588 | ) |
| Total |
| $ | 4,453,155 |
|
| $ | 1,817,567 |
|
| $ | (2,635,588 | ) |
Selling, general and administrative expenses increased from for the year ended 2019 compared to 2018. This was mainly due to additional stock compensation of $947,061, and accounting, legal and consulting fees of $699,958 related to our audits and Form 10 filings, $492,061 of costs associated with acquisitions. In addition, in the fourth quarter of 2018, the Company hired a full time General Counsel and Chief Financial Officer.
Acquisition Costs
As discussed in Note 4. Acquisitions and Dispositions to our consolidated financial statements, the Company acquired four SPVs in April of 2019 and one SPV in December of 2019. These projects were considered business combinations under GAAP and therefore the acquisition costs were expensed and not capitalized. The expenses were included in selling general and administrative expenses.
Acquisition costs were $492,061 for the year ended December 31, 2019, and consisted, primarily of advisory fees, commissions to third parties and professional fees for legal and accounting services. There were no acquisition costs incurred for the year ended December 31, 2018.
Depreciation, Accretion and Amortization Expense
Depreciation, accretion and amortization expense increased by $506,466 for the year ended December 31, 2019, compared to 2018, primarily as a result of incremental depreciation, accretion and amortization associated with the acquisition of the Italian renewable energy assets in the second quarter of 2019.
Interest Expense, Net
|
|
| For the Year Ended |
| |||||||||
|
|
| 2019 |
|
| 2018 |
|
| Change |
| |||
| Interest Expense |
|
| (3,210,299 | ) |
|
| (1,412,864 | ) |
|
| (1,797,435 | ) |
| Total |
| $ | (3,210,299 | ) |
| $ | (1,412,864 | ) |
| $ | (1,797,435 | ) |
| 48 |
| Table of Contents |
Interest expense increased for the year ended December 31, 2019, compared to 2018, primarily as a result of interest expenses associated with warrant issuance for debt of $357,635 and interest expense associated with short term financing of the Italy acquisition, which includes third party commission on financing.
Bargain Purchase Gain on Acquisition of Renewable Energy Facilities
In April 2019, PC-Italia-02 S.R.l., a wholly owned subsidiary of Alternus Energy Inc.’s (the “Company”) Netherlands’ subsidiary, completed the acquisition of 100% of the share capital of 4 out of 5 SPVs (Special Purpose Vehicles) the Company planned to purchase under a definitive sale and purchase agreement signed with Risen Energy PV Holding Italy GmbH and Risen Energy (HongKong) Co., Limited. The total acquisition consisted of 7 operating photovoltaic plants located in Italy having a total installed capacity of 5.1 MWs in exchange for approximately $8.1M cash, less $1.5M held back for the acquisition of the 5th SPV, and less $0.4M held in escrow for 2 months from closing against certain tax open items and as a hold back for any unexpected items not found in due diligence. The purchase was treated as business combination, as defined by ASC 805, Business Combinations.
The fair value of the purchase consideration issued to the sellers of the project was allocated to the net assets acquired. The Company accounted for the acquisition as the purchase of a business under U.S. GAAP under the acquisition method of accounting, and the assets and liabilities acquired were recorded as of the acquisition date at their respective fair values and consolidated with those of the Company. The fair value of the net assets acquired was approximately $9.9 million, which led to a bargain purchase gain of $4.1M. The excess of the aggregate fair value of the net tangible assets has been treated as a gain on bargain purchase in accordance with ASC 805. The purchase price allocation was based, in part, on management’s knowledge of the project and the results of a fair value assessment that the Company performed.
The Company then undertook a review to determine what factors might contribute to a bargain purchase and if it was reasonable for a bargain purchase to occur. The main reason for the bargain purchase price was a motivated seller who was looking to exit the business. The seller is manufacture of product for the solar industry and not an operator. Part of their strategy to increase product sales is to develop and construct solar projects. The seller is not a long-term operator like Alternus, so their strategy is to not keep operating assets on their books for the long-term. Also, because of the small size of the operating assets we purchased and the fact that they were spread out across Italy made it more difficult for the seller to manage the assets since they are not an operator. This led to their willingness to sale the assets at a market discount. Subsequent to the acquisition of solar park, Alternus Energy signed a letter of intent with the seller to purchase an additional 10MWs of similar solar Projects at a price of 18.5M (euros). The price per MW was 1.85M (Euros) for an uninstalled asset as compared to the 1.35M (euros) they sold the operating asset for. Further, at the time of sale, Alternus has no side agreement or other commitment to purchase any assets from the seller. The difference between the bargain purchase gain at acquisition and the amount on the income statement is due to foreign currency translation.
|
|
| Total |
| |
| Cost of acquisitions |
|
|
| |
| Cash paid for assets |
| $ | 6,131,004 |
|
| Total acquisition cost |
| $ | 6,131,004 |
|
|
|
|
|
|
|
| Fair value of assets acquired |
|
|
|
|
| Investment in energy property |
|
| 9,939,414 |
|
| Net working capital acquired |
|
| 384,397 |
|
| Asset retirement liability |
|
| (65,114 | ) |
|
|
| $ | 10,258,697 |
|
|
|
|
|
|
|
| Gain on bargain purchase |
| $ | 4,127,693 |
|
| 49 |
| Table of Contents |
Liquidity and Capital Resources
Capital Resources
A key element to our financing strategy is to raise the majority of our debt in the form of project specific non-recourse borrowings at our subsidiaries with investment grade metrics. Going forward, we intend to primarily finance acquisitions or growth capital expenditures using long-term non-recourse debt that fully amortizes within the asset’s contracted life, as well as retained cash flows from operations and issuance of equity securities through public markets.
The following table summarizes the total capitalization and debt as of December 31, 2019 and 2018:
|
|
| 2019 |
|
| 2018 |
| ||
| Short term line of credit |
| $ | 35,120 |
|
| $ | 73,560 |
|
| Promissory notes related parties |
|
| 48,821 |
|
|
| 207,753 |
|
| Convertible notes related parties |
|
| 291,540 |
|
|
| 284,000 |
|
| Senior secured debt |
|
| 19,575,794 |
|
|
| 10,192,602 |
|
| Promissory notes |
|
| 15,478,536 |
|
|
| 13,278,803 |
|
| Convertible promissory notes |
|
| 2,169,401 |
|
|
| 1,097,289 |
|
| Gross debt |
|
| 37,599,212 |
|
|
| 25,134,007 |
|
| Debt discount |
|
| (784,130 | ) |
|
| (303,563 | ) |
| Net Debt |
|
| 36,815,082 |
|
|
| 24,830,444 |
|
| Less current maturities |
|
| (22,705,665 | ) |
|
| (14,510,204 | ) |
| Long Term Debt, net of current maturities |
| $ | 14,109,417 |
|
| $ | 10,320,240 |
|
Liquidity Position
The notes to our consolidated financial statements contained in this Annual Report on Form 10-K for the year ended December 31,2019 include a disclosure describing the existence of certain conditions that raise substantial doubt about our ability to continue as a going concern. Our auditors’ report on our December 31, 2019 financial statements, reflect that there is substantial doubt about our ability to continue as a going concern for twelve months from the issuance of this Annual Report on Form 10-K.. Our operating revenues are insufficient to fund our operations and our assets already are pledged to secure our indebtedness to various third party secured creditor, respectively. The unavailability of additional financing could require us to delay, scale back or terminate our acquisition efforts as well as our own business activities, which would have a material adverse effect on the Company and its viability and prospects.
The terms of our indebtedness, including the covenants and the dates on which principal and interest payments on our indebtedness are due, increases the risk that we will be unable to continue as a going concern. To continue as a going concern over the next twelve months, we must make payments on our debt as they come due and comply with the covenants in the agreements governing our indebtedness or, if we fail to do so, to (i) negotiate and obtain waivers of or forbearances with respect to any defaults that occur with respect to our indebtedness, (ii) amend, replace, refinance or restructure any or all of the agreements governing our indebtedness, and/or (iii) otherwise secure additional capital. However, we cannot provide any assurances that we will be successful in accomplishing any of these plans.
Our consolidated financial statements as of December 31, 2019 have been prepared under the assumption that we will continue as a going concern. If we are not able to continue as a going concern, it is likely that holders of our common stock will lose all of their investment. Our consolidated financial statements do not include any adjustments that might result from the outcome of this uncertainty. See risk factors relating to our financial condition as well as other risk factors that we face in Part 1, Item 1A hereof under the caption “Risk Factors” above.
| 50 |
| Table of Contents |
As reflected in the accompanying financial statements, the Company had net loss of ($3,028,918) and ($1,852,712) for the years ended December 31, 2019 and 2018, respectively. The Company had accumulated shareholders’ equity of $3,878,161 and $5,034,364 as of December 31, 2019 and December 31, 2018, respectively, and a working capital deficit of $23,772,002 and $14,114,724 as of December 31, 2019 and December 31, 2018, respectively. At December 31, 2019, the Company had $1,076,995 of cash on hand.
The recent outbreak of the corona virus, also known as “COVID-19”, has spread across the globe and is impacting worldwide economic activity. Conditions surrounding the corona virus continue to rapidly evolve and government authorities have implemented emergency measures to mitigate the spread of the virus. The outbreak and the related mitigation measures may have an adverse impact on global economic conditions as well as on the Company’s business activities. The extent to which the corona virus may impact the Company’s business activities will depend on future developments, such as the ultimate geographic spread of the disease, the duration of the outbreak, travel restrictions, business disruptions, and the effectiveness of actions taken in the United States and other countries to contain and treat the disease. These events are highly uncertain and as such, the Company cannot determine their financial impact at this time.
The following table summarizes corporate liquidity and available capital as of December 31, 2019 and 2018:
|
|
| 2019 |
|
| 2018 |
| ||
| Cash and cash equivalents |
|
| 1,076,995 |
|
|
| 1,026,533 |
|
| Restricted cash for future acquisitions |
|
| 349,434 |
|
|
| 8,857,966 |
|
| Available Capital |
| $ | 1,426,429 |
|
| $ | 9,884,499 |
|
The cash was restricted for the acquisition of the 5MWs of project in Italy that occurred in April of 2019.
Financing Activities
Line of Credit:
The credit line is a revolving credit facility available for the payment of trade payables up to the agreed limit. The term is twelve months which was renewed by agreement of both parties. Drawn funds accrue interest annually at a rate of the Romania Central Bank Rate (ROBOR) 3M + 3.3%, which was 6.64% as of December 31, 2019 and 6.6% as of December 31, 2018. The Company had used $35,120 and $71,747 of the facility as of December 31, 2019 and 2018.
Related Party Promissory Notes:
As of December 31, 2019 and 2018, there was an advance from PCH of $48,821 and $207,753 which is short term in nature and non-interest bearing.
Related Party Convertible Notes:
In February of 2019, the terms under which all cash previously loaned by VestCo Corp., a company owned and controlled by, the Company’s CEO, to the Company to date has been amended and restated under the identical investment transaction terms as described below, pursuant to which the Corporation executed a Securities Purchase Agreement with VestCo Corp. and issued to VestCo Corp. i) a convertible promissory note with a 15% OID, and therefore having a Principal Amount of $291,540, having a two year term, secured behind a third party accredited investor via a US UCC filing on all assets of the Corporation, having a call option right for the noteholder, a redemption right for the Corporation, and convertible at $0.20 per share, and ii) a warrant to purchase up to 619,522 shares of the Corporation’s Class A common stock, exercisable at $0.25 per share or through its cashless exercise provision and having a 4 year term.
During the twelve months ended December 31, 2017, the Company issued a $100,000 convertible promissory note to the Chief Executive Office (CEO) and a $100,000 convertible promissory note to VestCo Corp., a company controlled by the CEO, in exchange for $200,000 cash to be provided to the Company as required for working capital purposes. The notes accrue 10% annual interest and are convertible into shares of restricted Class A common stock at $0.20 per share, at the noteholder’s option, and having a repayment date of the earlier of (i) March 31, 2018, or (ii) the closing date of a third party funding/financing/investment in the Company, or (iii) the date upon which Tre Valli Energia S.R.L. may sold by the Company, whichever is the earliest. As the conversion price was above the market price at the time of at the time of issuance of the note no beneficial costs were recorded. As at December 31, 2018, $284,000 was past due under loan notes issued to the CEO, VestCo Corp
| 51 |
| Table of Contents |
Senior secured debt:
In 2016, the Company guaranteed a 6.5 million RON (equivalent to approximately US$1,592,500) promissory note issued by one of its subsidiaries, Power Clouds S.R.L., a Romanian company (“Power Clouds Romania”) to OTP Bank in Romania, which is secured in first position against the Romanian solar parks and customer contracts held by Power Clouds Romania, accruing interest annually at a rate of ROBOR 3M + 3.3% and having a term of 60 months. The Company had principal outstanding of $423,783 and $698,820 as of December 31, 2019 and 2018.
In October of 2018, in order to complete additional solar park acquisitions in Germany, the Company entered into the following agreements with a third party accredited investor (the “Lender”), in connection with the Company’s German subsidiary, PCG_HoldCo UG (PCG) with an interest rate of 12% and a term of 2 years. The Company had principal outstanding of $3,585,366 and $3,644,585 as of December 31, 2019 and 2018.
In December of 2018, PSM 20 GmbH & Co KG entered into a senior secured loan with Sparkase Bank in Germany. This relates to the acquisition of 7 photovoltaic installations as part of the PSM 20 GmbH & Co KG acquisition with an interest rate of 2.10% and a term of 18 years. The Company had principal outstanding of $2,251,298 and $2,587,081 as of December 31, 2019 and 2018.
In April of 2018, PSM 40 GmbH & Co KG entered into a senior secured loan with GLS Bank in Germany. This relates to the acquisition of 6 photovoltaic installations as part of the PSM 40 GmbH & Co KG acquisition with an interest rate of 2.0% and a term of 18 years. The Company had principal outstanding of $2,515,866 and $2,529,212 as of December 31, 2019 and 2018.
In October of 2018, GRT 1.1 GmbH entered into a senior secured loan with MVB Bank in Germany. This relates to the acquisition of 1 photovoltaic installations as part of the GRT GmbH acquisition, with an interest rate of 2.05% and a term of 19 years. The Company had principal outstanding of $671,446 and $715,531 as of December 31, 2019 and 2018.
In December of 2019, as part of the acquisition of Zonnepark Rilland BV we assumed a third-party senior bank debt facility in the amount of approximately $7.7 million, with an interest rate of 1.7% and a term of 14 years. The Company had principal outstanding of $7,366,816 as of December 31, 2019, which was net of the required debt service reserve fund and maintenance reserve fund of $349,434.
In December of 2019, as part of the acquisition of Zonnepark Rilland BV we entered into a $2.4 million bond offering issued by an accredited investor, bearing interest at 8%, amortizing over 8 years. The Company had principal outstanding of $2,411,167 as of December 31, 2019.
Promissory Note:
In December of 2018, in order to complete additional solar park acquisitions in Italy, the Company entered into the following agreements with a third party accredited investor (the “Lender”), in connection with the Company’s German subsidiary, PCG_HoldCo UG (PCG) issuing a loan note, with an interest rate of 12% and a term of 6 months. The Company had principal outstanding of $504,667 ad $4,405,331 as of December 31, 2019 and 2018.
In December of 2018, in order to complete additional solar park acquisitions in Italy, the Company entered into the following agreements with a third party accredited investor (the “Lender”), in connection with the Company’s Netherlands subsidiary, Power Clouds Europe B.V. (PCE) issuing a loan note, with an interest rate of 12% and a term of 6 months. The Company had principal outstanding of $8,857,656 as of December 31, 2018 and the loan was repaid in 2019.
In March of 2019, in order to complete additional solar park acquisitions in Italy, the Company entered into certain loan agreement with a third party accredited investor (the “Lender”), in connection with the Company’s Netherlands subsidiary, AE Europe B.V, with an interest rate of 12% and a term of twelve months. The proceeds of which were used to pay down existing senior secured debt. The Company had principal outstanding of $3,398,063 as of December 31, 2019.
| 52 |
| Table of Contents |
In June of 2019, the Company entered into certain agreements with a third party accredited investor (the “Lender”), in connection with the Company’s Netherlands subsidiary, AE Europe B.V, with an interest rate of 7.5% until October of 2019 and then 10% thereafter and a term of ten months. The proceeds of which were used to pay down existing senior secured debt. The Company had principal outstanding of $9,676,069 as of December 31, 2019. The loan maturity date was extended until May 31, 2020.
In December of 2019, as part of the acquisition of Zonnepark Rilland BV, the Company entered into a $1.9 million loan agreement with the seller of the park, which is due January 31, 2020, with no interest rate. The Company had principal outstanding of $1,895,137 as of December 31, 2019.
On September 30, 2015, as part of the transaction with World Global Assets Pte. Ltd. (WGA), in conjunction with the spin out of WRMT, $492,000 was assigned to various third parties, is not convertible, with interest of 7.5% and a maturity date of December 31, 2020. The Company had principal outstanding of $509,267 as of December 31, 2019 and December 31, 2018, which was included in convertible promissory notes in the above table.
Convertible Promissory Notes:
On September 30, 2015, the Company issued a convertible loan note for $1,000,000 to World Global Assets Pte. Ltd. (WGA), in conjunction with the spin out of WRMT. The note had a three-year term, accrued no interest, and was convertible at a fixed price of $0.20 per share, subject to certain triggers and restrictions. In 2016 a portion of the convertible loan note of approximately $300,000 was assigned to various third parties and is now convertible at market price, with a floor price of $0.20 per share. The Company had principal outstanding of $244,800 and $244,800 as of December 31, 2019 and 2018.
In July of 2018, the Company issued a convertible promissory note to a third party foreign investor in exchange for a cash provided to the Company for working capital purposes. The note accrues 15% annual interest and is convertible into shares of restricted Class A common stock at $0.20 per share, at the noteholder’s option, and is repayable on January 30, 2020. As the conversion price was above the market price at the time of at the time of issuance of the note no beneficial costs were recorded. The Company had principal outstanding of $304,294 and $251,666 as of December 31, 2019 and 2018.
In July of 2018, the Company issued a €80,000 convertible promissory note to a third party foreign consultant in exchange for sales commissions owed. The note accrues 15% annual interest and is convertible into shares of restricted Class A common stock at $0.20 per share, at the noteholder’s option, and is repayable on January 30, 2020. As the conversion price was above the market price at the time of at the time of issuance of the note no beneficial costs were recorded. The Company had principal outstanding of $89,718 and $91,555 as of December 31, 2019 and 2018.
In February of 2019, the Company entered into a Securities Purchase Agreement with 4 accredited investors (the “Lenders”), in connection with an investment of a total amount of $300,000, and pursuant to which the Company issued i) a convertible promissory note with a 15% OID, having a two year term, secured behind a third party accredited investor via a US UCC filing on all assets of the Company, having a call option right for the noteholder, a redemption right for the Corporation, and convertible at $0.20 per share., and ii) a warrant to purchase shares of the Corporation’s Class A common stock equal to 50% of the total number of shares if the Note is fully converted, divided by the Exercise Price of $0.25, (equal to a total of 750,000 warrants) subject to adjustment as provided therein, exercisable at $0.25 per share or through its cashless exercise provision and having a 4 year term. We recorded a debt discount of $123,805 related to the warrants issued for both the February 2019, related party note and convertible promissory note. The Company had principal outstanding of $294,118 as of December 31, 2019.
In May of 2019, the Corporation entered into Securities Purchase Agreements with 4 accredited investors (the “Lenders”), in connection with an investment of up to a total amount of $150,000, and pursuant to which the Corporation issued a convertible promissory note with a 15% OID, having a two year term, secured behind an accredited investors via a US UCC filing on all assets of the Corporation, having a call option right for the noteholder, a redemption right for the Corporation, and convertible at $0.25 per share, and a warrant to purchase shares of the Corporation’s Class A common stock equal to 25% of such Lender’s investment divided by the Conversion Price of $0.25, subject to adjustment as provided therein, exercisable at $0.30 per share and having a 3 year term. We recorded $36,000 for the warrant cost allocated to debt discount and $110,118 for the beneficial conversion cost related to the convertible debt. The Company had principal outstanding of $176,471 as of December 31, 2019.
| 53 |
| Table of Contents |
May of 2019, the Corporation entered into a Securities Purchase Agreement with another accredited investor (the “Lender”), in connection with an investment of $500,000, and pursuant to which the Corporation issued a convertible promissory note accruing 12% interest per annum with bi-annual interest payments, having a two year term, senior in priority to all obligations of the Company other than the Company’s obligations to an accredited investor and its affiliated investment funds, or a similar replacement thereto, having a call option right for the noteholder, a redemption right for the Corporation, and convertible at $0.25 per share. The Company had principal outstanding of $500,000 as of December 31, 2019.
In November of 2019, the Company issued two convertible promissory notes to two accredited investors in the amount of $280,000 each, convertible at 70% of the lowest trading price of the Company’s Common Stock for the last 15 trading days prior to conversion, and accruing 12% interest per annum and each having a $25,000 original issue discount, with a maturity date of November 21, 2020. As part of the consideration for this investment, the Company issued 145,000 shares of restricted Class A common stock to each of the investors, as well as 725,000 shares of restricted Class A common stock to each investor that shall be returned to the Company provided that the Company repays the Notes in full by May of 2020. The Company had principal outstanding of $560,000 as of December 31, 2019.
Debt Service Obligations
We remain focused on refinancing near-term facilities on acceptable terms and maintaining a manageable maturity ladder. We do not anticipate material issues in addressing our borrowings through 2020 on acceptable terms and expect to be able to do so opportunistically based on the prevailing interest rate environment.
The aggregate contractual principal payments of long-term debt due after December 31, 2019, including financing lease obligations and excluding amortization of debt discounts, premiums and deferred financing costs, as stated in the financing agreements, are as follows:
Note principal payments next five years and thereafter:
|
|
| 2020 |
|
| 2021 |
|
| 2022 |
|
| 2023 |
|
| 2024 |
|
| Thereafter |
|
| Total |
| |||||||
| Gross Debt |
| $ | 23,129,751 |
|
| $ | 1,102,888 |
|
| $ | 1,108,229 |
|
| $ | 1,113,219 |
|
| $ | 1,118,312 |
|
| $ | 10,026,813 |
|
| $ | 37,599,212 |
|
| Debt Discount |
|
| (424,084 | ) |
|
| (360,046 | ) |
|
|
|
|
|
|
|
|
|
|
|
|
|
|
|
|
|
| (784,130 | ) |
| Net debt |
| $ | 22,705,667 |
|
| $ | 742,842 |
|
| $ | 1,108,229 |
|
| $ | 1,113,219 |
|
| $ | 1,118,312 |
|
| $ | 10,026,813 |
|
| $ | 36,815,082 |
|
Equity Investment
On March 27, 2020 (the “Effective Date”), Alternus Energy Inc., a Nevada corporation (the “Company”) and a foreign institutional accredited investor (the “Investor”) entered into a securities purchase agreement (the “Securities Purchase Agreement”) pursuant to which the Company sold and issued to the Investor an aggregate of 30,000,000 shares of the Company’s Class A Common Stock, par value $0.001 per share (the “Class A Common Stock”), at a price of $0.10 per share (the “Private Placement”). Pursuant to the Securities Purchase Agreement, the Company issued to the Investor a one-year warrant (“Class A Warrant”) to purchase up to 12,000,000 shares of the Class A Common Stock. Class A Warrant will have an exercise price equal to $0.125, subject to the additional terms of Class A Warrant (the “Exercise Price”).
| 54 |
| Table of Contents |
Cash Flow Discussion
We use traditional measures of cash flow, including net cash flows from operating activities, investing activities and financing activities to evaluate our periodic cash flow results.
For the Year Ended December 31, 2019 compared to December 31, 2018
The following table reflects the changes in cash flows for the comparative periods:
|
|
| 2019 |
|
| 2018 |
|
| Change |
| |||
| Net cash provided by operating activities |
| $ | (2,469,063 | ) |
| $ | 53,776 |
|
| $ | (2,522,839 | ) |
| Net cash (used in) provided by investing activities |
|
| (9,065,211 | ) |
|
| (10,114,235 | ) |
|
| 1,049,024 |
|
| Net cash provided by (used in) financing activities |
|
| 3,098,038 |
|
|
| 10,666,627 |
|
|
| (7,568,589 | ) |
Net Cash (Used In) Provided By Operating Activities
Net cash used in operating activities for the year ended December 31, 2019 compared to 2018 decreased primarily due to additional interest expense of $1.8 million and additional overhead.
Net Cash Used In Investing Activities
Net cash used in investing activities for the year ended December 31, 2019 compared to 2018 decreased due to investment in the new Italian and Netherlands solar parks.
Net Cash Provided by Financing Activities
Net cash provided by financing activities for the year ended December 31, 2019 compared to 2018 decreased due to proceeds from debt issuance associated with the acquisition of the new Italian and Netherlands solar parks.
Critical Accounting Policies and Estimates
The preparation of financial statements in conformity with accounting principles generally accepted in the United States requires us to make estimates and assumptions in certain circumstances that affect amounts reported in our consolidated financial statements and related footnotes. In preparing these consolidated financial statements, we have made our best estimates of certain amounts included in the consolidated financial statements. Application of accounting policies and estimates, however, involves the exercise of judgment and use of assumptions as to future uncertainties and, as a result, actual results could differ from these estimates. In arriving at our critical accounting estimates, factors we consider include how accurate the estimate or assumptions have been in the past, how much the estimate or assumptions have changed and how reasonably likely such change may have a material impact. Our critical accounting policies are discussed below.
Business Combinations
We account for business combinations by recognizing in the financial statements the identifiable assets acquired, the liabilities assumed, and any non-controlling interests in the acquiree at fair value at the acquisition date. We also recognize and measure the goodwill acquired or a gain from a bargain purchase in the business combination and determines what information to disclose to enable users of an entity’s financial statements to evaluate the nature and financial effects of the business combination. In addition, acquisition costs related to business combinations are expensed as incurred. Business combinations is a critical accounting policy as there are significant judgments involved in the allocation of acquisition cost.
| 55 |
| Table of Contents |
When we acquire renewable energy facilities, we allocate the purchase price to (i) the acquired tangible assets and liabilities assumed, primarily consisting of land, plant, and long-term debt, (ii) the identified intangible assets and liabilities, primarily consisting of the value of favorable and unfavorable rate PPAs and REC agreements and the in-place value of market rate PPAs, (iii) non-controlling interests, and (iv) other working capital items based in each case on their fair values in accordance with ASC 805.
We perform the analysis of the acquisition using the various valuation methodologies of replacement cost approach, or an income approach or excess earnings approach. Factors considered by management in its analysis include considering current market conditions and costs to construct similar facilities. We also consider information obtained about each facility as a result of our pre-acquisition due diligence in estimating the fair value of the tangible and intangible assets and liabilities acquired or assumed. In estimating the fair value, we also establish estimates of energy production, current in-place and market power purchase rates, tax credit arrangements and operating and maintenance costs. A change in any of the assumptions above, which are subjective, could have a significant impact on the results of operations.
The allocation of the purchase price directly affects the following items in our consolidated financial statements:
| • | The amount of purchase price allocated to the various tangible and intangible assets, liabilities and non-controlling interests on our balance sheet; |
| • | The amounts allocated to the value of favorable and unfavorable rate PPAs and REC agreements are amortized to revenue over the remaining non-cancelable terms of the respective arrangement. The amounts allocated to all other tangible assets and intangibles are amortized to depreciation or amortization expense, with the exception of favorable and unfavorable rate land leases and unfavorable rate O&M contracts which are amortized to cost of operations; and |
| • | The period of time over which tangible and intangible assets and liabilities are depreciated or amortized varies, and thus, changes in the amounts allocated to these assets and liabilities will have a direct impact on our results of operations. |
Impairment of Renewable Energy Facilities and Intangibles
Long-lived assets that are held and used are reviewed for impairment whenever events or changes in circumstances indicate carrying values may not be recoverable. An impairment loss is recognized if the total future estimated undiscounted cash flows expected from an asset are less than its carrying value. An impairment charge is measured as the difference between an asset’s carrying amount and its fair value. Fair values are determined by a variety of valuation methods, including appraisals, sales prices of similar assets and present value techniques.
Impairment of Goodwill
Goodwill is tested annually for impairment at the reporting unit level during the fourth quarter or earlier upon the occurrence of certain events or substantive changes in circumstances. A reporting unit is either the operating segment level or one level below, which is referred to as a component. The level at which the impairment test is performed requires judgment as to whether the operations below the operating segment constitute a self-sustaining business or whether the operations are similar such that they should be aggregated for purposes of the impairment test.
In assessing goodwill for impairment, we may elect to use a qualitative assessment to determine whether the existence of events or circumstances leads to a determination that it is more-likely-than-not that the fair value of our reporting units are less than their carrying amounts. If we determine that it is not more-likely-than-not that the fair value of our reporting units are less than their carrying amounts, we are not required to perform any additional tests in assessing goodwill for impairment. However, if we conclude otherwise or elect not to perform the qualitative assessment, then we are required to perform the quantitative impairment test.
| 56 |
| Table of Contents |
Depreciable lives of Long-lived Assets
We have significant investments in renewable energy facility assets. These assets are generally depreciated on a straight-line basis over their estimated useful lives which range from 15 to 30 years for our solar generation facilities.
The estimation of asset useful lives requires significant judgment. Changes in our estimated useful lives of renewable energy facilities could have a significant impact on our future results of operations. See Note 2. Summary of Significant Accounting Policies to our consolidated financial statements regarding depreciation and estimated service lives of our renewable energy facilities.
Recently Issued Accounting Standards
See Note 2. Summary of Significant Accounting Policies to our consolidated financial statements for our year end audited financial statements for disclosures concerning recently issued accounting standards.
Off-Balance Sheet Arrangements
We do not have any off-balance sheet arrangements.
| Item 7A. Quantitative and Qualitative Disclosures about Market Risk |
Not applicable.
The financial statements required by this item are included after the signature page of this filing.
| Item 9. Changes in and Disagreements with Accountants on Accounting and Financial Disclosure |
Not applicable.
Evaluation of Disclosure Controls and Procedures
As of the end of the period covered by this report, we conducted an evaluation, under the supervision and with the participation of our Chief Executive Officer and Chief Financial Officer of our disclosure controls and procedures (as defined in Rule 13a-15(e) and Rule 15d-15(e) of the Exchange Act). Based upon this evaluation, our Chief Executive Officer and Chief Financial Officer concluded that our disclosure controls and procedures were not effective due to the material weakness described below.
Management’s Report on Internal Control Over Financial Reporting
Management is responsible for establishing and maintaining adequate internal control over financial reporting. The Company maintains internal controls over financial reporting that are designed to ensure that information required to be disclosed in the Company’s SEC reports is recorded, processed, summarized and reported within the time periods specified in the SEC’s rules and forms, and that such information is accumulated and communicated to the Company’s management, including its principal executive officer and principal financial officer, as appropriate, to allow timely decisions regarding required disclosure.
| 57 |
| Table of Contents |
In designing and evaluating the internal controls over financial reporting, management recognized that any controls and procedures, no matter how well designed and operated, can provide only reasonable assurance of achieving the desired control objectives, and management was required to apply its judgment in evaluating the cost-benefit relationship of possible controls and procedures.
Under the supervision and with the participation of management, including the Company’s principal executive officer and principal financial officer, the Company conducted an evaluation of the effectiveness of its internal control over financial reporting based on the framework in Internal Control-Integrated Framework issued by the Committee of Sponsoring Organizations of the Treadway Commission (2013). Based on this evaluation, our principal executive officer and principal financial officer concluded that, as of December 31, 2019, our internal controls over financial reporting were not effective at the reasonable assurance level due to the material weakness discussed below.
In light of the material weakness described below, we performed additional analysis and other post-closing procedures to ensure that our consolidated financial statements were prepared in accordance with generally accepted accounting principles. Accordingly, we believe that the consolidated financial statements included in this report fairly present, in all material respects, our financial condition, results of operations and cash flows for the periods presented.
This report does not include an attestation report of our independent registered public accounting firm regarding internal control over financial reporting. Management’s report was not subject to attestation by our independent registered public accounting firm pursuant to rules of the SEC that permit us to provide only management’s report in this report.
Material Weakness and Related Remediation Initiatives
In performing the above-referenced assessment, management identified the following deficiencies in the design or operation of our internal controls and procedures, which management considers to be material weaknesses:
Insufficient Resources. We have an insufficient quantity of dedicated resources and experienced personnel involved in reviewing and designing internal controls. As a result, an effective assessment could not be completed which raises the possibility of a material misstatement of the interim and annual financial statements which could occur and not be prevented or detected on a timely basis.
Failure to Segregate Duties. Management has not maintained adequate segregation of duties within the Company due to its reliance on a few individuals to fill multiple roles and responsibilities. Our failure to segregate duties has been a material weakness for the period covering this report.
Sufficiency of Accounting Resources. We have limited accounting personnel to handle complex accounting transactions. The insufficiency of our accounting resources and systems has caused certain reconciliations not to be completed without an undue effort the which caused a material weakness for the period covering this report.
Our management feels the weaknesses identified above have not had any material effect on our financial results. However, we are currently reviewing our disclosure controls and procedures related to these material weaknesses, and expect to implement changes in the near term, as resources permit, in order to address this material weakness. Our management will continue to monitor and evaluate the effectiveness of our internal controls and procedures and our internal controls over financial reporting on an ongoing basis, and is committed to taking further action and implementing additional enhancements or improvements, as necessary and as funds permit.
| 58 |
| Table of Contents |
Inherent Limitations on the Effectiveness of Controls
Management does not expect that our disclosure controls and procedures or our internal control over financial reporting will prevent or detect all errors and all fraud. A control system, no matter how well conceived and operated, can provide only reasonable, not absolute, assurance that the objectives of the control systems are met. Further, the design of a control system must reflect the fact that there are resource constraints, and the benefits of controls must be considered relative to their costs. Because of the inherent limitations in a cost-effective control system, no evaluation of internal control over financial reporting can provide absolute assurance that misstatements due to error or fraud will not occur or that all control issues and instances of fraud, if any, have been or will be detected.
These inherent limitations include the realities that judgments in decision-making can be faulty and that breakdowns can occur because of a simple error or mistake. Controls can also be circumvented by the individual acts of some persons, by collusion of two or more people, or by management override of the controls. The design of any system of controls is based in part on certain assumptions about the likelihood of future events, and there can be no assurance that any design will succeed in achieving its stated goals under all potential future conditions. Projections of any evaluation of controls effectiveness to future periods are subject to risks. Over time, controls may become inadequate because of changes in conditions or deterioration in the degree of compliance with policies or procedures.
Changes in Internal Control Over Financial Reporting
With the exception of the hiring of our CFO and General Counsel in the fourth quarter of 208 and one other additional full time employee in the accounting department in the fourth quarter of 2019, there were no changes in our internal control over financial reporting during the fiscal period to which this report relates that have materially affected, or are reasonably likely to materially affect, our internal control over financial reporting.
None.
| 59 |
| Table of Contents |
| Item 10. Directors, Executive Officers and Corporate Governance |
The following table sets forth information regarding our directors and executive officers as of the date of the filing of this Annual Report on Form 10-K. Pursuant to our charter and bylaws, each of our directors will be elected by our stockholders to serve until such director’s successor is duly elected and qualified except as in the case of such director’s earlier death, resignation, retirement, disqualification, removal or incapacity. Subject to any employment agreements, officers serve at the pleasure of our Board of Directors.
| Name | Age |
| Position | |
|
| ||||
| Vincent Browne |
| 52 |
| Chairman of the Board, President and Chief Executive Officer |
| John Thomas |
| 67 |
| Director |
| John McQuillan |
| 56 |
| Director |
| Joseph E. Duey |
| 47 |
| Chief Financial Officer |
| Taliesin Durant |
| 48 |
| General Counsel and Corporate Secretary |
Set forth below is a brief account of the business experience of the individuals who currently serve as our directors and executive officers:
Vincent Browne, Chairman of the Board, President and Chief Executive Officer
Mr. Browne has been our Chairman of the Board, President and Chief Executive Officer since September of 2017. Prior to that, from July of 2015 to November of 2018, he served as our Chief Financial Officer and from October of 2015 to December of 2018 he served as our Corporate Secretary. From February of 2013 to March of 2014, he served as our acting Chief Financial Officer, Corporate Secretary and as a Director. Mr. Browne is also the sole director of all of our subsidiaries except Alternus Energy International Limited. Since December of 2016 Mr. Browne has also been the owner and managing director of Power Clouds Holdings Pte. Ltd. and Growthcap Investments Inc., the majority shareholder of our Company. Prior to joining Alternus, commencing in January of 2012 and ending in December of 2016, Mr. Browne served as Chief Executive Officer and Chairman of the Board of Axiologix, Inc. Prior to that, commencing in October of 2008, he served as Chief Executive Officer and Chairman of the Board of Flint Telecom Group, Inc. until December 2012. From 2000 to 2005 Mr. Browne founded a number of technology startups. Prior to this, Mr. Browne was Head of Procurement with Esat Telecom Group, Ireland’s premier competitive telecom operator, quoted on NASDAQ. His formative career was with Siemens Nixdorf in Ireland managing the Products Business Segment with annual revenues in excess of $50 million and 8 years of profitability. Mr. Browne holds a Bachelor of Commerce (Accounting) degree from University College Dublin and is a regular contributor in commercialization of research and technology projects with the Technology and Enterprise Campus at Trinity College Dublin. Mr. Browne was selected to serve as a director in light of his role as Chief Executive Officer, the management perspective he brings to board deliberations and his extensive management experience.
| 60 |
| Table of Contents |
John Thomas, Director
As of February 6, 2018, John Thomas was elected as a member of the Company’s Board of Directors. On August 19, 2019 he was appointed to the Company’s Audit Committee. Mr. Thomas has served in senior operating and management roles in a variety of corporate and public enterprises for over 35 years. Currently, he is Managing Partner of the Doonbeg Group, which he co-founded in 2013. Doonbeg Group is a merchant bank offering advisory services across a wide spectrum of interests. Prior to co-founding the Doonbeg Group, he was a founding partner of Pfife Hudson Group, a boutique investment bank. Prior to that, Mr. Thomas spent 12 years at the Grundstad Maritime Group, a Norwegian holding company with various maritime assets including product tankers and a cruise line, culminating as CEO and President of the Group. He joined Grundstad from Northrop Corporation, where for five years he was responsible for Northrop’s corporate counter trade and offset operations worldwide. Before joining Northrop, Mr. Thomas was Owners Representative for West Africa and Resident Managing Director in Nigeria for Farrell Lines, a US Flag shipping company. He began his African experience as a U.S. Peace Corps Volunteer in The Gambia, West Africa and later transferred to Micronesia. Mr. Thomas graduated with a BS in Business Administration from Manhattan College. Mr. Thomas’ service in senior operating and management roles of other companies, as well as his independence from the Company, led to the conclusion that he should serve as a director of our Company.
John McQuillan, Director
As of December 13, 2018, John McQuillan was elected as a member of the Company’s Board of Directors. On August 19, 2019 he was appointed as Chair of the Company’s Audit Committee. He currently serves as Chief Financial Officer of Homecare Direct. Mr. McQuillan also serves as an independent director of the following companies: Grenke Finance Plc, Erinbay Limited, Rectory Way Management Company, Tipperary Crystal Designs Limited, SMCQ Limited, Badagio Limited, Feaz Limited, and a director of one of our subsidiaries, Alternus Energy International Limited, in addition to a number of SPVs associated with his role in HCD Homecare Limited. In 2005, Mr. McQuillan started his own accounting practice in the energy and regulated sectors in addition to audit, assurance and accounting services to a wide range of clients in the SME sector, including professional and financial services. Prior to that Mr. McQuillan worked as Financial Controller of the ESB Group Network Business. Mr. McQuillan trained with KPMG. He is a graduate of Trinity College Dublin. Mr. McQuillan is a fellow of Chartered Accountants Ireland and an Associate of the Chartered Institute of Arbitrators in Ireland. Mr. McQuillan’s service as a director and an executive officer of other companies, including his current service as a Chief Financial Officer, as well as his independence from the Company led to the conclusion that he should serve as a director of our Company.
Joseph E. Duey, Chief Financial Officer
Joseph E. Duey has been our Chief Financial Officer since October of 2018. Mr. Duey is also the Corporate Secretary of our Irish subsidiary, Alternus Energy International Limited. Prior to joining Alternus, Mr. Duey served as Chief Financial Officer of Helios Energy Group from August of 2016 through September of 2018, an independent power producer focused on developing, acquiring, owning, and operating clean energy generation. From January 2012 through July of 2016, Mr. Duey served as Chief Financial Officer of Green States Energy, Inc., an independent power producer focused on developing, acquiring, owning, and operating clean energy generation. From June of 2008 to December 2011, Mr. Duey was the Controller for Power Partners, a division of MasTec (MTZ), which constructed wind and solar farms in the United States. Mr. Duey was Vice-President of Finance and General Manager of Allumination Filmworks from September 2005 to June 2008. Mr. Duey joined the Goodrich Corporation (at the time a $5B public company) in August of 2002 to September 2005, where he was the Manager of Consolidations Planning and Analysis which comprised over 40 consolidating entities in 17 countries. From January 2002 to August 2002 he was the Controller at Bran and Luebbe a division of the SPX Corporation (SPX). Mr. Duey’s early career experience was at Arthur Andersen, where he performed external, internal, and operational audits for Fortune 1000 Companies. Mr. Duey received an MBA from the University of Illinois and achieved CPA, CMA, CIA, and CFM designations.
| 61 |
| Table of Contents |
Taliesin Durant, General Counsel and Corporate Secretary
Ms. Durant has been our General Counsel and Corporate Secretary since December of 2018. Prior to December of 2018 she served as President of a boutique legal services firm, DART Business Services LLC, which she founded in March of 2010 to provide general and securities legal services to small public companies. Prior to founding DART, from October of 2008 to February of 2010, she was Chief Legal Officer and Corporate Secretary of Flint Telecom Group, Inc. Prior to this, from June of 2001 to September of 2008, Ms. Durant served as General Counsel and Corporate Secretary for Semotus Solutions Inc. Ms. Durant graduated with a BA in Economics from Connecticut College. Ms. Durant is a member of the California State Bar Association, having earned a Juris Doctor degree at Northwestern School of Law at Lewis and Clark College and completed her final year of law school at Santa Clara University School of Law.
Board Composition
Our business and affairs are managed under the direction of the Board of Directors, which is currently composed of three directors. Under our bylaws, the number of directors shall not be fewer than one. At each annual meeting of stockholders, the directors will be elected to serve until the earlier of their death, resignation, retirement, disqualification, removal or incapacity or until their successors have been elected and qualified. Currently each director is elected until the next annual meeting of stockholders.
Our current and future executive officers serve at the discretion of our Board of Directors. Our Board of Directors may also choose to form certain committees, such as an Audit and Compensation Committee. As of the date hereof, the Board of Directors has appointed an Audit Committee.
Board Committees
Our Board of Directors from time to time may appoint directors to serve in committees. As of the date hereof, the Board of Directors has appointed an Audit Committee.
We currently have an audit committee with the composition and responsibilities described below. The members of each committee are appointed by the board of directors and serve until their successor is elected and qualified, unless they are earlier removed or resign. In addition, from time to time, special committees may be established under the direction of the board of directors when necessary to address specific issues.
Audit Committee
The Audit Committee was established in accordance with Section 3(a)(58)(A) of the Exchange Act and on August 19, 2019, the Registrant’s Board of Directors approved the adoption of an audit committee. The current members of our Audit Committee are John P. Thomas and John McQuillan, each of whom the Board has determined to be independent under the rules and standards of the NYSE. John McQuillan is a financial expert as that term is defined under the SEC rules implementing Section 407 of the Sarbanes-Oxley Act of 2002 and possesses accounting or related financial management expertise as defined under the rules of the NYSE. The Board also approved the Audit Committee’s Charter which gives certain powers and authority to the Audit Committee as further described in the Committee Charter.
| 62 |
| Table of Contents |
Our Audit Committee is responsible for, among other things:
| • | selecting the independent auditor; |
| • | pre-approving all audit engagement fees and terms, as well as audit and permitted non-audit services to be provided by the independent auditor; |
| • | at least annually, obtaining and reviewing a report of the independent auditors describing the audit firm’s internal quality-control procedures and any material issues raised by its most recent review of internal quality controls; |
| • | at least annually evaluating the qualifications, performance and independence of the independent auditors, including the lead audit partners; |
| • | discussing the scope of the audit and any problems or difficulties; |
| • | reviewing and discussing the annual audited and quarterly unaudited financial statements and “Item 2. Financial Information—Management’s Discussion and Analysis of Financial Conditions and Results of Operations” with management and the independent auditor; |
| • | discussing types of information to be disclosed in earnings press releases and provided to analysts and rating agencies; |
| • | discussing policies governing the process by which risk assessment and risk management are to be undertaken; |
| • | discussing the Company’s major financial risk exposures and the steps management has taken to monitor and control such exposures; |
| • | discussing with management and the independent auditor the adequacy and effectiveness of the Company’s ethics and compliance program; |
| • | reviewing internal audit activities and qualifications of the internal audit function; |
| • | establishing and overseeing procedures for receipt, retention and treatment of complaints received by us regarding accounting, auditing or internal controls and the submission of anonymous employee concerns regarding accounting and auditing; |
| • | discussing with our general counsel any material government investigations, litigation or legal matters that could reasonably be expected to have a material impact on business or financial statements; |
| • | approving related party transactions above a certain threshold; |
| • | reviewing and approving the Company’s decisions to enter into certain swaps and security-based swaps; |
| • | annually reviewing and assessing the Audit Committee’s performance; and |
| • | preparing the report required by the SEC to be included in our annual report on Form 10-K or our proxy or information statement. |
The Audit Committee has authority under its charter to obtain advice and assistance from outside legal counsel, accounting or other outside advisors as deemed appropriate to perform its duties and responsibilities. A copy of the charter is available on our website at http://alternusenergy.com/corporate-governance/governance-policies. Information contained in, and that can be accessed through, our website is not incorporated into and does not form a part of this Report.
Board Oversight of Risk Management
While the full Board of Directors has the ultimate oversight responsibility for the risk management process, its Audit committee oversees risk in certain specified areas. In particular, our Audit Committee oversees management of enterprise risks as well as financial risks and potential conflicts of interests. Pursuant to the Board of Directors’ instruction, management regularly reports on applicable risks to the Audit committee or the full Board of Directors, as appropriate, with additional review or reporting on risks conducted as needed or as requested by the Board of Directors and its committees.
In fulfilling its oversight and other responsibilities, the Audit Committee met one time during 2019, after its adoption in August of 2019, passed one resolution through unanimous written consent, and met one time prior to the filing of this Annual Report on Form 10-K. The Audit Committee’s activities included, but were not limited to: (a) selecting the independent registered public accounting firm, (b) meeting periodically in executive session with the independent registered public accounting firm, (c) reviewing the Quarterly Reports on Form 10-Q for the three and nine months ended September 30, 2019, (d) performing a self-assessment of the committee, (e) reviewing the Audit Committee charter, and (f) reviewing the overall scope, plans and findings of our internal auditor. Based on the results of the annual self-assessment, the Audit Committee believes that it satisfied the requirements of its charter. The Audit Committee also reviewed and discussed with management and the independent registered public accounting firm this Annual Report on Form 10-K, including the audited financial statements.
| 63 |
| Table of Contents |
Our independent registered public accounting firm, Marcum LLP, is responsible for expressing an opinion on the conformity of the audited financial statements with GAAP. The Audit Committee reviewed with Marcum LLP its judgment as to the quality, not just the acceptability, of our accounting principles and such other matters as are required to be discussed with the Audit Committee pursuant to the applicable requirements of the Public Company Accounting Oversight Board (“PCAOB”) and the SEC. The Audit Committee received written disclosures and the letter from Marcum LLP required by applicable requirements of the PCAOB Rule 3526, “Communication with Audit Committees Concerning Independence,” and has discussed with Marcum LLP its independence from management and the Company. Based on the reviews and discussions referred to above, the Audit Committee recommended to the Board of Directors that the audited financial statements be included in the Annual Report on Form 10-K for the year ended December 31, 2019 for filing with the SEC.
Code of Ethics and Business Conduct
Our Board of Directors adopted a code of business conduct and ethics in January of 2019, which applies to all of our directors, officers and employees. Our Code of Conduct is designed to help directors and employees worldwide to resolve ethical issues in an increasingly complex global business environment. The Code of Conduct applies to all directors and employees, including, without limitation, the CEO, the CFO and any other employee with any responsibility for the preparation and filing of documents with the SEC. The Code of Conduct covers a variety of topics, including those required to be addressed by the SEC. Topics covered include, but are not limited to, conflicts of interest, confidentiality of information and compliance with applicable laws and regulations. Directors and employees of the Company receive periodic updates regarding policies governed by and changes to the Code of Conduct. The Code of Conduct is available at our Investor Relations website located at http://alternusenergy.com/invest/governance-policies. We will post amendments to or waivers of the provisions of the Code of Conduct made with respect to any of our directors and executive officers on that website within four business days. The information contained on, or accessible through, our website is not part of this Report, and is not incorporated by reference. To date, no amendments to or waivers of the provisions of the Code of Conduct were made with respect to any of our directors or executive officers.
Communications with the Board
Shareholders or other interested parties can contact any director or committee of the Board of Directors by writing to them c/o General Counsel and Secretary, One World Trade Center, Suite 8500, New York, NY 10007. Comments or complaints relating to our accounting, internal accounting controls or auditing matters will also be referred to members of the Audit Committee. The Audit Committee has procedures for (a) receipt, retention and treatment of complaints received by us regarding accounting, internal accounting controls, or auditing matters and (b) the confidential, anonymous submission by our employees of concerns regarding questionable accounting or auditing matters.
Section 16(a) Beneficial Ownership Reporting Compliance
Section 16(a) of the Exchange Act, as amended, requires directors, executive officers and persons who beneficially own more than ten percent of a registered class of our equity securities to file with the SEC initial reports of ownership and reports or changes in ownership of such equity securities. Based upon a review of the copies of the forms furnished to us and written representations from certain reporting persons, we believe that during 2019 none of our directors or executive officers or persons who beneficially owned more than ten percent of a registered class of our equity securities were delinquent with respect to any of the filing requirements under Section 16(a).
We are a Smaller Reporting Company, as defined in Rule 12b-2 of the Exchange Act. Accordingly, we have omitted certain information called for by this Item as permitted by applicable scaled disclosure rules.
Executive Compensation
The table below summarizes all compensation awarded to, earned by, or paid to named executive officers (“NEOs”) of the Company for all services rendered in all capacities to us for the fiscal years 2018 and 2019:
| 64 |
| Table of Contents |
| SUMMARY COMPENSATION TABLE | ||||||||||||||||||||||||||
| Name and Principal Position |
| Year |
| Salary ($) |
|
| Bonus ($) |
|
| Stock Awards ($) (1) |
|
| Non-Equity Incentive Plan Compensation ($) |
|
| All Other Compensation ($) |
|
| Total ($) |
| ||||||
| Vincent Browne, President and Chief Executive Officer (2) |
| 2019 |
|
| 150,000 |
|
|
| 30,000 |
|
|
| 1,075,000 |
|
|
| - |
|
|
| - |
|
|
| 1,255,000 |
|
|
|
| 2018 |
|
| - |
|
|
|
|
|
|
| - |
|
|
| - |
|
|
| 120,000 |
|
|
| 120,000 |
|
|
|
|
|
|
|
|
|
|
|
|
|
|
|
|
|
|
|
|
|
|
|
|
|
|
|
|
|
| Joseph E. Duey, Treasurer, Chief Financial Officer |
| 2019 |
|
| 120,000 |
|
|
| 30,000 |
|
|
| 30,000 |
|
|
| - |
|
|
|
|
|
|
| 180,000 |
|
|
|
| 2018 |
|
| 30,000 |
|
|
|
|
|
|
| 112,000 |
|
|
| - |
|
|
| - |
|
|
| 142,000 |
|
|
|
|
|
|
|
|
|
|
|
|
|
|
|
|
|
|
|
|
|
|
|
|
|
|
|
|
|
| Taliesin Durant, Secretary and General Counsel (3) |
| 2019 |
|
| 120,000 |
|
|
| 30,000 |
|
|
| 30,000 |
|
|
|
|
|
|
|
|
|
|
| 180,000 |
|
|
|
| 2018 |
|
| 10,000 |
|
|
|
|
|
|
| 60,000 |
|
|
| - |
|
|
| 49,000 |
|
|
| 129,000 |
|
|
|
|
|
|
|
|
|
|
|
|
|
|
|
|
|
|
|
|
|
|
|
|
|
|
|
|
|
| Roberto Forlani, Former CTO (2018) (4) |
| 2019 |
|
| - |
|
|
| - |
|
|
| - |
|
|
| - |
|
|
| - |
|
|
| - |
|
|
|
| 2018 |
|
| - |
|
|
| - |
|
|
| - |
|
|
|
|
|
|
| 249,071 |
|
|
| 249,071 |
|
___________
|
| (1) | Amounts indicated for “Stock Awards” represent the fair value of the awards at the date of grant as calculated in accordance with Financial Accounting Standards Board Accounting Standards Codification Topic 718, “Compensation-Stock Compensation,” or ASC 718, without regard to forfeiture assumptions. |
|
| (2) | All compensation paid to Mr. Browne was through VestCo Corp. (a company owned and controlled by Mr. Browne), pursuant to professional consulting agreements described in further detail below under “Narrantive Disclosure to Summary Compensation Table”. |
|
| (3) | The other compensation amount reported above in 2018 represents fees earned for consulting services provided by Ms. Durant to the Company. |
|
| (4) | Mr. Forlani served as Chief Technology Officer until November 2018. Mr. Forlani was paid $110,000 in 2018 for his professional services. This amount was paid by the Company pursuant to a settlement agreement among the Company and Telenergia S.r.l., a company owned and controlled by Mr. Forlani. The settlement cancelled $145,000 of professional services that were outstanding and $10,344 of a note outstanding. Telenergia S.r.l. was also paid $139,070 in 2018 for operations and maintenance services provided to the Company’s subsidiaries located in Romania. |
Narrative Disclosure to Summary Compensation Table
Mr. Browne:
In July 2016, the Company entered into a Professional Consulting Agreement (“PCA2”) with VestCo Corp., a company owned and controlled by Vincent Browne, our CEO and Chairman of the Board, as well as CFO at the time, which superseded and replaced a previous professional consulting agreement. The initial term of the PCA2 was three years with automatic renewal for additional three year terms. Under PCA2, the Company paid a quarterly base fee of $45,000, which was reduced to $30,000 per quarter in 2017.
| 65 |
| Table of Contents |
In February 2019, the Company entered into a new professional consulting agreement with VestCo Corp. which superseded and replaced PCA2 (“PCA3”). Under PCA3, Mr. Browne received a quarterly base fee of $30,000 until June 30, 2019, and $45,000 per quarter thereafter, a cash bonus of $30,000 and 10,000,000 shares of restricted Class A common stock, 7,500,000 of which are subject to the following three year vesting schedule: 2,500,000 shares vest on each anniversary of PCA3 and any unvested shares are returned to the Company if PCA3 is terminated during the three year vesting period.
Executive Officer Employment Agreements:
As of October 1, 2018, the Company and Mr. Duey entered into an employment agreement. As of December 1, 2018, the Company and Ms. Durant entered into an employment agreement. Under each of these employment agreements, the Company (i) paid to each executive officer a monthly base salary of $10,000, (ii) paid to each executive officer a cash bonus based on achieving certain milestones, (iii) issued to each executive officer shares of restricted common stock. Pursuant to the applicable employment agreement, Mr. Duey received 2,000,000 shares of the Company’s Class A common stock in 2018 and 1,000,000 shares in 2019, and Ms. Durant received 1,000,000 shares of the Company’s Class A common stock in 2018 and 1,000,000 shares in 2019.
The Company may terminate the employment agreements for “Cause,” which is defined as any of the following: (i) the conviction of a felony, or a crime involving dishonesty or moral turpitude; (ii) fraud, misappropriation or embezzlement; or (iii) willful failure or gross negligence in the performance of assigned duties, which failure or negligence continues for more than 30 days following written notice of such failure or negligence. If such employment agreement is terminated early without cause by the Company within the initial term, the applicable executive officer shall receive severance pay equal to 6 months base salary. If the applicable executive officer terminates the employment agreement for any reason during the initial term, all Company stock issued to such executive officer as of the termination date shall automatically be returned to the Company.
2019 Stock Incentive Plan
On June 14, 2019, the Board of Directors and the Company’s stockholders approved the Company’s 2019 Stock Incentive Plan (the “2019 Plan”). The 2019 Plan provides for the grant of incentive stock options, nonstatutory stock options, stock appreciation rights, stock grants, and stock units (collectively, the “Awards”). Awards may be granted under the 2019 Plan to our employees, directors and consultants (collectively, the “Participants”). The maximum number of shares of common stock available for issuance under the 2019 Plan is 22,500,000 shares. The shares of common stock subject to stock awards granted under the 2019 Plan that expire, are forfeited because of a failure to vest, or otherwise terminate without being exercised in full will return to the 2019 Plan and be available for issuance under the 2019 Plan. To date, no Awards have been granted.
In the event of a corporate transaction or a change of control, outstanding Awards under the 2019 Plan may be assumed, continued, or substituted by the surviving corporation. If the surviving corporation does not assume, continue, or substitute such Awards, then (a) any stock awards that are held by individuals performing services for the Company immediately prior to the effective time of the transaction will become fully vested and exercisable and will be terminated if not exercised prior to the effective date of the transaction, and (b) all other outstanding stock awards will be terminated if not exercised on or prior to the effective date of the transaction.
The 2019 Plan is scheduled to terminate at our 2027 Annual Meeting of Stockholders. The termination of the 2019 Plan, or any amendment thereof, shall not impair the rights or obligations of any Participant under any Award previously granted under the 2019 Plan without the Participant’s consent, unless such modification is necessary or desirable to comply with any applicable law, regulation or rule. No Awards shall be granted under the 2019 Plan after the Plan’s termination. An amendment of the 2019 Plan shall be subject to the approval of our stockholders only to the extent such approval is otherwise required by applicable laws, regulations or rules.
| 66 |
| Table of Contents |
Outstanding Equity Awards at Fiscal Year-End
Compensation of Directors
The table below summarizes all compensation awarded to, earned by, or paid to our directors for all services rendered in all capacities to us for the fiscal years 2018 and 2019:
| DIRECTOR COMPENSATION | ||||||||||||||||||||||||||
| Name |
| Fiscal Year |
| Fees Earned or Paid in Cash ($) |
|
| Stock Awards ($) (1) |
|
| Option Awards ($) |
|
| Non-Equity Incentive Plan Compensation ($) |
|
| All Other Compensation ($) |
|
| Total ($) |
| ||||||
| Vincent Browne (2) |
| 2019 |
|
| - |
|
|
| - |
|
|
| - |
|
|
| - |
|
|
| - |
|
|
| - |
|
|
|
| 2018 |
|
| - |
|
|
| - |
|
|
| - |
|
|
| - |
|
|
| - |
|
|
| - |
|
| John Thomas (3) |
| 2019 |
|
| 60,000 |
|
|
| 47,250 |
|
|
| - |
|
|
| - |
|
|
| 65,000 |
|
|
| 172,250 |
|
|
|
| 2018 |
|
| 40,000 |
|
|
| 70,000 |
|
|
|
|
|
|
|
|
|
|
| 240,000 |
|
|
| 350,000 |
|
| John McQuillan |
| 2019 |
|
| 30,000 |
|
|
| 47,250 |
|
|
| - |
|
|
| - |
|
|
| - |
|
|
| 77,250 |
|
|
|
| 2018 |
|
| - |
|
|
| 10,500 |
|
|
|
|
|
|
|
|
|
|
|
|
|
|
| 10,500 |
|
| Roberto Forlani |
| 2019 |
|
| - |
|
|
| - |
|
|
| - |
|
|
| - |
|
|
| - |
|
|
| - |
|
| Former Director (2) |
| 2018 |
|
| - |
|
|
| - |
|
|
| - |
|
|
| - |
|
|
| - |
|
|
| - |
|
____________
|
| (1) | Stock Award values are reflective of the total fair value, regardless of vesting conditions for earning the awards, for grants received during the applicable fiscal year. |
|
| (2) | Neither Mr. Browne nor Mr. Forlani received compensation for their services as directors distinct and separate from any compensation described under “—Executive Compensation” above. Mr. Forlani resigned as a director in November 2018. |
|
| (3) | Amounts shown for All Other Compensation reflect fees (in the form of both cash ($30,000) and stock (valued at $210,000 in 2018 and in the form of cash in 2019) paid to Doonbeg Partners LLC, a company owned and controlled by Mr. Thomas, for consulting services provided to the Company. |
As of September 30, 2020, we had 135,520,492 shares of our common stock (Classes A and B) issued and outstanding. The following table sets forth information regarding the beneficial ownership of our common stock. The table below sets forth such beneficial ownership for:
|
| • | each stockholder that is a beneficial owner of more than 5% of the common stock (based on information that was publicly available or made available to the Company as of September 30, 2020; |
|
| • | each director and named executive officer individually; and |
|
| • | all directors and executive officers as a group. |
The percentage of common stock beneficially owned by each person is based on 135,520,492 shares of Class A and Class B common stock outstanding as of September 30, 2020. Shares of common stock that may be acquired within 60 days following April 10, 2020 pursuant to the exercise of options or warrants are deemed to be outstanding for the purpose of computing the percentage ownership of such holder but are not deemed to be outstanding for computing the percentage ownership of any other person shown in the table. Beneficial ownership of shares is determined under rules of the SEC and generally includes any shares over which a person exercises sole or shared voting or investment power. Except as noted by footnote, and subject to community property laws where applicable, we believe based on the information provided to us that the persons and entities named in the table below have sole voting and investment power with respect to all shares of our common stock shown as beneficially owned by them. Unless otherwise noted below, the address of the persons and entities listed in the table is c/o Alternus Energy Inc., One World Trade Center, Suite 8500, New York, NY 10007.
| 67 |
| Table of Contents |
| Name |
| Common Stock & Warrants of Alternus Energy Inc. Beneficially Owned |
|
| Percentage of Outstanding Shares Beneficially Owned |
| ||
| 5% Stockholders: |
|
|
|
|
|
| ||
| Growthcap Investments Inc. (1) |
|
| 50,587,571 |
|
|
| 37.3 | % |
| Telenergia Europe S.R.L. (2) |
|
| 19,201,784 |
|
|
| 14.2 | % |
| VestCo Corp. (3) |
|
| 17,577,222 |
|
|
| 12.8 | % |
| Gaia Energy S.R.L. (4) |
|
| 10,000,000 |
|
|
| 7.4 | % |
| IDC DR Fund LP (5) |
|
| 9,958,713 |
|
|
| 6.8 | % |
| Directors and Named Executive Officers: |
|
|
|
|
|
|
|
|
| Vincent Browne (6) |
|
| 69,414,793 |
|
|
| 50.4 | % |
| John Thomas (7) |
|
| 4675000 |
|
|
| 3.4 | % |
| Taliesin Durant (8) |
|
| 3,000,000 |
|
|
| 2.2 | % |
| Joseph E. Duey |
|
| 3,000,000 |
|
|
| 2.2 | % |
| John McQuillan |
|
| 1,175,000 |
|
|
| 0.9 | % |
| Roberto Forlani (former CTO) |
|
| 21,701,784 |
|
|
| 16.0 | % |
| Directors and executive officers as a group (5 persons) |
|
| 81,264,793 |
|
|
| 59.1 | % |
|
|
|
|
|
|
|
|
|
|
| Total Common Shares at September 30, 2020 |
|
| 135,520,492 |
|
|
|
|
|
___________
| * | Represents beneficial ownership of less than 1%. |
|
| |
| (1) | Vincent Browne, the Company’s CEO and Chairman of the Board, has sole voting and investment power over Growthcap Investments Inc. The address for Growthcap Investments Inc. is 16192 Coastal Highway, Lewes, DE 19958. |
| (2) | Roberto Forlani, the Company’s former CEO and CTO, has majority voting control and investment power over Telenergia Europe S.R.L. The address for Telenergia Europe is Strada Madrigalului 42A, Ap4, Rm2, Bucharest, Romania. |
| (3) | Vincent Browne, the Company’s CEO and Chairman of the Board, has majority voting and investment power over VestCo Corp. The address for VestCo Corp. is 16192 Coastal Highway, Lewes, DE 19958. |
| (4) | Lorenzo Silvestre has majority voting and investment power over Gaia Energy S.R.L. The address for Gaia Energy S.R.L is Xona Asi Aversa Nord, Italy. |
| (5) | Includes 9,958,713 shares of common stock underlying warrants exercisable at $0.122 per share for a period of three years from the date of issuance held by IDC DR Fund LP. Eliot Kang has voting and investment power over IDC DR Fund LP. The address for IDC DR Fund LP is 1500 Broadway, 704, New York, NY 10036. |
| (6) | Includes (i) 50,587,571 shares of Class A common stock held by Growthcap Investments Inc., a company which Mr. Browne has voting and investment power over (ii) (a) 15,000,000 shares of Class B common stock, (b) 500,000 shares of Class A common stock, (c) 619,522 shares of Class A common stock underlying warrants exercisable at $0.25 per share or through a cashless exercise provision, for a period of four years which expires in February of 2023, and (d) 1,457,700 shares of Class A common stock underlying a $291,540 convertible promissory note, in each case, held indirectly through VestCo Corp., a company which Mr. Browne has voting and investment power over; and (iii) 1,250,000 shares of Class A common stock held indirectly through VestCo I Corp., a company which Mr. Browne has voting and investment power over. |
| (7) | Includes 3,000,000 shares of Class A common stock held indirectly through Doonbeg Partners LLC, a company which Mr. Thomas has 50% voting and investment power over. |
| (8) | Includes 3,000,000 shares of Class A common stock held indirectly through DART Business Services LLC, a company which Ms. Durant has sole voting and investment power over. |
| (9) | Includes 2,500,000 shares of Class A common stock held directly and 19,201,784 shares of Class A common stock held indirectly through Telenergia Europe S.R.L., a company which Mr. Forlani has voting and investment power over. Based solely upon the information contained in a Schedule 13G filed on February 14, 2020. |
| 68 |
| Table of Contents |
| Item 13. Certain Relationships and Related Transactions, and Director Independence |
Stock Exchange Agreement– Class B Common Stock
On October 9, 2019 a Stock Exchange Agreement was entered into by and among Company and VestCo Corp. (“VestCo”), a company owned and controlled by Vincent Browne, our Chairman and CEO, whereby VestCo returned 15,000,000 shares of ALTN Class A common stock, which were cancelled and returned to the total authorized but unissued shares of Class A common stock of the Company, in exchange for 15,000,000 shares of Class B Common Stock of the Company. See Footnote 9: Shareholders Equity for more details on the terms and conditions of the Class B Common Stock.
Stock Exchange Agreement - Series E Convertible Preferred Stock
On August 19, 2019 a Stock Exchange Agreement was entered into by and among the Company and its majority shareholder, Growthcap Investments Inc. (“GII”), which is owned and controlled by our Chairman and CEO, Vincent Browne, whereby GII returned 50,000,000 shares of our Class A common stock, which were cancelled and returned to the total authorized but unissued shares of common stock of the Company, in exchange for 5,000,000 shares of Series E Convertible Preferred Stock of the Company. See Footnote 9: Shareholders Equity for more details on the terms and conditions of the Series E Convertible Preferred Stock.
Related Party Notes
During the year ended December 31, 2017, the Company issued a $100,000 convertible promissory note to Mr. Vincent Browne, the Chief Executive Officer of the Company (CEO), and a $100,000 convertible promissory note to VestCo Corp., a company controlled by the CEO, in exchange for $200,000 cash to be provided to the Company as required for working capital purposes. The notes accrue 10% annual interest and are convertible into shares of Class A restricted common stock at $0.20 per share, at the noteholder’s option. In February of 2019, the terms under which all cash previously loaned by VestCo Corp. to the Company to date was amended and restated pursuant to a Securities Purchase Agreement with VestCo Corp. and issued to VestCo Corp. i) a convertible promissory note with a 15% OID, and therefore having a Principal Amount of $291,540, having a two year term, secured behind a third party accredited investor via a US UCC filing on all assets of the Corporation, having a call option right for the noteholder, a redemption right for the Corporation, and convertible at $0.20 per share, and ii) a warrant to purchase up to 619,522 shares of the Corporation’s Class A common stock, exercisable at $0.25 per share or through its cashless exercise provision and having a 4 year term.
Mr. Browne also owns and controls Power Clouds Holdings Pte. Ltd., a Singapore company (“PCH”). PCH has advanced $207,753 to the Company which amount has not yet been repaid. As of December 31, 2019 this advance from PCH was short term in nature and non-interest bearing, with a balance of $48,191.
During the year ended December 31, 2017 the Company issued to Gaia a $1,395,680 unsecured promissory note, accruing no interest and having a maturity date of December 31, 2017, and a promissory note of $536,800 to be paid in cash by the Company or its subsidiaries by no later than June 30, 2017, as part of the consideration for the acquisition of Tre Valli Energia S.R.L. As part of this transaction, the Company also issued a total of 10 million shares of restricted common stock to Gaia, making Gaia a related party upon the closing of the transaction due to its resulting beneficial ownership of approximately 7% of the Company’s total issued common stock. (See notes 6 to our consolidated financial statements). During the year ended December 31, 2017 the Company paid $429,440 to Gaia. As at December 31, 2017, $1,679,806 was due under the notes. On April 3, 2018 Gaia filed an Arbitration Application with the Arbitration Chamber of Milan, Italy, against PC-Italia-01, requesting the appointment of an arbitrator and demanding the unwinding of the above transaction due to the delay in payment of the remaining amounts due to Gaia. This matter was settled in 2018 (see note 9 to our consolidated financial statements).
| 69 |
| Table of Contents |
On September 30, 2015, the Company issued a convertible loan note for $1,000,000 to World Global Assets Pte. Ltd. (“WGA”), a related party at the time of the transaction due to WGA being controlled by our former CEO at the time. The note had a three-year term, accrued no interest, and was convertible at a fixed price of $0.20 per share, subject to certain triggers and restrictions. The Company can repay the note at any time without penalty. As the conversion price was above the market price at the time of issuance, no beneficial conversion cost was recorded. In 2016 a portion of the convertible loan note of approximately $300,000 was assigned to various third parties and is now convertible at market price, with a floor price of $0.20 per share and a maturity date of June 30, 2019. Another portion of this note in the amount of approximately $492,000 was assigned to various third parties, is not convertible and includes a maturity date of December 31, 2020. The remainder of the note was forgiven by WGA. As a result of the above assignments and the forgiveness of the remainder of the note by WGA, a related party, we booked a contribution to Additional Paid in Capital of $173,352 as gain on forgiveness of debt in the year ended December 31, 2015. As of December 31, 2018, the total convertible promissory note of $754,067 relates to $244,800 three year note and $509,267 five year note due under the assigned notes. As of December 31, 2019, the total convertible promissory note of $754,067 relates to $244,800 three year notes and $509,267 five year notes due under the assigned notes.
Consulting Services Agreements Involving the Company’s Directors and Executive Officers
Mr. John Thomas is a director of the Company and also the owner and managing director of Doonbeg Partners LLC. The Company contracted with Doonbeg in June of 2017 to provide certain consulting services to the Company for compensation of $240,000 in 2018, consisting of cash and stock, and $65,000 in 2019. The consulting agreement with Doonbeg terminated on June 28, 2019. See Item 6: Director Compensation for more information.
Roberto Forlani was a former director and the former CTO of the Company during 2017 and 2018. Mr. Forlani also owns and controls Telenergia Europe S.r.l. (“TES”), a solar park operation and maintenance company. The Company contracted with TES to provide operation and maintenance services to the Company’s subsidiaries located in Romania for $165,583 in 2018. In October of 2018, the Company entered into a settlement agreement with Mr. Forlani and TES whereby the Company agreed to pay $100,000 to TES in settlement of all amounts due and owed to the CTO and TES.
Director Independence
Though we are not currently listed on a national securities exchange, we intend to adhere to the corporate governance standards adopted by the NYSE. The Board of Directors has considered the independence of our directors pursuant to the listing standards of the NYSE to evaluate whether each director has a material relationship with the Company. The NYSE listing standards identify a list of relationships with the Company that would prevent the Board of Directors from determining that a director is independent from the Company. In addition, the SEC and the NYSE have implemented certain additional independence standards for board committee membership.
Based on this review, the Board has determined that each of Messrs. Thomas and McQuillan is independent pursuant to the listing standards of the NYSE. Accordingly, a majority of the members of the current board are independent.
The firm of Marcum LLP is our independent registered public accounting firm. The following table sets forth fees paid to Marcum LLP during the years ended December 31, 2019 and 2018:
| 70 |
| Table of Contents |
|
|
| December 31, 2019 |
|
| December 31, 2018 |
| ||
|
|
|
|
|
| ||||
| Audit Fees (1) |
| $ | 198,450 |
|
| $ | 258,922 |
|
| Audit-related fees (2) |
|
|
|
|
|
|
|
|
| Tax fees (3) |
|
| 36,300 |
|
|
|
|
|
| All other fees |
|
|
|
|
|
|
|
|
| Total |
| $ | 234,750 |
|
| $ | 258,922 |
|
| (1) | Audit fees consist primarily of the audit and quarterly reviews of the consolidated financial statements, but can also be related to statutory audits of subsidiaries required by governmental or regulatory bodies, attestation services required by statute or regulation, comfort letters, consents, assistance with and review of documents filed with the SEC, work performed by tax professionals in connection with the audit and quarterly reviews, and accounting and financial reporting consultations and research work necessary to comply with GAAP. |
| (2) | Audit-related fees include fees related to acquisition due diligence and accounting consultations. |
| (3) | Tax fees consist primarily of services rendered for tax compliance, tax advice, and tax planning. |
The charter of the Audit Committee provides that the committee is responsible for the pre-approval of all auditing services and permitted non-audit services to be performed for us by our independent registered public accounting firm, subject to the requirements of applicable law. In accordance with such charter, the Audit Committee reviews the matters to be approved. The Audit Committee periodically monitors the services rendered by and actual fees paid to the independent registered public accounting firm to ensure that such services are within the parameters approved by the Audit Committee.
| 71 |
| Table of Contents |
|
| (a) | Financial Statements and Financial Statement Schedule |
See Index to Consolidated Financial Statements
|
| (b) | Exhibits: |
See Exhibit Index
| 72 |
| Table of Contents |
REPORT OF INDEPENDENT REGISTERED PUBLIC ACCOUNTING FIRM
To the Shareholders and Board of Directors of
Alternus Energy, Inc.
Opinion on the Financial Statements
We have audited the accompanying consolidated balance sheets of Alternus Energy, Inc. (the “Company”) as of December 31, 2019 and 2018, the related consolidated statements of operations, stockholders’ equity and cash flows for each of the two years in the period ended December 31, 2019, and the related notes (collectively referred to as the “financial statements”). In our opinion, the financial statements present fairly, in all material respects, the financial position of the Company as of December 31, 2019 and 2018, and the results of its operations and its cash flows for each of the two years in the period ended December 31, 2019, in conformity with accounting principles generally accepted in the United States of America.
Explanatory Paragraph – Going Concern
The accompanying consolidated financial statements have been prepared assuming that the Company will continue as a going concern. As more fully described in Note 2, the Company has a significant working capital deficiency, has incurred significant losses and needs to raise additional funds to meet its obligations and sustain its operations. These conditions raise substantial doubt about the Company’s ability to continue as a going concern. Management’s plans in regard to these matters are also described in Note 2. The consolidated financial statements do not include any adjustments that might result from the outcome of this uncertainty.
Basis for Opinion
These financial statements are the responsibility of the Company’s management. Our responsibility is to express an opinion on the Company’s financial statements based on our audits. We are a public accounting firm registered with the Public Company Accounting Oversight Board (United States) (“PCAOB”) and are required to be independent with respect to the Company in accordance with the U.S. federal securities laws and the applicable rules and regulations of the Securities and Exchange Commission and the PCAOB.
We conducted our audits in accordance with the standards of the PCAOB and in accordance with auditing standards generally accepted in the United States of America. Those standards require that we plan and perform the audits to obtain reasonable assurance about whether the financial statements are free of material misstatement, whether due to error or fraud. The Company is not required to have, nor were we engaged to perform, an audit of its internal control over financial reporting. As part of our audits we are required to obtain an understanding of internal control over financial reporting but not for the purpose of expressing an opinion on the effectiveness of the Company’s internal control over financial reporting. Accordingly, we express no such opinion.
Our audits included performing procedures to assess the risks of material misstatement of the financial statements, whether due to error or fraud, and performing procedures that respond to those risks. Such procedures included examining, on a test basis, evidence regarding the amounts and disclosures in the financial statements. Our audits also included evaluating the accounting principles used and significant estimates made by management, as well as evaluating the overall presentation of the financial statements. We believe that our audits provide a reasonable basis for our opinion.
Marcum LLP
We have served as the Company’s auditor since October, 2017.
New York, NY
October 1, 2020
| F-1 |
| Table of Contents |
ALTERNUS ENERGY INC. AND SUBSIDIARIES
CONSOLIDATED BALANCE SHEETS
FOR THE YEARS ENDED DECEMBER 31, 2019 and 2018
|
|
| December 31, 2019 |
|
| December 31, 2018 |
| ||
| ASSETS
| ||||||||
| Current Assets |
|
|
|
|
|
| ||
| Cash and cash equivalents |
| $ | 1,076,995 |
|
| $ | 1,026,533 |
|
| Accounts receivable |
|
| 210,032 |
|
|
| 307,307 |
|
| Other receivables, sale of asset |
|
| 383,819 |
|
|
| 531,717 |
|
| Unbilled energy incentives earned |
|
| - |
|
|
| 164,687 |
|
| Prepaid expenses and other current assets, short term portion |
|
| 502,054 |
|
|
| 334,078 |
|
| Taxes recoverable |
|
| 610,919 |
|
|
| 178,995 |
|
| Total Current Assets |
|
| 2,783,819 |
|
|
| 2,543,317 |
|
|
|
|
|
|
|
|
|
|
|
| Investment in Energy Property and Equipment, Net |
|
| 33,459,478 |
|
|
| 14,739,767 |
|
| Construction in Process |
|
| 7,270,194 |
|
|
| 6,979,080 |
|
|
|
|
|
|
|
|
|
|
|
| Prepaid expenses and other current assets, long term portion |
|
| 396,639 |
|
|
| - |
|
| Goodwill |
|
| 1,353,998 |
|
|
| - |
|
| Restricted cash |
|
| 349,434 |
|
|
| 8,857,966 |
|
| Total Assets |
| $ | 45,613,562 |
|
| $ | 33,120,130 |
|
|
|
|
|
|
|
|
|
|
|
| LIABILITIES AND SHAREHOLDERS’ EQUITY |
|
|
|
|
|
|
|
|
| Current Liabilities |
|
|
|
|
|
|
|
|
| Accounts payable and accrued liabilities |
| $ | 3,700,796 |
|
| $ | 1,696,200 |
|
| Convertible and non-convertible promissory notes, current portion |
|
| 22,705,665 |
|
|
| 14,510,204 |
|
| Capital lease, current portion |
|
| 87,785 |
|
|
| 85,325 |
|
| Derivative liability |
|
| - |
|
|
| 338,861 |
|
| Taxes payable |
|
| 61,575 |
|
|
| 27,451 |
|
| Total Current Liabilities |
|
| 26,555,821 |
|
|
| 16,658,041 |
|
|
|
|
|
|
|
|
|
|
|
| Convertible and non-convertible promissory notes, net of current portion |
|
| 14,109,417 |
|
|
| 10,320,240 |
|
| Capital lease, net of current portion |
|
| 923,948 |
|
|
| 1,032,453 |
|
| Asset retirement obligation |
|
| 146,215 |
|
|
| 75,032 |
|
| Total Liabilities |
|
| 41,735,401 |
|
|
| 28,085,766 |
|
|
|
|
|
|
|
|
|
|
|
| Commitments and Contingencies Note 8 |
|
|
|
|
|
|
|
|
| Shareholders’ Equity |
|
|
|
|
|
|
|
|
| Preferred Shares, $0.001 par value; 50,000,000 shares authorized, 5,000,000 issued and outstanding (Liquidation value of $5,000 as of December 31, 2019) |
|
| 5,000 |
|
|
| - |
|
| Common stock, $0.001 par value; 435,000,000 shares authorized as of December 31, 2019, and 450,000,000 shares authorized as of December 31, 2018, 68,182,602 of Class A shares and 110,726,725 Class A shares issued and outstanding as of December 31, 2019 and December 31, 2018, respectively. |
|
| 68,183 |
|
|
| 110,727 |
|
| Common stock, $0.001 par value, 15,000,000 and 0 shares of Class B stock authorized, issued and outstanding as of December 31, 2019 and December 31, 2018, respectively |
|
| 15,000 |
|
|
| - |
|
| Additional paid in capital |
|
| 15,442,118 |
|
|
| 13,164,601 |
|
| Accumulated other comprehensive loss |
|
| (642,682 | ) |
|
| (260,424 | ) |
| Accumulated deficit |
|
| (11,009,458 | ) |
|
| (7,980,540 | ) |
| Total Shareholders’ Equity |
|
| 3,878,161 |
|
|
| 5,034,364 |
|
| Total Liabilities and Shareholders’ Equity |
| $ | 45,613,562 |
|
| $ | 33,120,130 |
|
See accompanying notes to the consolidated financial statements.
| F-2 |
| Table of Contents |
ALTERNUS ENERGY INC. AND SUBSIDIARIES
CONSOLIDATED
STATEMENTS OF OPERATIONS AND COMPREHENSIVE LOSS
FOR THE YEARS ENDED DECEMBER 31, 2019 AND 2018
|
|
| For the Year Ended December 31, 2019 |
|
| For the Year Ended December 31, 2018 |
| ||
|
|
|
|
|
|
|
| ||
| Revenues |
| $ | 2,585,568 |
|
| $ | 2,592,964 |
|
| Cost of revenues |
|
| (738,097 | ) |
|
| (1,278,614 | ) |
| Gross Profit |
|
| 1,847,471 |
|
|
| 1,314,350 |
|
|
|
|
|
|
|
|
|
|
|
| Operating Expenses |
|
|
|
|
|
|
|
|
| Selling, general and administrative |
|
| 4,453,155 |
|
|
| 1,817,567 |
|
| Loss on disposal of investment in energy asset |
|
| - |
|
|
| 681,421 |
|
| Depreciation and amortization |
|
| 1,193,107 |
|
|
| 699,573 |
|
| Total Operating Expenses |
|
| 5,646,262 |
|
|
| 3,198,561 |
|
|
|
|
|
|
|
|
|
|
|
| Loss from Operations |
|
| (3,798,791 | ) |
|
| (1,884,211 | ) |
|
|
|
|
|
|
|
|
|
|
| Other income (expense) |
|
|
|
|
|
|
|
|
| Interest expense |
|
| (3,210,299 | ) |
|
| (1,412,864 | ) |
| Other Income |
|
| - |
|
|
| 480 |
|
| Change in fair value of derivative liability |
|
| (132,976 | ) |
|
| - |
|
| Gain on bargain purchase |
|
| 4,113,148 |
|
|
| 1,623,883 |
|
| Total other income |
|
| 769,873 |
|
|
| 211,499 |
|
| Net Loss before Provision for Income Taxes |
|
| (3,028,918 | ) |
|
| (1,672,712 | ) |
| Provision for Income Taxes |
|
| - |
|
|
| (180,000 | ) |
| Net Loss |
| $ | (3,028,918 | ) |
| $ | (1,852,712 | ) |
|
|
|
|
|
|
|
|
|
|
| Basic and diluted loss per share |
| ($0.03) |
|
| ($0.02) |
| ||
|
|
|
|
|
|
|
|
|
|
| Weighted average shares outstanding: |
|
|
|
|
|
|
|
|
| Basic and diluted |
|
| 97,969,579 |
|
|
| 75,195,218 |
|
|
|
|
|
|
|
|
|
|
|
| Comprehensive loss: |
|
|
|
|
|
|
|
|
| Net loss |
| $ | (3,028,918 | ) |
| $ | (1,852,712 | ) |
| Unrealized loss on currency translation adjustment |
|
| (382,190 | ) |
|
| (466,299 | ) |
| Comprehensive loss |
| $ | (3,411,108 | ) |
| $ | (2,319,011 | ) |
See accompanying notes to the consolidated financial statements.
| F-3 |
| Table of Contents |
ALTERNUS ENEGY INC. AND SUBSIDIARIES
CONSOLIDATED STATEMENT OF CHANGES IN SHAREHOLDERS’ EQUITY
FOR YEARS ENDED DECEMBER 31, 2019 AND 2018
|
|
| Preferred Shares |
|
| Class A Common stock issued |
|
| Class B Common stock issued |
|
| Additional Paid-In |
|
| Accumulated Other Comprehensive |
|
| Accumulated |
|
|
| ||||||||||||||||||||
|
|
| Series |
|
| Amount |
|
| Shares |
|
| Amount |
|
| Shares |
|
| Amount |
|
| Capital |
|
| Income/(Loss) |
|
| Deficit |
|
| Total |
| ||||||||||
| Balance at January 1, 2018 |
| 30,000,000 |
|
| $ | 30,000 |
|
|
| 71,476,725 |
|
| $ | 71,477 |
|
|
| - |
|
|
| - |
|
| $ | 11,949,748 |
|
| $ | 205,875 |
|
| $ | (6,127,827 | ) |
| $ | 6,129,273 |
| |
| Conversion of preferred shares Series D to commons shares |
|
| (30,000,000 | ) |
|
| (30,000 | ) |
|
| 30,000,000 |
|
|
| 30,000 |
|
|
| - |
|
|
| - |
|
|
| - |
|
|
| - |
|
|
| - |
|
|
| - |
|
| Restricted shares stock compensation |
|
| - |
|
|
| - |
|
|
| 9,250,000 |
|
|
| 9,250 |
|
|
| - |
|
|
| - |
|
|
| 507,250 |
|
|
| - |
|
|
| - |
|
|
| 516,500 |
|
| Warrant expense related to financing |
|
| - |
|
|
| - |
|
|
| - |
|
|
| - |
|
|
| - |
|
|
| - |
|
|
| 707,603 |
|
|
| - |
|
|
| - |
|
|
| 707,603 |
|
| Unrealized loss on currency translation adjustment |
|
| - |
|
|
| - |
|
|
| - |
|
|
| - |
|
|
| - |
|
|
| - |
|
|
| - |
|
|
| (466,299 | ) |
|
| - |
|
|
| (466,299 | ) |
| Net loss |
|
| - |
|
|
| - |
|
|
| - |
|
|
| - |
|
|
| - |
|
|
| - |
|
|
| - |
|
|
| - |
|
|
| (1,852,712 | ) |
|
| (1,852,712 | ) |
| Balance at December 31, 2018 |
|
| - |
|
|
| - |
|
|
| 110,726,725 |
|
| $ | 110,727 |
|
|
| - |
|
|
| - |
|
| $ | 13,164,601 |
|
| $ | (260,424 | ) |
| $ | (7,980,540 | ) |
| $ | 5,034,364 |
|
| Transfer of Common Shares to Preferred Shares Series E |
|
| 5,000,000 |
|
| $ | 5,000 |
|
|
| (50,000,000 | ) |
| $ | (50,000 | ) |
|
| - |
|
|
| - |
|
|
| 45,000 |
|
|
| - |
|
|
| - |
|
|
| - |
|
| Transfer of Class A Common Shares to Class B Common Shares |
|
|
|
|
|
|
|
|
|
| (15,000,000 | ) |
|
| (15,000 | ) |
|
| 15,000,000 |
|
|
| 15,000 |
|
|
|
|
|
|
|
|
|
|
|
|
|
|
| - |
|
| Stock Compensation |
|
| - |
|
|
| - |
|
|
| 22,455,876 |
|
|
| 22,456 |
|
|
| - |
|
|
| - |
|
|
| 1,490,758 |
|
|
| - |
|
|
| - |
|
|
| 1,513,214 |
|
| Fair value of debt discount |
|
| - |
|
|
| - |
|
|
| - |
|
|
| - |
|
|
| - |
|
|
| - |
|
|
| 269,922 |
|
|
| - |
|
|
| - |
|
|
| 269,922 |
|
| Reclassification of derivative liability |
|
| - |
|
|
| - |
|
|
| - |
|
|
| - |
|
|
| - |
|
|
| - |
|
|
| 471,837 |
|
|
| - |
|
|
| - |
|
|
| 471,837 |
|
| Unrealized loss on currency translation adjustment |
|
| - |
|
|
| - |
|
|
| - |
|
|
| - |
|
|
| - |
|
|
| - |
|
|
| - |
|
|
| (382,190 | ) |
|
| - |
|
|
| (382,190 | ) |
| Net loss |
|
| - |
|
|
| - |
|
|
| - |
|
|
| - |
|
|
| - |
|
|
| - |
|
|
| - |
|
|
| - |
|
|
| (3,028,918 | ) |
|
| (3,028,918 | ) |
| Balance at December 31, 2019 |
|
| 5,000,000 |
|
| $ | 5,000 |
|
|
| 68,182,601 |
|
| $ | 68,183 |
|
|
| 15,000,000 |
|
| $ | 15,000 |
|
| $ | 15,442,118 |
|
| $ | (642,614 | ) |
| $ | (11,009,458 | ) |
| $ | 3,878,161 |
|
See accompanying notes to the consolidated financial statements.
| F-4 |
| Table of Contents |
ALTERNUS ENERGY INC. AND SUBSIDIARIES
CONSOLIDATED STATEMENTS OF CASH FLOWS
FOR THE YEARS ENDED DECEMBER 31, 2019 and 2018
|
|
| For the Year Ended December 31, 2019 |
|
| For the Year Ended December 31, 2018 |
| ||
| Cash Flows from Operating Activities: |
|
|
|
|
|
| ||
| Net loss |
| $ | (3,028,918 | ) |
| $ | (1,852,712 | ) |
|
|
|
|
|
|
|
|
|
|
| Adjustments to reconcile net (loss) to net cash (used in) provided by operations |
|
|
|
|
|
|
|
|
| Depreciation and amortization |
|
| 1,193,107 |
|
|
| 699,573 |
|
| Stock compensation costs |
|
| 1,513,214 |
|
|
| 516,500 |
|
| Amortization of debt discount |
|
| 269,922 |
|
|
| 707,603 |
|
| Change in fair value of derivative liability |
|
| 132,976 |
|
|
| - |
|
| Warrant liability |
|
| - |
|
|
| 338,861 |
|
| Loss on sale of investment in energy asset |
|
| - |
|
|
| 681,421 |
|
| Gain on bargain purchase |
|
| (4,113,148 | ) |
|
| (1,623,883 | ) |
|
|
|
|
|
|
|
|
|
|
| Changes in assets and liabilities, net of acquisition and disposals: |
|
|
|
|
|
|
|
|
| Accounts receivable and other short-term receivables |
|
| 28,630 |
|
|
| (655,334 | ) |
| Other short term receivables |
|
| 147,898 |
|
|
| - |
|
| Prepaid expenses |
|
| (702,780 | ) |
|
| (129,565 | ) |
| Energy incentives earned, not yet received |
|
| 146,285 |
|
|
| 428,083 |
|
| Accounts payable and accrued liabilities |
|
| 1,943,751 |
|
|
| 943,229 |
|
|
|
|
|
|
|
|
|
|
|
|
|
|
|
|
|
|
|
|
|
| Net Cash (Used in) Provided by Operating Activities |
|
| (2,469,063 | ) |
|
| 53,776 |
|
|
|
|
|
|
|
|
|
|
|
| Cash Flows from Investing Activities: |
|
|
|
|
|
|
|
|
| Cash used for construction in process |
|
| (55,120 | ) |
|
| (7,003,171 | ) |
| Cash acquired in acquisitions, net |
|
| 1,076,096 |
|
|
| - |
|
| Proceeds from sale of energy property and equipment, net |
|
| - |
|
|
| 3,760,155 |
|
| Deposits paid under acquisition contracts |
|
| (348,782 | ) |
|
| - |
|
| Cash paid for acquisition of subsidiaries |
|
| (8,486,927 | ) |
|
| - |
|
| Cash used for energy property, and equipment net |
|
| (1,250,478 | ) |
|
| (6,871,219 | ) |
| Net Cash Used In Investing Activities |
|
| (9,065,211 | ) |
|
| (10,114,235 | ) |
|
|
|
|
|
|
|
|
|
|
| Cash Flows from Financing Activities: |
|
|
|
|
|
|
|
|
| Proceeds from debt, related parties |
|
| - |
|
|
| 147,000 |
|
| Payments of debt principal, related parties |
|
| (159,563 | ) |
|
| - |
|
| Proceeds from debt, senior debt |
|
| 5,002,577 |
|
|
| 23,491,575 |
|
| Payments on debt principal, senior debt |
|
| (373,741 | ) |
|
| (3,836,815 | ) |
| Net proceeds from lines of credit |
|
| (35,346 | ) |
|
| 5,033 |
|
| Payments on notes payable related to acquisition of solar parks |
|
| (1,335,889 | ) |
|
| (282,200 | ) |
|
|
|
|
|
|
|
|
|
|
| Net Cash Provided by Financing Activities |
|
| 3,098,038 |
|
|
| 19,524,593 |
|
|
|
|
|
|
|
|
|
|
|
| Effect of exchange rate on cash |
|
| (21,834 | ) |
|
| 289,999 |
|
|
|
|
|
|
|
|
|
|
|
| Net (decrease) increase in cash, cash equivalents and restricted cash |
|
| (8,458,070 | ) |
|
| 9,754,133 |
|
| Cash, cash equivalents, and restricted cash beginning of the period |
|
| 9,884,499 |
|
|
| 130,366 |
|
| Cash, cash equivalents, and restricted cash end of the period |
| $ | 1,426,429 |
|
| $ | 9,884,499 |
|
See accompanying notes to the consolidated financial statements.
| F-5 |
| Table of Contents |
ALTERNUS ENERGY INC. AND SUBSIDIARIES
CONSOLIDATED SUPPLEMENTAL STATEMENT OF CASH FLOWS
FOR THE YEARS ENDED DECEMBER 31, 2019 and 2018
|
|
| December 31, 2019 |
|
| December 31, 2018 |
| ||
| Supplemental Cash Flow Disclosure |
|
|
|
|
|
| ||
| Cash paid for interest |
| $ | 1,573,936 |
|
| $ | 281,210 |
|
|
|
|
|
|
|
|
|
|
|
| Reclassification of derivative liability |
| $ | 471,837 |
|
|
| - |
|
|
|
|
|
|
|
|
|
|
|
| 2019 Acquisition of Zonnerpark Rilland |
|
|
|
|
|
|
|
|
| Working Capital Net |
|
| 395,058 |
|
|
| - |
|
| Investment in Energy Property, Net |
|
| 9,853,884 |
|
|
| - |
|
| Senior Bank Loan Assumed |
|
| (8,007,696 | ) |
|
| - |
|
| Related party promissory note assumed |
|
| (1,683,436 | ) |
|
| - |
|
| Goodwill |
|
| 1,798,113 |
|
|
| - |
|
| Cash paid |
|
| 2,355,923 |
|
|
| - |
|
|
|
|
|
|
|
|
|
|
|
| 2019 Acquisition of Risen Italian operating asset |
|
|
|
|
|
|
|
|
| Investment in Energy Property, Net |
|
| 6,131,004 |
|
|
| - |
|
| Cash paid |
|
| 6,131,004 |
|
|
| - |
|
|
|
|
|
|
|
|
|
|
|
| 2018 Acquisition of Liquid Sun Italian operating asset: |
|
|
|
|
|
|
|
|
| Working Capital Net |
|
| - |
|
|
| 131,394 |
|
| Investment in Energy Property, Net |
|
| - |
|
|
| 4,177,206 |
|
| Cash paid |
|
| - |
|
|
| 4,308,600 |
|
|
|
|
|
|
|
|
|
|
|
| 2018 Disposal of Tre Vallie Italian operating company |
|
|
|
|
|
|
|
|
| Investment in Energy Property, Net |
|
| - |
|
|
| 4,346,507 |
|
| Less: cash received prior to close |
|
| - |
|
|
| (586,352 | ) |
| Net Working Capital Adjustment |
|
| - |
|
|
| 246,636 |
|
| Loss on Sale of Asset and Related Operating Companies |
|
| - |
|
|
| (681,421 | ) |
| Cash proceeds from sale |
|
| - |
|
|
| 3,325,370 |
|
See accompanying notes to the consolidated financial statements
| F-6 |
| Table of Contents |
ALTERNUS ENERGY INC. AND SUBSIDIARIES
NOTES TO THE CONSOLIDATED FINANCIAL STATEMENTS
1. Organization and Formation
Alternus Energy Inc. (formerly Power Clouds, Inc.) (“We”, “ALTN” or the “Company”) was incorporated in the State of Colorado on January 1, 2000, then reorganized as a Nevada corporation on November 8, 2006. On September 11, 2008 the corporation changed its name from Asset Realization, Inc. to World Assurance Group, Inc. On April 24, 2015, the Company changed its name from World Assurance Group, Inc. to Power Clouds Inc. On November 29, 2018, the Company changed its name from Power Clouds Inc. to Alternus Energy Inc. and related stock ticker symbol change from PWCL to ALTN.
AE Europe B.V. (formerly Power Clouds Europe B.V.)
In August of 2016, the Company incorporated a new wholly owned subsidiary in the Netherlands, AE Europe B.V. (formerly named Power Clouds Europe B.V.) This company was incorporated to ultimately hold the Company’s European operating companies and sub-holding companies as appropriate.
PC-Italia-01 S.R.L. (Formerly Power Clouds Wind Italia S.R.L.)
In June of 2015, ALTN incorporated a company in Italy, PC-Italia-01 S.R.L. (formerly named Power Clouds Wind Italia S.R.L.). This company was incorporated to acquire Italian special purpose vehicles (SPVs), power plants and / or other assets located in Italy.
PC-Italia-02 S.p.A. (Formerly PC-Italia-02 S.R.L.)
In August of 2016, the Company incorporated a new company in Italy, PC-Italia-02 SRL as a wholly owned subsidiary of AE Europe B.V. This company was incorporated to acquire Italian special purpose vehicles, power plants and/or other assets located in Italy. During the quarter ended March 31, 2017, this company completed the acquisition of the Sant’Angelo Energia S.r.l. in Italy which operates a 702kW PV solar park. Subsequently, in April of 2019, PC-Italia-02 acquired four additional SPVs in Italy, CIC Rooftop 2 S.r.l., CIC RT Treviso S.r.l., SPV White One S.r.l., CTS Power 2 S.r.l.
PCG_HoldCo GmbH & PCG_GP UG
In June of 2018, the Company acquired 100% of the share capital of two companies in Germany which were renamed as PCG_HoldCo GmbH and PCG_GP UG immediately thereafter. These two companies were acquired in order to acquire German special purpose vehicles, PV solar parks and/or other assets located in Germany. During the year ended December 31, 2018, PCG_HoldCo completed the acquisitions of 4 SPVs in Germany, PSM 20 GmbH & Co KG, GRK 17.2 GmbH & Co KG, GRT 1.1 GmbH and PSM 40 GmbH & Co KG. In December of 2018, the Company acquired 100% of the share capital of another company in Germany which was renamed to ALTN HoldCo UG.
Alternus Energy International Limited
In March of 2019, the Company incorporated a new wholly owned subsidiary in Ireland, Alternus Energy International Limited. This company was incorporated to establish our European operations center.
AEN 01 B.V.
In June of 2019, the Company incorporated a new wholly owned subsidiary in the Netherlands, AEN 01 B.V. This company was incorporated to acquire Netherlands special purpose vehicles (SPVs), project rights and other solar energy assets in the Netherlands. During the quarter ended December 31, 2019, this company completed the acquisition of Zonnepark Rilland B.V. in the Netherlands, which operates a 11.75MW PV solar park.
| F-7 |
| Table of Contents |
In summary, Alternus Energy is a holding company that operates through the following twenty operating subsidiaries as of December 31, 2019:
| Subsidiary | Principal Activity | Date Acquired / Established | ALTN Ownership | Country of Operation |
| Power Clouds SRL | SPV | March 31, 2015 | 99.5%* | Romania |
| F.R.A.N. Energy Investment SRL | SPV | March 31, 2015 | 99.5%* | Romania |
|
AE Europe B.V. | Holding Company | August 2016 |
100% |
Netherlands |
|
PC-Italia-01 S.R.L. |
Sub-Holding | June 2015 |
100% (via PCE) |
Italy |
|
PC-Italia-02 S.p.A. |
SPV | August 2016 |
100% (via PCE) |
Italy |
|
Sant’Angelo Energia S.r.l. |
SPV |
March 30, 2017 | 100% (via PC_Italia_02) |
Italy |
| PCG_HoldCo GmbH | Holding Company | July 6, 2018 | 100% | Germany |
| PCG_GP UG | General Partner (Management Company) | August 30, 2018 | 100% | Germany |
|
PSM 20 UG |
SPV |
November 14, 2018 | 100% (via PCG_HoldCo) |
Germany |
|
PSM 40 UG |
SPV |
December 28, 2018 | 100% (via PCG_HoldCo) |
Germany |
|
GRK 17.2 GmbH & Co KG |
SPV |
November 17, 2018 | 100% (via PCG_HoldCo) |
Germany |
|
GRT 1.1 GmbH & Co KG |
SPV |
December 21, 2018 | 100% (via PCG_HoldCo) |
Germany |
|
ALTN HoldCo UG |
SPV |
December 14, 2018 | 100% (via PCG HoldCo) |
Germany |
|
Alternus Energy International Ltd. |
European Operational Centre |
March 1, 2019 |
100% |
Ireland |
|
CIC Rooftop 2 S.r.l. |
SPV |
April 23, 2019 | 100% (via PC-Italia-02) |
Italy |
|
CIC RT Treviso S.r.l. |
SPV |
April 23, 2019 | 100% (via PC-Italia-02) |
Italy |
|
SPV White One S.r.l. |
SPV |
April 23, 2019 | 100% (via PC-Italia-02) |
Italy |
|
CTS Power 2 S.r.l. |
SPV |
April 23, 2019 | 100% (via PC-Italia-02) |
Italy |
| AEN 01 B.V. | SPV | June 13, 2019 | 100% | Netherlands |
| Zonnepark Rilland B.V. | SPV | December 20, 2019 | 100% | Netherlands |
Summary:
*Non-controlling interest is not material
| F-8 |
| Table of Contents |
2. Going Concern
Our consolidated financial statements for the year ended December 31,2019 identifies the existence of certain conditions that raise substantial doubt about our ability to continue as a going concern for twelve months from the issuance of this Annual Report on Form 10-K.
The accompanying consolidated financial statements have been prepared on a going concern basis, which contemplates the realization of assets and the satisfaction of liabilities in the normal course of business. As shown in the accompanying consolidated financial statements during the year ended December 31, 2019, the Company had net loss of ($3,028,918) and a net loss of ($1,852,712) for the year ended December 31, 2019 and 2018, respectively. The Company had accumulated shareholders’ equity of $3,878,161 and $5,034,364 as of December 31, 2019 and December 31, 2018, respectively, and a working capital deficit of $23,772,002 and $14,114,724 as of December 31, 2019 and December 31, 2018, respectively. At December 31, 2019, the Company had $1,076,995 of cash on hand.
Our operating revenues are insufficient to fund our operations and our assets already are pledged to secure our indebtedness to various third party secured creditor, respectively. The unavailability of additional financing could require us to delay, scale back or terminate our acquisition efforts as well as our own business activities, which would have a material adverse effect on the Company and its viability and prospects.
The terms of our indebtedness, including the covenants and the dates on which principal and interest payments on our indebtedness are due, increases the risk that we will be unable to continue as a going concern. To continue as a going concern over the next twelve months, we must make payments on our debt as they come due and comply with the covenants in the agreements governing our indebtedness or, if we fail to do so, to (i) negotiate and obtain waivers of or forbearances with respect to any defaults that occur with respect to our indebtedness, (ii) amend, replace, refinance or restructure any or all of the agreements governing our indebtedness, and/or (iii) otherwise secure additional capital. However, we cannot provide any assurances that we will be successful in accomplishing any of these plans.
The recent outbreak of the corona virus, also known as “COVID-19”, has spread across the globe and is impacting worldwide economic activity. Conditions surrounding the corona virus continue to rapidly evolve and government authorities have implemented emergency measures to mitigate the spread of the virus. The outbreak and the related mitigation measures may have an adverse impact on global economic conditions as well as on the Company’s business activities. The extent to which the corona virus may impact the Company’s business activities will depend on future developments, such as the ultimate geographic spread of the disease, the duration of the outbreak, travel restrictions, business disruptions, and the effectiveness of actions taken in the United States and other countries to contain and treat the disease. These events are highly uncertain and as such, the Company cannot determine their financial impact at this time.
3. Summary of Significant Accounting Policies
Basis of Presentation
The consolidated financial statements include the consolidated balance sheet, statements of operations and comprehensive loss, changes in shareholders’ equity and cash flows of the Company and have been prepared in accordance with accounting principles generally accepted in the United States of America (GAAP) from records maintained by the Company.
Basis of consolidation
The consolidated financial statements as of December 31, 2019 and December 31, 2018 and for the years then ended include the accounts of the Company and the aforementioned subsidiaries. All intercompany accounts and transactions have been eliminated in consolidation. The results of subsidiaries acquired or disposed of during the respective periods are included in the consolidated financial statements from the effective date of acquisition or up to the effective date of disposal, as appropriate.
Use of estimates
The preparation of consolidated financial statements in conformity with GAAP. requires management to make estimates and assumptions that affect the reported amounts of assets and liabilities and disclosure of contingent assets and liabilities at the date of the consolidated financial statements and reported amounts of revenues and expenses for the periods presented. The most significant estimates with regard to these statements relate to the assumptions utilized in the valuation of the assets acquired, calculation of stock and warrant compensation expense, asset retirement obligations and impairment of long-lived assets. Actual results could differ from these estimates.
Cash and Cash Equivalents
The Company considers cash, demand deposits and highly liquid investments with maturities of less than three months when purchased to be cash and cash equivalents. The Company maintains cash and cash equivalents with major financial institutions, which may at times exceed federally insured limits. The Company periodically assesses the financial condition of the institutions and believes the risk of loss to be remote.
| F-9 |
| Table of Contents |
Accounts Receivable
Accounts receivable are uncollateralized customer obligations due under normal trade terms requiring payment within that period. Accounts receivable are stated at the amount management expects to collect from balances outstanding at year-end. Management establishes an allowance for doubtful customer accounts through a review of historical losses, specific customer balances, and industry economic conditions. Customer accounts are charged off against the allowance for doubtful accounts when management determines that the likelihood of eventual collection is remote. The Company extends credit based on an evaluation of customers’ financial conditions and determines any additional collateral requirements. Exposure to losses on receivables is principally dependent on each customer’s financial condition. The Company considers invoices past due when they are outstanding longer than the stated term. Additionally, the Company monitors its exposure for credit losses and maintains allowances for anticipated losses. At December 31, 2019 and 2018, management determined that an allowance for doubtful accounts was not material.
Energy Property and Equipment
Acquired energy property and equipment is recognized at fair value at the date of acquisition, less depreciation. Energy property constructed by the Company is recognized at its cost, less depreciation. The Company provides for depreciation utilizing the straight-line method by charges to operations over the estimated useful lives of the solar energy facilities, which is twenty years. Expenditures during the construction of new solar energy facilities are capitalized to development in progress as incurred until achievement of the commercial operation date (COD). Expenditures for maintenance and repairs are charged to expense as incurred. Upon retirement, sale or other disposition of equipment, the cost and accumulated depreciation are removed from the accounts and the related gain or loss, if any, is reflected in the year of disposal. When the Company abandons the anticipated construction of a new solar energy facility during the development phase, costs previously capitalized to development in progress are written off.
Goodwill and Indefinite-Lived Intangible Assets
The Company has goodwill and certain indefinite-lived intangible assets that have been recorded in connection with the acquisition of a business. Goodwill and indefinite-lived assets are not amortized, but instead are tested for impairment at least annually. Goodwill represents the excess of the purchase price of an acquired business over the estimated fair value of the underlying net tangible and intangible assets acquired. For purposes of the goodwill impairment test, the Company has determined that it currently operates as a single reporting unit. If it is determined that an impairment has occurred, the Company adjusts the carrying value accordingly, and charges the impairment as an operating expense in the period the determination is made. Although the Company believes goodwill is appropriately stated in the consolidated financial statements, changes in strategy or market conditions could significantly impact these judgments and require an adjustment to the recorded balance.
Intangible Assets
Intangible assets consist of long-term operating contracts acquired through the acquisition of solar energy facilities. Intangible assets are initially recognized at their fair value and are amortized over the term of the related Power Purchase Agreement (PPAs) using the straight-line method. For solar energy facilities that are purchased and then put into construction, intangible assets are recorded at cost, and are amortized over the term of the related PPAs using the straight-line method.
Impairment of Long-Lived Assets
The Company reviews its investment in energy property and PPAs for impairment whenever events or changes in circumstances indicate that the carrying value of an asset may not be recoverable. When evaluating impairment, if the undiscounted cash flows estimated to be generated by the energy property are less than its carrying amount, the differential carrying amount is determined to be not recoverable. The amount of the impairment loss is equal to the excess of the asset’s carrying value over its estimated fair value.
Asset Retirement Obligation
In connection with the acquisition or development of solar energy facilities, the Company may have the legal requirement to remove long-lived assets constructed on leased property and to restore the leased property to its condition prior to the construction of the long-lived assets. This legal requirement is referred to as an asset retirement obligation (ARO). If the Company determines that an ARO is required for a specific solar energy facility, the Company records the present value of the estimated future liability when the solar energy facility is placed in service. AROs recorded for owned facilities are recorded by increasing the carrying value of investment in energy property and depreciated over the solar energy facility’s useful life, while an ARO recorded for a leasing arrangement is accounted for as a liability in the initial period recognized and amortized over the term of the solar energy facility’s useful life. After initial recognition of the liability, the Company accretes the ARO to its future value over the solar energy facility’s useful life. As of December 31, 2019 and 2018, the Company’s asset retirement obligations were not material.
| F-10 |
| Table of Contents |
Revenue Recognition
In May 2014, the Financial Accounting Standards Board (“FASB”) issued ASU No. 2014-09, Revenue from Contracts with Customers (Topic 606), and has since issued amendments thereto (collectively referred to as “ASC 606”). The core principle of the guidance is that an entity should recognize revenue to depict the transfer of promised goods or services to customers in an amount that reflects the consideration to which the entity expects to be entitled in exchange for those goods or services, and the guidance defines a five-step process to achieve this core principle. ASC 606 also mandates additional disclosure about the nature, amount, timing and uncertainty of revenues and cash flows arising from customer contracts, including significant judgments and changes in judgments and assets recognized from costs incurred to obtain or fulfill a contract. The Company modified retrospective adopted ASC 606 as of January 1, 2019. Results for the reporting periods beginning after January 1, 2019 are presented under ASC 606, while prior period results are not adjusted and continue to be reported in accordance with its historic accounting under ASC Topic 605. The Company determined that the new standard did not have any material impact on revenue recognition and measurement in its consolidated financial statements.
The Company derives revenues through its subsidiaries from the sale of electricity and the sale of solar renewable energy credits. Energy generation revenue and solar renewable energy credits revenue are recognized as electricity is generated by the solar energy facility and delivered to the grid at which time all performance obligations have been delivered. Revenues are based on actual output and contractual sale prices set forth in long-term contracts.
Disaggregated Revenues
The following table shows the Company’s revenues disaggregated by pricing plans offered to customers:
| Net Revenue, by Offtake Type |
| 2019 |
|
| 2018 |
| ||
| Feed in Tariff |
| $ | 1,653,186 |
|
| $ | 829,794 |
|
| Green Certificates |
|
| 631,740 |
|
|
| 789,740 |
|
| Energy Offtake Agreements |
|
| 300,642 |
|
|
| 973,430 |
|
| Total |
| $ | 2,585,568 |
|
| $ | 2,592,964 |
|
During the year ended December 31, 2019, two customers represented 56% and 30% of revenues and 37% and 9% of accounts receivable balance. During the year ended December 31, 2018, one of same customer and one different customer represented 32% and 21% of revenues.
Unbilled Energy Incentives Earned
The Company derives revenues from the sale of green certificates for the Romania projects. The green certificates revenues are recognized in the month they are generated by the solar project and registered with the local authority. The Company considers them unbilled at the end of the period if they have not been invoiced to a third party customer.
Taxes Recoverable
The Company records taxes recoverable, when there has been an overpayment of taxes due to timing of the Value Added Tax (VAT) between vendors and customers. The VAT tax can also be offset against a Country’s income taxes where the VAT was registered.
| F-11 |
| Table of Contents |
Risks and Uncertainties
The Company’s operations are subject to significant risk and uncertainties including financial, operational, technological, and regulatory risks including the potential risk of business failure. Also see Note 2 regarding going concern matters.
Fair Value of Financial Instruments
The Company measures its financial instruments at fair value under GAAP establishes a framework for measuring fair value and disclosures about fair value measurements.
To increase consistency and comparability in fair value measurements and related disclosures, GAAP establishes a fair value hierarchy that prioritizes the inputs to valuation techniques used to measure fair value into three (3) broad levels. The fair value hierarchy gives the highest priority to quoted prices (unadjusted) in active markets for identical assets or liabilities and the lowest priority to unobservable inputs. The three (3) levels of fair value hierarchy are described below:
Level 1 Quoted market prices available in active markets for identical assets or liabilities as of the reporting date.
Level 2 Pricing inputs other than quoted prices in active markets included in Level 1 that are either directly or indirectly observable as of the reporting date.
Level 3 Pricing inputs that are generally observable inputs and not corroborated by market data.
Financial assets are considered Level 3 when their fair values are determined using pricing models, discounted cash flow methodologies or similar techniques and at least one significant model assumption or input is unobservable. The Company has level 3 assets and liabilities consisting of asset retirement obligations and warrant liabilities. The asset retirement obligations are not material.
As of April 15, 2019 the exercise price of the warrants previously issued in conjunction with the Inmost note became fixed at a price of $0.122 and the derivative liability of $471,837 was reclassified to equity. During the year ended December 31, 2019, the Company recorded a change in fair value of $132,976.
|
|
| December 31, 2019 |
|
| December 31, 2018 |
| ||
| Balance - beginning of the year |
|
| 338,861 |
|
|
| -- |
|
| Derivative liability |
|
|
|
|
|
| 338,861 |
|
| Change in fair value of derivative liability |
|
| 132,976 |
|
|
| - |
|
| Reclassification of derivative liability |
|
| (471,837 | ) |
|
| - |
|
| Balance - end of year |
|
| - |
|
|
| 338,861 |
|
We valued the derivative using the Black Scholes method. We calculated the stock price as of the data of revaluation, with a remaining term of the warrants of 2.5 years. The volatility was calculated at 3.3 using the historical stock price and share volume of the company. We used 2.94% as the risk free rate, based on the Treasury rates for the similar period. The warrants were valued using the floor price of $0.122 with a valuation date of April 15, 2019.
The fair value hierarchy gives the highest priority to quoted prices (unadjusted) in active markets for identical assets or liabilities and the lowest priority to unobservable inputs. If the inputs used to measure the financial assets and liabilities fall within more than one level described above, the categorization is based on the lowest level input that is significant to the fair value measurement of the instrument. The carrying amount of the Company’s financial assets and liabilities, such as cash, accounts payable, approximate their fair value because of the short maturity of those instruments.
| F-12 |
| Table of Contents |
Income Taxes
Deferred taxes are provided on a liability method whereby deferred tax assets are recognized for deductible temporary differences, operating loss and tax credit carry forwards and deferred tax liabilities are recognized for taxable temporary differences. Temporary differences are the differences between the reported amounts of assets and liabilities and their tax basis. Valuation allowances are established when necessary to reduce deferred tax assets to the amount expected to be realized. Deferred tax assets and liabilities are adjusted for the effects of changes in tax laws and rates on the date of enactment.
As of December 31, 2019 and 2018, the Company has U.S. federal and state net operating loss carryovers of approximately $4,667,136 and $1,727,412 respectively, which will expire at various dates beginning in 2034 through 2037, if not utilized with exception of loss carryovers generated in 2018 and 2019. As a result of Tax Cuts and Jobs Act, net operating losses generated in 2018 and beyond have indefinite lives, but limited to 80% of taxable income in each year. Additionally, as of December 31, 2019 and 2018, the Company has U.S. federal capital loss carryovers of approximately $949,875 and $949,875 respectively, which will expire at various dates beginning in 2020 through 2022, if not utilized against capital gain income. In accordance with Section 382 of the internal revenue code, deductibility of the Company’s U.S. net operating loss carryovers may be subject to an annual limitation in the event of a change of control as defined under the Section 382 regulations. Quarterly ownership changes for the past 3 years were analyzed and it was determined that there was no change of control as of December 31, 2019.
In assessing the realization of deferred tax assets, management considers whether it is more likely than not that some portion or all of the deferred tax assets will be realized. The ultimate realization of deferred tax assets is dependent upon the generation of future taxable income during the periods in which those temporary differences become deductible. Management considers the scheduled reversal of deferred tax liabilities, projected future taxable income and tax planning strategies in making this assessment. After consideration of all of the information available, management believes that significant uncertainty exists with respect to future realization of the deferred tax assets and has therefore established a full valuation allowance. For the years ended December 31, 2019 and 2018, the change in valuation allowance was $926,792 and $960,552, respectively. As of December 31, 2019 and 2018, the valuation allowance was $1,887,344 and $960,552, respectively.
The Company evaluated the provisions of ASC 740 related to the accounting for uncertainty in income taxes recognized in their financial statements. ASC 740 prescribes a comprehensive model for how a company should recognize, present, and disclose uncertain positions that the company has taken or expects to take in its return. For those benefits to be recognized, a tax position must be more-likely-than- not to be sustained upon examination by taxing authorities. Differences between two positions taken or expected to be taken in a tax return and the benefit recognized and measured pursuant to the interpretation are referred to as “unrecognized benefits”. A liability is recognized for an unrecognized tax benefit because it represents an enterprise’s potential future obligation to the taxing-authority for a tax position that was not recognized as a result of applying the provisions of ASC 740.
Penalties and interest assessed by income tax authorities would be included in income tax expense. For the period ended December 31, 2019 and 2018, the Company did not incur any penalties or interest. As of December 31, 2018, the Company accrued $180,000 related to noncompliance of administrative filing for their foreign entities for the periods 2012 – 2017.
Stock-Based Compensation
The Company accounts for stock-based compensation in accordance with ASC 718. Under the fair value recognition provisions of this statement, stock-based compensation cost is measured at the grant date based on the fair value of the award and is recognized as expense on a straight-line basis over the requisite service period, which is the vesting period.
Net loss per common share
Net loss per common share is computed pursuant to section 260 of the FASB Accounting Standards Codification. Basic net loss per common share is computed by dividing net loss by the weighted average number of shares of common stock outstanding during the period. Diluted net loss per common share is computed by dividing net loss by the weighted average number of shares of common stock and potentially outstanding shares of common stock during the period to reflect the potential dilution that could occur from common shares issuable through contingent shares issuance arrangement, stock options or warrants. As of December 31, 2019, the Company had 5,000,000 shares of Series E Convertible Preferred Stock which convert into 50,000,000 shares of common stock, 13,053,235 of warrants, and 8,828,233 of convertible shares associated with debt issuance for a total of 71,881,468 shares of Class A common stock. As of December 31, 2018, the Company had 12,286,213 of warrants, and 4,360,105 of convertible shares associated with debt issuance for a total of 16,646,318 shares of Class A common stock. These shares were not included because they were anti-dilutive.
| F-13 |
| Table of Contents |
Foreign Currency and Other Comprehensive Loss
The functional currency of our foreign subsidiaries is typically the applicable local currency which is Romania Lei, Japanese Yen or European Union Euros. The translation from the respective foreign currency to United States Dollars (U.S. Dollar) is performed for balance sheet accounts using current exchange rates in effect at the balance sheet date and for income statement accounts using an average exchange rate during the period. Gains or losses resulting from such translation are included as a separate component of accumulated other comprehensive income. Gains or losses resulting from foreign currency transactions are included in foreign currency income or loss except for the effect of exchange rates on long-term inter-company transactions considered to be a long-term investment, which are accumulated and credited or charged to other comprehensive income.
Transaction gains and losses are recognized in our results of operations based on the difference between the foreign exchange rates on the transaction date and on the reporting date. The Company had a immaterial net foreign exchange loss for the period ended December 31, 2019 and 2018, respectively. The foreign currency exchange gains and losses are included as a component of general and administrative expenses in the accompanying Consolidated Statements of Operations and Comprehensive (Loss). For the period ended December 31, 2019 and 2018, the increase (decrease) in accumulated comprehensive gain (loss) was ($382,190) and ($466,299), respectively.
Preferred Stock
We apply the accounting standards for distinguishing liabilities from equity under U.S. GAAP when determining the classification and measurement of our convertible preferred stock. Preferred Stock subject to mandatory redemption is classified as liability instruments and is measured at fair value. Conditionally redeemable Preferred Stock (including preferred stock that features redemption rights that are either within the control of the holder or subject to redemption upon the occurrence of uncertain events not solely within our control) is classified as temporary equity. At all other times, preferred stock is classified as permanent equity.
As of December 31, 2019, the Company had 5,000,000 shares of Series E Convertible Preferred Stock issued and outstanding which convert into 50,000,000 shares of common stock. The Series E Convertible Preferred, with respect to dividends, rank pari passu with the Common Stock, and with respect to distributions upon liquidation, dissolution or winding up of the Company, rank senior to the Common Stock and junior to any other series of Preferred Stock.
Subsequent Events
The Company follows the guidance in Section 855 of the FASB Accounting Standards Codification for the disclosure of subsequent events. The Company will evaluate subsequent events through the date when the financial statements were issued. Pursuant to ASU 2010-09 of the FASB Accounting Standards Codification, the Company considers its financial statements issued when they are widely distributed to users, such as through filing them with OTC Markets. No subsequent events required disclosure except for those in Note 11.
Recent Accounting Standards Adopted
On January 1, 2019, the Company adopted ASU 2016-18. The adoption had an impact on the Company’s beginning of the period and end of the period cash and cash equivalents balance in its statement of cash flows. Restricted cash at the end of December 31, 2019 was related to debt service reserve and maintenance reserves required by third party senior lender. The restricted cash at the end of December 31, 2108 related to future acquisition of Italian parks that was completed in 2019. The following table provides a reconciliation of cash, cash equivalents, and restricted cash reported in the consolidated balance sheet that equals the total of the same amounts reported in the consolidated statement of cash flows:
|
|
| December 31, 2019 |
|
| December 31, 2018 |
| ||
|
|
|
|
|
|
|
| ||
| Cash and cash equivalents |
| $ | 1,076,995 |
|
| $ | 1,026,533 |
|
| Restricted cash |
|
| 349,434 |
|
|
| 8,857,966 |
|
| Total cash, cash equivalents, and restricted cash |
| $ | 1,426,429 |
|
| $ | 9,884,499 |
|
| F-14 |
| Table of Contents |
In June 2018, the FASB issued ASU No. 2018-07, Compensation – Stock Compensation (Topic 718): Improvements to Nonemployee Share-Based Payment Accounting. The guidance in this ASU expands the scope of ASC Topic 718 to include all share-based payment arrangements related to the acquisition of goods and services from both nonemployees and employees. This amendment is effective for annual and interim on January 1st, 2019. The ASU No. 2018-07 adoption did not have a material impact on its financial position, results of operations or financial statement disclosure.
Recent Accounting Standards Not Adopted
In February 2016, the FASB issued ASU 2016-02, Leases (Topic 842), to increase transparency and comparability among organizations by recognizing a right-of-use asset and a lease liability on the balance sheet for all leases with terms longer than 12 months. Leases will be classified as either operating or financing, with such classifications affecting the pattern of expense recognition in the income statement. ASU 2016-02 is effective for fiscal years beginning after December 15, 2019, and early adoption is permitted. ASU 2016-02 was recently delayed for emerging growth companies that elected to adopt new accounting standards on the adoption date required for private companies and will be effective for the Company’s annual reporting period in 2022 and interim periods beginning first quarter of 2023. The Company is evaluating the impact ASU 2016-02 will have on its financial statements and associated disclosures.
In June 2016, the FASB issued ASU No. 2016-13, Financial Instruments-Credit losses (Topic 326). This new guidance will change how entities account for credit impairment for trade and other receivables, as well as for certain financial assets and other instruments. The update will replace the current incurred loss model with an expected loss model. Under the incurred loss model, a loss (or allowance) is recognized only when an event has occurred (such as a payment delinquency) that causes the entity to believe that a loss is probable (that is has been “incurred”). Under the expected loss model, a loss (or allowance) is recognized upon initial recognitions of the asset that reflects all future events that leads to a loss being realized, regardless of whether it is probable that the future event will occur. The incurred loss model considers past events and conditions, while the expected loss model includes expectations for the future which have yet to occur. ASU 2018-19 was issued in November 2018 and excludes operating leases from the new guidance. The standard will require entities to record a cumulative-effect adjustment to the balance sheet as of the beginning of the first reporting period in which the guidance is effective. As an Emerging Growth Company, the standard is effective for the Company’s 2022 annual reporting period and interim periods beginning first quarter of 2023. The Company is evaluating the impact of ASU 2016-13 will have on its financial statements and associated disclosures.
On December 18, 2019, the FASB issued Accounting Standards Update 2019-12, Income Taxes (Topic 740): Simplifying the Accounting for Income Taxes (the ASU), as part as part of its overall simplification initiative to reduce costs and complexity of applying accounting standards while maintaining or improving the usefulness of the information provided to users of financial statements. The FASB’s amendments primarily impact ASC 740, Income Taxes, and may impact both interim and annual reporting periods. The Company is currently evaluating the effect that the adoption of ASU 2019-12 will have on its consolidated financial statement. The guidance is effective January 1, 2021 with early adoption permitted.
4. Acquisitions and dispositions
2019 Acquisition of Zonepark Rilland.
On December 20, 2019, AEN 01 BV (“Buyer”), a Netherlands company and a wholly-owned subsidiary of Alternus Energy Inc. (“ALTN”), completed the acquisition of an 11.75 MW ground-mounted solar photovoltaic (PV) power plant in Rilland, the Netherlands (the “Project”) from Coöperatie Unisun Energy U.A., a Netherlands corporation (“Seller”) for $11.7 million plus a working capital adjustment (“Purchase Price”). The Purchase Price includes the assumption of a third-party senior bank debt facility in the amount $8.3 million, that amortizes equally over the next 14 years. We also acquired the various offtake and operations contracts for the solar plant. In addition to the Purchase Price, the Seller will be entitled to receive additional consideration from ALTN of up to a maximum $560,000 in the form of an earn-out payment based on net cash proceeds to equity received over and above a set annual power output of 10,865 MwH. (See Note 7 for details on the debt associated with the acquisition).
| F-15 |
| Table of Contents |
The Project has been operational since January 2019 and enjoys a 15-year government counterparty ‘Feed-in-Tariff’ (“FiT”) contract at fixed sales prices, in addition to a Power Purchase Agreement (“PPA”) with a local energy operator. The combined contracts provide long-term predictable positive cash flows to Alternus. Based on current energy production Rilland is expected to add approximately $1.3 million in annual revenues for at least 15 years at average 75% gross margins to Alternus.
The Buyer funded $2.1 million of the Purchase Price through the issuance of a $2.4 million issued to an accredited investor, bearing interest at 8%, amortizing over 8 years and secured by collateral, including the shares of the Buyer. ALTN incurred approximately $0.6 million in transaction fees related to the acquisition, some of which were paid from the proceeds of the Bond Subscription Agreement.
Additionally, the Seller issued a $1.9 million loan to ALTN which is due by January 31, 2020 (the “Loan”), pursuant to a Loan Agreement by and among the Seller, the Buyer and ALTN. If ALTN does not repay the Loan by February 1, 2020, the investor has the right under the Call Option Agreement to require ALTN to sell the shares of Buyer to the investor in exchange for the total amount of the Loan (See note 12-subsequent events) .
| Cost of Acquisition |
|
|
| |
| Acquisition price |
| $ | 11,651,997 |
|
| Net working capital acquired |
|
| 419,011 |
|
| Total Acquisition Cost |
|
| 12,071,008 |
|
|
|
|
|
|
|
| Fair Value of Assets Acquired |
|
|
|
|
| Present value of the future cash flows |
|
| 9,853,884 |
|
| Net working capital acquired |
|
| 419,011 |
|
|
|
|
| 10,272,895 |
|
|
|
|
|
|
|
| Goodwill |
| $ | 1,798,113 |
|
2019 Acquisition of Risen Energy SPV.
In April 2019, PC-Italia-02 S.R.l., a wholly owned subsidiary of Alternus Energy Inc.’s (the “Company”) Netherlands’ subsidiary, completed the acquisition of 100% of the share capital of 4 out of 5 SPVs (Special Purpose Vehicles) the Company planned to purchase under a definitive sale and purchase agreement signed with Risen Energy PV Holding Italy GmbH and Risen Energy (HongKong) Co., Limited. The total acquisition consisted of 7 operating photovoltaic plants located in Italy having a total installed capacity of 5.1 MWs in exchange for approximately $8.1M cash, less $1.5M held back for the acquisition of the 5th SPV, and less $0.4M held in escrow for 2 months from closing against certain tax open items and as a hold back for any unexpected items not found in due diligence. The purchase was treated as business combination, as defined by ASC 805, Business Combinations.
The fair value of the purchase consideration issued to the sellers of the project was allocated to the net assets acquired. The Company accounted for the acquisition as the purchase of a business under U.S. GAAP under the acquisition method of accounting, and the assets and liabilities acquired were recorded as of the acquisition date at their respective fair values and consolidated with those of the Company. The fair value of the net assets acquired was approximately $9.9 million. The excess of the aggregate fair value of the net tangible assets has been treated as a gain on bargain purchase in accordance with ASC 805. The purchase price allocation was based, in part, on management’s knowledge of the project and the results of a fair value assessment that the Company performed.
| F-16 |
| Table of Contents |
The Company then undertook a review to determine what factors might contribute to a bargain purchase and if it was reasonable for a bargain purchase to occur. The main reason for the bargain purchase price was a motivated seller who was looking to exit the business. The seller is manufacture of product for the solar industry and not an operator. Part of their strategy to increase product sales is to develop and construct solar projects. The seller is not a long-term operator like Alternus, so their strategy is to not keep operating assets on their books for the long-term. Also, because of the small size of the operating assets we purchased and the fact that they were spread out across Italy made it more difficult for Risen to manage the assets since they are not an operator. This led to their willingness to sale the assets at a market discount. Subsequent to the acquisition of Risen facility, Alternus Energy signed a letter of intent with Risen to purchase an additional 10MWs of similar solar Projects at a price of 18.5M (euros). The price per MW was 1.85M (Euros) for an uninstalled asset as compared to the 1.35M (euros) they sold the operating asset for. This further supports that the Company position that Risen was a motivated seller and did not want to be an operator. Further, at the time of sale, Alternus has no side agreement or other commitment to purchase any assets from Risen.
|
|
| Total |
| |
| Cost of acquisitions |
|
|
| |
| Cash paid for assets |
| $ | 6,131,004 |
|
| Total acquisition cost |
| $ | 6,131,004 |
|
| Fair value of assets acquired |
|
|
|
|
| Investment in energy property |
|
| 9,939,414 |
|
| Net working capital acquired |
|
| 384,397 |
|
| Asset retirement liability |
|
| (65,114 | ) |
|
|
| $ | 10,258,697 |
|
|
|
|
|
|
|
| Gain on bargain purchase |
| $ | 4,127,693 |
|
2018 Acquisition of PSM 20 GmbH & Co KG:
On June 7, 2018, ALTN entered into a Purchase and Transfer Agreement, to acquire PSM 20 GmbH & Co KG (“PSM”),$115 in cash paid and the deposit of approximately $1.3M in cash deposited into an escrow account pursuant to an Escrow Agreement by and among the Company, as part of the above transaction, the Seller is constructing 7 photovoltaic installations with a total of 3,084 KW of power.
2018 Acquisition of GRK 17.2 GmbH & Co KG:
On November 20, 2018, Alternate Energy’s wholly owned German subsidiary, PCG_HoldCo UG (“PCG”) entered into a Purchase and Transfer Agreement (pursuant to which PCG purchased one hundred percent (100%) of GRK 17.2’s entire share capital in exchange for $115 in cash paid at Closing and the deposit of approximately $419,408 in cash deposited into GRK 17.2.As part of the above transaction, the Seller is constructing 7 photovoltaic installations s in Germany with a total of 2,521KW of power.
2018 Acquisition of PSM 40 GmbH & Co KG:
On or about December 28, 2018, Alternate Energy’s wholly owned German subsidiary, PCG_HoldCo UG (“PCG”) entered into a Purchase and Transfer Agreement pursuant to which PCG purchased 100% of the share capital of PSM 40 in exchange for i) $115.00 in cash paid at Closing and ii) $570,000 in cash, a portion of which, $427,500, was immediately paid and the remaining $142,500 will be disbursed when certain conditions being met related to Grid Connection. As part of the above transaction, the Seller is constructing 6 photovoltaic installations in Germany with a total of 2,645kW of power.
2018 Acquisition of GRT 1.1 GmbH:
On or about December 21, 2018 , PCG_HoldCo UG (“PCG”), a wholly owned German subsidiary of ALTN entered into a Share Purchase and Assignment Agreement for the purchase of 100% of the share capital of GRT 1.1 GmbH (“GRT 1.1”) in exchange for i) $26,434 in cash paid at Closing, ii) the repayment of a third party cash advance in the amount of $160,845, iii) full settlement of third party liabilities in the amount of $43,046, and iv) the assumption of a senior bank loan in the amount of $876,005. As part of the above transaction, the Seller is constructing 5 photovoltaic installations in Germany with a total of 2,100 KW of power.
| F-17 |
| Table of Contents |
2018 Acquisition of Liquid Sun S.R.L.
On December 18, 2018, PC_Italia_02 S.R.l., a wholly owned subsidiary of Power Clouds Europe BV (“PC Europe”), ALTN’s Netherlands’ subsidiary, closed the acquisition of certain assets, agreements and liabilities of Liquid Sun Srl, an Italian company, related to three photovoltaic installations located on three power plants with a total of 2,244.37 KW of power located in the Budrio and Anagni regions of Italy in exchange for approximately $4.3M, plus working capital, and transaction costs, commissions and required Italian taxes.
The fair value of the purchase consideration issued to the sellers of the project was allocated to the net assets acquired. The Company accounted for the acquisition as the purchase of a business under U.S. GAAP under the acquisition method of accounting, and the assets and liabilities acquired were recorded as of the acquisition date at their respective fair values and consolidated with those of the Company. The fair value of the net assets acquired was approximately $5.8 million. The excess of the aggregate fair value of the net tangible assets has been treated as a gain on bargain purchase in accordance with ASC 805. The purchase price allocation was based, in part, on management’s knowledge of the project and the results of a fair value assessment that the Company performed.
The Company then undertook a review to determine what factors might contribute to a bargain purchase and if it was reasonable for a bargain purchase to occur. The main reason for the bargain purchase price was a motivated seller who was looking to exit the business. The seller is a supplier to the solar industry and their strategy is to not keep assets on their books for the long-term.
| Acquisition Cost |
|
|
| |
| Cash paid for assets |
| $ | 4,177,206 |
|
| Taxes paid at closing |
|
| 131,394 |
|
| Total acquisition cost |
|
| 4,308,600 |
|
|
|
|
|
|
|
| Fair value of assets acquired |
|
|
|
|
| NPV of discounted cash flow |
|
| 5,790,731 |
|
| Net working capital acquired |
|
| 148,685 |
|
| Less asset retirement obligation |
|
| (57,013 | ) |
| Net fair value of assets acquired |
| $ | 5,882,403 |
|
|
|
|
|
|
|
| Gain on bargain purchase |
| $ | 1,573,803 |
|
2018 Disposition of Tre Valli Energia S.R.L
On September 30, 2018, PC Italia 01 S.R.L. sold 100% of the share capital of Tre Valli Energia S.R.L. The net aggregate consideration received in exchange for the sale was $3,760,155.
| Proceeds from sale |
| $ | 3,760,155 |
|
| Net carrying cost of asset at time of sale |
|
| (4,688,212 | ) |
| Net working capital adjustment |
|
| 246,636 |
|
| Loss on sale of asset and related operating companies |
| $ | (681,421 | ) |
Proforma Results
The following presents the twelve months unaudited proforma combined results of operations as if the entities were combined on January 1, 2018:
|
|
| 2019 |
|
| 2018 |
| ||
| Revenues, net |
| $ | 4,347,671 |
|
| $ | 4,011,556 |
|
| Net (loss) |
| $ | (6,544,295 | ) |
| $ | (3,208,498 | )) |
| Net (loss) per share |
| $ | (0.07 | ) |
| $ | (0.04 | ) |
| Basic weighted average number of shares outstanding |
|
| 97,969,579 |
|
|
| 71,600,361 |
|
| F-18 |
| Table of Contents |
5. Investment in Energy Property and Equipment, Net
As of December 31, 2019, the Company had $33,459,478 of net investment in energy property, as outlined in the table below.
|
|
| December 31, 2019 |
|
| December 31, 2018 |
| ||
| Solar energy facilities operating |
| $ | 36,123,412 |
|
| $ | 16,278,252 |
|
| Less accumulated depreciation and amortization |
|
| (2,663,934 | ) |
|
| (1,538,485 | ) |
| Net Assets |
| $ | 33,459,478 |
|
| $ | 14,739,767 |
|
The estimated useful life remaining on the investment in energy property and intangible asset is between 14 and 20 years.
Depreciation and amortization expense for the nine months ended December 31, 2019 and 2018, was $1,193,107 and $699,573, respectively.
The Company leases various equipment under capital leases. Assets held under capital leases are included in property and equipment as follows:
|
|
| December 31, 2019 |
|
| December 31, 2018 |
| ||
| Capitalized costs relating to PV plants |
| $ | 2,311,255 |
|
| $ | 2,358,588 |
|
| Less accumulated amortization |
|
| (321,821 | ) |
|
| (208,989 | ) |
| Net Assets |
| $ | 1,989,434 |
|
| $ | 2,149,599 |
|
6. Capital Leases
We have acquired equipment through a capital lease obligations for the Sant’Angelo park in Italy. As of December 31, 2019, there was $1,011,734 remaining on the lease of which $87,785, net of interest, was the short-term portion. The lease commenced in 2011, has a term of 18 years and will expire in September 2029. Interest is calculated on the outstanding principal based on EURIBOR 3 months (EUR3M) plus an agreed margin for the lender. The average interest rate based on previous years is approximately 4.5% per annum. This interest amount may vary due to future changes in EUR3M index.
Capital lease future minimum payments for each of the next five years and thereafter is as follows:
| 2020 |
|
| 140,009 |
|
| 2021 |
|
| 140,009 |
|
| 2022 |
|
| 140,009 |
|
| 2023 |
|
| 140,009 |
|
| 2024 |
|
| 140,009 |
|
| Thereafter |
|
| 606,704 |
|
|
|
|
| 1,306,749 |
|
| Less Interest Expense |
|
| (295,015 | ) |
|
|
| $ | 1,011,734 |
|
| F-19 |
| Table of Contents |
7. Convertible and Unconvertible Promissory Notes
The following table reflects the total debt balances of the Company as of December 31, 2019 and December 31, 2018:
|
|
| December 31, 2019 |
|
| December 31, 2018 |
| ||
| Short term line of credit |
| $ | 35,120 |
|
| $ | 73,560 |
|
| Promissory notes related parties |
|
| 48,821 |
|
|
| 207,753 |
|
| Convertible notes related parties |
|
| 291,540 |
|
|
| 284,000 |
|
| Senior secured debt |
|
| 19,575,794 |
|
|
| 10,192,603 |
|
| Promissory notes |
|
| 15,478,536 |
|
|
| 13,278,803 |
|
| Convertible promissory notes |
|
| 2,169,401 |
|
|
| 1,097,289 |
|
| Gross debt |
|
| 37,599,212 |
|
|
| 25,134,007 |
|
| Debt discount |
|
| (784,130 | ) |
|
| (303,563 | ) |
| Net debt |
|
| 36,815,082 |
|
|
| 24,830,444 |
|
| Less current maturities |
|
| (22,705,665 | ) |
|
| (14,510,204 | ) |
| Long Term Debt, net of current maturities |
| $ | 14,109,418 |
|
| $ | 10,320,240 |
|
|
|
| 2020 |
|
| 2021 |
|
| 2022 |
|
| 2023 |
|
| 2024 |
|
| Thereafter |
|
| Total |
| |||||||
| Gross debt |
| $ | 23,129,751 |
|
| $ | 1,102,888 |
|
| $ | 1,108,229 |
|
| $ | 1,113,219 |
|
| $ | 1,118,312 |
|
| $ | 10,026,813 |
|
| $ | 37,599,212 |
|
| Debt discount |
|
| (424,084 | ) |
|
| (360,046 | ) |
|
|
|
|
|
|
|
|
|
|
|
|
|
|
|
|
|
| (784,130 | ) |
| Net debt |
| $ | 22,705,667 |
|
| $ | 742,842 |
|
| $ | 1,108,229 |
|
| $ | 1,113,219 |
|
| $ | 1,118,312 |
|
|
| 10,026,813 |
|
| $ | 36,815,082 |
|
Line of Credit:
In 2016, Power Clouds S.R.L entered into a 300,000 RON ($77,000) line of credit with OTP Bank. The credit line is a revolving credit facility available for the payment of trade payables up to the agreed limit. The initial term is twelve months which was renewed by agreement of both parties. Drawn funds accrue interest annually at a rate of ROBOR 3M + 3.3%, which was 6.64% as of December 31, 2019 and 6.6% as of December 31, 2018. The Company had used $35,120 and $73,560 of the facility as of December 31, 2019 and 2018.
Related Party Promissory Notes:
As of December 31, 2019 and 2018, there was an advance from PCH of $48,821 and $207,753 which is short term in nature and non-interest bearing.
Related Party Convertible Notes:
In February of 2019, the terms under which all cash previously loaned by VestCo Corp., a company owned and controlled by, the Company’s CEO, to the Company to date has been amended and restated, pursuant to which the Corporation executed a Securities Purchase Agreement with VestCo Corp. and issued to VestCo Corp. i) a convertible promissory note with a 15% OID, and therefore having a Principal Amount of $291,540, having a two year term, secured behind a third party accredited investor via a US UCC filing on all assets of the Corporation, having a call option right for the noteholder, a redemption right for the Corporation, and convertible at $0.20 per share, and ii) a warrant to purchase up to 619,522 shares of the Corporation’s Class A common stock, exercisable at $0.25 per share or through its cashless exercise provision and having a 4 year term. As at December 31, 2018, $284,000 was past due under loan notes issued to the CEO, VestCo Corp, and therefore classified as current.
Senior secured debt:
In 2016, the Company guaranteed a 6.5 million RON (equivalent to approximately US$1,592,500) promissory note issued by one of its subsidiaries, Power Clouds S.R.L., a Romanian company (“Power Clouds Romania”) to OTP Bank in Romania, which is secured in first position against the Romanian solar parks and customer contracts held by Power Clouds Romania, accruing interest annually at a rate of ROBOR 3M + 3.3% and having a term of 60 months. The Company had principal outstanding of $423,783 and $698,820 as of December 31, 2019 and 2018. The net book value of the collateralized asset was $2,766,577 and $3,055,976 as of December 31, 2019 and 2018.
In October of 2018, in order to complete additional solar park acquisitions in Germany, the Company entered into the following agreements with a third party accredited investor (the “Lender”), in connection with the Company’s German subsidiary, PCG_HoldCo UG (PCG) with an interest rate of 12% and a term of 2 years. The Company had principal outstanding of $3,585,366 and $3,644,585 as of December 31, 2019 and 2018.
| F-20 |
| Table of Contents |
In December of 2018, PSM 20 GmbH & Co KG entered into a senior secured loan with Sparkase Bank in Germany. This relates to the acquisition of 7 photovoltaic installations as part of the PSM 20 GmbH & Co KG acquisition with an interest rate of 2.10% and a term of 18 years. The Company had principal outstanding of $2,251,298 and $2,587,081 as of December 31, 2019 and 2018. The net book value of the collateralized asset was $2,775,033 and $2,763,652 as of December 31, 2019 and 2018.
In April of 2018, PSM 40 GmbH & Co KG entered into a senior secured loan with GLS Bank in Germany. This relates to the acquisition of 6 photovoltaic installations as part of the PSM 40 GmbH & Co KG acquisition with an interest rate of 2.0% and a term of 18 years. The Company had principal outstanding of $2,515,866 and $2,529,212 as of December 31, 2019 and 2018. The net book value of the collateralized asset was $3,069,655 and $3,191,370 as of December 31, 2019 and 2018.
In October of 2018, GRT 1.1 GmbH entered into a senior secured loan with MVB Bank in Germany. This relates to the acquisition of 1 photovoltaic installations as part of the GRT GmbH acquisition, with an interest rate of 2.05% and a term of 19 years. The Company had principal outstanding of $671,446 and $718,683as of December 31, 2019 and 2018. The net book value of the collateralized asset was $820,857 and $881,724 as of December 31, 2019 and 2018.
In December of 2019, as part of the acquisition of Zonnepark Rilland BV we assumed a third-party senior bank debt facility in the amount of approximately $7.7 million, with an interest rate of 1.7% and a term of 14 years. The Company had principal outstanding of $7,366,816 as of December 31, 2019, which was net of the required debt service reserve fund and maintenance reserve fund. The net book value of the collateralized asset was $9,958,300 as of December 31, 2019.
In December of 2019, as part of the acquisition of Zonnepark Rilland BV we entered into a $2.4 million bond offering issued by an accredited investor, bearing interest at 8%, amortizing over 8 years. The Company had principal outstanding of $2,411,167 as of December 31, 2019.
Promissory Notes:
In December of 2018, in order to complete additional solar park acquisitions in Italy, the Company entered into the following agreements with a third party accredited investor (the “Lender”), in connection with the Company’s German subsidiary, PCG_HoldCo UG (PCG) issuing a loan note, with an interest rate of 12% and a term of 6 months. The Company had principal outstanding of $504,667 and $4,421,147 as of December 31, 2019 and 2018.
In December of 2018, in order to complete additional solar park acquisitions in Italy, the Company entered into the following agreements with a third party accredited investor (the “Lender”), in connection with the Company’s Netherlands subsidiary, Power Clouds Europe B.V. (PCE) issuing a loan note, with an interest rate of 12% and a term of 6 months. The Company had principal outstanding of $8,857,656 as of December 31, 2018 and the loan was repaid in 2019.
In March of 2019, in order to complete additional solar park acquisitions in Italy, the Company entered into certain loan agreement with a third party accredited investor (the “Lender”), in connection with the Company’s Netherlands subsidiary, AE Europe B.V, with an interest rate of 12% and a term of twelve months. The proceeds of which were used to pay down existing senior secured debt. The Company had principal outstanding of $3,398,063 as of December 31, 2019.
In June of 2019, the Company entered into certain agreements with a third party accredited investor (the “Lender”), in connection with the Company’s Netherlands subsidiary, AE Europe B.V, with an interest rate of 7.5% until October of 2019 and then 10% thereafter and a term of ten months. The proceeds of which were used to pay down existing senior secured debt. The Company had principal outstanding of $9,676,069 as of December 31, 2019. The loan maturity date was extended until May 31, 2020.
In December of 2019, as part of the acquisition of Zonnepark Rilland BV, we issued a $1.9 million loan to the Seller which is due January 31, 2020, with no interest rate. The Company had principal outstanding of $1,895,137 as of December 31, 2019 (see note 12 subsequent events).
On September 30, 2015, as part of the transaction with World Global Assets Pte. Ltd. (WGA), in conjunction with the spin out of WRMT, $492,000 was assigned to various third parties, is not convertible, with interest of 7.5% and a maturity date of December 31, 2020. The Company had principal outstanding of $509,267 as of December 31, 2019 and December 31, 2018, which was included in convertible promissory notes in the above table.
| F-21 |
| Table of Contents |
Convertible Promissory Notes:
On September 30, 2015, the Company issued a convertible loan note for $1,000,000 to World Global Assets Pte. Ltd. (WGA), in conjunction with the spin out of WRMT. The note had a three-year term, accrued no interest, and was convertible at a fixed price of $0.20 per share, subject to certain triggers and restrictions. In 2016 a portion of the convertible loan note of approximately $300,000 was assigned to various third parties and is now convertible at market price, with a floor price of $0.20 per share. The Company had principal outstanding of $244,800 and $244,800 as of December 31, 2019 and 2018.
In July of 2018, the Company issued a convertible promissory noteto a third party foreign investor in exchange for a cash provided to the Company for working capital purposes. The note accrues 15% annual interest and is convertible into shares of restricted common stock at $0.20 per share, at the noteholder’s option, and is repayable on January 30, 2020. As the conversion price was above the market price at the time of at the time of issuance of the note no beneficial costs were recorded. The Company had principal outstanding of $304,294 and $251,666 as of December 31, 2019 and 2018.
In July of 2018, the Company issued a €80,000 convertible promissory note to a third party foreign consultant in exchange for sales commissions owed. The note accrues 15% annual interest and is convertible into shares of restricted common stock at $0.20 per share, at the noteholder’s option, and is repayable on January 30, 2020. As the conversion price was above the market price at the time of at the time of issuance of the note no beneficial costs were recorded. The Company had principal outstanding of $89,718 and $91,555 as of December 31, 2019 and 2018.
In February of 2019, the Company entered into a Securities Purchase Agreement with 4 accredited investors (the “Lenders”), in connection with an investment of a total amount of $300,000, and pursuant to which the Company issued i) a convertible promissory note with a 15% OID, having a two year term, secured behind a third party accredited investor via a US UCC filing on all assets of the Company, having a call option right for the noteholder, a redemption right for the Corporation, and convertible at $0.20 per share., and ii) a warrant to purchase shares of the Corporation’s Class A common stock equal to 50% of the total number of shares if the Note is fully converted, divided by the Exercise Price of $0.25, (equal to a total of 750,000 warrants) subject to adjustment as provided therein, exercisable at $0.25 per share or through its cashless exercise provision and having a 4 year term. The Company recorded a debt discount of $123,805 related to the warrants issued for both the February 2019, related party note and convertible promissory note. The Company had principal outstanding of $294,118 as of December 31, 2019.
In May of 2019, the Corporation entered into Securities Purchase Agreements with 4 accredited investors (the “Lenders”), in connection with an investment of up to a total amount of $150,000, and pursuant to which the Corporation issued a convertible promissory note with a 15% OID, having a two year term, secured behind an accredited investors via a US UCC filing on all assets of the Corporation, having a call option right for the noteholder, a redemption right for the Corporation, and convertible at $0.25 per share, and a warrant to purchase shares of the Corporation’s Class A common stock equal to 25% of such Lender’s investment divided by the Conversion Price of $0.25, subject to adjustment as provided therein, exercisable at $0.30 per share and having a 3 year term. We recorded $36,000 for the warrant cost allocated to debt discount and $110,118 for the beneficial conversion cost related to the convertible debt. The Company had principal outstanding of $176,471 as of December 31, 2019.
In May of 2019, the Corporation entered into a Securities Purchase Agreement with another accredited investor (the “Lender”), in connection with an investment of $500,000, and pursuant to which the Corporation issued a convertible promissory note accruing 12% interest per annum with bi-annual interest payments, having a two year term, senior in priority to all obligations of the Company other than the Company’s obligations to an accredited investor and its affiliated investment funds, or a similar replacement thereto, having a call option right for the noteholder, a redemption right for the Corporation, and convertible at $0.25 per share. The Company had principal outstanding of $500,000 as of December 31, 2019.
In November of 2019, the Company issued two convertible promissory notes to two accredited investors in the amount of $280,000 each, convertible at 70% of the lowest trading price of the Company’s Common Stock for the last 15 trading days prior to conversion, and accruing 12% interest per annum and each having a $25,000 original issue discount, with a maturity date of November 21, 2020. As part of the consideration for this investment, the Company issued 145,000 shares of restricted Class A common stock to each of the investors, as well as 725,000 shares of restricted Class A common stock to each investor that shall be returned to the Company provided that the Company repays the Notes in full by May of 2020. The Company had principal outstanding of $560,000 as of December 31, 2019.
| F-22 |
| Table of Contents |
8. Commitments and Contingencies
Litigation
The Company is not currently involved in or aware of any litigation that could result in a loss, other than the following: On February 11, 2020 Unisun obtained leave from the interim relief judge of the Court of Amsterdam for three prejudgment attachments on the shares of 3 subsidiaries of Alternus, to secure an outstanding amount owed pursuant to an outstanding loan of EUR 1,689,864 plus interest and agreed penalties. Unisun also started proceedings on the merits to claim the amounts due under this loan and the penalties. The court proceedings commenced on September 16, 2020 and we have until October 28, 2020 to submit our statement of defense. On March 24, 2020, the Company entered into a securities purchase agreement with Ultramar Energy Ltd., an accredited foreign investor, pursuant to which the Company expected to receive gross proceeds of $3.0 million, before deducting transaction costs, fees and expenses. On April 7, 2020 the Company entered into a Settlement Agreement with Unisun to resolve and settle these claims. The Company intended to use a portion of the net proceeds from Ultramar Energy to repay this loan to Unisun in the amount of $2.0 million to resolve and settle the claim. However, as of the date of this filing, the proceeds have not been received from Ultramar Energy Ltd. and there is no guarantee that the Company will ever receive the proceeds; therefore the Settlement Agreement has been terminated.
There is no other action, suit, proceeding, inquiry or investigation before or by any court, public board, government agency, self-regulatory organization or body pending or, litigation claim to the knowledge of the executive officers of the Company or any of its subsidiaries, threatened against or affecting the Company, our common stock, any of our subsidiaries or of our companies or our subsidiaries’ officers or directors in their capacities as such, in which an adverse decision could have a material adverse effect.
Operating Leases
On March 6, 2019, the Company signed a lease for office space located in Dublin, Ireland, having a term of ten years, with a break option at the end of year five. The estimated payments is $55,038 per annum, to be paid quarterly. Also the Company paid a six month security deposit in the sum of $36,820.
As part of the Rilland acquisition, the company acquired a twenty-five year lease. The annual lease payment is $139,923 for the first fifteen years and $55,969 for years sixteen through twenty five.
The Company’s Romanian operations lease the land for the solar park. The combined estimated annual cost of $16,331 for 2020 and $16,283 thereafter. The leases commenced in 2012 and run for 20 years.
|
|
| Total Lease Expense |
| |
| 2020 |
| $ | 211,291 |
|
| 2021 |
|
| 211,243 |
|
| 2022 |
|
| 211,243 |
|
| 2023 |
|
| 211,243 |
|
| 2024 |
|
| 211,243 |
|
| Thereafter |
|
| 2,309,328 |
|
|
|
| $ | 3,365,591 |
|
| F-23 |
| Table of Contents |
9. Shareholder’s Equity
Common Stock Issuances:
For the year ended December 31, 2019, 5,855,000 shares of common stock were issued to consultants for services rendered, 600,876 shares were issued as fees related to third party investment and 16,000,000 shares were issued to officers and directors for continued services and performance. The total value was based on the closing stock price of our common stock on the various dates of issuance, and equal to $1,513,214.
During the twelve months ended December 31, 2018, the Company issued a total of 9,250,000 shares of restricted Class A common stock in exchange for services rendered. The value was based on the stock price of the various dates of issuance equal to $516,500.
Common to Common Class B Stock Exchange
On October 9, 2019 a Stock Exchange Agreement was entered into by and among Company and VestCo Corp. (“VestCo”), a company owned and controlled by Vincent Browne, our Chairman and CEO, whereby VestCo returned 15,000,000 shares of ALTN common stock, which were cancelled and returned to the total authorized but unissued shares of Class A common stock of the Company, in exchange for 15,000,000 shares of Class B Common Stock of the Company. The rights of the holders of Class A Common Stock and Class B Common Stock shall be identical other than voting rights; the holder of each share of Class B Common Stock shall be entitled to five votes for each such share ( see note 12-subsequent events)
Preferred Stock Issuance:
On August 19, 2019 a Stock Exchange Agreement was entered into by and among Alternus Energy Inc. (the “Company”) and its majority shareholder, Growthcap Investments Inc. (“GII”) whereby GII returned 50,000,000 shares of ALTN Class A common stock, which were cancelled and returned to the total authorized but unissued shares of common stock of the Company, in exchange for 5,000,000 shares of Series E Convertible Preferred Stock of the Company. The shareholder has the right to convert at his discretion. The Series E Convertible Preferred, with respect to dividends, rank pari passu with the Common Stock, and with respect to distributions upon liquidation, dissolution or winding up of the Company, rank senior to the Common Stock and junior to any other series of Preferred Stock. The fair value attributed to the liquidation preference was not deemed material and was limited to the stated value of the preferred stock.
Preferred Stock Conversion:
On November 27, 2018 the 30,000,000 shares of Series D Convertible Preferred Stock held by Power Clouds Holdings Pte. Ltd. automatically converted into 30,000,000 shares of restricted Class A common stock due to the increase in total authorized common shares to 450,000,000.
Stock Incentive Plan:
In June, 2019, the Board of Directors approved the Company’s 2019 Stock Incentive Plan (the “2019 Plan”). The 2019 Plan provides for the grant of incentive stock options, nonstatutory stock options, stock appreciation rights, stock grants, and stock units (collectively, the “Awards”). Awards may be granted under the 2019 Plan to our employees, directors and consultants (collectively, the “Participants”). The maximum number of shares of common stock available for issuance under the 2019 Plan is 22,500,000 shares. The shares of common stock subject to stock awards granted under the 2019 Plan that expire, are forfeited because of a failure to vest, or otherwise terminate without being exercised in full will return to the 2019 Plan and be available for issuance under the 2019 Plan. As of December 31, 2019 no awards have been granted.
Warrants:
As of December 31, 2019, warrants to purchase up to 13,053,235 shares of restricted Class A common stock were issued and outstanding. For the year end December 31, 2019, the Company issued 1,257,022 warrants exercisable at $0.25 per share and having a 4 year term from the date of issuance. The Company also issued 150,000 warrants exercisable at $.30 per share having a 3 year term from the date of issuance. These warrants related to financing activities and were recorded as a debt discount using the relative fair value method. We valued the debt discount using the Black Shoals method. We calculated the stock price as of the data of revaluation, with a remaining term of the warrants of 3 and 4 years. The volatility was calculated at 3.2 using the historical stock price and share volume of the company. We used 1.9% as the risk free rate, based on the Treasure rates for the similar period.
| F-24 |
| Table of Contents |
During December 31, 2018, warrants to purchase up to 11,646,213 shares of restricted common stock were issued and outstanding. The Company issued 1,687,500 warrants exercisable at $0.20 per share and having a 5 year term from the date of issuance, which was related to a short term bridge facility and was recorded as a debt discount in the current year. The Company also issued 4,659,328 warrants exercisable at $.122 and having a 3 year term from the date of issuance, which was related to a short term loan facility and was recorded as a debt discount in the current year The Company also issued 5,299,385 warrants exercisable at a floor of $.122 and having a 3 year term from the date of issuance, which was related to two year loan facility. The value of the warrant is based on 80% of the last 10 days trading six months after the warrants were issued, which as of December 31, 2018 was unknow and therefor created the warrant liability. For these warrants, the Company recorded a derivative liability and debt discount of $338,861. In 2018, the Company recorded amortization expense totaling $707,603 related to the aforementioned warrants.
|
|
| December 31, 2019 |
|
| December 31, 2018 |
| ||||||||||
|
|
|
|
|
| Weighted Average |
|
|
|
|
| Weighted Average |
| ||||
|
|
| Warrants |
|
| Exercise Price |
|
| Warrants |
|
| Exercise Price |
| ||||
|
|
|
|
|
|
|
|
|
|
|
|
|
| ||||
| Balance - beginning of the year |
|
| 12,286,213 |
|
| $ | 0.13 |
|
|
| 1,240,000 |
|
| $ | 0.20 |
|
| Expired during the year |
|
| (640,000 | ) |
|
| 0.20 |
|
|
| (600,000 | ) |
| $ | .20 |
|
| Granted during the year |
|
| 1,407,022 |
|
|
| 0.26 |
|
|
| 11,646,213 |
|
|
| 0.13 |
|
| Balance - end of year |
|
| 13,053,235 |
|
| $ | 0.15 |
|
|
| 12,286,213 |
|
| $ | 0.13 |
|
|
|
|
|
|
|
|
|
|
|
|
|
|
|
|
|
|
|
| Exercisable - end of year |
|
| 13,053,235 |
|
| $ | 0.15 |
|
|
| 12,286,213 |
|
| $ | 0.13 |
|
10. Related Party Transactions
In October of 2018, the Company entered into a settlement agreement with the CTO and Telenergia Europe S.r.l., (TES) a company controlled by the CTO the Company agreed to pay $100,000 to TES in settlement of all amounts due and owed to the CTO and TES and the gain on the settlement was not material.
John Thomas, a Director of the Company, is also the owner and managing director of a merchant bank offering advisory services. The Company contracted with the related party in June of 2017 to provide certain consulting services to the Company. The related party was paid $50,000 and $10,000 for the years ended 2019 and 2018 respectively. As of June 28, 2019, this agreement was terminated.
11. Geographical Information
The Company has one operating segment and the decision-making group is the senior executive management team. The Company manages the segment by country focusing on gross profit by country.
| F-25 |
| Table of Contents |
| Revenues |
| 2019 |
|
| 2018 |
| ||
| Italy |
| $ | 1,533,298 |
|
| $ | 829,794 |
|
| Romania |
|
| 932,382 |
|
|
| 1,763,170 |
|
| Germany |
|
| 106,734 |
|
|
| - |
|
| Netherlands |
|
| 13,154 |
|
|
| - |
|
| Total |
| $ | 2,585,568 |
|
| $ | 2,592,964 |
|
|
|
|
|
|
|
|
|
|
|
| Cost of Revenues |
|
|
|
|
|
|
|
|
| Italy |
| $ | 206,149 |
|
| $ | 132,776 |
|
| Romania |
|
| 490,001 |
|
|
| 1,145,838 |
|
| Germany |
|
| 41,947 |
|
|
| - |
|
| Netherlands |
|
| - |
|
|
| - |
|
| Total |
| $ | 738,097 |
|
| $ | 1,278,614 |
|
|
|
|
|
|
|
|
|
|
|
| Gross Profit |
|
|
|
|
|
|
|
|
| Italy |
| $ | 1,327,149 |
|
| $ | 697,018 |
|
| Romania |
|
| 442,381 |
|
|
| 617,332 |
|
| Germany |
|
| 64,787 |
|
|
| - |
|
| Netherlands |
|
| 13,154 |
|
|
| - |
|
| Total |
| $ | 1,847,471 |
|
| $ | 1,314,350 |
|
|
|
| December 31, |
| |||||
| Investment In Energy Property and Equipment, Net |
| 2019 |
|
| 2018 |
| ||
| Romania |
| $ | 4,772,109 |
|
| $ | 5,272,802 |
|
| Italy |
|
| 17,067,553 |
|
|
| 8,048,477 |
|
| Germany |
|
| 1,661,516 |
|
|
| - |
|
| Netherlands |
|
| 9,958,300 |
|
|
| 1,418,488 |
|
|
|
| $ | 33,459,478 |
|
| $ | 14,739,767 |
|
12. Subsequent Events
In accordance with ASC 855, Subsequent Events, we have evaluated subsequent events through the date of issuance of these financial statements.
In January 2020, the Company entered into a Securities Purchase Agreement with another accredited investor (the “Lender”), in connection with an investment of $250,000, and pursuant to which the Company issued a convertible promissory note accruing 12% interest per annum with bi-annual interest payments, having a two year term, senior in priority to all obligations of the Company other than the Company’s obligations to an accredited investor and its affiliated investment funds, or a similar replacement thereto, having a call option right for the noteholder, a redemption right for the Corporation, and convertible at $0.20 per share.
In January of 2020, ALTN HoldCo UG entered into a construction financing loan of $3.9 million with MVB Bank in Germany. This relates to the construction of 6 photovoltaic installations in Germany with an interest rate of 6.5% and a term of one year.
In February of 2020, the Corporation entered into a Securities Purchase Agreement with another accredited investor (the “Lender”), in connection with an investment of $105,000, and pursuant to which the Company issued a promissory note convertible at 65% of the lowest trading price of the Company’s Class A Common Stock for the last 15 trading days prior to conversion, and accruing 10% interest per annum, with a maturity date of February 10, 2021.
| F-26 |
| Table of Contents |
In the first quarter of 2020, the Corporation issued 135,368 shares of Class A common stock as fees related to third party investment, and 33,250 shares of restricted Class A common stock were issued to a consultant for services rendered. The total value was based on the closing stock price of our common stock on the various dates of issuance, and equal to $29,150.
On March 20, 2020, the Company received a notice of conversion from Growthcap Investments Inc. (“GII”) to convert the entirety of its shares of Series E Convertible Preferred Stock, with a stated value of $0.001 per share, into an aggregate of 50,000,000 shares of the Company’s Class A Common Stock (the “Conversion”). On March 20, 2020, the Company effected the Conversion and issued to GII an aggregate of 50,000,000 shares of Class A Common Stock.
On March 24, 2020 the Company and Ultramar Energy Ltd., a foreign institutional accredited investor (the “Investor”), entered into a $3.0 million securities purchase agreement (the “Securities Purchase Agreement”) pursuant to which the Company will sell and issue to the Investor an aggregate of 30,000,000 shares of the Company’s Class A Common Stock, par value $0.001 per share, at a price of $0.10 per share (the “Private Placement”). Pursuant to the Securities Purchase Agreement, the Company will also issue to the Investor a one-year warrant (“Class A Warrant”) to purchase up to 12,000,000 shares of the Class A Common Stock. Class A Warrant will have an exercise price equal to $0.125, subject to the additional terms of Class A Warrant. As of the date of the filing of this report, the Company has not received the proceeds from the $3.0 million Private Placement. The Company extended the closing of this Private Placement to April 30, 2020. As of the date of issuance of this report, the Company does not expect that it will ever receive these funds.
On April 7, 2020 the Company entered into a Settlement Agreement with Unisun whereby the Company agreed to pay Unisun $2,000,000 as full settlement for all the outstanding amounts owed under the loan from Unisun and related to the acquisition of Zonnepark Rilland, other than the potential earn out as described in Note 4. As of the date of the filing of this report, the Company has not made the $2,000,000 payment to Unisun, due to the non-receipt of the proceeds from the $3.0 million Private Placement described above and the Settlement Agreement has therefore been terminated. As a result, Unisun started court proceedings to claim the amounts due under its loan and related penalties. The court proceedings commenced on September 16, 2020 and we have until October 28, 2020 to submit our statement of defense.
On May 22, 2020, the Corporation issued 700,000 shares of Class A common stock to two consultants for services rendered. The total value was based on the closing stock price of our common stock on the various dates of issuance, and equals $77,000.
On June 12, 2020, Alternus Energy International Limited (“Alternus” or the “Purchaser”), a wholly owned subsidiary of the Company, and Sycamore Capital (Italy) Limited (the “Seller”) entered into a Share Purchase Agreement (the “SPA”). Pursuant to the terms of the SPA, the Seller agreed to sell to Alternus 100% of the share capital of Solar Sicily S.r.l., an Italian SPV that owns and is acquiring the project rights to develop and construct a 102 MW ground-mounted solar photovoltaic (PV) power plant in Sicily, Italy (the “Project”), in exchange for approximately $15.4 million (€14 million), to be paid on closing (the “Purchase Price”).
In July, the Company incorporated 3 new wholly owned subsidiaries, one in the Netherlands, AEN 02 B.V, and two in Italy, PC-Italia-04 Srl, which is wholly owned by AEN 02 BV, and PC-Italia-03 Srl, which is wholly owned by Alternus Energy International Ltd. These companies were incorporated to acquire various special purpose vehicles (SPVs), project rights and other solar energy assets in various locations across Europe.
On August 12, 2020, the Company issued an option to purchase up to 100,000 shares of restricted common stock under the Corporation’s 2019 Stock Incentive Plan, having a three year vesting schedule and exercisable at $0.10 per share with a cashless exercise provision.
On August 12, 2020, the Company guaranteed a 9.15 million RON (equivalent to approximately US$2.0M) promissory note issued by both of its subsidiaries, Power Clouds S.R.L., and F.R.A.N. Energy Investment SRL two Romanian companies to OTP Bank in Romania, which is secured in first position against the Romanian solar parks and customer contracts held, accruing interest annually at a rate of ROBOR 3M + 3.3% and having a term of 10 years.
The recent outbreak of the corona virus, also known as “COVID-19”, has spread across the globe and is impacting worldwide economic activity. Conditions surrounding the corona virus continue to rapidly evolve and government authorities have implemented emergency measures to mitigate the spread of the virus. The outbreak and the related mitigation measures may have an adverse impact on global economic conditions as well as on the Company’s business activities. The extent to which the corona virus may impact the Company’s business activities will depend on future developments, such as the ultimate geographic spread of the disease, the duration of the outbreak, travel restrictions, business disruptions, and the effectiveness of actions taken in the United States and other countries to contain and treat the disease. These events are highly uncertain and as such, the Company cannot determine their financial impact at this time
| F-27 |
| Table of Contents |
EXHIBIT INDEX
| 73 |
| Table of Contents |
Pursuant to the requirements of Section 13 or 15(d) of the Securities Exchange Act of 1934, the registrant has caused this report to be signed on its behalf by the undersigned, thereunto duly authorized.
|
| ALTERNUS ENERGY INC. |
| |
|
|
|
|
|
| Dated: October 2, 2020 | By: | /s/ Vincent Browne |
|
|
| Vincent Browne |
| |
|
| Chief Executive Officer and Director |
| |
|
| (Principal Executive Officer) |
| |
|
|
|
|
|
| Dated: October 2, 2020 | By: | /s/ Joseph E. Duey |
|
|
| Joseph E. Duey |
| |
|
| Chief Financial Officer |
| |
|
| (Principal Financial Officer and Principal Accounting Officer) |
| |
Pursuant to the requirements of the Securities Exchange Act of 1934, this Annual Report has been signed below by the following persons on behalf of the registrant and in the capacities and on the dates indicated.
| Dated: October 2, 2020 | By: | /s/ Vincent Browne |
|
|
|
| Vincent Browne, Chief Executive Officer and Director |
|
|
|
| (Principal Executive Officer) |
|
|
|
|
|
|
| Dated: October 2, 2020 | By: | /s/ Joseph E. Duey |
|
|
|
| Joseph E. Duey, Chief Financial Officer |
|
|
|
|
|
|
| Dated: October 2, 2020 | By: | /s/ John McQuillan |
|
|
|
| John McQuillan, Director |
|
| Dated: October 2, 2020 | By: | /s/ John Thomas |
|
|
|
| John Thomas, Director |
|
| 7
|