Attached files
| file | filename |
|---|---|
| EX-99.1 - EXHIBIT 99.1 - PLBY Group, Inc. | tm2032160d1_ex99-1.htm |
| EX-10.7 - EXHIBIT 10.7 - PLBY Group, Inc. | tm2032160d1_ex10-7.htm |
| EX-10.6 - EXHIBIT 10.6 - PLBY Group, Inc. | tm2032160d1_ex10-6.htm |
| EX-10.5 - EXHIBIT 10.5 - PLBY Group, Inc. | tm2032160d1_ex10-5.htm |
| EX-10.4 - EXHIBIT 10.4 - PLBY Group, Inc. | tm2032160d1_ex10-4.htm |
| EX-10.3 - EXHIBIT 10.3 - PLBY Group, Inc. | tm2032160d1_ex10-3.htm |
| EX-10.2 - EXHIBIT 10.2 - PLBY Group, Inc. | tm2032160d1_ex10-2.htm |
| EX-10.1 - EXHIBIT 10.1 - PLBY Group, Inc. | tm2032160d1_ex10-1.htm |
| EX-2.1 - EXHIBIT 2.1 - PLBY Group, Inc. | tm2032160d1_ex2-1.htm |
| 8-K - FORM 8-K - PLBY Group, Inc. | tm2032160d1_8k.htm |
Exhibit 99.2

INVESTOR PRESENTATION October 2020
Legal Disclaimer This presentation (this “Presentation”) is provided for information purposes only and has been prepared to assist interested par ties in making their own evaluation with respect to a potential business combination between Mountain Crest Acquisition Corp. (“MCAC”) and Playboy Enterprises, Inc. (“Playboy” or the “Company”) and related transactions (the “Pr opo sed Business Combination”) and for no other purpose. No representations or warranties, express or implied are given in, or in respect of, this Presentation. To the fullest extent pe rmitted by law in no circumstances will MCAC, Playboy or any of their respective subsidiaries, stockholders, affiliates, representatives, partners, directors, officers, employees, advisers or agents be responsible or liable for any di rec t, indirect or consequential loss or loss of profit arising from the use of this Presentation, its contents, its omissions, reliance on the information contained within it, or on opinions communicated in relation thereto or otherwise aris ing in connection therewith. Industry and market data used in this Presentation have been obtained from third - party industry publications and sources as well as from research reports prepared for other purposes. Neither MCAC nor Pla yboy has independently verified the data obtained from these sources and cannot assure you of the data’s accuracy or completeness. This data is subject to change. In addition, this Presentation does not purport to be all - inclu sive or to contain all of the information that may be required to make a full analysis of Playboy or the Proposed Business Combination. Viewers of this Presentation should each make their own evaluation of Playboy and of the relev anc e and adequacy of the information and should make such other investigations as they deem necessary. Forward Looking Statements Certain statements included in this Presentation that are not historical facts are forward - looking statements for purposes of th e safe harbor provisions under the United States Private Securities Litigation Reform Act of 1995. Forward - looking statements generally are accompanied by words such as “believe,” “may,” “will,” “estimate,” “continue,” “anticipate,” “i ntend,” “expect,” “should,” “would,” “plan,” “predict,” “potential,” “seem,” “seek,” “future,” “outlook,” “model,” “target,” “goal,” and similar expressions that predict or indicate future events or trends or that are not statement s o f historical matters. These forward - looking statements include, but are not limited to, statements regarding estimates and forecasts of other financial and performance metrics and projections of market opportunity. These statements ar e b ased on various assumptions, whether or not identified in this Presentation, and on the current expectations of MCAC’s and Playboy’s management and are not predictions of actual performance. These forward - looking statements are provided for illustrative purposes only and are not intended to serve as, and must not be relied on by any investor as, a guarantee, an assurance, a prediction or a definitive statement of fact or probability. Actual event s a nd circumstances are difficult or impossible to predict and will differ from assumptions. Many actual events and circumstances are beyond the control of MCAC and Playboy. These forward - looking statements are subject to a number of risks and uncertainties, including changes in domestic and foreign business, market, financial, political and legal conditions; the inability of the parties to successfully or timely consummate the Proposed Business Combination, includ ing the risk that any required regulatory approvals are not obtained, are delayed or are subject to unanticipated conditions that could adversely affect the combined company or the expected benefits of the Proposed Business C omb ination or that the approval of the stockholders of MCAC or Playboy is not obtained; failure to realize the anticipated benefits of the Proposed Business Combination; risks relating to the uncertainty of the projected financial i nfo rmation with respect to Playboy; risks related to the organic and inorganic growth of Playboy’s business and the timing of expected business milestones; the effects of competition on Playboy’s future business; the amount of redemption re quests made by MCAC’s stockholders; the ability of MCAC or the combined company to issue equity or equity - linked securities or obtain debt financing in connection with the Proposed Business Combination or in the future, and tho se factors discussed in MCAC’s final prospectus dated June 5, 2020 under the heading “Risk Factors,” and other documents of MCAC filed, or to be filed, with the Securities and Exchange Commission (“SEC”). If any of these risks mat eri alize or our assumptions prove incorrect, actual results could differ materially from the results implied by these forward - looking statements. There may be additional risks that neither MCAC nor Playboy presently know or that MCAC and Pl ayboy currently believe are immaterial that could also cause actual results to differ from those contained in the forward - looking statements. In addition, forward - looking statements reflect MCAC’s and Playboy’s expectations, plans or forecasts of future events and views as of the date of this Presentation. MCAC and Playboy anticipate that subsequent events and developments will cause MCAC’s and Playboy’s assessments to change. However, while MCAC an d Playboy may elect to update these forward - looking statements at some point in the future, MCAC and Playboy specifically disclaim any obligation to do so. These forward - looking statements should not be relied upon as re presenting MCAC’s and Playboy’s assessments as of any date subsequent to the date of this Presentation. Accordingly, undue reliance should not be placed upon the forward - looking statements. Use of Projections This Presentation contains projected financial information with respect to Playboy. Such projected financial information cons tit utes forward - looking information, and is for illustrative purposes only and should not be relied upon as necessarily being indicative of future results. The assumptions and estimates underlying such financial forecast information are inherently uncertain and are subject to a wide variety of significant business, economic, competitive and other risks and uncertainties. See “Forward - Looking Statements” above. Actual results may differ materially from the results con templated by the financial forecast information contained in this Presentation, and the inclusion of such information in this Presentation should not be regarded as a representation by any person that the results reflected in such for ecasts will be achieved. PLAYBOY 2020 2

Legal Disclaimer (Continued) PLAYBOY 2020 3 Financial Information; Non - GAAP Financial Measures The financial information and data contained in this Presentation is unaudited and does not conform to Regulation S - X. According ly, such information and data may not be included in, may be adjusted in or may be presented differently in, any proxy statement/prospectus or registration statement to be filed by MCAC with the SEC, and such differences may be ma ter ial. In particular, all Playboy historical financial information included herein is preliminary and subject to change pending finalization of the audits of Playboy and its subsidiaries as of and for the years ended December 31, 2019 and December 31, 2018 in accordance with PCAOB auditing standards, including without limitation the adoption and application of FASB ASC Topic 606, Revenue From Contracts With Customers, which is expected to result in certain li censing revenue recognition period to period timing differences from Playboy’s historical revenue included in this Presentation. Some of the financial information and data contained in this Presentation, such as Adjusted Revenue, Adjusted EBITDA and Adju ste d EBITDA Margin, has not been prepared in accordance with United States generally accepted accounting principles (“GAAP”). MCAC and Playboy believe that the use of these non - GAAP financial measures provides an additiona l tool for investors to use in evaluating historical or projected operating results and trends in and in comparing Playboy’s financial measures with other similar companies, many of which present similar non - GAAP financial measures t o investors. Management does not consider these non - GAAP measures in isolation or as an alternative to financial measures determined in accordance with GAAP. The principal limitation of these non - GAAP financial measures is that they exclude significant expenses and revenue that are required by GAAP to be recorded in Playboy’s financial statements. In addition, they are subject to inherent limitations as they reflect the exercise of judgments by mana gem ent about which expense and revenue items are excluded or included in determining these non - GAAP financial measures. In order to compensate for these limitations, management presents historical non - GAAP financial measures in connection with GAAP results. You should review Playboy’s audited financial statements, which will be included in the Proxy Statement (as defined below). However, not all of the information necessary for a quantitative reconcil iat ion of the forward - looking non - GAAP financial measures to the most directly comparable GAAP financial measures is available without unreasonable efforts at this time. Important Information About the Proposed Business Combination and Where to Find It In connection with the Proposed Business Combination, MCAC intends to file a proxy statement (the “Proxy Statement”) with the SE C, which will be distributed to holders of MCAC’s common stock in connection with MCAC’s solicitation of proxies for the vote by MCAC’s stockholders with respect to the Proposed Business Combination and other matte rs as described in the Proxy Statement. MCAC will mail a definitive proxy statement, when available, to its stockholders. INVESTORS AND SECURITY HOLDERS ARE URGED TO READ THE PROXY STATEMENT, ANY AMENDMENTS THERETO AND ANY OTHER DOCU MEN TS FILED WITH THE SEC CAREFULLY AND IN THEIR ENTIRETY WHEN THEY BECOME AVAILABLE BECAUSE THEY WILL CONTAIN IMPORTANT INFORMATION ABOUT MCAC, PLAYBOY AND THE PROPOSED BUSINESS COMBINATION. I nve stors and security holders may obtain free copies of the preliminary proxy statement and definitive proxy statement (when available) and other documents filed with the SEC by MCAC through the website mai ntained by the SEC at http://www.sec.gov, or by directing a request to MCAC at 311 West 43rd Street, 12th Floor, New York, NY 10036. INVESTMENT IN ANY SECURITIES DESCRIBED HEREIN HAS NOT BEEN APPROVED OR DISAPPROVED BY THE SEC OR ANY OTHER REGULATORY AUTHORI TY NOR HAS ANY AUTHORITY PASSED UPON OR ENDORSED THE MERITS OF THE OFFERING OR THE ACCURACY OR ADEQUACY OF THE INFORMATION CONTAINED HEREIN. ANY REPRESENTATION TO THE CONTRARY IS A CRIMINAL OF FEN SE. Participants in the Solicitation MCAC and Playboy and their respective directors and certain of their respective executive officers and other members of manag eme nt and employees may be considered participants in the solicitation of proxies with respect to the Proposed Business Combination. Information about the directors and executive officers of MCAC is set forth in its final prosp ect us dated June 5, 2020. Additional information regarding the participants in the proxy solicitation and a description of their direct and indirect interests, by security holdings or otherwise, will be included in the proxy statemen t/p rospectus and other relevant materials to be filed with the SEC regarding the Proposed Business Combination when they become available. Stockholders, potential investors and other interested persons should read the proxy statement/pr osp ectus carefully when it becomes available before making any voting or investment decisions. You may obtain free copies of these documents as indicated above. No Offer or Solicitation This Presentation shall not constitute an offer to sell or the solicitation of an offer to buy any securities, nor shall ther e b e any sale of securities in any jurisdiction in which such offer, solicitation or sale would be unlawful prior to registration or qualification under the securities laws of any such jurisdiction. No offering of securities will be made exce pt by means of a prospectus meeting the requirements of Securities Act of 1933, as amended, or an exemption therefrom. Trademarks This Presentation contains trademarks, service marks, trade names and copyrights of MCAC, Playboy and other companies, which are the property of their respective owners.

Transaction Summary 4 PLAYBOY 2020 • Playboy Enterprises Inc. (“Playboy”) to be acquired by Mountain Crest Acquisition Corp. (“MCAC”), a publicly listed special purpose acquisition vehicle with $58.5M cash in trust • Playboy pre - money equity value of $239.2M (plus $142.1M of debt = $381.3M enterprise value) • Playboy is rolling 100% of its equity into MCAC • Transaction includes a $50M common stock PIPE @ $10.00/share • Playboy has agreed to purchase 700k sponsor promote shares @ $6.35/share ($4.44M) • Pro forma market capitalization of ~$373M; enterprise value of ~$413M 1 • Playboy owns ~66% of the combined entity on a fully diluted basis • $101M new cash on the balance sheet 1 Assumes zero redemptions from SPAC 2 Does not include a total of 0.3M unit purchase options to the MCAC IPO underwriter 3 Does not reflect closing adjustments; shares issued or issuable to Playboy shareholders at closing may increase or decrease based on the net debt calculation adjustments at closing POST - TRANSACTION ENTERPRISE VALUE BUILD - UP ($MM) 1,2,3 SOURCES & USES ($MM) PRO FORMA OWNERSHIP 1,2,3 Shares in millions Shares % Mountain Crest Sponsor 1.1 3.0% SPAC IPO Investors 6.5 17.5% PIPE Investors 5.0 13.4% Playboy 24.6 66.1% Total 37.3 100.0% SPAC Sponsor 3.0% SPAC Investors 17.5% PIPE Investors 13.4% Playboy 66.1% Sources Cash Remaining in Trust $58.5 Playboy Equity Roll $239.2 PIPE - Common Shares $50.0 Total Sources $347.7 Uses Playboy Equity Roll $239.2 Fees & Expenses (Estimated) $7.0 Cash to Balance Sheet $101.5 Total Uses $347.7 Shares Outstanding 37.3 Price Per Share $10.00 Market Capitalization $372.7 Plus: Debt $142.1 Less: Cash $101.5 Enterprise Value $413.3 2021 Est. EBITDA $40.3 EV/ 2021 Est. EBITDA 10.3x
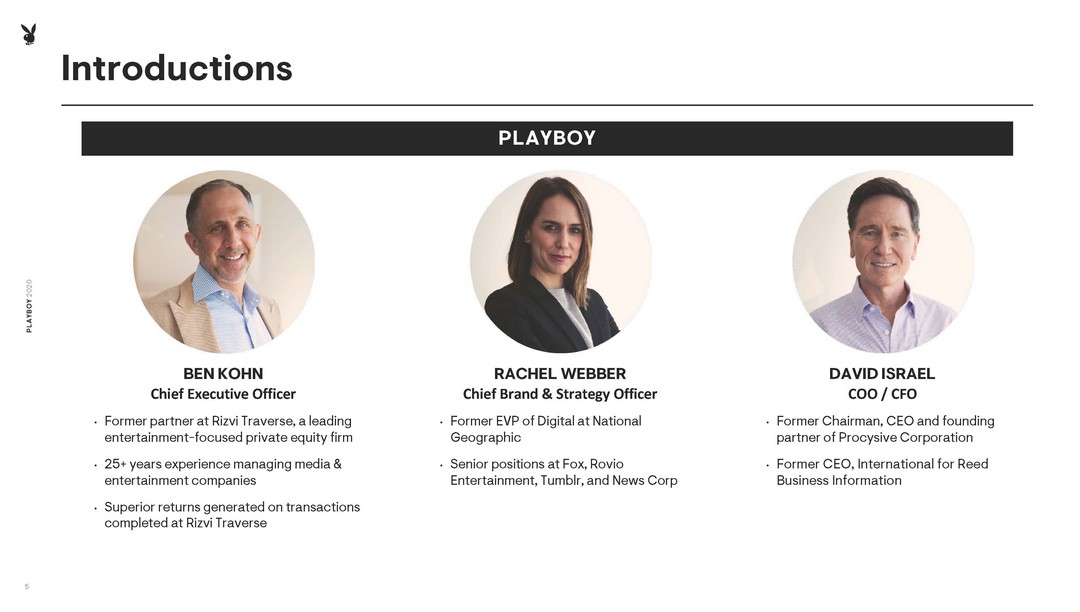
Introductions 5 PLAYBOY 2020 BEN KOHN Chief Executive Officer • Former partner at Rizvi Traverse, a leading entertainment - focused private equity firm • 25+ years experience managing media & entertainment companies • Superior returns generated on transactions completed at Rizvi Traverse RACHEL WEBBER Chief Brand & Strategy Officer • Former EVP of Digital at National Geographic • Senior positions at Fox, Rovio Entertainment, Tumblr, and News Corp DAVID ISRAEL COO / CFO • Former Chairman, CEO and founding partner of Procysive Corporation • Former CEO, International for Reed Business Information PLAYBOY
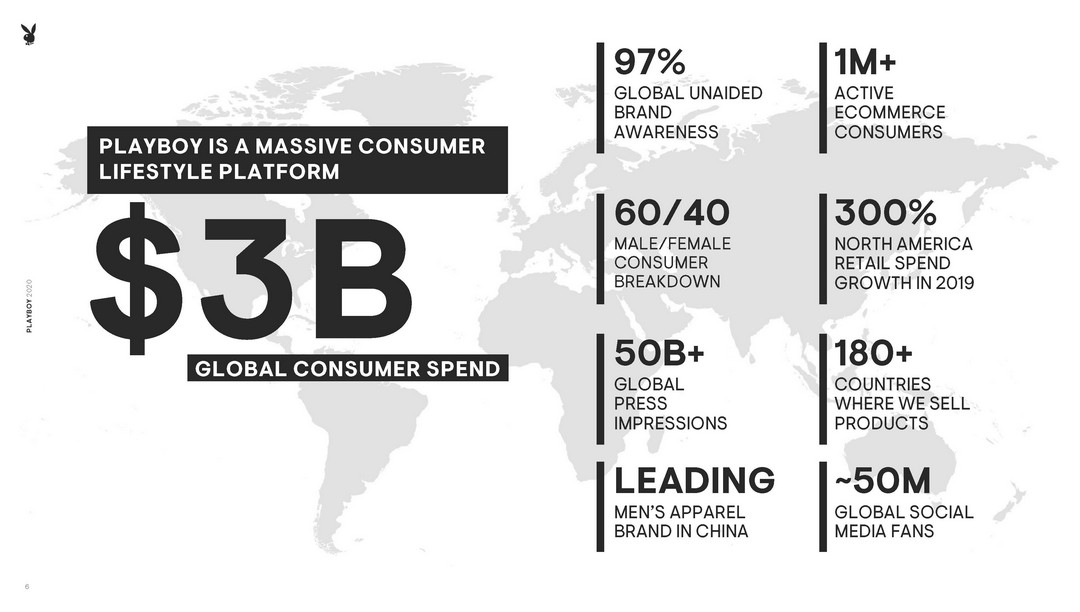
97% GLOBAL UNAIDED BRAND AWARENESS ~ 50M GLOBAL SOCIAL MEDIA FANS 60/40 MALE/FEMALE CONSUMER BREAKDOWN LEADING MEN’S APPAREL BRAND IN CHINA 1M+ ACTIVE ECOMMERCE CONSUMERS 300% NORTH AMERICA RETAIL SPEND GROWTH IN 2019 50B+ GLOBAL PRESS IMPRESSIONS 180+ COUNTRIES WHERE WE SELL PRODUCT S GLOBAL CONSUMER SPEND PLAYBOY IS A MASSIVE CONSUMER LIFESTYLE PLATFORM 6 PLAYBOY 2020

PLAYBOY 2020 7 Expand Holdings Build Brand and Business Establish a Foundation Review and Clean Up $100M+ Adjusted EBITDA 5 year goal + Full strategic review + Streamlined team + Ended advertising business + Ended off - brand partnerships + Closed underperforming businesses + Built new management team + Defined brand mission + Focused business strategy + Strengthened global licensing business as cash foundation + Re - introduced brand to audiences via content partnerships with influencers including Kylie Jenner, Travis Scott, Bad Bunny, Lizzo , King Princess and others + Re - established US business with apparel collaborations for older Gen - Z and younger millennials, driving ~$30M retail in 2019 + Acquired Yandy to build commerce and O&O foundation + Launched first O&O products via D2C and mass retailers (Wal - Mart & CVS) + Built unified consumer data platform + Aggregate highly fractured Sexual Wellness category via new product development and acquisition + Rapidly grow digital gaming business globally via acquisition + Introduce beauty, skincare and grooming product lines in US and China + Take advantage of white space category and territory opportunities (e.g., India) 2017 2018 2019 + 2020 2021+ Foundation Set to Achieve $100M+ Adjusted EBITDA Goal by 2025

$78.2 $131.2 2019A 2020E $11.7 $24.1 2019A 2020E Growth to Date Management has accelerated top - line revenue and EBITDA growth by executing organic and inorganic strategies. STRONG ADJUSTED REVENUE GROWTH ($MM) 1 D OUBLING ADJUSTED EBITDA GROWTH ($MM) 1 Source: Company management. 1 2019A revenues and EBITDA do not include Yandy . Yandy was acquired by Playboy in Dec 2019. *See non - GAAP to GAAP reconciliations at the end of the presentation. 8 PLAYBOY 2020

PLAYBOY 2020 9 Playboy’s mission is to CREATE A CULTURE WHERE ALL PEOPLE CAN PURSUE PLEASURE Artwork designed by Andy Warhol for Jan, 1986 Playboy cover
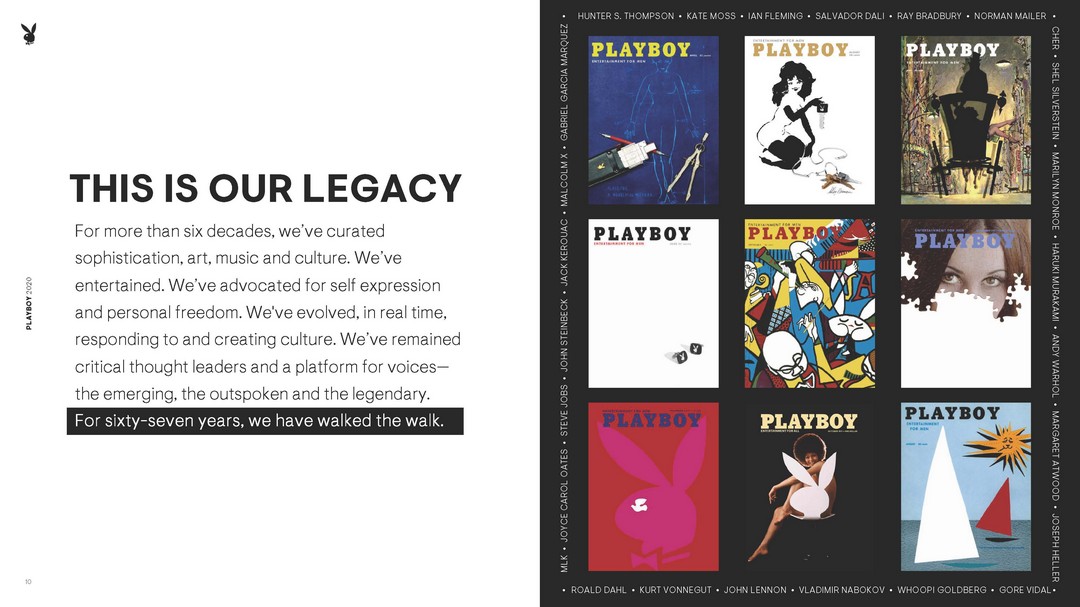
PLAYBOY 2020 10 PLAYBOY 2020 THIS IS OUR LEGACY For more than six decades, we’ve curated sophistication, art, music and culture. We’ve entertained. We’ve advocated for self expression and personal freedom. We've evolved, in real time, responding to and creating culture. We’ve remained critical thought leaders and a platform for voices — the emerging, the outspoken and the legendary. For sixty - seven years, we have walked the walk. HUNTER S. THOMPSON • KATE MOSS • IAN FLEMING • SALVADOR DALI • RAY BRADBURY • NORMAN MAILER ROALD DAHL • KURT VONNEGUT • JOHN LENNON • VLADIMIR NABOKOV • WHOOPI GOLDBERG • GORE VIDAL MLK • JOYCE CAROL OATES • STEVE JOBS • JOHN STEINBECK • JACK KEROUAC • MALCOLM X • GABRIEL GARCIA MARQUEZ CHER • SHEL SILVERSTEIN • MARILYN MONROE • HARUKI MURAKAMI • ANDY WARHOL • MARGARET ATWOOD • JOSEPH HELLER • • • •

PLAYBOY 2020 11 PLAYBOY 2020 67 Years of Cultural Relevance PLAYBOY X MISSGUIDED, PHOTOGRAPHER: ADAM RINDY, MODEL: GIGI VASS ALLO Content. Products. Influencers. Experiences.

PLAYBOY 2020 12 SEXUAL WELLNESS Intimacy, Lingerie GAMING & LIFESTYLE Digital Gaming, Hospitality, Spirits STYLE & APPAREL Fashion, Accessories BEAUTY & GROOMING Fragrance, Skincare Cosmetics Night Day We deliver THE PLEASURE LIFESTYLE PLATFORM Integrating into the habits of people around the world with products and experiences that help you look good and feel good.

PLAYBOY 2020 GAMING & LIFESTYLE + Digital gaming + Casinos & hospitality experiences + Spirits + Home, art & music STYLE & APPAREL + Men’s & women’s apparel & accessories + 20+ fashion collabs across US, Europe & Asia + Wide retail distribution + Global fragrance for men & women + CBD - based bath + Beauty, grooming & skincare expansion underway BEAUTY & GROOMING + Intimacy products, including condoms, lubricants, wipes, CBD - based arousal offerings + Ecommerce lingerie business SEXUAL WELLNESS

Diversified Offerings Represent Massive Market SEXUAL WELLNESS STYLE & APPAREL GAMING & LIFESTYLE BEAUTY & GROOMING Projected 2024 Market Size ▪ $388 billion 1 ▪ $1.9 trillion 2 ▪ $1.4 trillion 3 ▪ $434 billion 4 2020E Market Size ▪ $283 billion ▪ $1.3 trillion ▪ $1.2 trillion ▪ $360 billion 2020E Playboy Consumer Retail Sales 5 ▪ $100 million ▪ $2.7 billion ▪ $52 million ▪ $16 million 2020 E Adjusted Revenues (% of Total Adjusted Revenue) ▪ $5 4 million (41%) ▪ $69 million (53%) ▪ $4 million (3%) ▪ $3 million (2%) Key Playboy Enterprises Consumer Product Offerings in Market Today ▪ Intimates and lingerie ( yandy.com and collaborations) ▪ Condoms, lubricants, wipes and intimacy kits ▪ CBD arousal offerings ▪ Supplements including natural ED ▪ Playboy Advisor education, health & relationship content ▪ PlayboyTV, Playboy Plus, Playboy.tv ▪ Men’s & women’s casual wear, shoes / footwear, sleepwear, swimwear, formal suits, leather & non - leather goods, sweaters, active wear, and accessories ▪ Collaborations with fashion and accessories brands including Missguided , Pac Sun, Supreme, others ▪ Gaming including casinos & social venues, slots and table games, social casino gaming, live dealer ▪ Sports betting partnerships ▪ Gaming skins and in - app purchases ▪ Furniture & art ▪ Playboy Jazz Festival ▪ Spirits JV ▪ Men’s and women’s fragrance ▪ Color cosmetics Current Business Model(s) ▪ D2C product sales and subscription ▪ Licensing ▪ Strategic Collaborations ▪ D2C product sales ▪ Licensing ▪ Strategic Collaborations ▪ D2C product sales ▪ Licensing ▪ Strategic Collaborations & JVs ▪ Licensing Playboy’s existing business demonstrates strong consumer affinity in key categories; market size showcases enormous growth opportunities. 14 PLAYBOY 2020 1 Includes Intimates, Condoms, Lubricants, Sex Toys, Sexual Supplements, CBD, and Sexual Health markets. 2 Includes Men’s and Women’s Apparel and Accessories markets. 3 Includes Digital Gaming, Spirits, Furniture, Bedding, Art, and Recorded Music markets. 4 Includes Men’s and Women’s Fragrance, Skincare, Men’s Grooming, Color Cosmetics, and Beauty Supplement markets. 5 Includes global retail spend against the Playboy brand based on management estimates. Source(s): Euromonitor, Aritzon , Statista, Grand View Research, Business Wire, PR News Wire, Wall Street Research. *See non - GAAP to GAAP reconciliations at the end of the presentation.

200M INFLUENCER NETWORK REACH 3.5M ACTIVE CUSTOMERS 50M+ ORGANIC REACH 15 PLAYBOY 2020 O&O PRODUCT SALES DIGITAL SUBSCRIPTIONS LICENSING FEES accelerated & efficient product R&D higher consumer LTV lower consumer acquisition costs Multiple Monetization Models… Combined With An Owned Marketing Platform… Creates Low Cost, High Value Consumers Combination of business models and direct access to consumers allows for higher profitability and long - term scale; licensing & direct access to consumers allows for accelerated product testing & consumer insights. Building Upon A Highly Profitable Model

• Historically focused omnichannel licensing business model • ~70% of Playboy’s licensed products are sold online • More than 3 , 000 physical retail points of sale • 95% renewal rates with licensees, 7+ year tenured contracts • Leading Men’s Apparel brand in China; huge growth opportunity in Women’s & adjacent categories • Transition into an O&O platform to capture greater share of $3B global consumer spend against the brand • Geographic expansion in U.S., EU and Asia • Captures more revenue per unit sold and generates valuable consumer data and insights • Organic social marketing and influencer reach drives efficient customer acquisition Transitioning the Business Model from Licensing to Owned & Operated LICENSING MODEL O&O EXPANSION PLAYBOY 2020 16 Secured distribution for sexual wellness product offerings $28M in retail sales between Missguided and PacSun collaborations in 2019
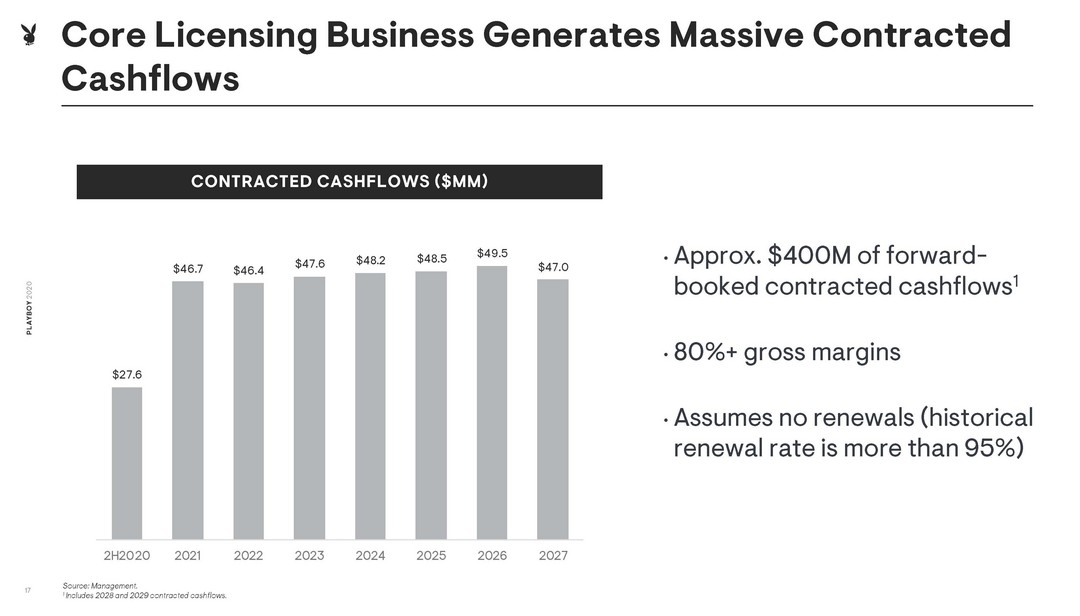
$27.6 $46.7 $46.4 $47.6 $48.2 $48.5 $49.5 $47.0 2H2020 2021 2022 2023 2024 2025 2026 2027 Core Licensing Business Generates Massive Contracted Cashflows CONTRACTED CASHFLOWS ($MM) Source: Management. 1 Includes 2028 and 2029 contracted cashflows. 17 PLAYBOY 2020 • Approx. $400M of forward - booked contracted cashflows 1 • 80%+ gross margins • Assumes no renewals (historical renewal rate is more than 95%)

PLAYBOY 2020 18 PLAYBOY 2020 Playboy H as Increased Its Licensing Value In 2018, Playboy was ranked 40th on list of the world’s most powerful brands by Licensing Global, by comparing retail sales o f licensed merchandise across all major sectors of business, from entertainment to sports, food, fashion, art and design, and more. In 2019, Playboy leapt to 21st and then climbed to 17th this year. Playboy 1 7 Rainbow The Electrolux Group NBA Stanley Black & Decker Caterpillar Pentland Brands Proctor & Gamble 18 19 20 21 22 23 24 NFL 16 Playboy 21 Proctor & Gamble The Pokémon Company Caterpillar Ferrari 22 23 24 25 NBA Bluestar Alliance The Electrolux Group Pentland Brands 19 18 19 20 Playboy 40 Twentieth Century Fox 41 Mattel NFL BBC Weight Watchers Stanley Black & Decker Entertainment One The Hershey Company 33 34 35 36 37 38 39 2018 2019 2020
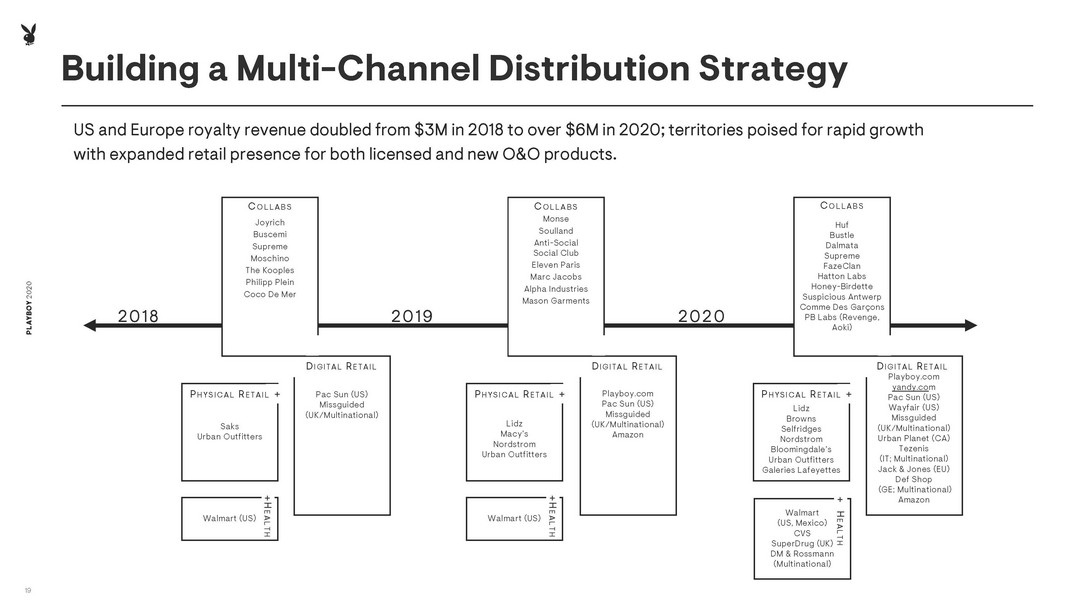
PLAYBOY 2020 19 PLAYBOY 2020 US and Europe royalty revenue doubled from $3M in 2018 to over $6M in 2020; territories poised for rapid growth with expanded retail presence for both licensed and new O&O products. C OLLABS Joyrich Buscemi Supreme Moschino The Kooples Philipp Plein Coco De Mer D IGITAL R ETAIL Pac Sun (US) Missguided (UK/Multinational) Playboy.com Pac Sun (US) Missguided (UK/Multinational) Amazon D IGITAL R ETAIL Monse Soulland Anti - Social Social Club Eleven Paris Marc Jacobs Alpha Industries Mason Garments C OLLABS Playboy.com yandy.co m Pac Sun (US) Wayfair (US) Missguided (UK/Multinational) Urban Planet (CA) Tezenis (IT; Multinational) Jack & Jones (EU) Def Shop (GE; Multinational) Amazon D IGITAL R ETAIL Huf Bustle Dalmata Supreme FazeClan Hatton Labs Honey - Birdette Suspicious Antwerp Comme Des Garçons PB Labs (Revenge, Aoki) C OLLABS Lidz Browns Selfridges Nordstrom Bloomingdale’s Urban Outfitters Galeries Lafeyettes + P HYSICAL R ETAIL + P HYSICAL R ETAIL Lidz Macy’s Nordstrom Urban Outfitters + Saks Urban Outfitters P HYSICAL R ETAIL 2018 2019 2020 Walmart (US) H EALTH + Walmart (US) H EALTH + Walmart (US, Mexico) CVS SuperDrug (UK) DM & Rossmann (Multinational) H EALTH + Building a Multi - Channel Distribution Strategy

Playboy is uniquely positioned to augment its organic growth through investment and acquisitions of companies across the Pleasure Lifestyle consumer categories. ACQUIRE INCUBATE INVEST INTEGRATE Illustrative Strategic Acquisition & Incubation Targets 20 PLAYBOY 2020 Sexual Wellness Style & Apparel Gaming & Lifestyle Beauty & Grooming Infrastructure / Consumer Data Platforms Playboy Acquisition Strategy • Scale portfolio of owned brands through strategic acquisitions • Expand and diversify product and service offerings • Incubate new owned consumer brands • Enter into strategic collaborations to launch new products and co - create content / experiences • Enhance technology, product development, marketing, and distribution capabilities • Build scaled data & analytics platform • Drive scale • Accelerate top - line revenue growth • Optimize product mix • Increase customer LTV • Drive consumer engagement and sales • Over $ 18 0M NOLs shield taxable income
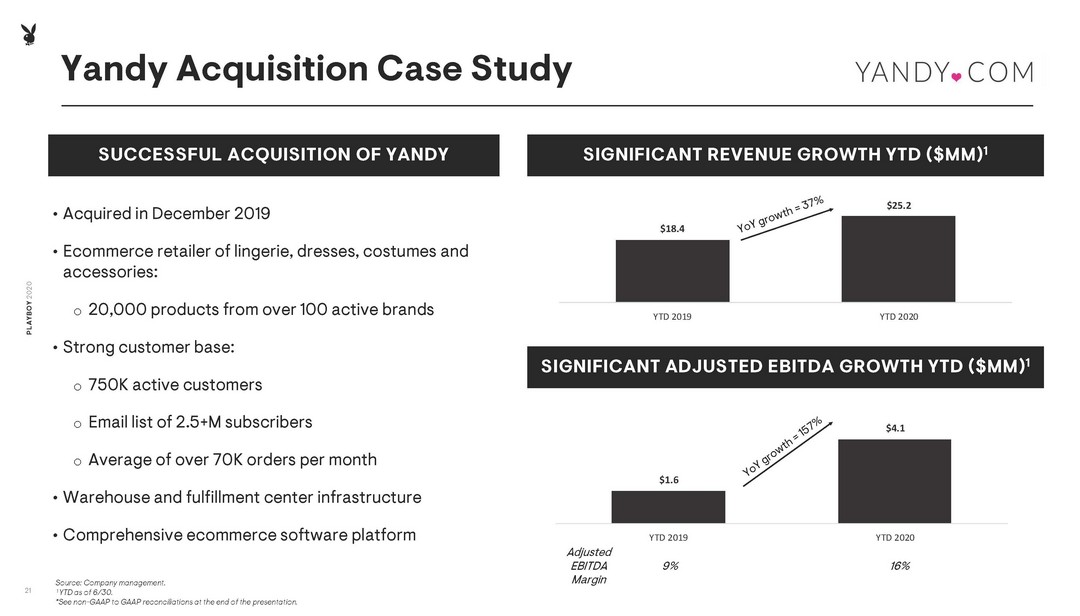
$18.4 $25.2 YTD 2019 YTD 2020 Yandy Acquisition Case Study SUCCESSFUL ACQUISITION OF YANDY SIGNIFICANT REVENUE GROWTH YTD ($MM) 1 Source: Company management. 1 YTD as of 6/30. *See non - GAAP to GAAP reconciliations at the end of the presentation. 21 PLAYBOY 2020 • Acquired in December 2019 • Ecommerce retailer of lingerie, dresses, costumes and accessories: o 20,000 products from over 100 active brands • Strong customer base : o 750 K active customers o Email list of 2.5 + M subscribers o Average of over 70K orders per month • Warehouse and fulfillment center infrastructure • Comprehensive ecommerce software platform SIGNIFICANT ADJUSTED EBITDA GROWTH YTD ($MM) 1 Adjusted EBITDA Margin 9% 16% $1.6 $4.1 YTD 2019 YTD 2020
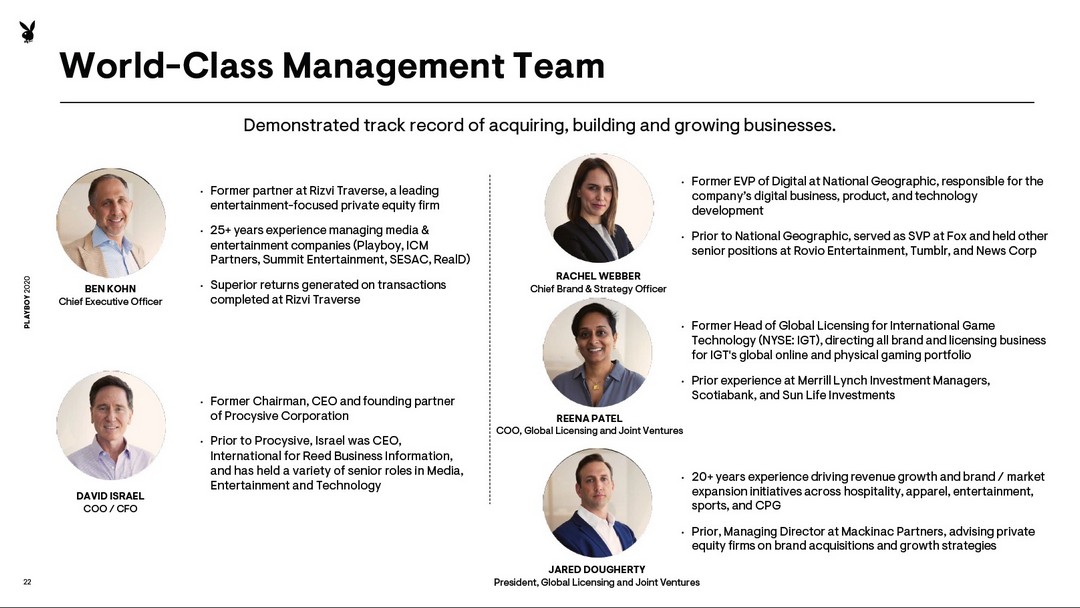
World - Class Management Team Demonstrated track record of acquiring, building and growing businesses. BEN KOHN Chief Executive Officer JARED DOUGHERTY President, Global Licensing and Joint Ventures • 20+ years experience driving revenue growth and brand / market expansion initiatives across hospitality, apparel, entertainment, sports, and CPG • Prior, Managing Director at Mackinac Partners, advising private equity firms on brand acquisitions and growth strategies • Former partner at Rizvi Traverse, a leading entertainment - focused private equity firm • 25+ years experience managing media & entertainment companies (Playboy, ICM Partners, Summit Entertainment, SESAC, RealD ) • Superior returns generated on transactions completed at Rizvi Traverse RACHEL WEBBER Chief Brand & Strategy Officer DAVID ISRAEL COO / CFO REENA PATEL COO, Global Licensing and Joint Ventures • Former EVP of Digital at National Geographic, responsible for the company’s digital business, product, and technology development • Prior to National Geographic, served as SVP at Fox and held other senior positions at Rovio Entertainment, Tumblr, and News Corp • Former Head of Global Licensing for International Game Technology (NYSE: IGT), directing all brand and licensing business for IGT's global online and physical gaming portfolio • Prior experience at Merrill Lynch Investment Managers, Scotiabank, and Sun Life Investments • Former Chairman, CEO and founding partner of Procysive Corporation • Prior to Procysive , Israel was CEO, International for Reed Business Information, and has held a variety of senior roles in Media, Entertainment and Technology 22 PLAYBOY 2020

PLAYBOY 2020 23 PLAYBOY 2020 FINANCIAL OVERVIEW SUMMARY
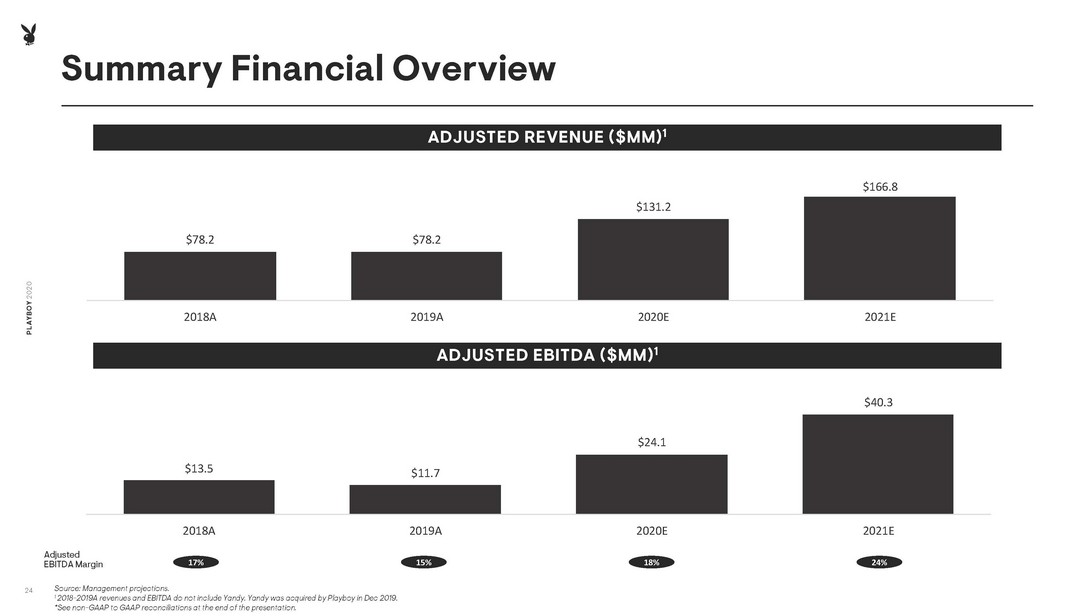
ADJUSTED REVENUE ($MM) 1 ADJUSTED EBITDA ($MM) 1 1 5 % 24% 1 7 % 1 8 % Adjusted EBITDA Margin 24 PLAYBOY 2020 Source: Management projections. 1 201 8 - 2019A revenues and EBITDA do not include Yandy . Yandy was acquired by Playboy in Dec 20 19. *See non - GAAP to GAAP reconciliations at the end of the presentation. Summary Financial Overview $78.2 $78.2 $131.2 $166.8 2018A 2019A 2020E 2021E $13.5 $11.7 $24.1 $40.3 2018A 2019A 2020E 2021E
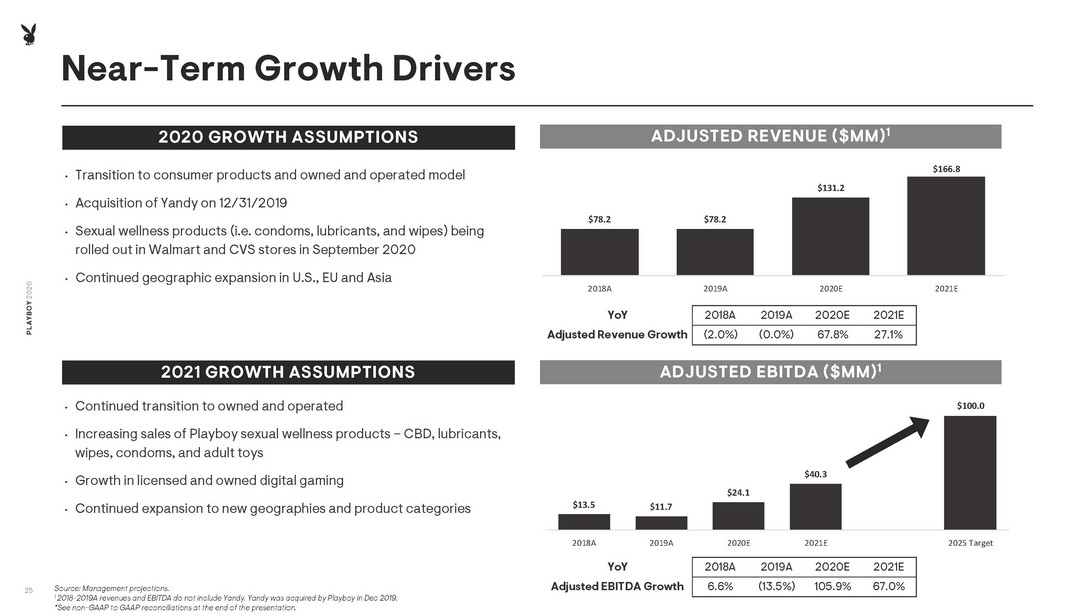
$13.5 $11.7 $24.1 $40.3 $100.0 2018A 2019A 2020E 2021E 2025 Target ADJUSTED REVENUE ($ MM ) 1 ADJUSTED EBITDA ($ MM) 1 25 PLAYBOY 2020 Near - Term Growth Drivers 2020 GROWTH ASSUMPTIONS • Transition to consumer products and owned and operated model • Acquisition of Yandy on 12/31/2019 • Sexual wellness products (i.e. condoms, lubricants, and wipes) being rolled out in Walmart and CVS stores in September 2020 • Continued geographic expansion in U.S., EU and Asia 2021 GROWTH ASSUMPTIONS • Continued transition to owned and operated • Increasing sales of Playboy sexual wellness products – CBD, lubricants, wipes, condoms, and adult toys • Growth in licensed and owned digital gaming • Continued expansion to new geographies and product categories Source: Management projections. 1 201 8 - 2019A revenues and EBITDA do not include Yandy . Yandy was acquired by Playboy in Dec 201 9. *See non - GAAP to GAAP reconciliations at the end of the presentation. YoY 2018A 2019A 2020E 2021E Adjusted EBITDA Growth 6.6% (13.5%) 105.9% 67.0% YoY 2018A 2019A 2020E 2021E Adjusted Revenue Growth (2.0%) (0.0%) 67.8% 27.1% $78.2 $78.2 $131.2 $166.8 2018A 2019A 2020E 2021E
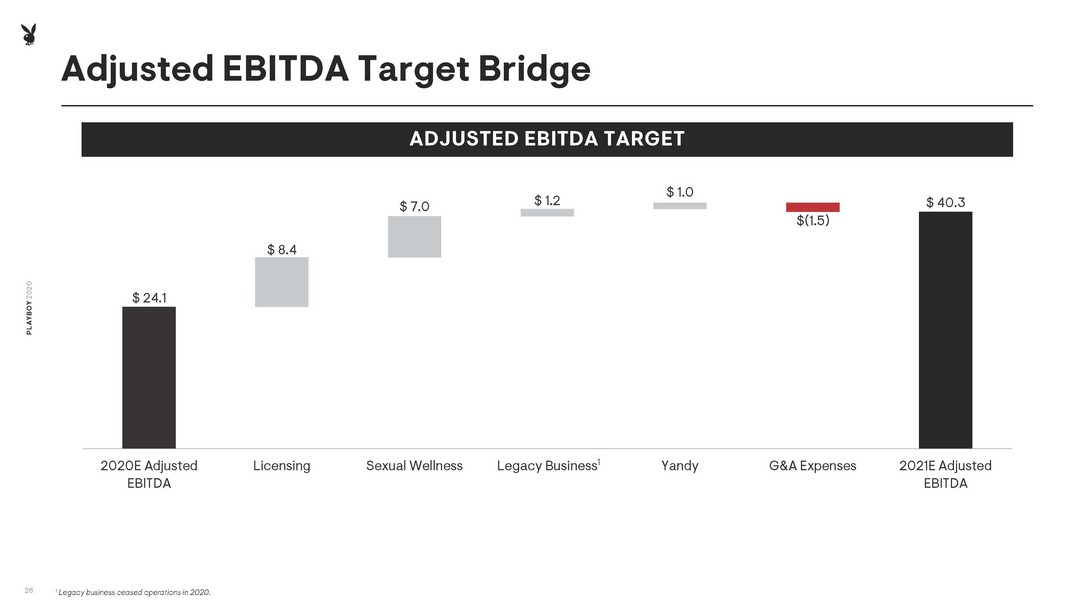
$ 24.1 $ 8.4 $ 7.0 $ 1.2 $ 1.0 $(1.5) $ 40.3 2020E Adjusted EBITDA Licensing Sexual Wellness Legacy Business Yandy G&A Expenses 2021E Adjusted EBITDA Adjusted EBITDA Target Bridge 26 PLAYBOY 2020 ADJUSTED EBITDA TARGET 1 Legacy business ceased operations in 2020. 1

$296 $104 $111 $37 $46 $84 $13 $55 $13 $3 $131 2020E Adjusted Revenue Sexual Wellness Growth Lifestyle Experiences Growth Apparel & Accessories Growth Beauty & Grooming Growth 2025E Adjusted Revenue COGS Segment OPEX G&A D&A 2025E Adjusted EBITDA • Sexual Wellness : • Introduction of new CBD, wipes, condoms and lub ricant products • Sale of lingerie and bedroom accessories through Yandy.com • Customer segmentation tools better understand and target customers • Higher average price points • Cross selling across various customer segments • Gaming & Lifestyle : • Roll out digital O&O gaming assets and cross - sell to adult and Yandy customers • Expand gaming licensing deals across new geographies and types of games • Style & Apparel : • Expand licensing business to new geographies and product categories • Execute in geographies where Playboy partner with established companies that have market pull, political connections and local market expertise • Beauty & Grooming: • Playboy - branded men's and women's skincare and grooming products • Women's beauty product line Organic Growth To $100M + of Adjusted EBITDA Target by 2025 27 PLAYBOY 2020 5 - YEAR ADJUSTED EBITDA BRIDGE ($MM) 1 KEY GROWTH ASSUMPTIONS B A D C A B C D 1 Model assumes all organic growth; does not factor in inorganic growth opportunities; Minimal CapEx expected, resulting in high free cash flow conversion *See non - GAAP to GAAP reconciliations at the end of the presentation. Highly achievable organic target where acquisitions can further accelerate growth. $54 A $4 $69 $3 B C D Gaming & Lifestyle Style & Apparel
Summary: Playboy Investment Highlights 1 2 3 4 5 Iconic Global Consumer Platform Highly Profitable Business Model M&A Acceleration Opportunity • One of the world’s most iconic global consumer lifestyle brands with massive global reach • Diversified portfolio of products / services in four high - growth consumer categories • $3B in annual global consumer spend against the Playboy brand across 180 countries • Business model and efficient marketing strategy enables meaningful margin expansion as growth accelerates • Drives low - cost product development, reduced CAC, and increased customer LTV • Approximately $400M of contracted cashflows provide significant reinvestment opportunity • Proven execution expanding from licensing to O&O product model • Well - positioned to scale portfolio of owned brands and enhance capabilities via strategic acquisitions • Accelerates top - line growth and EBITDA expansion • Over $ 18 0 M of NOLs expected to provide significant tax shield against acquired income World Class Management Team Massive Growth Opportunity In O&O • Track record of acquiring and growing businesses to generate significant returns for i nvestors • 2020 on track to grow adjusted revenues by approximately 70% and double adjusted EBITDA • Grown Yandy ~ 3 7 % YoY in the first six months post acquisition 28 PLAYBOY 2020

PLAYBOY 2020 29 PLAYBOY 2020 APPENDIX

$247 $264 $283 $304 $328 $355 $388 2018A 2019E 2020E 2021E 2022E 2023E 2024E Sexual Wellness Growth Plan Playboy’s Sexual Wellness Segment Expected to Generate Approx. $5 4 M in revenue in 2020. GLOBAL SEXUAL WELLNESS MARKET 1,2 GROWTH OPPORTUNITY Playboy Brand Value: • Playboy represents a trusted brand to the consumer and represents sex as a healthy part of an aspirational lifestyle • Playboy has the ability to be the mainstream lifestyle brand and trend setter in sexual wellness • Establishing trends puts Playboy in a powerful position to sell products at scale Growth Opportunity: • The sexual wellness industry is a large, highly - fragmented industry, estimated to grow to ~$388 billion by 2024 • Expansion plan already underway for Playboy’s recent product launches including condoms, lubricants, arousal spray, wipes (including CBD based offerings) • Opportunity to expand market share of lingerie, sex toys and accessories via acquisition and integration into Yandy infrastructure • Opportunity to acquire or build educational content services and intimacy support offerings to expand subscription and micro - transactions, leveraging well - known Playboy franchises such as the Playboy Advisor • Opportunity to acquire dating services which will serve as strong monetization and consumer data engine to power advanced marketing of suite of offerings • Opportunity to more efficiently bring to market supplements (such as ED offerings) via brand awareness and organic marketing channels • Opportunity to serve as a paid marketing platform for other sexual wellness brands that are prohibited from advertising on other channels 30 PLAYBOY 2020 ($ in billions) Source: Grand View Research, Medgadget 1 Includes Intimates, Condoms, Lubricants, Sex Toys, Sexual Supplements, CBD, and Sexual Health markets. 2 2019E - 2024E figures are extrapolated at 2018 - 2024 CAGR of 10.6% for Supplements, 2018 - 2024 CAGR of 22.2% for CBD, and 2019 - 2024 CAGR of 7.8% for Sexual Health & Relationship Products & Services.

$1,113 $1,218 $1,335 $1,464 $1,607 $1,766 $1,942 2018A 2019E 2020E 2021E 2022E 2023E 2024E Style & Apparel Growth Plan Playboy’s Fashion & Apparel Segment Expected To Generate Approx. $ 69 M in revenue in 2020. Playboy Brand Value: • Leading men’s apparel brand in China • Product categories cover men’s & women’s casual wear, shoes / footwear, intimates / lingerie, sleepwear, swimwear, formal suits, leather & non - leather goods, sweaters, active wear, and accessories • Proven consumer demand for “wearing the Rabbit Head” — particularly with contemporary, sophisticated Hypebeast / streetwear consumer; recent high - end fashion collaborations with Supreme, Moschino, MissGuided , Joyrich , PacSun Growth Opportunity: • Expansion to O&O business model via development of in - house team and/or acquisition or acqui - hire; investment in data science infrastructure to power ability to respond quickly to consumer trends; Yandy back - end infrastructure provides ability to move quickly with in - house 3PL • Expansion of men’s business in China to women’s apparel business; in addition to expansion of all categories by building local on - the ground management in China • Big revenue and cultural relevance opportunities via fashion collaborations with leading brands and influencers; big partnerships in development for 2H 2020 31 PLAYBOY 2020 ($ in billions) Source: Research and Markets, Statista. 1 Includes Men’s and Women’s Apparel and Accessories markets. 2 2019E - 2024E figures are extrapolated at 2018 - 2022 CAGR of 11.8% for Apparel and 2020 - 2023 CAGR of 9.7% for Accessories. GLOBAL APPAREL & ACCESSORIES MARKET 1,2 GROWTH OPPORTUNITY

$1,122 $1,165 $1,210 $1,259 $1,310 $1,361 $1,416 2018A 2019E 2020E 2021E 2022E 2023E 2024E Gaming & Lifestyle Growth Plan Playboy’s Lifestyle Experiences Segment Expected To Generate Approx. $ 4 M in revenue in 2020. GLOBAL LIFESTYLE EXPERIENCES MARKET 1,2 GROWTH OPPORTUNITY Playboy Brand Value: • Playboy brand well known for creating aspirational, culture - driven and fun experiences that span gaming, nightlife, hospitality, art & music • Existing gaming partnerships with the biggest suppliers globally: Microgaming, Caesars Entertainment, Scientific Games, FanDuel and more • Well positioned to expand brand into lifestyle experiences in China Growth Opportunity: • Social casino gaming generated $6.2B in revenue in 2019; opportunity to build a portfolio of games with shared branding to drive revenue and lower user acquisition costs • Open platforms, such as Unreal, enable efficient development of immersive virtual experiences; strong opportunity to create virtual Playboy Mansion / Game House to take advantage of consumer behavior and with a target audience that has an affinity for Playboy • Success with Fanduel partnerships demonstrates brand affinity with sports betting consumer base • JV partnership and execution plan in place to launch Spirits in China in 1H 2021 • Discussions underway with producers to expand beloved Playboy Jazz Festival 32 PLAYBOY 2020 ($ in billions) Source: Grand View Research, Wall Street Research, Artsy, Billboard.com, Music Business Worldwide, Statista. 1 Includes Digital Gaming, Spirits, Furniture, Bedding, Art, and Recorded Music markets. 2 2019E - 2024E figures extrapolated based on 2018 - 2024 CAGR of 7.3% for Digital Gaming, 2018 - 2024 CAGR of 5.1% for Furniture, 2018 - 2024 CAGR of 3.2% for Spirits, 2018 - 2024 CAGR of 5.1% for Bedding, 2014 - 2019 CAGR of (5.7%) for Art, and 2014 - 2019 CAGR of 5.9& for Recorded Music; Digital Gaming I ncludes Online Gaming and Online Sports Betting; Digital Gaming 2018 - 2024 CAGR estimate of 7.3% based on a blended 2018 - 2024 CAGR of Online Gaming and Online Sports Betting; Art Includes Online Art Sales and Art Auction Sales.

$328 $343 $360 $377 $395 $414 $434 2018A 2019E 2020E 2021E 2022E 2023E 2024E Beauty & Grooming Growth Plan Playboy’s Beauty & Grooming Segment Expected To Generate Approx. $3M in revenue in 2020 Playboy Brand Value: • Proven commercial success in fragrance category; from 2012 to 2014 date achieved $100M annual retail business with fragrance line for men and women with Coty licensing partnership • Recent color cosmetics partnership in Brazil demonstrates consumer affinity for brand in category • Brand’s positioning on free expression and body positivity, alongside built - in network of Playmates who can serve as beauty ambassadors, positions brand well for expansion into category targeting existing consumer base today purchasing apparel and consuming branded content Growth Opportunity: • New fragrance line set to launch in Fall 2020 across North America and European markets • Collaboration discussions underway for color cosmetics and men’s grooming with big - name influencers and contemporary beauty brands • Company - conducted India consumer research demonstrates opportunity to brand in territory in Beauty and Grooming category • Brand’s reach in China positions Playboy well for expansion into men’s grooming and skincare in territory 33 PLAYBOY 2020 ($ in billions) Source: Grand View Research, Markets and Markets, Business News Wire, PR News Wire. 1 Includes Men’s and Women’s Fragrance, Skincare, Men’s Grooming, Color Cosmetics, and Beauty Supplement markets. 2 2019E - 2024E figures are extrapolated at 2018 - 2024 CAGR of 5.0% for Men’s Grooming, 2018 - 2024 CAGR of 6.2% for Color Cosmetics, 2 018 - 2024 CAGR of 3.7% for Men’s and Women’s Fragrance, 2018 - 2024 CAGR of 4.4% for Skincare, and 2016 - 2023 CAGR of 9.5% for Beauty Supplements. GLOBAL BEAUTY & GROOMING MARKET 1,2 GROWTH OPPORTUNITY
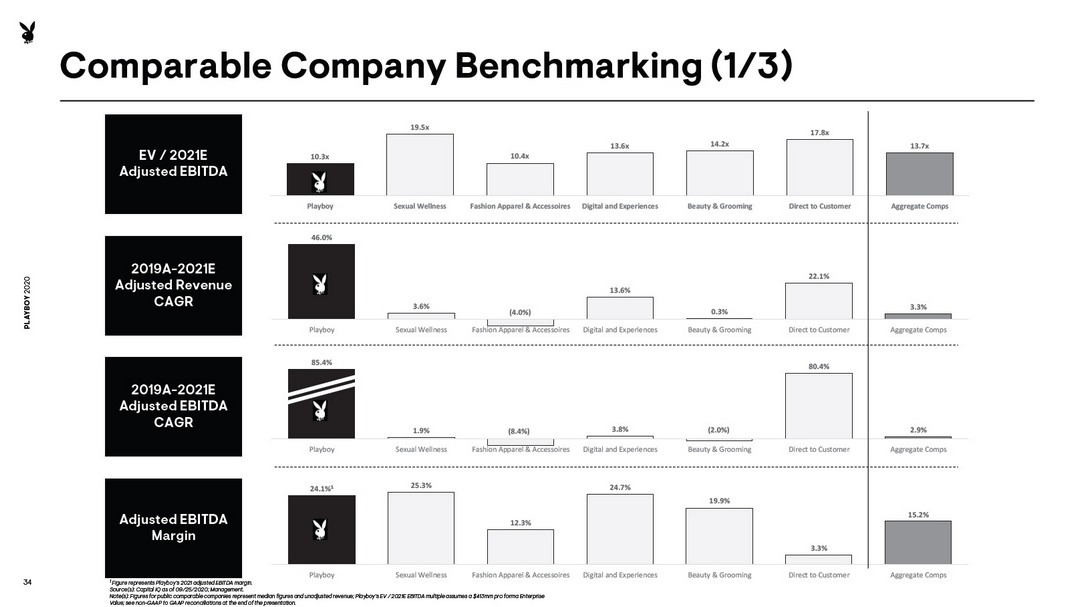
24.1% 1 25.3% 12.3% 24.7% 19.9% 3.3% 15.2% Playboy Sexual Wellness Fashion Apparel & Accessoires Digital and Experiences Beauty & Grooming Direct to Customer Aggregate Comps 85.4% 1.9% (8.4%) 3.8% (2.0%) 80.4% 2.9% Playboy Sexual Wellness Fashion Apparel & Accessoires Digital and Experiences Beauty & Grooming Direct to Customer Aggregate Comps 46.0% 3.6% (4.0%) 13.6% 0.3% 22.1% 3.3% Playboy Sexual Wellness Fashion Apparel & Accessoires Digital and Experiences Beauty & Grooming Direct to Customer Aggregate Comps 10.3x 19.5x 10.4x 13.6x 14.2x 17.8x 13.7x Playboy Sexual Wellness Fashion Apparel & Accessoires Digital and Experiences Beauty & Grooming Direct to Customer Aggregate Comps 34 PLAYBOY 2020 EV / 2021E Adjusted EBITDA 2019A - 2021E Adjusted Revenue CAGR Adjusted EBITDA Margin 2019A - 2021E Adjusted EBITDA CAGR Comparable Company Benchmarking (1/ 3 ) 1 Figure represents Playboy’s 2021 adjusted EBITDA margin. Source(s): Capital IQ as of 0 9 / 25 /2020; Management . Note(s): Figures for public comparable companies represent median figures and unadjusted revenue ; Playboy’s EV / 2021E EBITDA multiple assumes a $ 413 mm pro forma Enterprise Value ; see non - GAAP to GAAP reconciliations at the end of the presentation.

35 PLAYBOY 2020 Source(s): Capital IQ as of 0 9 / 25 /20 . 1 Multiples larger than 100.0x and less than 0.0x deemed not meaningful. Comparable Company Benchmarking (2/ 3 ) Stock % 52-Week Market Enterprise Price High Cap ($M) Value CY2020 CY2021 CY2022 CY2020 CY2021 CY2022 Revenue EBITDA CY2020 CY2021 Market Valuation Valuation Metrics 1 Growth Profile (CAGR) Margin Profile EV/Revenue EV/EBITDA CY2019 - CY 2021 EBITDA Margin Sexual Wellness Reckitt Benckiser Group plc $98.68 94.0% $70,183 $82,418 4.7x 4.7x 4.6x 17.7x 18.0x 16.8x 1.0% (4.3%) 26.7% 26.4% Church & Dwight Co., Inc. 96.50 99.3% 23,866 25,281 5.3x 5.1x 4.9x 22.2x 21.3x 20.3x 6.2% 8.0% 23.9% 24.1% Average 5.0x 4.9x 4.8x 19.9x 19.7x 18.5x 3.6% 1.9% 25.3% 25.3% Median 5.0x 4.9x 4.8x 19.9x 19.7x 18.5x 3.6% 1.9% 25.3% 25.3% Fashion Apparel & Accessories NIKE, Inc. $109.75 100.0% $171,198 $172,068 4.6x 3.8x 3.5x 54.4x 24.3x 20.7x 4.8% 5.7% 8.4% 15.8% V.F. Corporation 61.66 61.5% 24,026 26,787 3.1x 2.6x 2.4x 29.6x 17.2x 14.5x (0.6%) (2.1%) 10.4% 15.0% PUMA SE 81.42 82.0% 12,177 11,890 2.0x 1.7x 1.5x 24.7x 13.7x 11.2x 6.8% 18.9% 8.0% 12.3% Columbia Sportswear Company 80.63 78.4% 5,334 4,838 1.9x 1.6x 1.5x 17.2x 10.4x 9.4x (1.4%) (1.0%) 11.1% 15.8% Ralph Lauren Corporation 67.05 52.3% 4,898 4,117 0.9x 0.7x 0.7x 11.6x 4.5x 4.7x (4.0%) (8.4%) 7.9% 15.6% Under Armour, Inc. 9.73 44.3% 4,200 4,358 1.1x 0.9x 0.9x NM 14.5x 11.2x (4.9%) (20.9%) (3.9%) 6.3% Gildan Activewear Inc. 19.69 51.7% 3,903 4,784 2.7x 2.1x 1.8x 55.6x 10.5x 9.2x (9.3%) (9.3%) 4.9% 19.5% PVH Corp. 50.13 46.4% 3,561 5,615 0.8x 0.6x 0.6x NM 6.3x 5.7x (6.2%) (11.4%) 1.3% 10.2% Kontoor Brands, Inc. 21.12 48.8% 1,206 2,087 1.0x 0.9x 0.9x 11.6x 7.5x 6.9x (3.6%) (0.4%) 9.0% 11.7% Oxford Industries, Inc. 45.84 56.9% 766 734 0.9x 0.7x NM NM 6.2x NM (5.3%) (9.6%) (0.6%) 11.8% G-III Apparel Group, Ltd. 10.04 29.2% 469 566 0.3x 0.2x NM 5.1x 2.5x NM (11.0%) (14.0%) 5.4% 9.0% Average 1.8x 1.4x 1.5x 26.2x 10.7x 10.4x (3.2%) (4.8%) 5.6% 13.0% Median 1.1x 0.9x 1.5x 21.0x 10.4x 9.4x (4.0%) (8.4%) 7.9% 12.3% Digital and Experiences Aristocrat Leisure Limited $20.31 74.2% $12,969 $14,394 5.1x 4.3x 4.0x 18.3x 13.8x 11.7x 3.6% 1.9% 27.6% 30.9% DraftKings Inc. 35.15 78.5% 12,498 11,251 21.6x 14.8x 10.3x NM NM NM 53.3% (39.6%) (53.1%) (29.5%) Live Nation Entertainment, Inc. 51.12 66.7% 10,844 13,160 6.3x 1.5x 1.1x NM 21.2x 13.0x (14.1%) (13.0%) (43.4%) 7.3% Zynga Inc. 9.31 87.1% 10,012 9,024 4.9x 3.6x 3.2x 17.8x 14.4x 12.6x 38.5% 163.2% 27.6% 24.7% Scientific Games Corporation 19.83 62.7% 1,878 10,068 3.8x 3.2x 2.9x 12.9x 8.2x 7.4x (3.2%) 3.8% 29.2% 38.3% Glu Mobile Inc. 8.13 74.9% 1,388 1,105 2.0x 1.9x 1.7x 19.1x 13.7x 10.8x 19.3% 57.9% 10.5% 13.8% DoubleUGames Co., Ltd. 60.40 83.9% 1,025 1,199 2.1x 2.1x 2.0x 5.7x 5.6x 5.1x 13.6% 10.5% 36.6% 36.9% Average 6.5x 4.5x 3.6x 14.8x 12.8x 10.1x 15.9% 26.4% 5.0% 17.5% Median 4.9x 3.2x 2.9x 17.8x 13.7x 11.3x 13.6% 3.8% 27.6% 24.7%

36 PLAYBOY 2020 Comparable Company Benchmarking ( 3 / 3 ) Stock % 52-Week Market Enterprise Price High Cap ($M) Value CY2020 CY2021 CY2022 CY2020 CY2021 CY2022 Revenue EBITDA CY2020 CY2021 Market Valuation Valuation Metrics 1 Growth Profile (CAGR) Margin Profile EV/Revenue EV/EBITDA CY2019 - CY 2021 EBITDA Margin Source(s): Capital IQ as of 0 9 / 25 /20 . 1 Multiples larger than 100.0x and less than 0.0x deemed not meaningful. Beauty & Grooming L'Oréal S.A. $322.65 92.2% $180,459 $163,747 5.0x 4.6x 4.3x 21.5x 19.2x 17.8x 2.9% 6.0% 23.2% 24.0% The Estée Lauder Companies Inc. 207.01 93.9% 74,523 75,636 5.6x 4.7x 4.4x 33.9x 20.2x 19.1x 0.7% (0.2%) 16.4% 23.2% Ulta Beauty, Inc. 214.00 62.6% 12,051 11,688 1.9x 1.6x 1.5x 20.1x 10.3x 9.6x (0.2%) (3.7%) 9.6% 15.4% Coty Inc. 3.79 28.2% 2,892 11,766 2.3x 2.4x NM 65.2x 14.1x NM (23.0%) (22.3%) 3.6% 16.8% Inter Parfums, Inc. 42.59 52.3% 1,343 1,316 3.0x 2.1x NM 36.1x 12.9x NM (6.0%) (6.7%) 8.2% 16.2% e.l.f. Beauty, Inc. 18.55 88.2% 941 1,017 3.5x 3.3x 3.1x 16.4x 14.3x 13.1x 6.7% 16.6% 21.3% 23.0% Average 3.5x 3.1x 3.3x 32.2x 15.2x 14.9x (3.1%) (1.7%) 13.7% 19.8% Median 3.2x 2.8x 3.7x 27.7x 14.2x 15.5x 0.3% (2.0%) 13.0% 19.9% Direct to Consumer Wayfair Inc. $340.66 99.7% $32,496 $32,105 2.3x 2.1x 1.7x 51.7x 59.1x 37.7x 30.9% 138.5% 4.5% 3.5% Chewy, Inc. 56.97 96.1% 22,877 22,723 3.3x 2.7x 2.3x NM NM 77.1x 31.2% 161.7% 0.2% 1.9% Farfetch Limited 29.32 92.0% 9,957 9,791 6.4x 4.8x 3.9x NM NM 69.1x 40.7% 107.6% (5.2%) 1.3% YETI Holdings, Inc. 51.72 94.0% 4,500 4,662 4.6x 4.0x 3.7x 21.9x 18.7x 16.9x 12.9% 20.7% 20.8% 21.4% Canada Goose Holdings Inc. 22.79 50.3% 2,510 2,660 4.6x 3.5x 3.2x 19.0x 11.3x 10.9x 1.4% 10.1% 24.0% 30.8% Stitch Fix, Inc. 23.89 78.5% 2,450 2,233 1.2x 1.0x 0.9x NM NM 30.7x 11.2% (151.6%) (3.1%) (0.1%) Revolve Group, Inc. 19.59 73.4% 1,362 1,235 2.1x 1.7x 1.4x 22.9x 16.9x 12.7x 9.9% 15.1% 9.0% 10.1% Purple Innovation, Inc. 20.82 75.0% 1,111 1,053 1.7x 1.3x 1.2x 12.9x 11.0x 10.0x 35.8% 77.2% 12.8% 12.1% The Lovesac Company 30.53 82.8% 443 388 1.3x 1.1x 0.9x NM 35.0x 15.0x 24.4% 180.6% 0.2% 3.1% Casper Sleep Inc. 9.26 58.4% 372 339 0.7x 0.5x 0.4x NM NM 16.9x 19.9% 83.6% (10.8%) (3.5%) Average 2.8x 2.3x 2.0x 25.7x 25.3x 29.7x 21.8% 64.3% 5.2% 8.1% Median 2.2x 1.9x 1.6x 21.9x 17.8x 16.9x 22.1% 80.4% 2.4% 3.3% Aggregate Average 3.5x 2.7x 2.5x 24.8x 15.4x 17.7x 7.9% 21.4% 7.8% 14.3% Aggregate Median 2.5x 2.1x 1.9x 19.6x 13.8x 12.7x 3.3% 2.9% 8.7% 15.2%
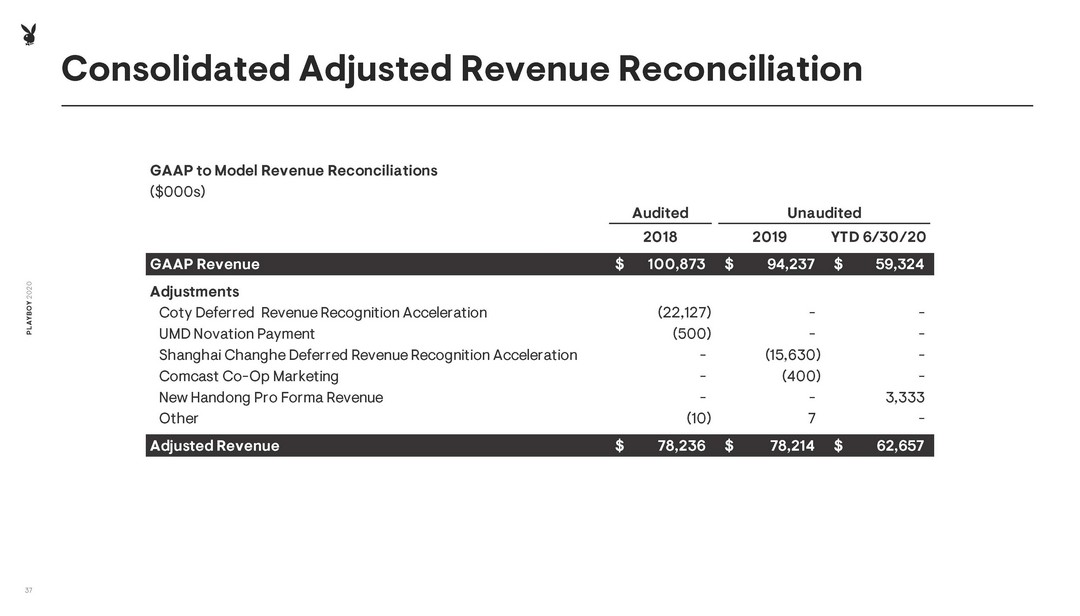
Consolidated Adjusted Revenue Reconciliation PLAYBOY 2020 37 GAAP to Model Revenue Reconciliations ($000s) Audited Unaudited 2018 2019 YTD 6/30/20 GAAP Revenue 100,873$ 94,237$ 59,324$ Adjustments Coty Deferred Revenue Recognition Acceleration (22,127) - - UMD Novation Payment (500) - - Shanghai Changhe Deferred Revenue Recognition Acceleration - (15,630) - Comcast Co-Op Marketing - (400) - New Handong Pro Forma Revenue - - 3,333 Other (10) 7 - Adjusted Revenue 78,236$ 78,214$ 62,657$
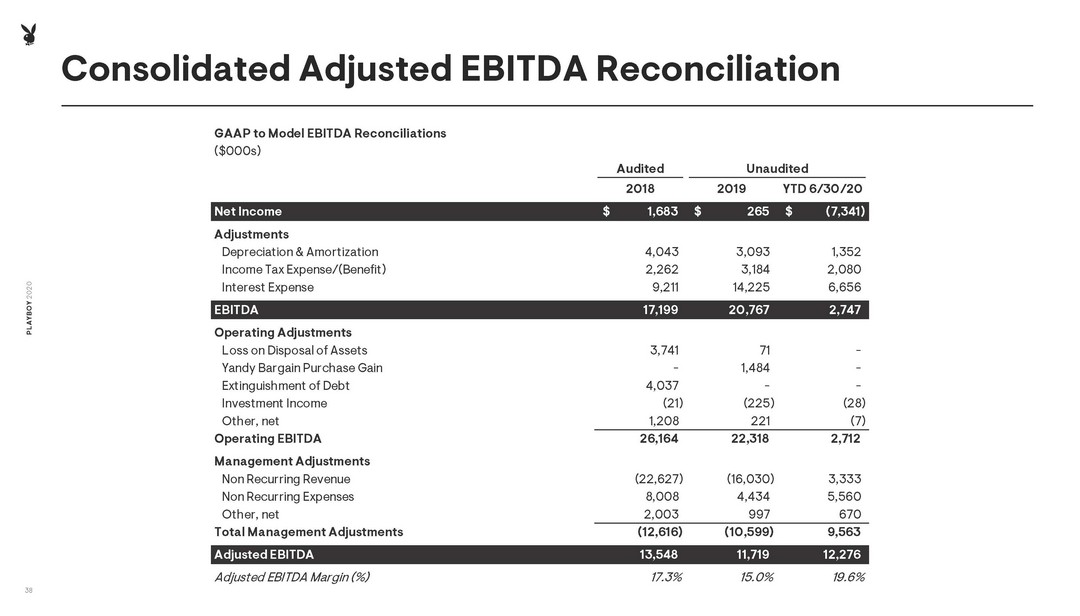
Consolidated Adjusted EBITDA Reconciliation PLAYBOY 2020 38 GAAP to Model EBITDA Reconciliations ($000s) Audited Unaudited 2018 2019 YTD 6/30/20 Net Income 1,683$ 265$ (7,341)$ Adjustments Depreciation & Amortization 4,043 3,093 1,352 Income Tax Expense/(Benefit) 2,262 3,184 2,080 Interest Expense 9,211 14,225 6,656 EBITDA 17,199 20,767 2,747 Operating Adjustments Loss on Disposal of Assets 3,741 71 - Yandy Bargain Purchase Gain - 1,484 - Extinguishment of Debt 4,037 - - Investment Income (21) (225) (28) Other, net 1,208 221 (7) Operating EBITDA 26,164 22,318 2,712 Management Adjustments Non Recurring Revenue (22,627) (16,030) 3,333 Non Recurring Expenses 8,008 4,434 5,560 Other, net 2,003 997 670 Total Management Adjustments (12,616) (10,599) 9,563 Adjusted EBITDA 13,548 11,719 12,276 Adjusted EBITDA Margin (%) 17.3% 15.0% 19.6%
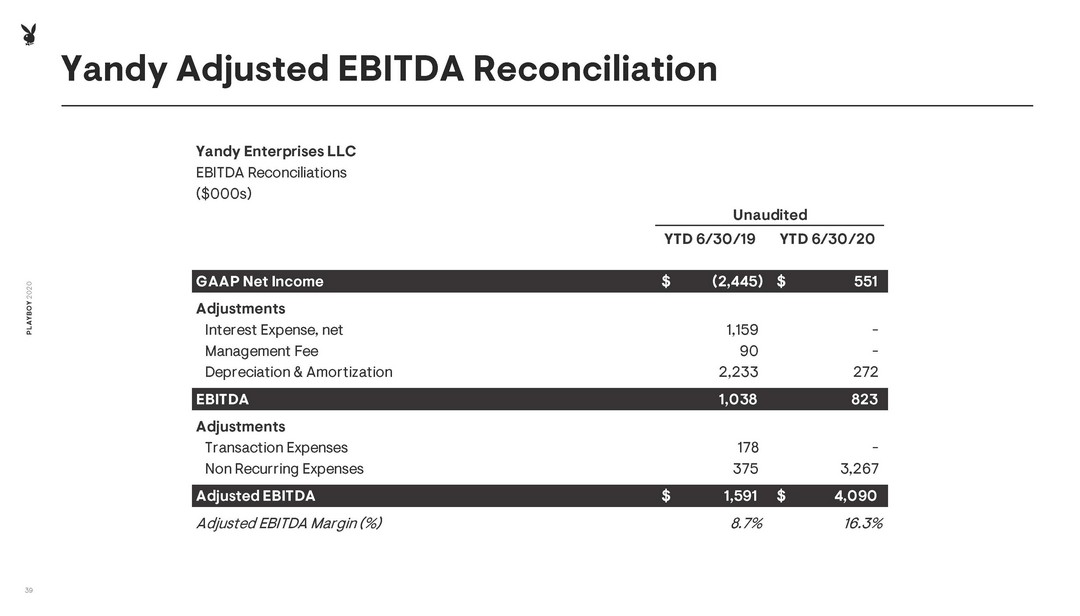
Yandy Adjusted EBITDA Reconciliation PLAYBOY 2020 39 Yandy Enterprises LLC EBITDA Reconciliations ($000s) Unaudited YTD 6/30/19 YTD 6/30/20 GAAP Net Income (2,445)$ 551$ Adjustments Interest Expense, net 1,159 - Management Fee 90 - Depreciation & Amortization 2,233 272 EBITDA 1,038 823 Adjustments Transaction Expenses 178 - Non Recurring Expenses 375 3,267 Adjusted EBITDA 1,591$ 4,090$ Adjusted EBITDA Margin (%) 8.7% 16.3%

Consolidated Income Statement PLAYBOY 2020 40 Note(s): These numbers do not include public company costs; historical financials are presented on management adjusted basis. * See slides 37 and 38 for non - GAAP to GAAP reconciliations. ($000's) Actuals 2018A 2019A YTD 6/30/2020 Revenue Commerce 45,401$ 51,549$ 50,819$ Digital 27,343 22,552 10,387 Legacy Business 5,492 4,113 1,452 Total Revenue 78,236$ 78,214$ 62,657$ YoY Growth (%) (2.0%) (0.0%) Direct Costs Commerce (9,757)$ (8,384)$ (18,286)$ Digital (6,658) (4,351) (2,290) Legacy Business (10,627) (9,681) (1,952) Total Direct Costs (27,041) (22,416) (22,528) Gross Profit 51,195$ 55,798$ 40,129 Gross Profit Margin (%) 65.4% 71.3% 64.0% Operating Expenses Segment OPEX (14,753)$ (10,537)$ (11,443)$ G&A (26,936) (36,635) (17,763) EBIT 9,506$ 8,625$ 10,923 Add back: D&A 4,043 3,094 1,353 Adjusted EBITDA 13,548$ 11,719$ 12,276$ Adjusted EBITDA Margin (%) 17.3% 15.0% 19.6%

Consolidated Balance Sheet PLAYBOY 2020 41 ($000's) Audited Unaudited Audited Unaudited 2018A 2019A 6/30/2020 2018A 2019A 6/30/2020 Assets Liabilities & Shareholders' Equity Current Assets Current Liabilities Cash 26,841$ 26,903$ 22,151$ Accounts Payable 6,802$ 7,593$ 7,364$ Restricted Cash 7,704 963 966 Payable to Related Party 3,261 5 - Accounts Receivable 8,025 5,598 5,299 Accrued Salaries, Wages and Employee Benefits 4,363 3,613 2,654 Inventories 353 322 9,738 Current Portion of Deferred Revenues 23,962 30,499 32,268 Programming Costs 91 502 372 Current Portion of Long-Term Debt 2,305 3,182 2,798 Purchase of Assets of Yandy, LLC - 13,627 - Current portion of Convertible Promissory Note 3,500 13,500 13,500 Prepaid Expenses and Other Current Assets 5,424 11,392 11,552 Other Current Liabilities and Accrued Expenses 11,533 13,427 14,037 Total Current Assets 48,438$ 59,307$ 50,078$ Total Current Liabilities 55,726$ 71,819$ 72,621$ Long Term Assets Long-Term Liabilities Property and Equipment, Net 3,642$ 5,783$ 5,612$ Long-Term Debt, Net of Current Portion 152,595$ 157,810$ 157,379$ Trademarks 330,048 330,604 330,875 Deferred Revenues, Net of Current Portion 14,047 13,762 15,978 Goodwill 504 504 504 Deferred Tax Liabilities 72,726 72,726 72,726 Other Intangible Assets, Net 2,977 1,872 7,812 Convertible Promissory Notes 10,000 - - Other Noncurrent Assets 11,983 11,984 12,003 Other Noncurrent Liabilities 886 576 676 Total Long-Term Assets 349,154$ 350,747$ 356,806$ Total Long-Term Liabilities 250,254$ 244,874$ 246,759$ Total Assets 397,592 410,054 406,884 Total Liabilities 305,980$ 316,693$ 319,380$ Shareholders' Equity 91,612$ 93,361$ 87,504$ Total Liabilities & Shareholders' Equity 397,592 410,054 406,884