Attached files
| file | filename |
|---|---|
| EX-99.1 - EX-99.1 - CHART INDUSTRIES INC | d949066dex991.htm |
| EX-10.1 - EX-10.1 - CHART INDUSTRIES INC | d949066dex101.htm |
| 8-K - FORM 8-K - CHART INDUSTRIES INC | d949066d8k.htm |
Chart Industries, Inc. Hydrogen Equipment and Solutions October 1, 2020 Exhibit 99.2
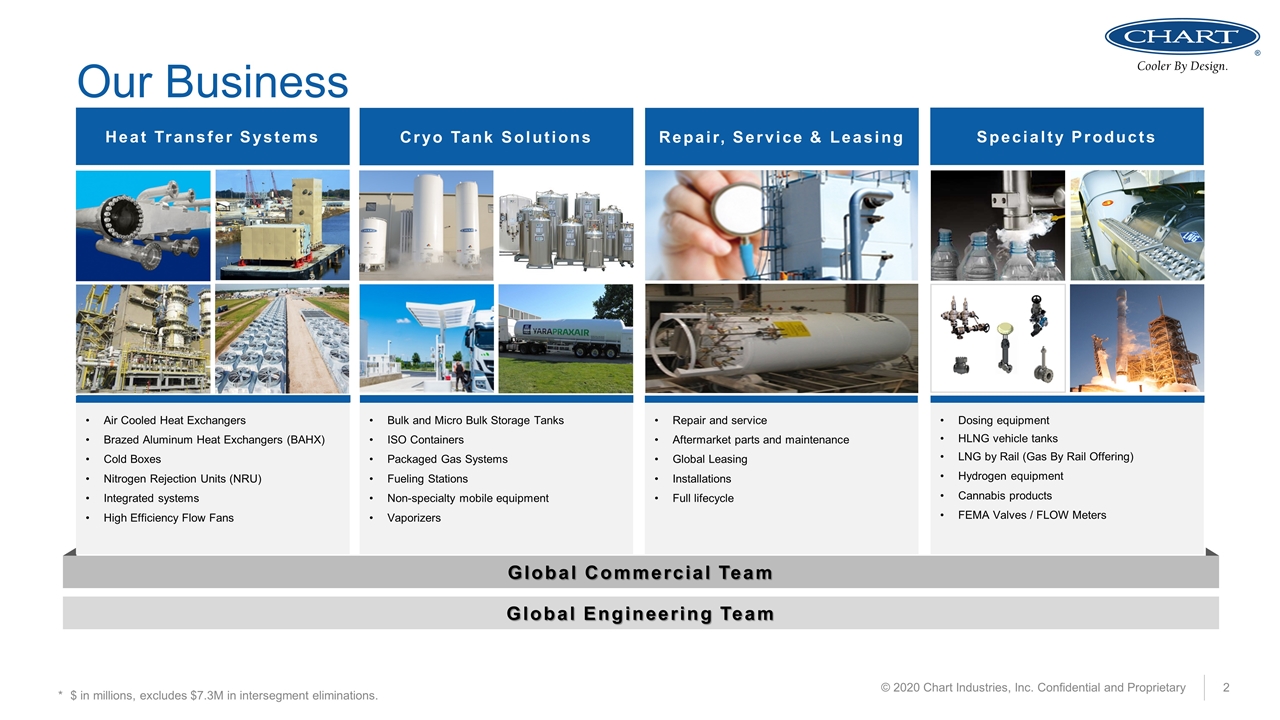
Cryo Tank Solutions Heat Transfer Systems Global Commercial Team * $ in millions, excludes $7.3M in intersegment eliminations. © 2020 Chart Industries, Inc. Confidential and Proprietary Repair, Service & Leasing Air Cooled Heat Exchangers Brazed Aluminum Heat Exchangers (BAHX) Cold Boxes Nitrogen Rejection Units (NRU) Integrated systems High Efficiency Flow Fans Bulk and Micro Bulk Storage Tanks ISO Containers Packaged Gas Systems Fueling Stations Non-specialty mobile equipment Vaporizers Repair and service Aftermarket parts and maintenance Global Leasing Installations Full lifecycle Dosing equipment HLNG vehicle tanks LNG by Rail (Gas By Rail Offering) Hydrogen equipment Cannabis products FEMA Valves / FLOW Meters Specialty Products Our Business Global Engineering Team
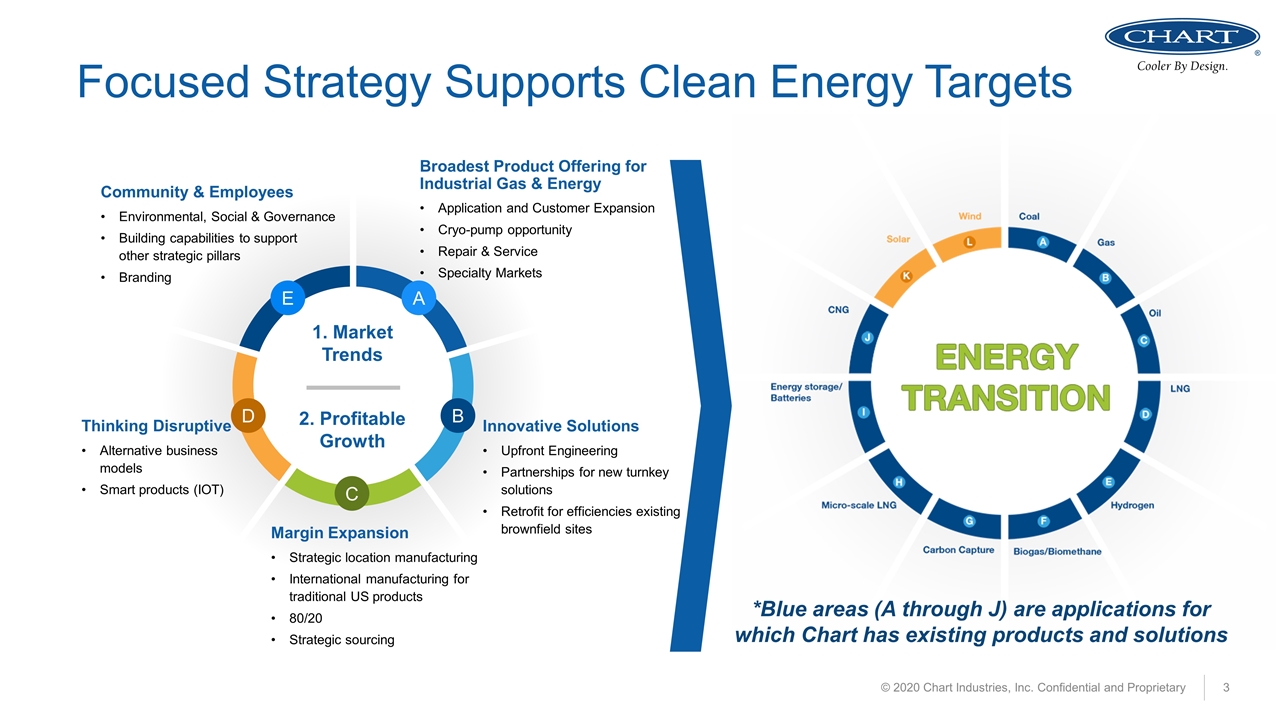
Focused Strategy Supports Clean Energy Targets © 2020 Chart Industries, Inc. Confidential and Proprietary A B D C 1. Market Trends 2. Profitable Growth E Community & Employees Environmental, Social & Governance Building capabilities to support other strategic pillars Branding Thinking Disruptive Alternative business models Smart products (IOT) Margin Expansion Strategic location manufacturing International manufacturing for traditional US products 80/20 Strategic sourcing Innovative Solutions Upfront Engineering Partnerships for new turnkey solutions Retrofit for efficiencies existing brownfield sites Broadest Product Offering for Industrial Gas & Energy Application and Customer Expansion Cryo-pump opportunity Repair & Service Specialty Markets *Blue areas (A through J) are applications for which Chart has existing products and solutions
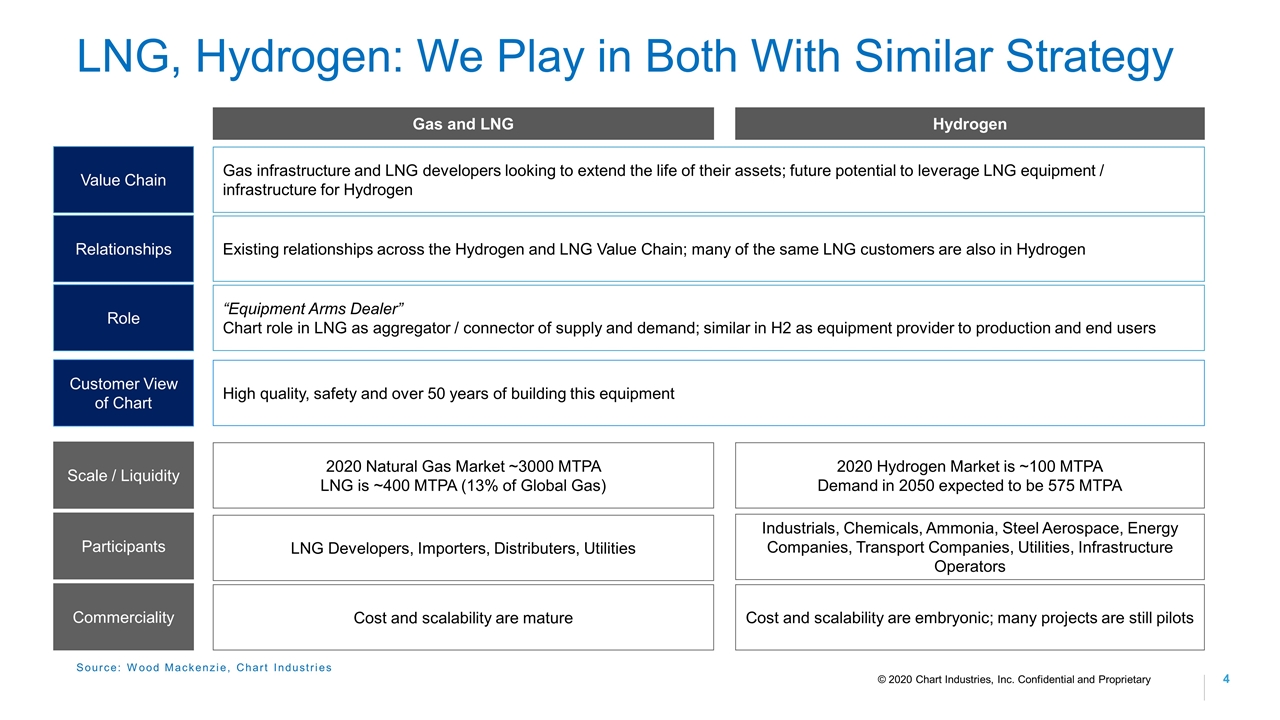
LNG, Hydrogen: We Play in Both With Similar Strategy Source: Wood Mackenzie, Chart Industries Gas infrastructure and LNG developers looking to extend the life of their assets; future potential to leverage LNG equipment / infrastructure for Hydrogen Gas and LNG Hydrogen Scale / Liquidity Participants Commerciality Customer View of Chart Value Chain Relationships Role Existing relationships across the Hydrogen and LNG Value Chain; many of the same LNG customers are also in Hydrogen “Equipment Arms Dealer” Chart role in LNG as aggregator / connector of supply and demand; similar in H2 as equipment provider to production and end users 2020 Natural Gas Market ~3000 MTPA LNG is ~400 MTPA (13% of Global Gas) 2020 Hydrogen Market is ~100 MTPA Demand in 2050 expected to be 575 MTPA LNG Developers, Importers, Distributers, Utilities Industrials, Chemicals, Ammonia, Steel Aerospace, Energy Companies, Transport Companies, Utilities, Infrastructure Operators Cost and scalability are mature Cost and scalability are embryonic; many projects are still pilots High quality, safety and over 50 years of building this equipment © 2020 Chart Industries, Inc. Confidential and Proprietary
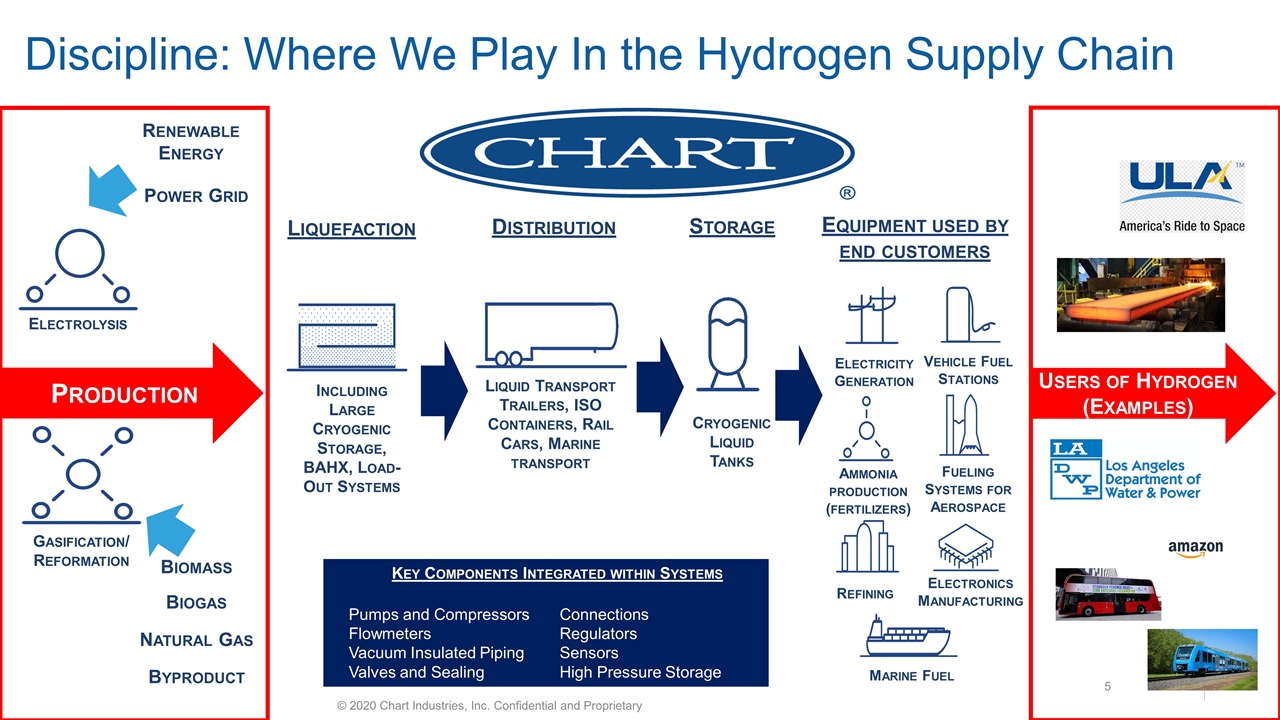
Discipline: Where We Play In the Hydrogen Supply Chain Vehicle Fuel Stations Fueling Systems for Aerospace Marine Fuel Electronics Manufacturing Electricity Generation Ammonia production (fertilizers) Refining Cryogenic Liquid Tanks Liquid Transport Trailers, ISO Containers, Rail Cars, Marine transport Liquefaction Distribution Storage Electrolysis Renewable Energy Power Grid Gasification/ Reformation Biomass Biogas Natural Gas Byproduct Including Large Cryogenic Storage, BAHX, Load-Out Systems Key Components Integrated within Systems Pumps and Compressors Flowmeters Vacuum Insulated Piping Valves and Sealing Connections Regulators Sensors High Pressure Storage Equipment used by end customers Production Users of Hydrogen (Examples) © 2020 Chart Industries, Inc. Confidential and Proprietary
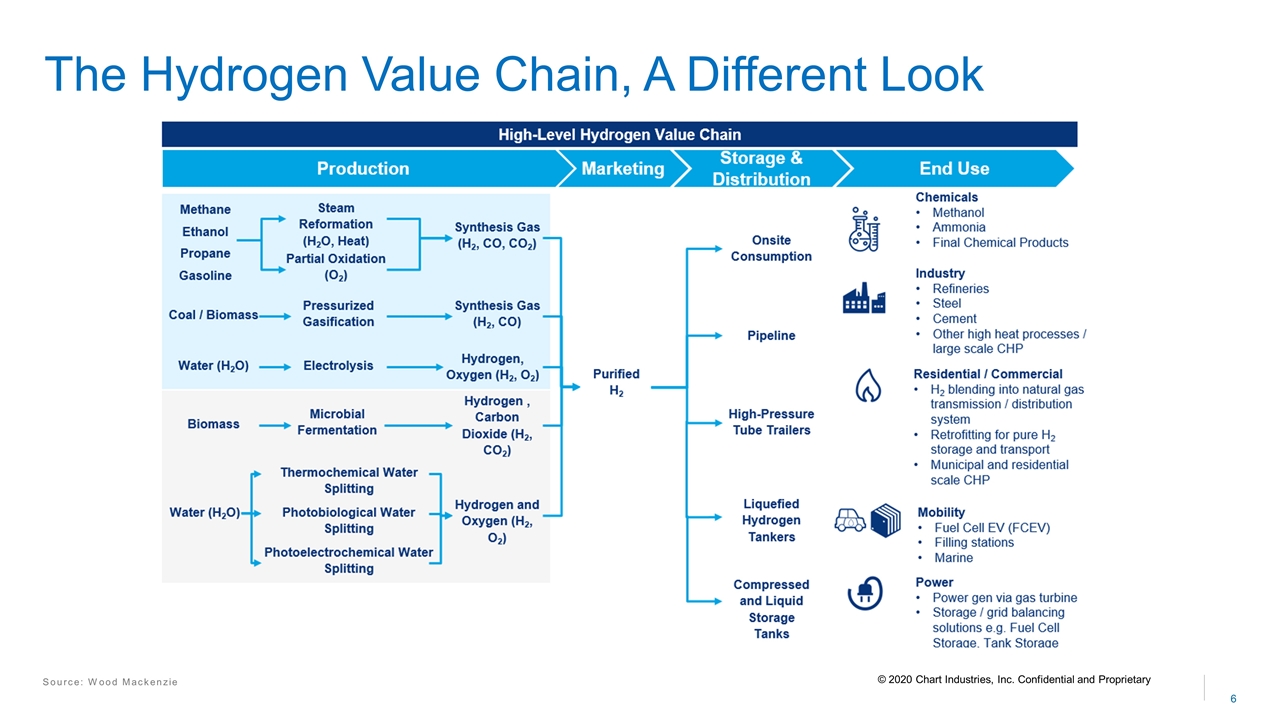
Source: Wood Mackenzie The Hydrogen Value Chain, A Different Look © 2020 Chart Industries, Inc. Confidential and Proprietary
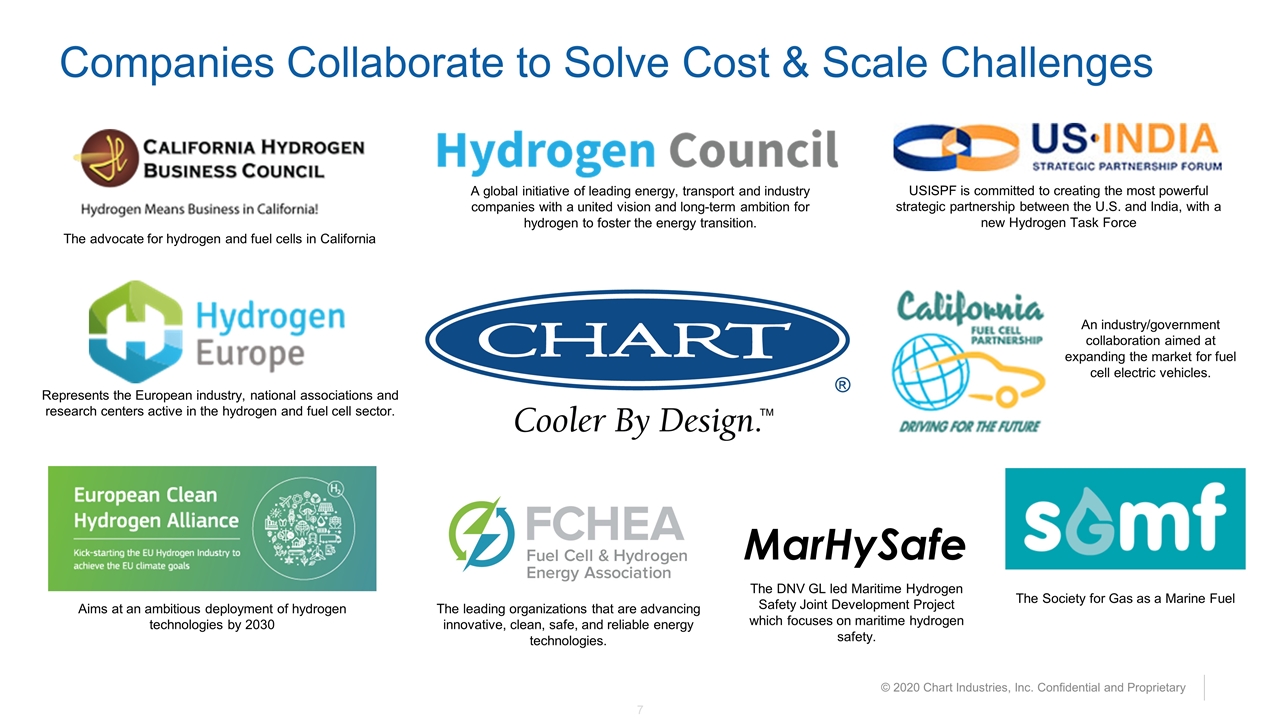
Companies Collaborate to Solve Cost & Scale Challenges A global initiative of leading energy, transport and industry companies with a united vision and long-term ambition for hydrogen to foster the energy transition. The advocate for hydrogen and fuel cells in California Aims at an ambitious deployment of hydrogen technologies by 2030 The leading organizations that are advancing innovative, clean, safe, and reliable energy technologies. Represents the European industry, national associations and research centers active in the hydrogen and fuel cell sector. The DNV GL led Maritime Hydrogen Safety Joint Development Project which focuses on maritime hydrogen safety. USISPF is committed to creating the most powerful strategic partnership between the U.S. and India, with a new Hydrogen Task Force An industry/government collaboration aimed at expanding the market for fuel cell electric vehicles. The Society for Gas as a Marine Fuel MarHySafe © 2020 Chart Industries, Inc. Confidential and Proprietary
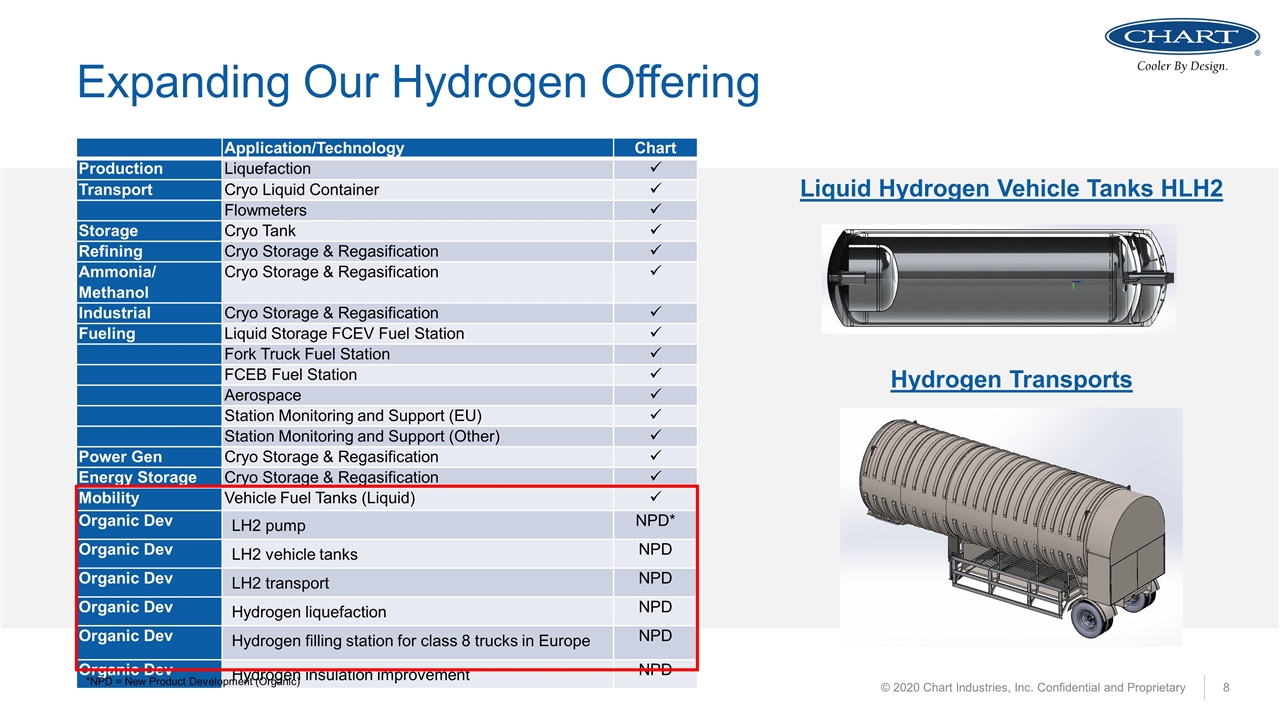
Expanding Our Hydrogen Offering Application/Technology Chart Production Liquefaction ü Transport Cryo Liquid Container ü Flowmeters ü Storage Cryo Tank ü Refining Cryo Storage & Regasification ü Ammonia/ Methanol Cryo Storage & Regasification ü Industrial Cryo Storage & Regasification ü Fueling Liquid Storage FCEV Fuel Station ü Fork Truck Fuel Station ü FCEB Fuel Station ü Aerospace ü Station Monitoring and Support (EU) ü Station Monitoring and Support (Other) ü Power Gen Cryo Storage & Regasification ü Energy Storage Cryo Storage & Regasification ü Mobility Vehicle Fuel Tanks (Liquid) ü Organic Dev LH2 pump NPD* Organic Dev LH2 vehicle tanks NPD Organic Dev LH2 transport NPD Organic Dev Hydrogen liquefaction NPD Organic Dev Hydrogen filling station for class 8 trucks in Europe NPD Organic Dev Hydrogen insulation improvement NPD © 2020 Chart Industries, Inc. Confidential and Proprietary Liquid Hydrogen Vehicle Tanks HLH2 Hydrogen Transports *NPD = New Product Development (Organic)
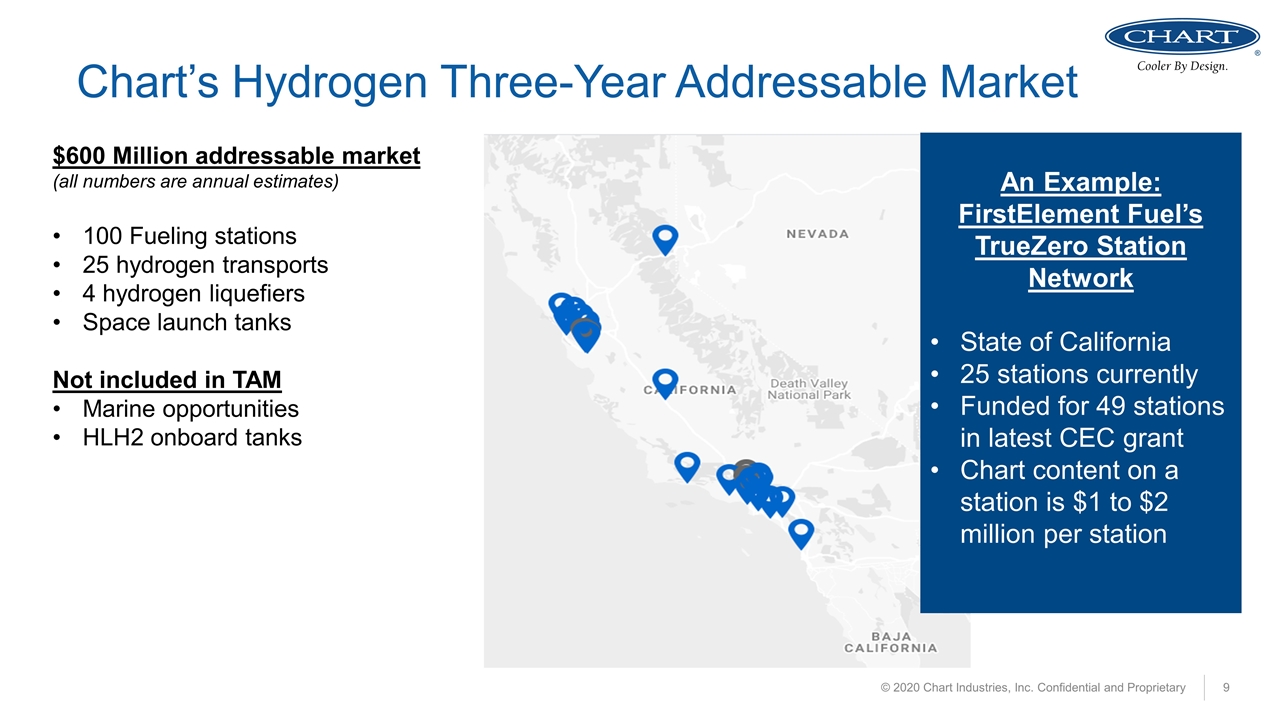
Chart’s Hydrogen Three-Year Addressable Market © 2020 Chart Industries, Inc. Confidential and Proprietary An Example: FirstElement Fuel’s TrueZero Station Network State of California 25 stations currently Funded for 49 stations in latest CEC grant Chart content on a station is $1 to $2 million per station $600 Million addressable market (all numbers are annual estimates) 100 Fueling stations 25 hydrogen transports 4 hydrogen liquefiers Space launch tanks Not included in TAM Marine opportunities HLH2 onboard tanks
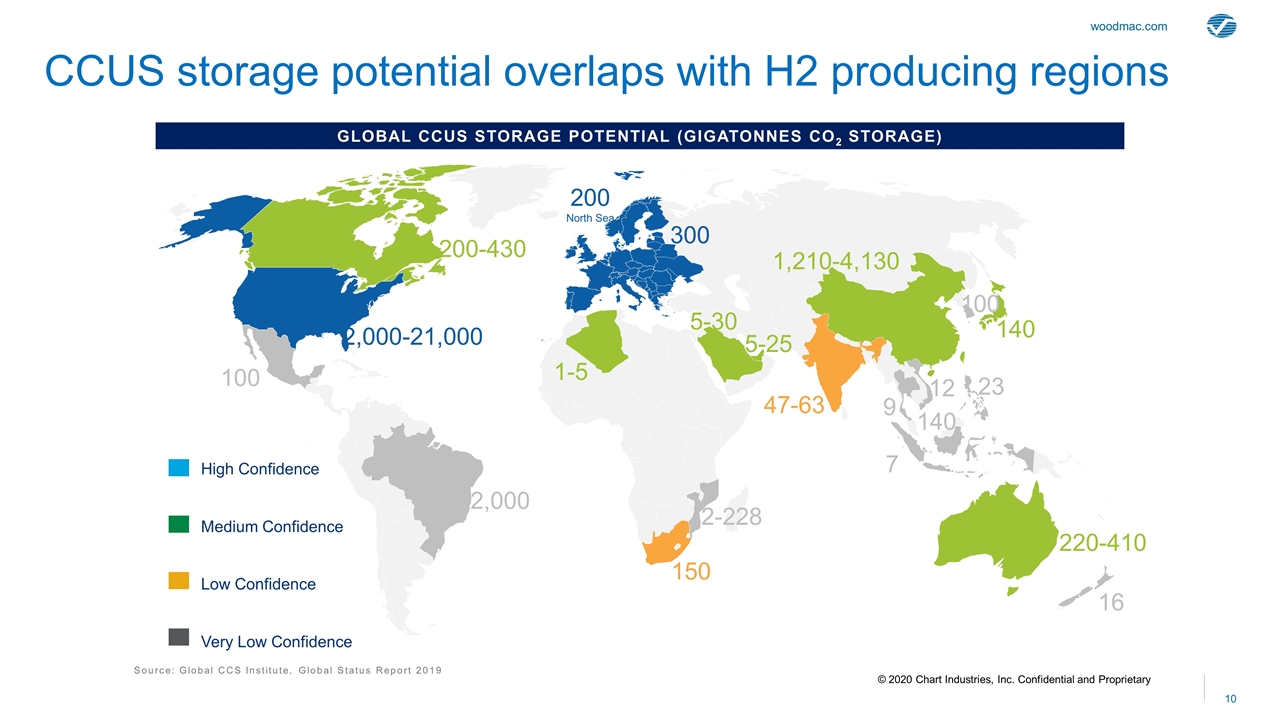
Global CCUS Storage Potential (Gigatonnes CO2 Storage) Source: Global CCS Institute, Global Status Report 2019 CCUS storage potential overlaps with H2 producing regions High Confidence Medium Confidence Low Confidence Very Low Confidence 200 North Sea 300 100 16 7 9 12 23 140 2,000 100 150 47-63 220-410 140 1,210-4,130 5-25 5-30 1-5 200-430 2-228 2,000-21,000 © 2020 Chart Industries, Inc. Confidential and Proprietary
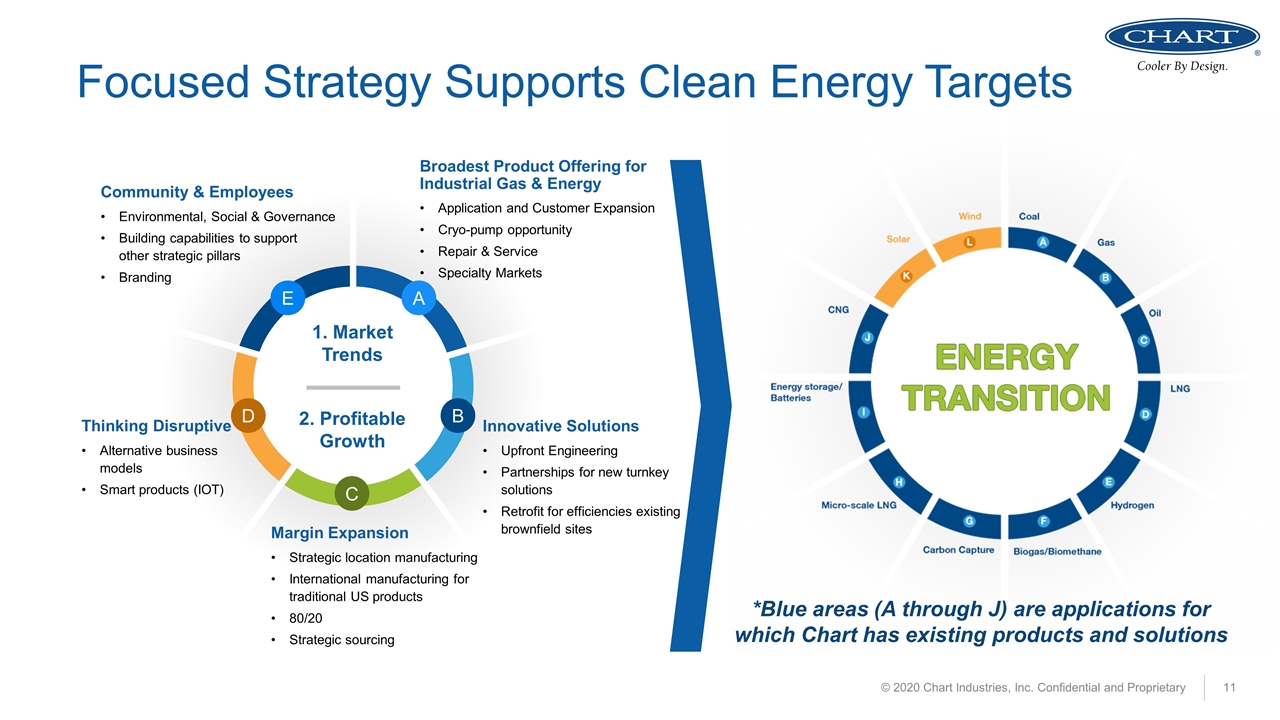
Focused Strategy Supports Clean Energy Targets © 2020 Chart Industries, Inc. Confidential and Proprietary A B D C 1. Market Trends 2. Profitable Growth E Community & Employees Environmental, Social & Governance Building capabilities to support other strategic pillars Branding Thinking Disruptive Alternative business models Smart products (IOT) Margin Expansion Strategic location manufacturing International manufacturing for traditional US products 80/20 Strategic sourcing Innovative Solutions Upfront Engineering Partnerships for new turnkey solutions Retrofit for efficiencies existing brownfield sites Broadest Product Offering for Industrial Gas & Energy Application and Customer Expansion Cryo-pump opportunity Repair & Service Specialty Markets *Blue areas (A through J) are applications for which Chart has existing products and solutions
