Attached files
| file | filename |
|---|---|
| 8-K - 8-K - SUPERIOR ENERGY SERVICES INC | d90605d8k.htm |
| EX-99.2 - EX-99.2 - SUPERIOR ENERGY SERVICES INC | d90605dex992.htm |
| EX-10.3 - EX-10.3 - SUPERIOR ENERGY SERVICES INC | d90605dex103.htm |
| EX-10.2 - EX-10.2 - SUPERIOR ENERGY SERVICES INC | d90605dex102.htm |
| EX-10.1 - EX-10.1 - SUPERIOR ENERGY SERVICES INC | d90605dex101.htm |

Exhibit 99.1 Cleansing Materials September 2020Exhibit 99.1 Cleansing Materials September 2020

Disclaimer By accepting this presentation, recipients acknowledge that they have read, understood and accepted the terms of this disclaimer. This presentation is being provided for informational purposes only and is intended solely to facilitate a discussion with the recipient. No representation or warranty, express or implied, is or will be given by Superior Energy Services, Inc. and its subsidiaries (collectively, the “Company”) or its affiliates, directors, officers, partners, employees, agents or advisers or any other person as to the accuracy, completeness, reasonableness or fairness of any information contained in this presentation and no responsibility or liability whatsoever is accepted for the accuracy or sufficiency thereof or for any errors, omissions or misstatements, negligent or otherwise, relating thereto. No information included in this presentation constitutes, nor can it be relied upon as, legal, tax, investment or other advice. Recipients should consult their independent advisors. This presentation should not be relied upon for the purpose of evaluating the performance of the Company or for any other purpose, and neither the Company nor any of its affiliates, directors, officers, partners, employees, agents or advisers nor any other person, shall be liable for any direct, indirect or consequential liability, loss or damages suffered by any person as a result of this presentation or their reliance on any statement, estimate, target, projection or forward-looking information in or omission from this presentation and any such liability is expressly disclaimed. In all cases, interested parties should conduct their own investigation and analysis of the Company and the information contained herein. This presentation should not be considered as a recommendation by the Company or any affiliate or other person in relation to the Company or any of its subsidiaries, nor does it constitute an offer to sell or a solicitation for an offer to buy the securities, assets or business of the Company, nor shall there be any sale of securities in any state or jurisdiction in which such offer, solicitation or sale would be unlawful prior to registration or qualification under the securities laws of any such state or jurisdiction or pursuant to an exemption therefrom. This presentation shall not form the basis of any contract. Any references to any future or proposed transaction are for illustrative purposes only and the terms of any such transaction should it occur may be materially different than the terms in this presentation. This presentation contains forward-looking statements that are subject to risks, uncertainties and other factors. All statements other than statements of historical fact or relating to present facts or current conditions included in this presentation are forward-looking statements. Forward-looking statements give the Company’s current expectations and projections relating to the Company’s financial condition, results of operations, plans, objectives, future performance and business. You can identify forward-looking statements by the fact that they do not relate strictly to historical or current facts. These statements may include words such as “anticipate,” “estimate,” “expect,” “project,” “seek,” “plan,” “intend,” “believe,” “contemplate,” “assume,” “will,” “may,” “could,” “would,” “continue,” “likely,” “should,” and other words and terms of similar meaning in connection with any discussion of the timing or nature of future operating or financial performance or other events but not all forward- looking statements contain these identifying words. Risks, uncertainties and other factors may cause future results to differ materially from these forward-looking statements, and potentially adversely from the historical results contained herein. You are cautioned not to place undue reliance on the utility of the information in this presentation as a predictor of future performance of the Company, as projected financial and other information are based on estimates and assumptions that are inherently subject to various significant risks, uncertainties and other factors, many of which are beyond the Company’s control. All information herein speaks only as of (1) the date hereof, in the case of information about the Company and (2) the date of such information, in the case of information from persons other than the Company. The Company does not undertake any duty to update or revise the information contained herein, publicly or otherwise. The Company has not independently verified any third party information and makes no representation as to the accuracy or completeness of any such information. 2Disclaimer By accepting this presentation, recipients acknowledge that they have read, understood and accepted the terms of this disclaimer. This presentation is being provided for informational purposes only and is intended solely to facilitate a discussion with the recipient. No representation or warranty, express or implied, is or will be given by Superior Energy Services, Inc. and its subsidiaries (collectively, the “Company”) or its affiliates, directors, officers, partners, employees, agents or advisers or any other person as to the accuracy, completeness, reasonableness or fairness of any information contained in this presentation and no responsibility or liability whatsoever is accepted for the accuracy or sufficiency thereof or for any errors, omissions or misstatements, negligent or otherwise, relating thereto. No information included in this presentation constitutes, nor can it be relied upon as, legal, tax, investment or other advice. Recipients should consult their independent advisors. This presentation should not be relied upon for the purpose of evaluating the performance of the Company or for any other purpose, and neither the Company nor any of its affiliates, directors, officers, partners, employees, agents or advisers nor any other person, shall be liable for any direct, indirect or consequential liability, loss or damages suffered by any person as a result of this presentation or their reliance on any statement, estimate, target, projection or forward-looking information in or omission from this presentation and any such liability is expressly disclaimed. In all cases, interested parties should conduct their own investigation and analysis of the Company and the information contained herein. This presentation should not be considered as a recommendation by the Company or any affiliate or other person in relation to the Company or any of its subsidiaries, nor does it constitute an offer to sell or a solicitation for an offer to buy the securities, assets or business of the Company, nor shall there be any sale of securities in any state or jurisdiction in which such offer, solicitation or sale would be unlawful prior to registration or qualification under the securities laws of any such state or jurisdiction or pursuant to an exemption therefrom. This presentation shall not form the basis of any contract. Any references to any future or proposed transaction are for illustrative purposes only and the terms of any such transaction should it occur may be materially different than the terms in this presentation. This presentation contains forward-looking statements that are subject to risks, uncertainties and other factors. All statements other than statements of historical fact or relating to present facts or current conditions included in this presentation are forward-looking statements. Forward-looking statements give the Company’s current expectations and projections relating to the Company’s financial condition, results of operations, plans, objectives, future performance and business. You can identify forward-looking statements by the fact that they do not relate strictly to historical or current facts. These statements may include words such as “anticipate,” “estimate,” “expect,” “project,” “seek,” “plan,” “intend,” “believe,” “contemplate,” “assume,” “will,” “may,” “could,” “would,” “continue,” “likely,” “should,” and other words and terms of similar meaning in connection with any discussion of the timing or nature of future operating or financial performance or other events but not all forward- looking statements contain these identifying words. Risks, uncertainties and other factors may cause future results to differ materially from these forward-looking statements, and potentially adversely from the historical results contained herein. You are cautioned not to place undue reliance on the utility of the information in this presentation as a predictor of future performance of the Company, as projected financial and other information are based on estimates and assumptions that are inherently subject to various significant risks, uncertainties and other factors, many of which are beyond the Company’s control. All information herein speaks only as of (1) the date hereof, in the case of information about the Company and (2) the date of such information, in the case of information from persons other than the Company. The Company does not undertake any duty to update or revise the information contained herein, publicly or otherwise. The Company has not independently verified any third party information and makes no representation as to the accuracy or completeness of any such information. 2

RemainCoRemainCo

Global Leader in Market Leading Franchises Brands Segment Value-added engineering services and high- specification premium downhole tubular and DPS accessory rentals Design, engineering, manufacturing and rental of DPS premium bottom hole assemblies PS Hydraulic workover and snubbing services Engineering, risk management, well control and TS training solutions Design, engineering and manufacturing of TS premium sand control tools 4Global Leader in Market Leading Franchises Brands Segment Value-added engineering services and high- specification premium downhole tubular and DPS accessory rentals Design, engineering, manufacturing and rental of DPS premium bottom hole assemblies PS Hydraulic workover and snubbing services Engineering, risk management, well control and TS training solutions Design, engineering and manufacturing of TS premium sand control tools 4

RemainCo Assumptions ($ mm) Rystad Rig Count 2019 2020 Y-o-Y % 2021 Y-o-Y % 2022 Y-o-Y % 2023 Y-o-Y % Region Rig Count Rig Count Change Rig Count Change Rig Count Change Rig Count Change Avg. Rig Count: U.S. Land 9 04 3 92 (57%) 3 35 (15%) 4 36 30% 5 36 23% U.S. Offshore 73 4 2 (42%) 4 3 2% 6 4 49% 6 2 (3%) Total Rig Count 9 77 4 34 (56%) 3 78 (13%) 5 00 32% 5 98 20% Rystad E&P CapEx 2019 2020 Y-o-Y % 2021 Y-o-Y % 2022 Y-o-Y % 2023 Y-o-Y % Region CAPEX CAPEX Change CAPEX Change CAPEX Change CAPEX Change Rystad CAPEX: U.S. Land $ 33,920 $ 22,119 (35%) $ 22,652 2% $ 27,771 23% $ 32,321 16% U.S. Offshore 7 ,948 7,762 (2%) 6,226 (20%) 6,437 3% 6,468 0% AFRICA 5 ,796 4,318 (25%) 4,062 (6%) 4,546 12% 5,701 25% APAC 22,214 16,735 (25%) 16,759 0% 18,359 10% 19,529 6% CANADA 1 19 1 75 47% 1 22 (30%) 1 11 (9%) 1 21 8% Europe 18,061 14,281 (21%) 13,858 (3%) 16,064 16% 18,088 13% LATAM 11,628 8,964 (23%) 9,746 9% 11,154 14% 12,748 14% MENA 22,616 17,688 (22%) 18,573 5% 20,804 12% 22,066 6% International 80,435 62,161 (23%) 63,120 2% 71,037 13% 78,253 10% Segments Impacting RemainCo $ 122,303 $ 92,042 (25%) $ 91,998 (0%) $ 105,245 14% $ 117,043 11% 5 Source: Rystad forecastsRemainCo Assumptions ($ mm) Rystad Rig Count 2019 2020 Y-o-Y % 2021 Y-o-Y % 2022 Y-o-Y % 2023 Y-o-Y % Region Rig Count Rig Count Change Rig Count Change Rig Count Change Rig Count Change Avg. Rig Count: U.S. Land 9 04 3 92 (57%) 3 35 (15%) 4 36 30% 5 36 23% U.S. Offshore 73 4 2 (42%) 4 3 2% 6 4 49% 6 2 (3%) Total Rig Count 9 77 4 34 (56%) 3 78 (13%) 5 00 32% 5 98 20% Rystad E&P CapEx 2019 2020 Y-o-Y % 2021 Y-o-Y % 2022 Y-o-Y % 2023 Y-o-Y % Region CAPEX CAPEX Change CAPEX Change CAPEX Change CAPEX Change Rystad CAPEX: U.S. Land $ 33,920 $ 22,119 (35%) $ 22,652 2% $ 27,771 23% $ 32,321 16% U.S. Offshore 7 ,948 7,762 (2%) 6,226 (20%) 6,437 3% 6,468 0% AFRICA 5 ,796 4,318 (25%) 4,062 (6%) 4,546 12% 5,701 25% APAC 22,214 16,735 (25%) 16,759 0% 18,359 10% 19,529 6% CANADA 1 19 1 75 47% 1 22 (30%) 1 11 (9%) 1 21 8% Europe 18,061 14,281 (21%) 13,858 (3%) 16,064 16% 18,088 13% LATAM 11,628 8,964 (23%) 9,746 9% 11,154 14% 12,748 14% MENA 22,616 17,688 (22%) 18,573 5% 20,804 12% 22,066 6% International 80,435 62,161 (23%) 63,120 2% 71,037 13% 78,253 10% Segments Impacting RemainCo $ 122,303 $ 92,042 (25%) $ 91,998 (0%) $ 105,245 14% $ 117,043 11% 5 Source: Rystad forecasts

RemainCo Financial Projections ($ mm) 1 2020 2021 2019 2020 2021 2022 2023 Q1 Q2 Q3 Q4 Q1 Q2 Q3 Q4 FY FY FY FY FY Revenue $204.0 $136.7 $115.4 $119.0 $123.8 $128.7 $144.0 $157.6 $783.5 $575.1 $554.1 $649.7 $766.6 (-) COGS (114.8) (80.4) (71.6) (79.5) (75.4) (77.2) (82.3) (87.4) (431.8) (346.3) (322.3) (365.1) (428.6) (+) Severance and restructuring 4.5 2.3 - 6.2 - - - - - 13.0 - - - $93.7 $58.6 $43.8 $45.7 $48.4 $51.5 $61.7 $70.2 $351.6 $241.8 $231.8 $284.6 $338.1 Gross Margin (-) G&A - Corporate (16.0) (19.2) (9.9) (10.3) (11.0) (11.7) (11.5) (12.7) (58.9) (55.4) (46.9) (54.3) (54.3) (-) G&A - Field (31.9) (23.8) (22.7) (23.0) (23.7) (23.8) (23.7) (23.0) (124.9) (101.5) (94.2) (90.8) (96.7) (+) Severance and restructuring 0.5 0.8 - - - - - - - 1.3 - - - (+) Forbes transaction fees 4.3 8.6 - - - - - - - 12.9 - - - $50.6 $24.9 $11.2 $12.4 $13.7 $16.0 $26.5 $34.5 $167.8 $99.1 $90.7 $139.5 $187.1 Adj. EBITDA (+) Stock Based Compensation 2.3 2.5 2.7 2.5 2.5 2.5 2.5 2.5 13.3 10.0 10.0 13.3 14.2 (+/-) Change in receivables (1.5) 42.9 19.8 (2.2) (0.2) (7.3) (8.0) (9.3) (1.0) 59.0 (24.7) (14.3) (14.1) (+/-) Change in invt, prepaid, and other 3.7 (2.9) 3.5 11.7 10.4 0.6 (2.0) (2.7) (19.1) 16.0 6.2 (14.7) (22.2) (+/-) Change in income tax receivables (29.2) (2.7) 30.5 - - - - - - (1.4) - - - (+/-) Change in payables (13.0) (2.2) (5.5) (3.6) 2.5 0.6 2.8 3.3 11.8 (24.4) 9.2 2.5 10.3 (+/-) Change in other working capital (6.0) (16.8) 0.6 (3.4) 0.7 0.8 1.3 1.7 31.9 (25.6) 4.5 2.4 2.4 (-) Capex (16.5) (11.9) (7.9) (4.6) (11.4) (11.4) (11.4) (11.4) (91.2) (40.9) (45.6) (60.0) (85.0) Unlevered Free Cash Flow ($9.6) $33.8 $55.0 $12.8 $18.2 $1.9 $11.7 $18.6 $113.6 $91.9 $50.3 $68.9 $92.7 (-) Cash interest, fees (28.4) (21.5) (20.1) (0.6) (0.6) (0.6) (0.6) (0.6) (99.6) (70.6) (2.2) (2.2) (2.2) (+/-) Other cash items 17.6 13.9 (78.2) (135.6) - - - - 100.6 (182.3) - - - ($20.4) $26.2 ($43.3) ($123.4) $17.6 $1.3 $11.1 $18.1 $114.6 ($160.9) $48.1 $66.6 $90.4 Net Change in Cash 2 Memo: Unrestricted Cash $111.7 $159.8 $226.4 $316.9 As of 3/31/20 RemainCo NAM Total A/R $216 $95 $311 LTM Revenue $811 $537 $1,348 NWC + PPE $402 Est. Restructuring Costs SplitCo Total Advisor and UST Fees 50.9 Delayed Draw TL Commitment Fee 12.0 Other Restructuring Costs 21.2 3 Note: 1. 2019 cash figures and expenses include SG&A allocation of corporate overhead and Total Restructuring Costs 84.1 other items per the NAM carveout audited financials. 2. Pro forma assumes zero debt / interest. Includes estimated transaction fees. 3. Restructuring costs estimate excludes RSA Premium and fees on exit financing / ABL 6RemainCo Financial Projections ($ mm) 1 2020 2021 2019 2020 2021 2022 2023 Q1 Q2 Q3 Q4 Q1 Q2 Q3 Q4 FY FY FY FY FY Revenue $204.0 $136.7 $115.4 $119.0 $123.8 $128.7 $144.0 $157.6 $783.5 $575.1 $554.1 $649.7 $766.6 (-) COGS (114.8) (80.4) (71.6) (79.5) (75.4) (77.2) (82.3) (87.4) (431.8) (346.3) (322.3) (365.1) (428.6) (+) Severance and restructuring 4.5 2.3 - 6.2 - - - - - 13.0 - - - $93.7 $58.6 $43.8 $45.7 $48.4 $51.5 $61.7 $70.2 $351.6 $241.8 $231.8 $284.6 $338.1 Gross Margin (-) G&A - Corporate (16.0) (19.2) (9.9) (10.3) (11.0) (11.7) (11.5) (12.7) (58.9) (55.4) (46.9) (54.3) (54.3) (-) G&A - Field (31.9) (23.8) (22.7) (23.0) (23.7) (23.8) (23.7) (23.0) (124.9) (101.5) (94.2) (90.8) (96.7) (+) Severance and restructuring 0.5 0.8 - - - - - - - 1.3 - - - (+) Forbes transaction fees 4.3 8.6 - - - - - - - 12.9 - - - $50.6 $24.9 $11.2 $12.4 $13.7 $16.0 $26.5 $34.5 $167.8 $99.1 $90.7 $139.5 $187.1 Adj. EBITDA (+) Stock Based Compensation 2.3 2.5 2.7 2.5 2.5 2.5 2.5 2.5 13.3 10.0 10.0 13.3 14.2 (+/-) Change in receivables (1.5) 42.9 19.8 (2.2) (0.2) (7.3) (8.0) (9.3) (1.0) 59.0 (24.7) (14.3) (14.1) (+/-) Change in invt, prepaid, and other 3.7 (2.9) 3.5 11.7 10.4 0.6 (2.0) (2.7) (19.1) 16.0 6.2 (14.7) (22.2) (+/-) Change in income tax receivables (29.2) (2.7) 30.5 - - - - - - (1.4) - - - (+/-) Change in payables (13.0) (2.2) (5.5) (3.6) 2.5 0.6 2.8 3.3 11.8 (24.4) 9.2 2.5 10.3 (+/-) Change in other working capital (6.0) (16.8) 0.6 (3.4) 0.7 0.8 1.3 1.7 31.9 (25.6) 4.5 2.4 2.4 (-) Capex (16.5) (11.9) (7.9) (4.6) (11.4) (11.4) (11.4) (11.4) (91.2) (40.9) (45.6) (60.0) (85.0) Unlevered Free Cash Flow ($9.6) $33.8 $55.0 $12.8 $18.2 $1.9 $11.7 $18.6 $113.6 $91.9 $50.3 $68.9 $92.7 (-) Cash interest, fees (28.4) (21.5) (20.1) (0.6) (0.6) (0.6) (0.6) (0.6) (99.6) (70.6) (2.2) (2.2) (2.2) (+/-) Other cash items 17.6 13.9 (78.2) (135.6) - - - - 100.6 (182.3) - - - ($20.4) $26.2 ($43.3) ($123.4) $17.6 $1.3 $11.1 $18.1 $114.6 ($160.9) $48.1 $66.6 $90.4 Net Change in Cash 2 Memo: Unrestricted Cash $111.7 $159.8 $226.4 $316.9 As of 3/31/20 RemainCo NAM Total A/R $216 $95 $311 LTM Revenue $811 $537 $1,348 NWC + PPE $402 Est. Restructuring Costs SplitCo Total Advisor and UST Fees 50.9 Delayed Draw TL Commitment Fee 12.0 Other Restructuring Costs 21.2 3 Note: 1. 2019 cash figures and expenses include SG&A allocation of corporate overhead and Total Restructuring Costs 84.1 other items per the NAM carveout audited financials. 2. Pro forma assumes zero debt / interest. Includes estimated transaction fees. 3. Restructuring costs estimate excludes RSA Premium and fees on exit financing / ABL 6

Liquidity Update ($ in thousands) August 31, 2020 Total Cash (Incl. Restricted Cash) 336,896 Borrowing Base 102,272 Bullwinkle Restricted Cash (2,773) RLI Cash Collateral (46,000) JPM Cash Collateral (25,000) 1 State of Texas Cash Collateral (7,100) 2 Letters of credit outstanding (62,325) ABL Availability Blocker (37,500) Liquidity $258,470 Note: $35 million project LC’s concentrated in Middle East and Asia Pacific, of which $33 million concentrated in 5 customers. $46 million net surety bond exposure. 1. The majority of the $7.1 million State of Texas cash collateral relates to the NAM business 7 2. Since 8/31, LC balance has been reduced by approximately $14 millionLiquidity Update ($ in thousands) August 31, 2020 Total Cash (Incl. Restricted Cash) 336,896 Borrowing Base 102,272 Bullwinkle Restricted Cash (2,773) RLI Cash Collateral (46,000) JPM Cash Collateral (25,000) 1 State of Texas Cash Collateral (7,100) 2 Letters of credit outstanding (62,325) ABL Availability Blocker (37,500) Liquidity $258,470 Note: $35 million project LC’s concentrated in Middle East and Asia Pacific, of which $33 million concentrated in 5 customers. $46 million net surety bond exposure. 1. The majority of the $7.1 million State of Texas cash collateral relates to the NAM business 7 2. Since 8/31, LC balance has been reduced by approximately $14 million

NAM NAMNAM NAM

Robust Service Offerings and Key Brands Service Rigs Coiled Tubing Wireline • Well services, snubbing, • Nitrogen, pumping • Perforating, pipe swabbing, slickline and plug drill-out recovery, fishing and services and P&A services wireline logging services Fluid Management Rentals • Water transfer, disposal • Flowback, accommodations, and specialty services BOP’s and numerous other rentals 9Robust Service Offerings and Key Brands Service Rigs Coiled Tubing Wireline • Well services, snubbing, • Nitrogen, pumping • Perforating, pipe swabbing, slickline and plug drill-out recovery, fishing and services and P&A services wireline logging services Fluid Management Rentals • Water transfer, disposal • Flowback, accommodations, and specialty services BOP’s and numerous other rentals 9

NAM Financial Projections ($ mm) 1 2 2020 2021 2019 2020 2021 2022 2023 Q1 Q2 Q3 Q4 Q1 Q2 Q3 Q4 FY FY FY FY FY Rig Count 235 250 295 320 3 20 460 619 Oil Price $45 mid-yr $55 mid-yr $55 Revenue 117.7 47.2 45.9 47.7 50.0 55.0 74.0 81.0 575.8 258.5 260.0 375.0 500.0 (-) COGS (96.9) (48.4) (39.2) (39.6) (40.0) (44.0) (58.0) (62.5) (438.9) (224.1) (204.5) (285.0) (365.0) (+) Severance and restructuring 0 .9 5.4 0.1 - - - - - 1 .8 6 .5 - - - 21.7 4.1 6.9 8.1 10.0 11.0 16.0 18.5 138.7 40.9 55.5 90.0 135.0 Gross Margin (-) G&A - Corporate ( 7.5) ( 8.8) ( 8.8) ( 8.0) ( 8.0) ( 7.5) ( 7.0) ( 7.0) (34.3) (33.0) (29.5) (24.0) (24.0) (-) G&A - Field ( 9.8) ( 7.9) ( 7.1) ( 6.5) ( 6.1) ( 6.1) ( 6.1) ( 6.1) (41.7) (31.2) (24.5) (27.0) (29.0) (+) Severance and restructuring 0 .1 0.5 0.9 - - - - - 1 .6 1 .5 - - - Adj. EBITDA 4.6 (11.9) ( 8.2) ( 6.4) ( 4.1) ( 2.6) 2.9 5.4 64.3 (21.9) 1.6 39.0 82.0 (+) Stock Based Compensation 1 .2 1.2 1.2 2.3 2.3 2.3 2.3 2.3 6 .5 6 .0 9.0 5.0 5 .0 (-) Cash severance and restructuring ( 1.1) ( 6.0) ( 1.0) - - - - - (3.4) (8.0) - - - (+/-) Change in receivables ( 1.4) 48.6 1.6 0.9 ( 0.3) ( 3.9) (12.0) ( 5.7) 46.4 49.7 (22.0) (6.5) (23.4) (+/-) Change in prepaid and other ( 1.6) 3.9 - - - - - - (1.5) 2 .3 - - - (+/-) Change in payables ( 4.7) ( 6.4) ( 1.2) 0.1 0.2 0.6 2.2 0.8 2 .6 (12.2) 3.8 1.6 3 .2 (+/-) Change in Other Working Capital ( 4.3) ( 7.7) - - ( 0.2) ( 0.1) 0.1 0.3 (1.5) (12.0) 0.1 2.0 4 .1 (+/-) Change in Disc. Operations ( 3.0) ( 3.6) - - - - - - - (6.6) - - - (+/-) Other 0 .5 1.3 - - - - - - (7.5) 1 .8 - - - (-) Gain on sale of assets ( 1.0) ( 1.7) - - - - - - (12.9) (2.7) - - - (-) Capex ( 2.0) ( 0.1) ( 0.2) ( 0.1) ( 1.0) ( 1.0) ( 1.0) ( 1.0) (12.4) (2.4) (4.0) (13.8) (23.0) Unlevered Free Cash Flow (12.7) 17.7 ( 7.8) ( 3.3) ( 3.2) ( 4.8) ( 5.5) 1.9 80.7 (6.0) (11.6) 27.3 47.9 (+) Asset Sales 9 .0 4.6 0.6 3.7 4.5 3.5 3.5 3.5 19.1 18.0 15.0 10.0 10.0 Net Change in Cash ( 3.7) 22.4 ( 7.2) 0.4 1.4 ( 1.3) ( 2.0) 5.4 99.8 11.9 3.4 37.3 57.9 Memo: Cash 60.4 63.8 101.1 159.0 1 Memo: Illustrative Borrowing Base 30.0 30.0 30.0 Memo: Est. NAM Tax Basis 1,300.0 As of 3/31/20 RemainCo NAM Total A/R $216 $95 $311 Source: Superior Energy management. LTM Revenue $811 $537 $1,348 Note: Assumes $60 million cash from Superior Energy and $35 million in LCs NWC + PPE $402 in October 2020. 1. Potential ABL commitment of ~$30 million in 2021 10NAM Financial Projections ($ mm) 1 2 2020 2021 2019 2020 2021 2022 2023 Q1 Q2 Q3 Q4 Q1 Q2 Q3 Q4 FY FY FY FY FY Rig Count 235 250 295 320 3 20 460 619 Oil Price $45 mid-yr $55 mid-yr $55 Revenue 117.7 47.2 45.9 47.7 50.0 55.0 74.0 81.0 575.8 258.5 260.0 375.0 500.0 (-) COGS (96.9) (48.4) (39.2) (39.6) (40.0) (44.0) (58.0) (62.5) (438.9) (224.1) (204.5) (285.0) (365.0) (+) Severance and restructuring 0 .9 5.4 0.1 - - - - - 1 .8 6 .5 - - - 21.7 4.1 6.9 8.1 10.0 11.0 16.0 18.5 138.7 40.9 55.5 90.0 135.0 Gross Margin (-) G&A - Corporate ( 7.5) ( 8.8) ( 8.8) ( 8.0) ( 8.0) ( 7.5) ( 7.0) ( 7.0) (34.3) (33.0) (29.5) (24.0) (24.0) (-) G&A - Field ( 9.8) ( 7.9) ( 7.1) ( 6.5) ( 6.1) ( 6.1) ( 6.1) ( 6.1) (41.7) (31.2) (24.5) (27.0) (29.0) (+) Severance and restructuring 0 .1 0.5 0.9 - - - - - 1 .6 1 .5 - - - Adj. EBITDA 4.6 (11.9) ( 8.2) ( 6.4) ( 4.1) ( 2.6) 2.9 5.4 64.3 (21.9) 1.6 39.0 82.0 (+) Stock Based Compensation 1 .2 1.2 1.2 2.3 2.3 2.3 2.3 2.3 6 .5 6 .0 9.0 5.0 5 .0 (-) Cash severance and restructuring ( 1.1) ( 6.0) ( 1.0) - - - - - (3.4) (8.0) - - - (+/-) Change in receivables ( 1.4) 48.6 1.6 0.9 ( 0.3) ( 3.9) (12.0) ( 5.7) 46.4 49.7 (22.0) (6.5) (23.4) (+/-) Change in prepaid and other ( 1.6) 3.9 - - - - - - (1.5) 2 .3 - - - (+/-) Change in payables ( 4.7) ( 6.4) ( 1.2) 0.1 0.2 0.6 2.2 0.8 2 .6 (12.2) 3.8 1.6 3 .2 (+/-) Change in Other Working Capital ( 4.3) ( 7.7) - - ( 0.2) ( 0.1) 0.1 0.3 (1.5) (12.0) 0.1 2.0 4 .1 (+/-) Change in Disc. Operations ( 3.0) ( 3.6) - - - - - - - (6.6) - - - (+/-) Other 0 .5 1.3 - - - - - - (7.5) 1 .8 - - - (-) Gain on sale of assets ( 1.0) ( 1.7) - - - - - - (12.9) (2.7) - - - (-) Capex ( 2.0) ( 0.1) ( 0.2) ( 0.1) ( 1.0) ( 1.0) ( 1.0) ( 1.0) (12.4) (2.4) (4.0) (13.8) (23.0) Unlevered Free Cash Flow (12.7) 17.7 ( 7.8) ( 3.3) ( 3.2) ( 4.8) ( 5.5) 1.9 80.7 (6.0) (11.6) 27.3 47.9 (+) Asset Sales 9 .0 4.6 0.6 3.7 4.5 3.5 3.5 3.5 19.1 18.0 15.0 10.0 10.0 Net Change in Cash ( 3.7) 22.4 ( 7.2) 0.4 1.4 ( 1.3) ( 2.0) 5.4 99.8 11.9 3.4 37.3 57.9 Memo: Cash 60.4 63.8 101.1 159.0 1 Memo: Illustrative Borrowing Base 30.0 30.0 30.0 Memo: Est. NAM Tax Basis 1,300.0 As of 3/31/20 RemainCo NAM Total A/R $216 $95 $311 Source: Superior Energy management. LTM Revenue $811 $537 $1,348 Note: Assumes $60 million cash from Superior Energy and $35 million in LCs NWC + PPE $402 in October 2020. 1. Potential ABL commitment of ~$30 million in 2021 10

NAM TotalCoNAM TotalCo

TotalCo Financial Projections ($ mm) 1 2021 2021 2022 2023 Q1 Q2 Q3 Q4 FY FY FY Revenue $170.5 $178.5 $205.6 $225.7 $780.4 $957.5 $1,141.6 (-) COGS (113.7) (117.8) (130.8) (140.4) (502.6) (606.8) (719.2) (+) Severance and restructuring - - - - - - - Gross Margin $56.8 $60.7 $74.9 $85.3 $277.7 $350.7 $422.5 (-) G&A - Corporate (16.8) (16.8) (15.7) (16.9) (66.2) (71.0) (71.0) (-) G&A - Field (29.8) (29.9) (29.8) (29.1) (118.5) (117.3) (124.3) (+) Severance and restructuring - - - - - - - (+) Forbes transaction fees - - - - - - - Adj. EBITDA $10.3 $14.1 $29.4 $39.3 $93.1 $162.5 $227.1 (+) Stock Based Compensation 2.9 2.9 2.9 2.9 11.7 15.0 15.8 (+/-) Change in receivables 9.8 (6.7) (16.2) (20.7) (33.8) (18.0) (28.1) (+/-) Change in invt, prepaid, and other 7.8 8.2 (4.0) (4.5) 7.5 (8.9) (12.8) (+/-) Change in payables 1.3 1.4 3.5 3.7 9.8 3.7 5.4 (+/-) Change in other working capital (1.8) 0.7 1.5 2.0 2.4 2.8 2.3 (-) Capex (12.0) (12.4) (11.9) (11.8) (48.1) (71.3) (102.3) Unlevered Free Cash Flow $18.4 $8.1 $5.2 $10.9 $42.5 $85.9 $107.4 (-) Cash interest, fees (0.6) (0.7) (0.7) (0.7) (2.6) (2.6) (2.6) (+) Asset sales 4.5 3.5 3.5 3.5 15.0 10.0 10.0 $22.3 $11.0 $8.0 $13.7 $54.9 $93.2 $114.7 Net Change in Cash 1 Memo: Unrestricted Cash $233.0 $326.3 $441.0 Est. Restructuring Costs No SplitCo Total Advisor and UST Fees 44.9 Delayed Draw TL Commitment Fee 12.0 Other Restructuring Costs 21.2 2 Note: 1. Pro forma assumes zero debt / interest. Includes estimated transaction fees. 2. Excludes Total Restructuring Costs 78.1 RSA Premium and fees on exit financing / ABL 12TotalCo Financial Projections ($ mm) 1 2021 2021 2022 2023 Q1 Q2 Q3 Q4 FY FY FY Revenue $170.5 $178.5 $205.6 $225.7 $780.4 $957.5 $1,141.6 (-) COGS (113.7) (117.8) (130.8) (140.4) (502.6) (606.8) (719.2) (+) Severance and restructuring - - - - - - - Gross Margin $56.8 $60.7 $74.9 $85.3 $277.7 $350.7 $422.5 (-) G&A - Corporate (16.8) (16.8) (15.7) (16.9) (66.2) (71.0) (71.0) (-) G&A - Field (29.8) (29.9) (29.8) (29.1) (118.5) (117.3) (124.3) (+) Severance and restructuring - - - - - - - (+) Forbes transaction fees - - - - - - - Adj. EBITDA $10.3 $14.1 $29.4 $39.3 $93.1 $162.5 $227.1 (+) Stock Based Compensation 2.9 2.9 2.9 2.9 11.7 15.0 15.8 (+/-) Change in receivables 9.8 (6.7) (16.2) (20.7) (33.8) (18.0) (28.1) (+/-) Change in invt, prepaid, and other 7.8 8.2 (4.0) (4.5) 7.5 (8.9) (12.8) (+/-) Change in payables 1.3 1.4 3.5 3.7 9.8 3.7 5.4 (+/-) Change in other working capital (1.8) 0.7 1.5 2.0 2.4 2.8 2.3 (-) Capex (12.0) (12.4) (11.9) (11.8) (48.1) (71.3) (102.3) Unlevered Free Cash Flow $18.4 $8.1 $5.2 $10.9 $42.5 $85.9 $107.4 (-) Cash interest, fees (0.6) (0.7) (0.7) (0.7) (2.6) (2.6) (2.6) (+) Asset sales 4.5 3.5 3.5 3.5 15.0 10.0 10.0 $22.3 $11.0 $8.0 $13.7 $54.9 $93.2 $114.7 Net Change in Cash 1 Memo: Unrestricted Cash $233.0 $326.3 $441.0 Est. Restructuring Costs No SplitCo Total Advisor and UST Fees 44.9 Delayed Draw TL Commitment Fee 12.0 Other Restructuring Costs 21.2 2 Note: 1. Pro forma assumes zero debt / interest. Includes estimated transaction fees. 2. Excludes Total Restructuring Costs 78.1 RSA Premium and fees on exit financing / ABL 12

TotalCo – NAM Segment ($ mm) 1 2021 2021 2022 2023 Q1 Q2 Q3 Q4 FY FY FY Revenue $46.7 $49.8 $61.6 $68.1 $226.3 $307.8 $375.0 (-) COGS (38.3) (40.6) (48.5) (53.0) (180.3) (241.6) (290.6) (+) Severance and restructuring - - - - - - - $8.5 $9.2 $13.2 $15.1 $45.9 $66.2 $84.4 Gross Margin (-) G&A - Corporate (5.8) (5.1) (4.2) (4.2) (19.3) (16.8) (16.8) (-) G&A - Field (6.1) (6.1) (6.1) (6.1) (24.3) (26.5) (27.6) (+) Severance and restructuring - - - - - - - (+) Forbes transaction fees - - - - - - - Adj. EBITDA ($3.4) ($1.9) $2.9 $4.8 $2.4 $22.9 $40.0 (-) Capex (0.6) (1.0) (0.5) (0.4) (2.5) (11.3) (17.3) (+) Asset sales 4.5 3.5 3.5 3.5 15.0 10.0 10.0 13TotalCo – NAM Segment ($ mm) 1 2021 2021 2022 2023 Q1 Q2 Q3 Q4 FY FY FY Revenue $46.7 $49.8 $61.6 $68.1 $226.3 $307.8 $375.0 (-) COGS (38.3) (40.6) (48.5) (53.0) (180.3) (241.6) (290.6) (+) Severance and restructuring - - - - - - - $8.5 $9.2 $13.2 $15.1 $45.9 $66.2 $84.4 Gross Margin (-) G&A - Corporate (5.8) (5.1) (4.2) (4.2) (19.3) (16.8) (16.8) (-) G&A - Field (6.1) (6.1) (6.1) (6.1) (24.3) (26.5) (27.6) (+) Severance and restructuring - - - - - - - (+) Forbes transaction fees - - - - - - - Adj. EBITDA ($3.4) ($1.9) $2.9 $4.8 $2.4 $22.9 $40.0 (-) Capex (0.6) (1.0) (0.5) (0.4) (2.5) (11.3) (17.3) (+) Asset sales 4.5 3.5 3.5 3.5 15.0 10.0 10.0 13
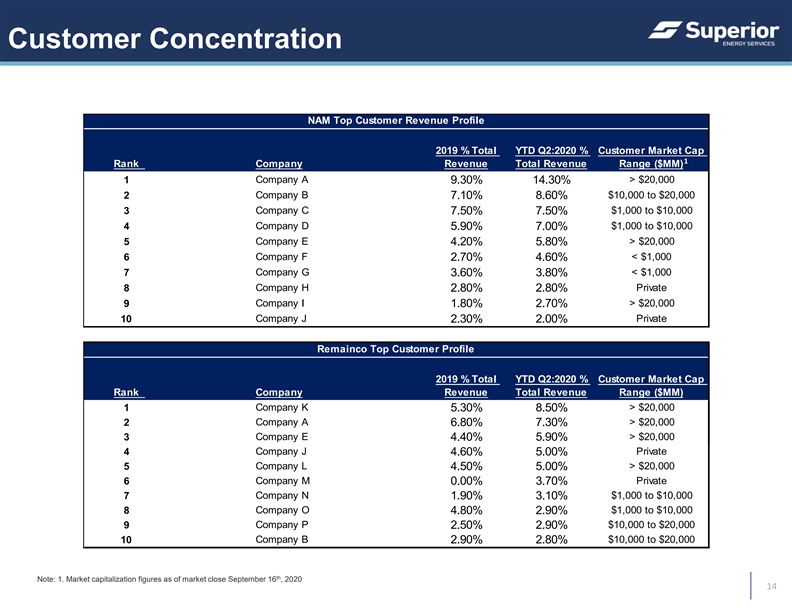
Customer Concentration NAM Top Customer Revenue Profile 1 2019 % Total YTD Q2:2020 % Customer Market Cap 1 Rank Company Revenue Total Revenue Range ($MM) 1 Company A > $20,000 9.30% 14.30% 2 Company B 7.10% 8.60% $10,000 to $20,000 3 Company C $1,000 to $10,000 7.50% 7.50% Company D $1,000 to $10,000 4 5.90% 7.00% 5 Company E 4.20% 5.80% > $20,000 Company F < $1,000 6 2.70% 4.60% 7 Company G 3.60% 3.80% < $1,000 Company H Private 8 2.80% 2.80% 9 Company I 1.80% 2.70% > $20,000 10 Company J Private 2.30% 2.00% Remainco Top Customer Profile 2019 % Total YTD Q2:2020 % Customer Market Cap Rank Company Revenue Total Revenue Range ($MM) 1 Company K > $20,000 5.30% 8.50% 2 Company A 6.80% 7.30% > $20,000 Company E > $20,000 3 4.40% 5.90% 4 Company J Private 4.60% 5.00% Company L > $20,000 5 4.50% 5.00% Company M Private 6 0.00% 3.70% 7 Company N 1.90% 3.10% $1,000 to $10,000 8 Company O 4.80% 2.90% $1,000 to $10,000 Company P $10,000 to $20,000 9 2.50% 2.90% 10 Company B $10,000 to $20,000 2.90% 2.80% th Note: 1. Market capitalization figures as of market close September 16 , 2020 14Customer Concentration NAM Top Customer Revenue Profile 1 2019 % Total YTD Q2:2020 % Customer Market Cap 1 Rank Company Revenue Total Revenue Range ($MM) 1 Company A > $20,000 9.30% 14.30% 2 Company B 7.10% 8.60% $10,000 to $20,000 3 Company C $1,000 to $10,000 7.50% 7.50% Company D $1,000 to $10,000 4 5.90% 7.00% 5 Company E 4.20% 5.80% > $20,000 Company F < $1,000 6 2.70% 4.60% 7 Company G 3.60% 3.80% < $1,000 Company H Private 8 2.80% 2.80% 9 Company I 1.80% 2.70% > $20,000 10 Company J Private 2.30% 2.00% Remainco Top Customer Profile 2019 % Total YTD Q2:2020 % Customer Market Cap Rank Company Revenue Total Revenue Range ($MM) 1 Company K > $20,000 5.30% 8.50% 2 Company A 6.80% 7.30% > $20,000 Company E > $20,000 3 4.40% 5.90% 4 Company J Private 4.60% 5.00% Company L > $20,000 5 4.50% 5.00% Company M Private 6 0.00% 3.70% 7 Company N 1.90% 3.10% $1,000 to $10,000 8 Company O 4.80% 2.90% $1,000 to $10,000 Company P $10,000 to $20,000 9 2.50% 2.90% 10 Company B $10,000 to $20,000 2.90% 2.80% th Note: 1. Market capitalization figures as of market close September 16 , 2020 14